Article

Demand-Response Application in Wastewater Treatment Plants Using Compressed Air Storage System: A Modelling Approach

Department Polytechnic of Engineering and Architecture (DPIA), University of Udine, Via delle Scienze 208, 33100 Udine, Italy
*
Author to whom correspondence should be addressed.
Energies 2020, 13(18), 4780; https://doi.org/10.3390/en13184780
Submission received: 22 July 2020 / Revised: 8 September 2020 / Accepted: 11 September 2020 / Published: 14 September 2020
(This article belongs to the Special Issue Energy-Water Nexus)

Abstract

:
Wastewater treatment plants (WWTPs) are known to be one of the most energy-intensive industrial sectors. In this work, demand response was applied to the biological phase of wastewater treatment to reduce plant electricity cost, considering that the daily peak in flowrate typically coincides with the maximum electricity price. Compressed air storage system, composed of a compressor and an air storage tank, was proposed to allow energy cost reduction. A multi-objective modelling approach was applied by analyzing different scenarios (with and without anaerobic digestion, AD), considering both plant characteristics (in terms of treated flowrate and influent chemical oxygen demand, COD, concentration) and storage system properties (volume, air pressure), together with the current Italian market economic conditions. The results highlight that air tank volume has a strong positive influence on the obtainable economic savings, with a less significant impact held by air pressure, COD concentration and flowrate. In addition, biogas exploitation from AD led to an improvement in economic indices. The developed model is highly flexible and can be applied to different WWTPs and market conditions.

Graphical Abstract

1. Introduction

The energy-water nexus refers to all the processes representing linkages between the water system and the energy sector, including the trade-off of both resources [1]. The energy-water nexus has been given increasing interest worldwide in recent years, due to climate change, augmented global energy demand and significant water scarcity [2]. With the increasing renewable energy generation, the electricity supply becomes more and more variable, necessitating flexible energy demand sources, able to adapt to supply variability providing demand response (DR) [1]. DR has been defined as “changes in electric use by demand-side resources from their normal consumption patterns in response to changes in the price of electricity, or to incentive payments designed to induce lower electricity use at times of high wholesale market prices or when system reliability is jeopardized” [3].
Wastewater treatment is an energy-intensive sector and its energy demand is continuously augmenting due to the stringent requirements on treated water effluent quality, requiring advanced technologies for pollutant removal [4]. The energy consumption in wastewater treatment accounts for about 3.4% of the total electricity consumption in the United States, being the third largest electricity consumer [5]. Nowadays, the energy utilization and optimization in the wastewater treatment plant (WWTP) sector has become a growing concern, considering both the economic and environmental aspects [6]. WWTPs were generally not designed with energy efficiency as a main target. Furthermore, information about energy consumption and energy recovery in WWTPs is still unsatisfactory in the scientific literature [6].
Wastewater characterized by higher internal energy (in terms of influent chemical oxygen demand (COD) concentration and flow rate) leads to a more consistent energy consumption in the plant, together with an increased sludge production and an augmented bioreactor footprint [6]. Proven techniques that help to improve plant energy balance include anaerobic digestion (AD) [7,8], sludge incineration, photovoltaic generation and thermal energy recovery [6]. Energy recovery from wastewater treatment can help to reduce the overall economic costs and the related environmental impact [4], following sustainability and circular economy principles. Indeed, wastewater can contain up to 12 times the energy that is needed for its treatment. Following a paradigm change, wastewater can be seen no longer as a waste but as a resource, from which nutrients and valuable compounds can be recovered [9]. In addition, the energy surplus from wastewater treatment can be integrated into energy distribution systems, supplying external consumers [10].
DR was often modelled as a portion of the total system demand, that can be shifted from peak hours to off-peak hours [1]. In industrial process models, typically the energy prices are taken as an input and the DR potential is evaluated by comparing different electricity tariff schemes, adopting a model-based or data-driven approach [1]. The model-based approach involves the detailed description of the system performances, with thermodynamic and kinetic aspects [11]. However, considering that the resulting models often include a set of non-linear differential equations, the optimization models typically focus on process electricity demand, abstracted from the physical details. Considering WWTPs, wastewater flow-rate shows a daily pattern that coincides with the electricity demand pattern, having one peak in the late morning and another one in the early evening. Consequently, the electricity demand is high when the system demand is high. A treatment shift from peak to off-peak periods (for example from evening to night-time) could yield significant electricity expenditure savings [1].
The biological secondary treatment in WWTPs typically involves activated sludge (AS) technology, which is the most widely applied treatment worldwide to remove biodegradable carbon, suspended solids (SS) and nutrients from wastewater [12]. The available process models of the biological phase include the activated sludge model number 1 (ASM1), developed by International Water Association (IWA), which describes the biochemical processes within the aerated tank with 8 processes and 13 state variables [13]. Recent studies demonstrated that modelling diurnal energy prices variation by coupling the ASM1 model with an energy pricing and a power consumption model could enable the WWTP managing utility to reduce plant energy consumption [14]. However, as noted by some authors, a joint representation of the electricity system behavior and the wastewater treatment process in an integrated energy system has not been implemented at present. Nowadays, mathematical modelling and simulation tools are being increasingly applied to WWTP upgrading and optimization [15]: multi-objective optimization models, in particular, allow one to account for different objective functions, with the aim of optimizing design and operations of a selected process [16].
Wastewater treatment consumes 0.5–2 kWh electric energy per m3 of treated water, depending on the selected technologies and plant scheme [17]. The AS biological process is the highest electricity consumer in WWTPs (10.2–71% of total plant electricity consumption) [1], due to the need for continuously supplying oxygen to the basins, sustaining the aerobic degradation of the organic matter. In medium- and large-scale plants, AS systems account for 50–60% of the total electricity need, followed by the sludge treatment (15–25%) and recirculation pumping (15%) sections [18]. Research has actually focused on aeration optimization: the idea of increasing aeration efficiency by water looping through a piping, including a venturi aspirator, was recently proposed [19], achieving an aeration efficiency in the range of submerse aerators.
Interactive multi-objective optimization can support the designers when new WWTPs need to be built, but can also improve the performances of existing WWTPs, considering several conflicting criteria and parameters [20]. The multi-objective optimization was recently applied in a number of cases to the water and wastewater sector, with significant outcomes. A goal programming was proposed in [21] to optimize industrial water networks, by using a mixed-integer linear programming as a very reliable a priori method, considering several antagonist objective functions, such as freshwater flow-rate, number of connections, total energy consumption. A fuzzy goal programming was instead investigated in [22], in order to optimize wastewater treatment by considering different energy costs, pollutant load, influent and effluent concentrations: the proposed model was subsequently applied to a full-scale plant in Spain. A process simulator, modelling wastewater treatment, and an interactive multi-objective optimization software, were studied in [20] as a practically useful tool in plant design and improvement; successively, the simulator was applied to a municipal WWTP. The control strategy optimization proved to be effective also to reduce greenhouse gas (GHG) emissions from wastewater treatment in a cost-effective manner, considering also operational costs and effluent concentrations. It was highlighted, in particular, that a meaningful GHG emission reduction can be achieved without relevant plant modifications, even if this can lead to an increase in ammonia and total nitrogen (TN) concentrations in the treated effluent [23].
In this work, DR was applied to wastewater treatment, considering several alternative solutions to improve WWTP energy consumption, with a positive expected outcome on the plant economic balance. A multi-decisional modelling approach was employed to evaluate the technical and economic feasibility of the different analyzed scenarios. Following a preliminary study and considering the lack of existing literature, it was decided to focus on compressed air tank installation to reduce economic expenses for aeration. The tank is filled during low energy demand periods (off-peak), pre-compressing the air for utilization during higher demand (peak load) periods. Recently, compressed air energy systems (CAES) have gained attention, due to their great power range and high energy density, making them an available solution in those contexts where the traditional storage technologies, such as pumped hydroelectric energy storage (PHES), cannot be implemented.
Recent research aimed at improving CAES round-trip efficiency through isothermal processes [24]. In [25], a way to decrease the energy dependency in CAES was investigated, taking advantage of transient flow. Differently from typical utilization of CAES, that includes a power production regulation purpose, as proposed in [26], in the present study the exploitation of a compressed air storage (CAS) system as an oxygen buffer in the wastewater treatment process is investigated. Literature analysis showed a lack of studies on such a dual usage of a CAS system; moreover, the proposed approach helps WWTPs to move toward smart energy systems, increasing the number of outputs from a single source, as suggested by [27].
Considering this general framework, an effort towards a reduction in energy costs in WWTPs is needed. As far as is known by the authors, this is the first study proposing compressed air introduction in WWTPs following DR principles to diminish operating costs for aeration, leading to a significant economic saving in a simple and practical way. The results can be useful for WWTP managing authorities, as well as for researchers. Two main scenarios were investigated in this work. The first scenario will consider the impact of the simple introduction of CAS in the plant, while the second one will forecast the integration of the self-made electricity by the biogas (produced in the AD process) into the compressed air system. The second identified scenario, in accordance with [24], allows higher renewable energy use, contributing to the sustainability perspective. The operating parameters, including plant potentiality (in terms of treated flowrate), influent characteristics (COD concentration), compressed air tank pressure and volume, were considered to evaluate the technical and economic convenience of the proposed solution to reduce WWTP operating costs. The paper is structured as follows. In Section 2, a framework describing the interaction between treatments, costs, and variables is proposed and the related design optimization model is explained. Results are reported in Section 3 for the two investigated scenarios, while discussion follows in Section 4 and conclusions are drawn in Section 5.

2. Materials and Methods

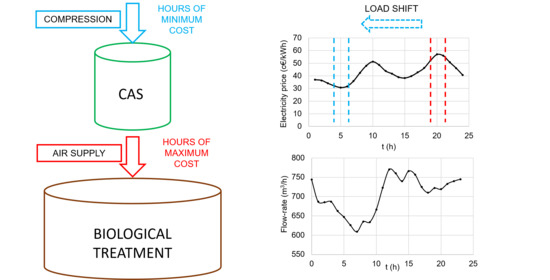
2.1. System Configuration

Based on a load shift approach, a DR and net zero energy (NZE)-oriented system was proposed for WWTPs. As previously introduced, the aeration during biological wastewater treatment accounts for more than 30% of the plant’s total energy consumption. Instead of shifting wastewater treatment to periods characterized by lower energy costs (leading to the need for large storage tanks or equalization basins, not always practically feasible) [1], the possibility of storing the air necessary for the biological treatment was considered. This solution (schematically represented in Figure 1) allows one to store energy in a compressed air tank during low energy cost (off-peak) periods, utilizing it when the cost increases (peak periods). Furthermore, the possibility to use the electricity from biogas (locally produced in AD process) by cogeneration was analyzed. This second scenario would allow one to cover a significant share of the process electrical load, while the heat production could be used to entirely cover plant heat demand.
As a first-approach study, the hypothesis of steady state process was made along the whole plant and throughout the different proposed scenarios.

2.2. Input Model Data

The daily pattern of wastewater flowrate was obtained from one-year hourly data of a medium-scale municipal WWTP (86,400 population equivalent (PE), Udine Province), highlighting two distinct peaks at 1 p.m. and 4 p.m. (Figure 2). The obtained data were consistent with the typical reported 24-h behavior of flowrate in municipal WWTPs [1].
The calculated WWTP peak factor (maximum flowrate in the 24 h period divided by mean daily flowrate) was around 1.1, showing a moderate daily variability. The flowrate daily pattern was assumed to be constant for all the analyzed plant potentialities and any seasonal factor was considered in this first approach. The electricity price pattern in the 24 h time period was calculated considering the mean values of a typical month in Italy [28]. The mean electricity price for industrial users was given by the Italian Authority for energy, gas, water and waste [29].

2.3. Biological Treatment Unit

The oxygen injected in the biological phase (O2,cons) was supposed to coincide with the oxygen consumed by biomass, estimated by considering a simplified approach (Equation (1)), as proposed in [30]. The operating parameters of the activated sludge process in Equation (1) were set as follows, considering typical full-scale plants in the analyzed territory, where a significant influent dilution is observed in sewers due to aquifer infiltration: mean influent COD concentration (CODin) = 250 mg/L, mean effluent COD concentration (CODout) = 50 mg/L (corresponding to 80% COD abatement), hydraulic retention time (HRT) = 7 h, solid retention time (SRT) = 15 d, biomass concentration in the biological basin (X) = 3.5 g volatile suspended solids (VSS)/L. The factor 1.42 represents COD conversion factor for biomass [30].
O 2 , c o n s = ( C O D i n C O D o u t ) H R T × X S R T × 1.42
From the calculated oxygen need and considering oxygen share in the air (20%), it was possible to determine the total injected air flowrate. To evaluate the energy consumption of the biological treatment, the specific operating capacity of oxygen diffusers (fine bubbles) was estimated as 1.2–1.5 kg O2/kWh (data given from specialized companies in the field). Finally, total plant energy consumption was calculated considering that the electricity consumption for oxygen insufflation is 30–70% of the total plant energy need, as emerged from relevant literature studies [18].

2.4. Compressed Air Storage

The basic idea on which the proposed approach is based is the shift of the peak aeration load to low energy cost periods, introducing a storage system able to sustain the aeration during peak energy cost periods. In order to evaluate the economic convenience of the proposed technology, the energy required to compress the air in the tank, Ecompr (kJ), is calculated as follows (Equation (2)):
E c o m p r = P s t o r a g e × V × l n P @ P s t o r a g e + ( P s t o r a g e P @ ) × V
where V represents the storage tank volume (m3), Pstorage is the pressure inside the tank (MPa), and P@ (MPa) is atmospheric pressure.

2.5. Anaerobic Digestion Unit

The sludge production ( m ˙ s l u d g e ) was calculated using Equation (3), considering full-scale WWTPs’ characteristics in the investigated area: a specific sludge production of 40 g suspended solids (SS)/m3 (psludge) was used for the successive calculations. Biogas yield from excess sludge (QCH4, (m3 CH4/h)) was obtained from Equation (4), considering typical specific methane production (YCH4, 250 NmL CH4/g VS) vs. the concentration of excess sludge (2.3% w/w) in medium-scale local WWTPs [31].
m ˙ s l u d g e = Q × p s l u d g e % V S × 10 6
Q C H 4 = m ˙ s l u d g e × % V S × Y C H 4
The mean electric and thermal efficiencies of the downstream combined heat and power (CHP) unit for biogas cogeneration were assumed respectively as 35% and 43%, consistently with relevant literature studies [32,33].
The heat demand of the anaerobic digester was considered as the sum of the heat losses through digester walls (Hloss, (W)) and the thermal energy needed for sludge heating (Hsludge, (kJ/h)), calculated using Equations (5) and (6), following the approach proposed in [34]:
H l o s s = k a i r A s u p ( t d i g t a i r ) + k s o i l A b a s e ( t d i g t s o i l )
H s l u d g e = m ˙ s l u d g e c p s l u d g e ( t d i g t s 0 )
The specific heat capacity of sludge (cps) was estimated as 3.62 kJ/kg °C [6], while air (tair) and soil (tsoil) temperature were obtained from regional climate data [35]. Air (kair) and soil (ksoil) heat transfer coefficients were taken from [34]. The digester operating temperature, tdig, was set at 35 °C (optimum mesophilic range [36]), while the mean influent sludge temperature, ts0, was supposed to be 15 °C, consistently with regional climate data [35]. The geometrical characteristics of the digester (base area, Abase, (m2), and lateral area, Asup, (m2)) were calculated considering the real characteristics of the analyzed full-scale reactor.

2.6. Economic Analysis

For the economic analysis, it is necessary to evaluate the capital cost of the introduced technology and the reduction in operating costs that can be achieved. The capital costs for compressed air storage installation were calculated using the data reported in [37]. A linear correlation between the installed compressor power (W) and the compressor cost (C), obtained through specialized surveys, was considered in this basic approach. Equations in the following form were obtained for both components (compressor and storage tank):
C i = W i × c i + q
The total investment cost (CTOT, (€)) is defined as the sum of the capital costs of the installed components. The revenues are defined as the avoided cost for energy purchase, that comes from the load shift due to the compressed air storage. The reduction in operating costs is consequently defined as the difference between the energy cost (purchased in the scenario without air storage) and the effective cost with storage implementation:
R o p e = C a v , C H P + C a v , t a n k + R T E E C c o m p r C O & M
In Equation (8), Cav,CHP (€/y) is the avoided cost through biogas utilization, Cav,tank (€/y) is the avoided cost through the air storage tank, Ccompr (€/y) is the cost to compress the air inside the tank, and CO&M (€/y) is the operation and maintenance system cost. RTEE (€/y) is the share of revenues coming from primary energy saving, due to biogas exploitation from AD. CHP-related variables are set to 0 in the scenario where AD is not considered (Scenario 1). An average economic value of current Italian White certificates, equal to 250 EUR/ton of oil equivalent (toe), has been considered in this basic economic analysis for biogas valorization.
The main economic parameter used for the analysis is the net present value (NPV, (EUR)) calculated with a discount rate of 5.5%.
Another parameter used is the pay-back time (PB, (y)) of the investment (Equation (9)), defined as the total investment cost divided by the revenues obtained from the reduced energy cost:
P B = C T O T R o p e

2.7. Optimization Model Implementation

The multi-objective optimization model was written in MATLAB® and successively implemented in mode FRONTIER® for scenario analysis. The selected parameters for the optimization process are summarized in Table 1. The range of modelled COD concentration was in line with the observed COD values in the analyzed territory, characterized by consistent wastewater dilution, due to mixed sewers and significant infiltrations from the aquifer. A wide range of treated flowrates was considered, to extend the validity of the obtained results to different scale WWTPs. The modelled flowrate range in WWTPs approximately corresponds to plant potentialities of 75,600–225,600 PE, consistent with most of medium scales WWTPs in Friuli-Venezia Giulia region (North-east of Italy). As for compressed air system characteristics, different combinations of pressure and volume were considered, to evaluate the influence of these parameters (both singularly and in combination) on the economic output.
Separate simulations were conducted for scenario 1 (CAS integration without AD) and scenario 2 (CAS integration with AD). The relevant output parameters that were considered in the analysis were common economic indexes (PB, net present value (NPV)) and, in the case of scenario 2, meaningful environmental aspects (primary energy saving, PES). Since the main goal of this research was the implementation of a new technology in a WWTP following the DR perspective, the multi-objective optimization functions have been selected among those most representative from a sustainable perspective (Table 2). For the assessment of the economic advantages obtained through this intervention, the NPV maximization objective has been chosen. Regarding the environmental impact, the most meaningful objective was PES maximization.
According to the stakeholders’ interests, a constraint of 10 years has been applied to the PB output value.

3. Results

As previously introduced, two main scenarios were investigated, the first one involving only introduction of the air storage unit, composed of an air compressor and a storage tank, to allow air accumulation during the off-peak periods and air utilization from the air tank during the peak periods for sustaining aeration in the biological basin. The second approach includes AD introduction, with electricity production in a CHP unit and integration of the produced electricity in the storage system to increase both total energy savings and the use of renewable energy sources. This solution is particularly indicated in medium and large-scale plants, where AD is typically already implemented.
The simulations were carried on as explained before using a 32 GB RAM, i7 4770 3.40 GHz PC. A population of 500 individuals and 250 generations was adopted, resulting in 125,000 total evaluated designs for both scenarios, sufficient to obtain the convergence of the process in about 2–3 h.

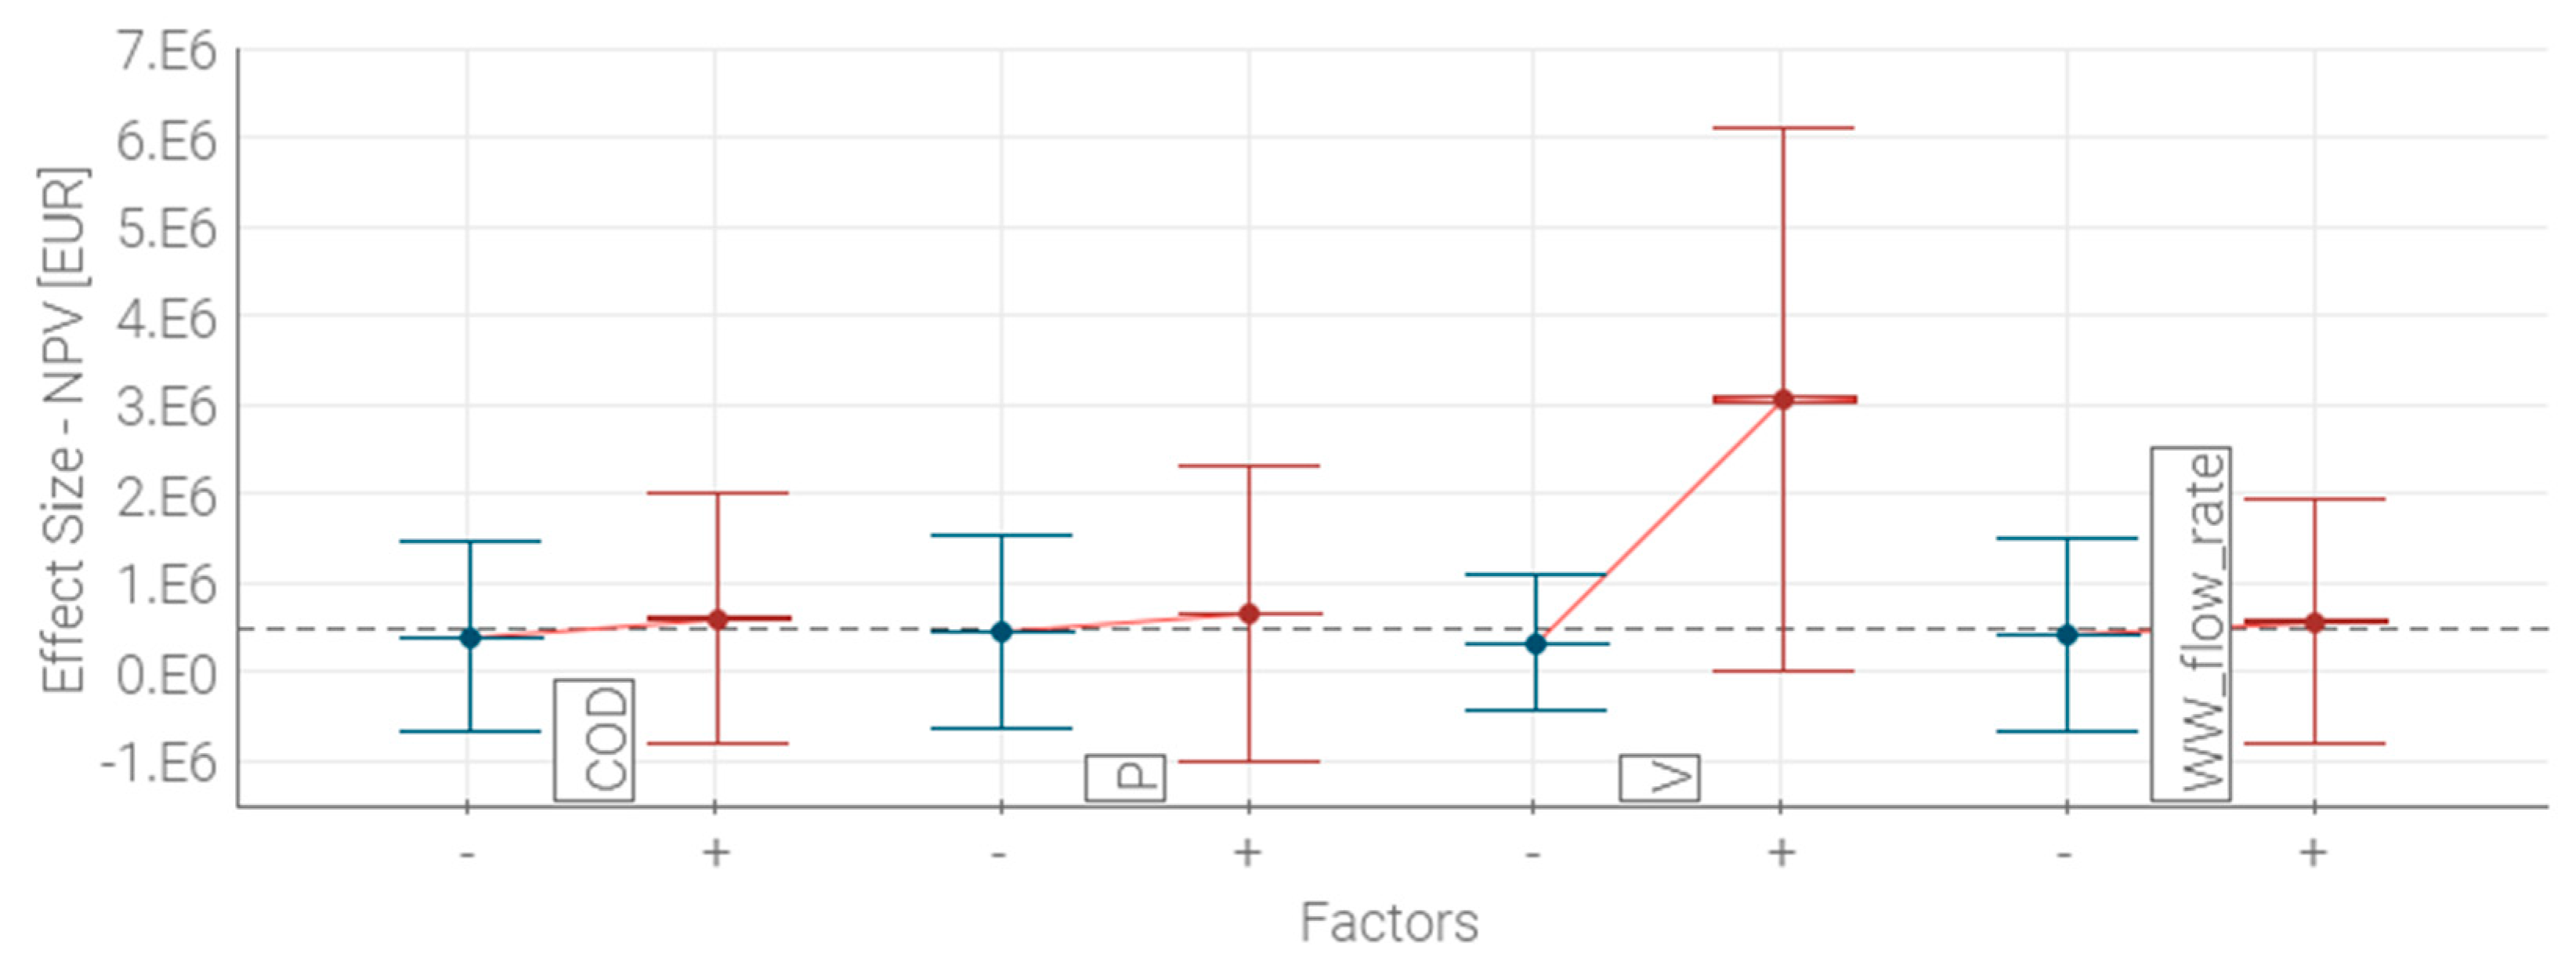
3.1. Scenario 1: Compressed Air Storage without Anaerobic Digestion

In Figure 3, the influence of the selected input parameters (Table 1) on the economic convenience of the proposed storage system is summarized. It can notice that air tank volume has a strong impact on NPV, with a significant increase in the economic income as the volume increases (up to 1000 m3). The air storage pressure is shown to have a limited influence on NPV, with a slight increase in the economic convenience as a higher air pressure is selected. As for wastewater characteristics, the influent COD concentration and the wastewater flowrate have a mild effect: a more polluted effluent (meaning a higher internal energy) and a higher plant potentiality are slightly favorable for storage tank installation. Moreover, a linear behavior was encountered by analyzing NPV variation with respect to the influent COD concentration, for the wide chosen range of wastewater flowrates. In the most favorable conditions, PB time was lower than 1 y for Scenario 1, highlighting a significant convenience of air storage system installation, given the actual market economic conditions and the investigated plant characteristics.
The detailed analysis of NPV variation with respect to air storage pressure, reported in Figure 4, interestingly highlights that NPV increases to a maximum at an intermediate pressure value, while a decrease is observed for a further pressure augmentation (in particular considering larger tank volumes); this is due to the fact that for a higher vessel pressure, the specific compression power increases, leading to higher compression costs.

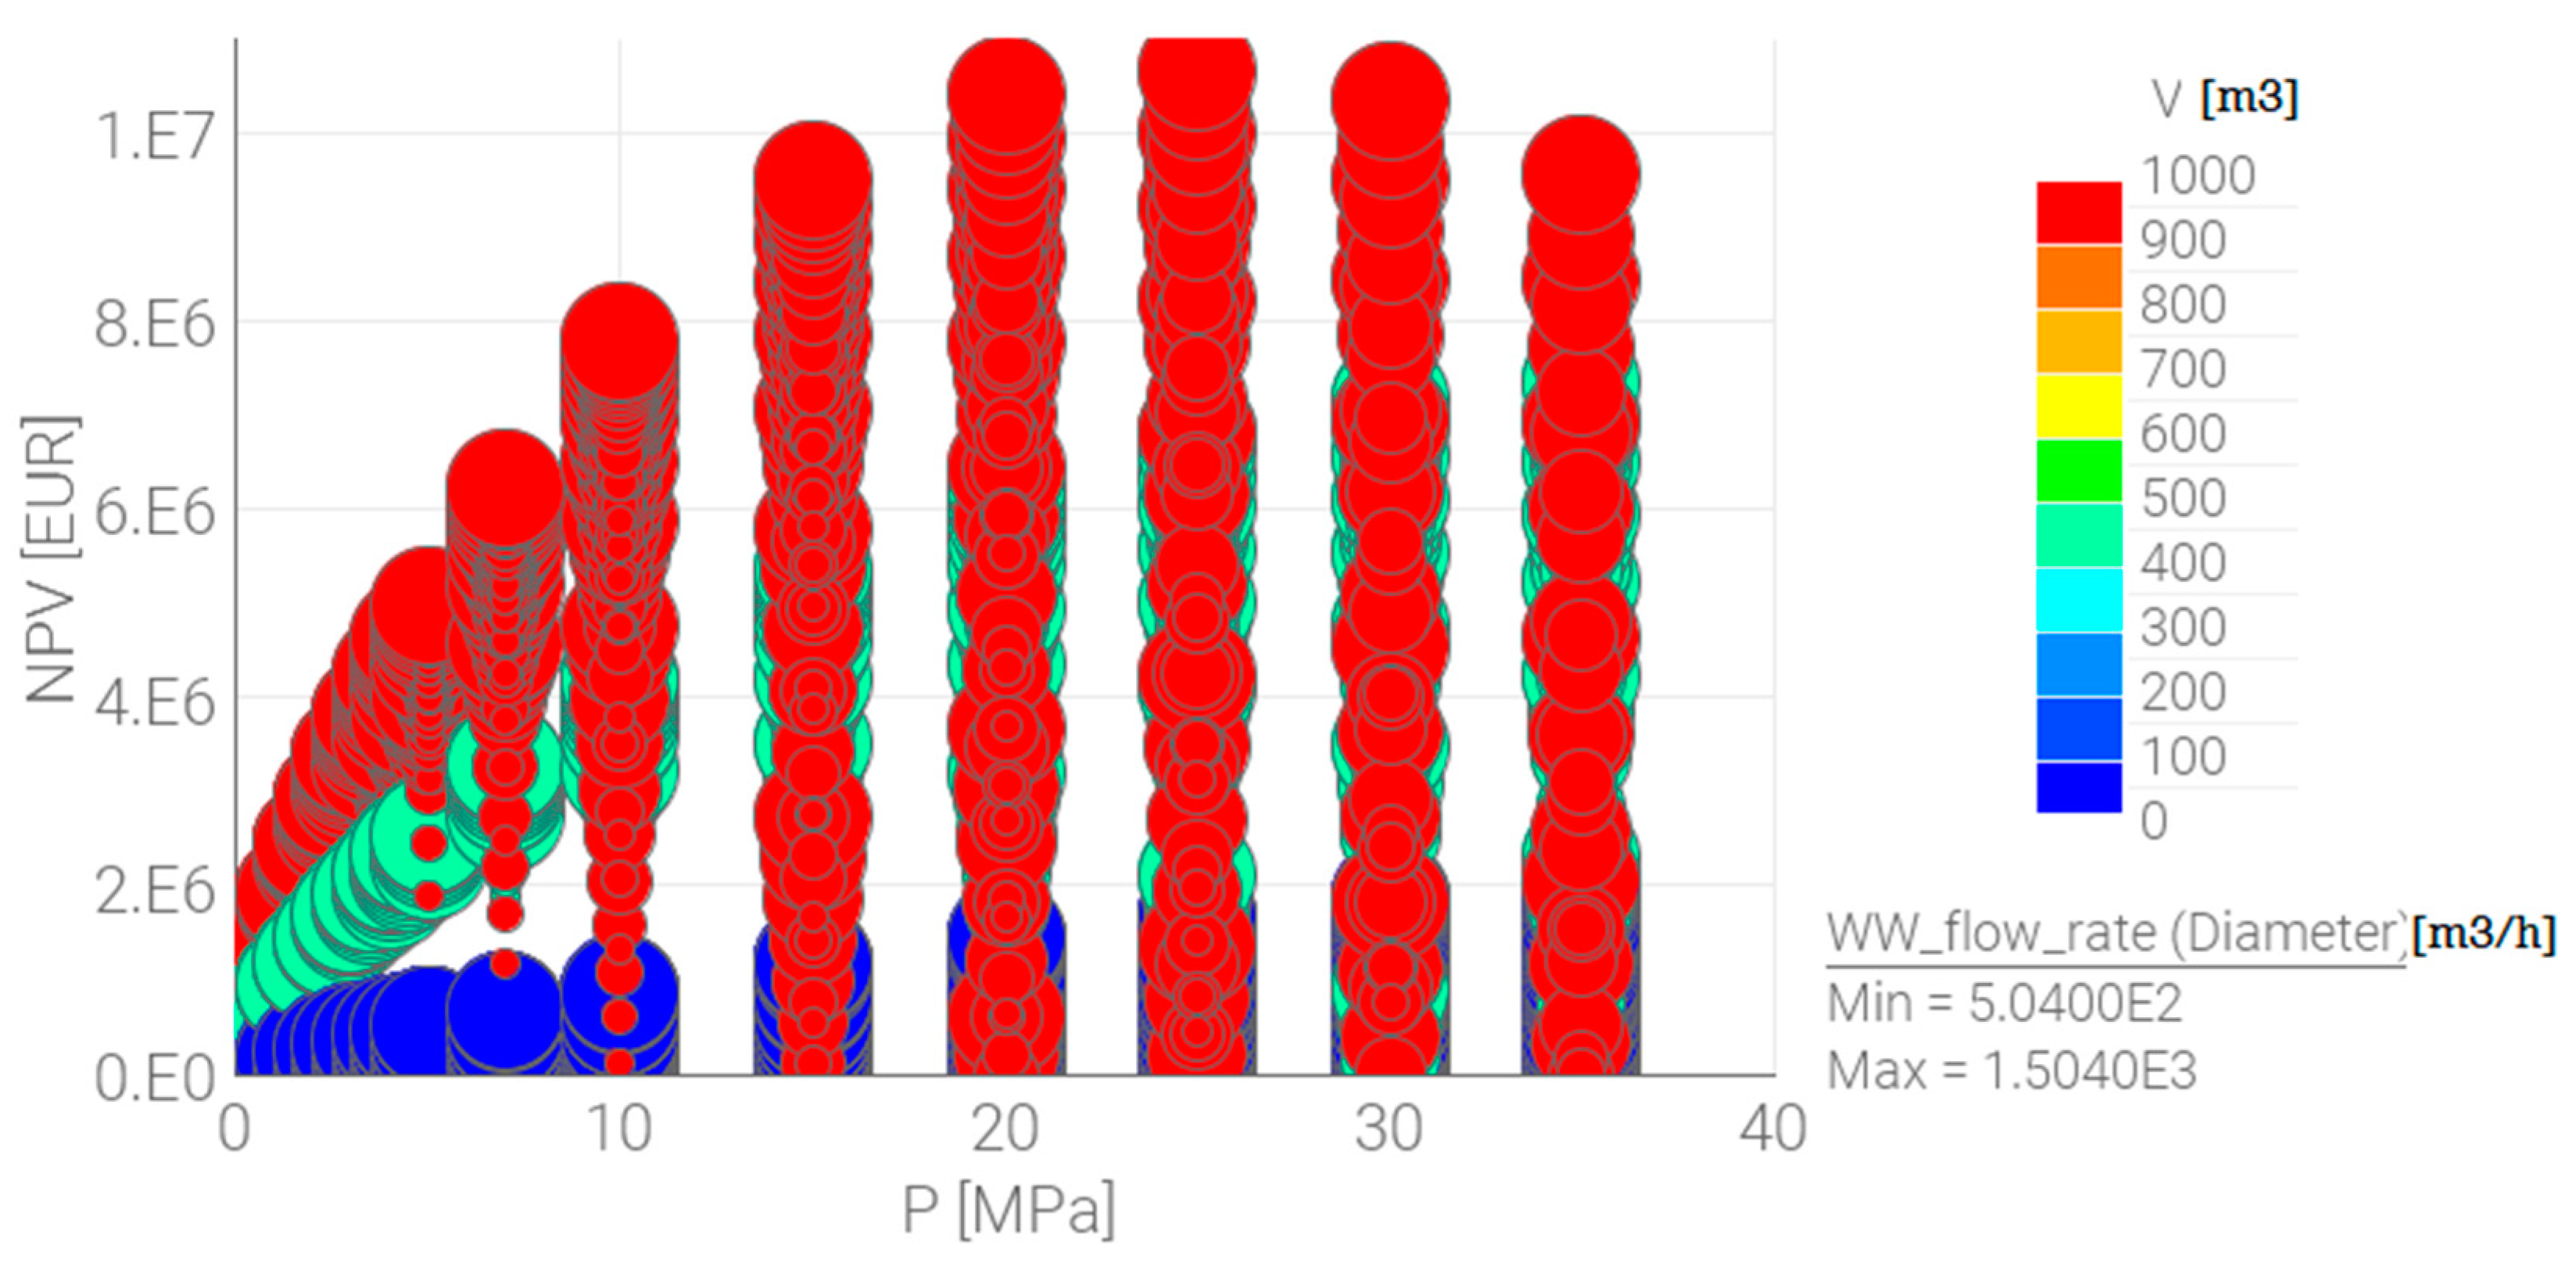
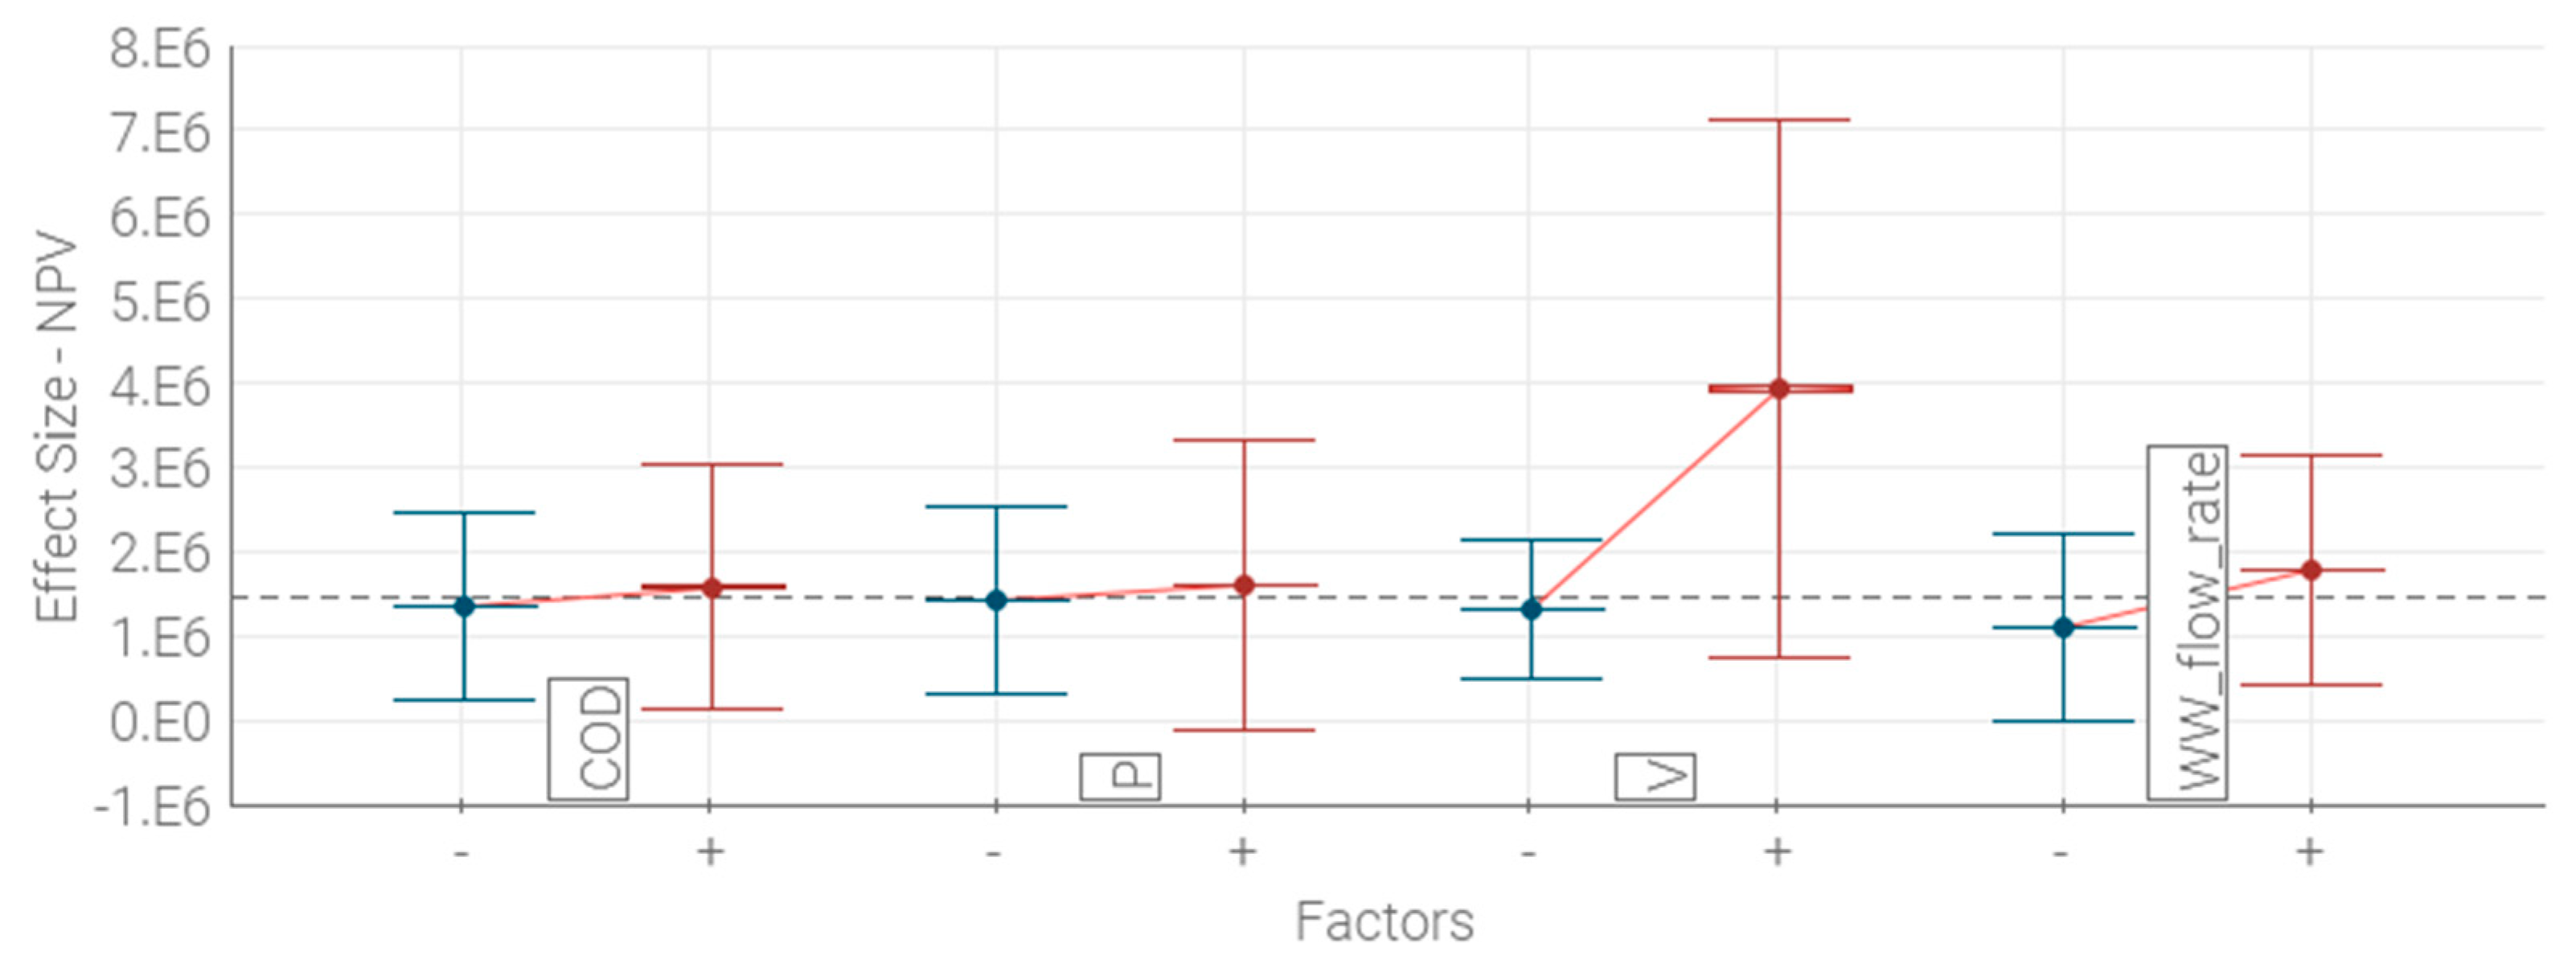
3.2. Scenario 2: Compressed Air Storage with Anaerobic Digestion

In the second scenario, AD introduction is included, with biogas valorization through the CHP unit, able to supply a share of the needed electricity. The analysis of the influence of single input parameters on NPV value (Figure 5) shows that a similar behavior to that encountered in Scenario 1 (Figure 3) is obtained, even if influent wastewater flowrate has a stronger influence, due to the fact that AD becomes more convenient for a higher plant potentiality.
Scenario 2 is particularly representative of medium and large-scale plants, where AD is already applied on full-scale, with biogas valorization: the integration of locally produced electricity with air storage system would optimize energy saving. In Figure 6, NPV and primary energy saving (PES) variation with respect to the influent flowrate was depicted: the maximum obtainable NPV was in the range of EUR 6–10 M, while PES was in the range of 36–108 toe/y for the different analyzed plant potentialities.
It could be seen that the investigated scenarios had a comparable behavior with respect to the considered input parameters. The proposed CAS system was shown to be technically and economically feasible. Given the cost-effectiveness of the solution, it is now possible to move on to a more in-depth study to analyze the commercially available technical devices for further system optimization.

4. Discussion

Air storage systems have been shown to be particularly useful to allow excess energy storage from renewable energies, with air storage in tanks or caverns (in periods of extra energy production) and a successive expansion of the pressurized air in a turbine (in periods of more consistent energy need). Among the different CAES configurations, including diabatic, adiabatic and isothermal mode, isothermal operations appear to be favorable to increase the overall performances, in terms of system efficiency [24]. The developed model for compressed air storage in WWTPs is highly flexible and can be specifically designed for target WWTPs, specifying plant potentiality and wastewater characteristics, both in terms of influent characterization, energy consumption of the biological phase and operating conditions of the activated sludge basin (such as air diffusers efficiency, HRT, SRT, X). It should be remembered that steady-state conditions, such as the ones considered in the present study, are not typically encountered in daily operations in WWTPs. However, this study was aimed at preliminarily evaluating the feasibility of the proposed solution to reduce operating costs for plant managing authorities. Furthermore, data scarcity has been recently recognized as a limiting factor to allow a widespread utilization of mathematical modelling, considering the complicated usage of online sensors and the huge workload required for sampling campaigns [38].
AD has been largely recognized as a significant source of renewable energy from different organic sources, able to provide fully renewable biogas, that has a high potential energy value [36]. Traditionally, AD was known to be beneficial in large-scale WWTPs, where a sufficient amount of sludge is available to continuously feed the digester, avoiding discontinuous operations throughout the year [39]. However, recently, by analyzing a large range (25,000–1,000,000 PE) of WWTP potentialities, it was proved that AD implementation is convenient also in small-scale plants when assessing environmental and economic benefits, particularly if agro-waste addition can be provided to the digester [40]. This can lead to an enhanced biogas generation, due to an augmented organic load, and a consequently favorable energy balance [40]. Regarding the second proposed scenario, further advances could include the co-digestion of sewage sludge with other locally available organic substrates to increase the obtainable methane yield from AD [31] or the application of sludge pre-treatments to increase its biodegradability [41]. Finally, the possibility to upgrade biogas to high-value biomethane, with technical characteristics totally comparable to fossil-derived natural gas, should be considered [41].
A following phase of the work is forecast, where the available commercial items for air storage will be investigated, to allow for an easier implementation of the proposed optimization system in existing plants. An in-depth process analysis of the aerobic (for example, considering the ASM1 model) and anaerobic (such as Anaerobic Digestion Model Number 1, ADM1 [42]) sections of the plant could be performed, better evaluating the performances of the proposed air storage system in dynamic conditions.
The detailed energy consumption data resulting from WWTP modelling through commercially available software’s (such as GPSX®, WEST® or Biowin®) could be integrated in the proposed economic saving approach, with further insights in achievable energy saving.
When considering the oxygen requirement of the biological treatment in WWTPs, it is known that the energy consumption for aeration strongly depends on a pool of different parameters (often difficult to monitor), such as oxygen transfer efficiency, diffuser fouling phenomenon, and diffuser selection [43]. The proposed empirical approach for air supply calculation is extremely simplified and needs to be sustained by an in-depth experimental or modelling campaign. Novel techniques that were recently proposed to save energy in biological wastewater treatment include smart aeration control, consisting of variable frequency drive (VFD), dissolved oxygen (DO) sensors and programmable logic controller (PLC) [44]. When applying the proposed approach to target WWTPs, the experimental data obtained from these novel smart aeration systems could be used to update the input datasets for the proposed economic optimization.

5. Conclusions

The economic optimization of the electricity consumption in existing wastewater treatment plants (WWTPs) following the demand response (DR) principle was proposed in the present study, focusing on the biological treatment, which is known to consume the highest share of electricity in WWTPs. A compressed air storage system, composed of an air compressor and a storage tank, was proposed, considering different operating pressures and volumes. The modelled WWTP characteristics were influent COD concentration and treated flowrate. Two scenarios were analyzed, one with simple air storage integration and the second forecasting the implementation of the air storage system with on-site electricity production from biogas. The results highlight that a short payback time can be obtained considering the actual Italian electricity market conditions, in particular by selecting larger storage volumes. Air storage volume was shown to be the most significant factor affecting the output economic indices, if compared to air pressure and WWTP characteristics. Biogas integration from anaerobic digestion (AD) process would allow one to increase the economic profitability of the investment, with favorable applicability in medium and large-scale WWTPs. A following phase of the work is forecast to study the available devices for commercial air storage systems and air expanders to implement a complete CAES, as well as to study in a deeper manner WWTP dynamic process conditions.

Author Contributions

The authors worked collectively on the manuscript preparation. All authors have read and agreed to the published version of the manuscript.

Funding

This research received no external funding.

Acknowledgments

The authors acknowledge CAFC S.p.A. company for input data for the model. The Company’s line of business includes the distribution of water for sale for domestic, commercial, and industrial use, together with wastewater collection and treatment.

Conflicts of Interest

The authors declare no conflict of interest.

Nomenclature

ADAnaerobic Digestion
ADM1Anaerobic Digestion Model No. 1
ASActivated Sludge
ASM1Activated Sludge Model No. 1
CASCompressed air storage
CAESCompressed air energy storage
CH4Methane
CHPCombined Heat and Power
CO2Carbon Dioxide
CODChemical oxygen demand
DODissolved Oxygen
DRDemand Response
GHGGreen-House Gases
HRTHydraulic retention time
IWAInternational Water Association
NZENet Zero Energy
PEPopulation Equivalent
PLCProgrammable Logic Controller
TEEWhite certificates
TNTotal Nitrogen
VFDVariable Frequency Drive
VSVolatile Solids
VSSVolatile Suspended Solids
WWTPWaste-Water Treatment Plant

Symbols

% VSVolatile solid content of sludge (% w/w)
AArea (m2)
cSpecific cost (EUR)
CCost (EUR])
EEnergy
HThermal energy
kHeat exchange constant
qVertical intercept of the generic equation
QFlowrate (m3/h)
RRevenues (EUR)
ttemperature (°C)
VStorage tank volume (m3)
XBiomass concentration in the biological tank (g VSS/L)
YCH4Specific methane yield (NmL CH4/g VS)

Subscripts and Superscripts

airair related
basebase digester
digdigester
supsuperficial digester
av_CHPavoided through biogas utilization
av_tankavoided through air storage tank
comprair compression in the tank related
igeneric device
O&Moperation and maintenance
losslost from the digester
ininfluent
opeoperating
outeffluent
s0inlet sludge
sludgesludge related
soilsoil related
TOTtotal investment

References

  1. Kirchem, D.; Lynch, M.Á.; Bertsch, V.; Casey, E. Modelling demand response with process models and energy systems models: Potential applications for wastewater treatment within the energy-water nexus. Appl. Energy 2020, 260, 114321. [Google Scholar] [CrossRef]
  2. Rodriguez, D.J.; Diego, J.; Delgado, A.; DeLaquil, P.; Sohns, A. Thirsty Energy; World Bank: Washington, DC, USA, 2013. [Google Scholar] [CrossRef]
  3. Lee, M.P. Assessment of Demand Response & Advanced Metering, Assessment of Demand Response & Advanced Today’s Presentation Will Discuss: Purpose of FERC’s Annual Assessment Results. December 2012. Available online: http://www.madrionline.org/wp-content/uploads/2013/09/Lee.pdf (accessed on 16 June 2020).
  4. Di Fraia, S.; Massarotti, N.; Vanoli, L. A novel energy assessment of urban wastewater treatment plants. Energy Convers. Manag. 2018, 163, 304–313. [Google Scholar] [CrossRef]
  5. Panepinto, D.; Fiore, S.; Zappone, M.; Genon, G.; Meucci, L. Evaluation of the energy efficiency of a large wastewater treatment plant in Italy. Appl. Energy 2016, 161, 404–411. [Google Scholar] [CrossRef]
  6. Yang, X.; Wei, J.; Ye, G.; Zhao, Y.; Li, Z.; Qiu, G.; Li, F.; Wei, C. The correlations among wastewater internal energy, energy consumption and energy recovery/production potentials in wastewater treatment plant: An assessment of the energy balance. Sci. Total Environ. 2020, 714, 136655. [Google Scholar] [CrossRef]
  7. Mainardis, M.; Goi, D. Pilot-UASB reactor tests for anaerobic valorisation of high-loaded liquid substrates in friulian mountain area. J. Environ. Chem. Eng. 2019, 7, 103348. [Google Scholar] [CrossRef]
  8. Plazzotta, S.; Cottes, M.; Simeoni, P.; Manzocco, L. Evaluating the environmental and economic impact of fruit and vegetable waste valorisation: The lettuce waste study-case. J. Clean. Prod. 2020, 262, 121435. [Google Scholar] [CrossRef]
  9. Guerra-Rodríguez, S.; Oulego, P.; Rodríguez, E.; Singh, D.N.; Rodríguez-Chueca, J. Towards the implementation of circular economy in the wastewater sector: Challenges and opportunities. Water 2020, 12, 1431. [Google Scholar] [CrossRef]
  10. Kollmann, R.; Neugebauer, G.; Kretschmer, F.; Truger, B.; Kindermann, H.; Stoeglehner, G.; Ertl, T.; Narodoslawsky, M. Renewable energy from wastewater—Practical aspects of integrating a wastewater treatment plant into local energy supply concepts. J. Clean. Prod. 2017, 155, 119–129. [Google Scholar] [CrossRef]
  11. Mitra, S.; Grossmann, I.E.; Pinto, J.M.; Arora, N. Optimal production planning under time-sensitive electricity prices for continuous power-intensive processes. Comput. Chem. Eng. 2012, 38, 171–184. [Google Scholar] [CrossRef] [Green Version]
  12. Tchobanoglus, G.; Burton, F.; Stensel, H.D. Wastewater Engineering: Treatment and Reuse, 4th ed.; Metcalf and Eddy: New York, NY, USA, 2003. [Google Scholar]
  13. Henze, M.; Grady, C.; Gujer, W.; Marais, G.; Matsuo, T. Activated sludge model no. 1, Tech. rep. In IAWQ Scientific and Technical Report No. 1; IAWQ: London, UK, 1987. [Google Scholar]
  14. Póvoa, P.; Oehmen, A.; Inocêncio, P.; Matos, J.S.; Frazão, A. Modelling energy costs for different operational strategies of a large water resource recovery facility. Water Sci. Technol. 2017, 75, 2139–2148. [Google Scholar] [CrossRef]
  15. Hvala, N.; Vrečko, D.; Levstek, M.; Bordon, C. The use of dynamic mathematical models for improving the designs of upgraded wastewater treatment plants. J. Sustain. Dev. Energy Water Environ. Syst. 2017, 5, 15–31. [Google Scholar] [CrossRef]
  16. Simeoni, P.; Ciotti, G.; Cottes, M.; Meneghetti, A. Integrating industrial waste heat recovery into sustainable smart energy systems. Energy 2019, 175, 941–951. [Google Scholar] [CrossRef]
  17. Gude, V.G. Energy and water autarky of wastewater treatment and power generation systems. Renew. Sustain. Energy Rev. 2015, 45, 52–68. [Google Scholar] [CrossRef]
  18. Mamais, D.; Noutsopoulos, C.; Dimopoulou, A.; Stasinakis, A.; Lekkas, T.D. Wastewater treatment process impact on energy savings and greenhouse gas emissions. Water Sci. Technol. 2014, 71, 303–308. [Google Scholar] [CrossRef]
  19. Mahmud, R.; Erguvan, M.; Macphee, D.W. Performance of Closed Loop Venturi Aspirated Aeration System: Experimental Study and Numerical Analysis with Discrete Bubble Model. Water 2020, 12, 1637. [Google Scholar] [CrossRef]
  20. Hakanen, J.; Miettinen, K.; Sahlstedt, K. Wastewater treatment: New insight provided by interactive multiobjective optimization. Decis. Support Syst. 2011, 51, 328–337. [Google Scholar] [CrossRef]
  21. Ramos, M.A.; Boix, M.; Montastruc, L.; Domenech, S. Multiobjective Optimization Using Goal Programming for Industrial Water Network Design. Ind. Eng. Chem. Res. 2014, 53, 17722–17735. [Google Scholar] [CrossRef] [Green Version]
  22. Díaz-Madroñero, M.; Pérez-Sánchez, M.; Satorre-Aznar, J.R.; Mula, J.; López-Jiménez, P.A. Analysis of a wastewater treatment plant using fuzzy goal programming as a management tool: A case study. J. Clean. Prod. 2018, 180, 20–33. [Google Scholar] [CrossRef]
  23. Sweetapple, C.; Fu, G.; Butler, D. Multi-objective optimisation of wastewater treatment plant control to reduce greenhouse gas emissions. Water Res. 2014, 55, 52–62. [Google Scholar] [CrossRef] [Green Version]
  24. Castellani, B.; Presciutti, A.; Filipponi, M.; Nicolini, A.; Rossi, F. Experimental investigation on the effect of phase change materials on compressed air expansion in CAES plants. Sustainability 2015, 7, 9773–9786. [Google Scholar] [CrossRef] [Green Version]
  25. Besharat, M.; Dadfar, A.; Viseu, M.T.; Brunone, B.; Ramos, H.M. Transient-flow induced compressed air energy storage (TI-CAES) system towards new energy concept. Water 2020, 12, 601. [Google Scholar] [CrossRef] [Green Version]
  26. Abbaspour, M.; Satkin, M.; Mohammadi-Ivatloo, B.; Lotfi, F.H.; Noorollahi, Y. Optimal operation scheduling of wind power integrated with compressed air energy storage (CAES). Renew. Energy 2013, 51, 53–59. [Google Scholar] [CrossRef]
  27. Dincer, I.; Acar, C. Smart energy systems for a sustainable future. Appl. Energy 2017, 194, 225–235. [Google Scholar] [CrossRef]
  28. Gestore dei Mercati Energetici (GME). Electricity Market. 2020. Available online: https://www.mercatoelettrico.org/it/ (accessed on 20 February 2020).
  29. Autorità di Regolazione Energia Reti e Ambiente (ARERA). Electricity Prices for Industrial Users. 2019. Available online: https://www.arera.it/it/dati/eepcfr2.htm (accessed on 21 February 2020).
  30. Dionisi, D.; Rasheed, A.A. Maximisation of the organic load rate and minimisation of oxygen consumption in aerobic biological wastewater treatment processes by manipulation of the hydraulic and solids residence time. J. Water Process Eng. 2018, 22, 138–146. [Google Scholar] [CrossRef] [Green Version]
  31. Cabbai, V.; Ballico, M.; Aneggi, E.; Goi, D. BMP tests of source selected OFMSW to evaluate anaerobic codigestion with sewage sludge. Waste Manag. 2013, 33, 1626–1632. [Google Scholar] [CrossRef]
  32. Simeoni, P.; Nardin, G.; Ciotti, G. Planning and design of sustainable smart multi energy systems. The case of a food industrial district in Italy. Energy 2018, 163, 443–456. [Google Scholar] [CrossRef]
  33. Mainardis, M.; Flaibani, S.; Mazzolini, F.; Peressotti, A.; Goi, D. Techno-economic analysis of anaerobic digestion implementation in small Italian breweries and evaluation of biochar and granular activated carbon addition effect on methane yield. J. Environ. Chem. Eng. 2019, 7, 103184. [Google Scholar] [CrossRef]
  34. Zupančič, G.D.; Roš, M. Heat and energy requirements in thermophilic anaerobic sludge digestion. Renew. Energy 2003, 28, 2255–2267. [Google Scholar] [CrossRef]
  35. Osservatorio Meteorologico Regionale (Osmer). Data Archival. 2019. Available online: https://www.osmer.fvg.it/archivio.php?ln=&p=dati (accessed on 26 February 2020).
  36. Mainardis, M.; Buttazzoni, M.; Goi, D. Up-Flow Anaerobic Sludge Blanket (UASB) Technology for Energy Recovery: A Review on State-of-the-Art and Recent Technological Advances. Bioengineering 2020, 7, 43. [Google Scholar] [CrossRef]
  37. Zakeri, B.; Syri, S. Electrical energy storage systems: A comparative life cycle cost analysis. Renew. Sustain. Energy Rev. 2015, 42, 569–596. [Google Scholar] [CrossRef]
  38. Borzooei, S.; Amerlinck, Y.; Abolfathi, S.; Panepinto, D.; Nopens, I.; Lorenzi, E.; Meucci, L.; Zanetti, M.C. Data scarcity in modelling and simulation of a large-scale WWTP: Stop sign or a challenge. J. Water Process Eng. 2019, 28, 10–20. [Google Scholar] [CrossRef] [Green Version]
  39. Misson, G.; Mainardis, M.; Incerti, G.; Goi, D.; Peressotti, A. Preliminary evaluation of potential methane production from anaerobic digestion of beach-cast seagrass wrack: The case study of high-adriatic coast. J. Clean. Prod. 2020, 254, 120131. [Google Scholar] [CrossRef]
  40. Arias, A.; Feijoo, G.; Moreira, M.T. What is the best scale for implementing anaerobic digestion according to environmental and economic indicators? J. Water Process Eng. 2020, 35, 101235. [Google Scholar] [CrossRef]
  41. Borzooei, S.; Campo, G.; Cerutti, A.; Meucci, L.; Panepinto, D.; Ravina, M.; Riggio, V.; Ruffino, B.; Scibilia, G.; Zanetti, M. Optimization of the wastewater treatment plant: From energy saving to environmental impact mitigation. Sci. Total Environ. 2019, 691, 1182–1189. [Google Scholar] [CrossRef]
  42. Parker, W.J. Application of the ADM1 model to advanced anaerobic digestion. Bioresour. Technol. 2005, 96, 1832–1842. [Google Scholar] [CrossRef]
  43. Drewnowski, J.; Remiszewska-Skwarek, A.; Duda, S.; Łagód, G. Aeration process in bioreactors as the main energy consumer in a wastewater treatment plant. Review of solutions and methods of process optimization. Processes 2019, 7, 311. [Google Scholar] [CrossRef] [Green Version]
  44. Khatri, N.; Khatri, K.K.; Sharma, A. Enhanced Energy Saving in Wastewater Treatment Plant using Dissolved Oxygen Control and Hydrocyclone. Environ. Technol. Innov. 2020, 18, 100678. [Google Scholar] [CrossRef]
Figure 1. Wastewater treatment plant process flow.
Energies 13 04780 g001
Figure 2. Mean 24-h behavior of the influent flow-rate in the analyzed WW.TP.
Energies 13 04780 g002
Figure 3. Influence of the main input parameters (wastewater flowrate and influent COD, air storage tank pressure and volume) on the NPV of the proposed compressed air storage system (Scenario 1).
Energies 13 04780 g003
Figure 4. Influence of air storage tank pressure and volume on NPV for different wastewater flowrates (Scenario 1).
Energies 13 04780 g004
Figure 5. Influence of the main input parameters (wastewater flowrate and influent COD, air storage tank pressure and volume) on the NPV of the proposed compressed air storage system (Scenario 2).
Energies 13 04780 g005
Figure 6. Influence of the treated wastewater flowrate on NPV and PES indices (Scenario 2).
Energies 13 04780 g006
Table 1. Selected input parameters considered in the multi-objective optimization model.
ParameterSelected RangeModelling Step
Influent flowrate (m3/h)504 ÷ 1504100
Influent COD concentration (mg/L)150 ÷ 50050
Electricity consumption for aeration (% of total)30 ÷ 8010
Compressed air tank volume (m3)0.3 ÷ 1000Variable
Compressed air pressure (Mpa)0.1 ÷ 35Variable
Table 2. Selected output optimization functions considered in the multi-objective optimization model.
ParameterObjective Function
NPV (EUR)Maximization
PES (toe)Maximization

