Article

Assessment of Multiple Anaerobic Co-Digestions and Related Microbial Community of Molasses with Rice-Alcohol Wastewater

State Key Laboratory for Conservation and Utilization of Subtropical Agro-bioresources, College of Life Science and Technology, Guangxi University, Nanning 530005, China
*
Author to whom correspondence should be addressed.
Energies 2020, 13(18), 4866; https://doi.org/10.3390/en13184866
Submission received: 12 July 2020 / Revised: 12 September 2020 / Accepted: 14 September 2020 / Published: 17 September 2020
(This article belongs to the Section A4: Bio-Energy)

Abstract

:
Molasses is a highly dense and refined byproduct produced in the sugarcane industry, and it contains high amounts of degradable compounds. Through bioconversion, these compounds can be transformed into renewable products. However, the involved biological process is negatively influenced by the high chemical oxygen demand (COD) of molasses and ion concentration. The co-digestion of molasses with rice-alcohol wastewater (RAW) was compared with its mono-digestion at an increasing organic loading rate (OLR). Both processes were assessed by detecting the COD removal rate, the methane contents of biogas, and the structure and composition of microbial communities at different stages. Results showed that the co-digestion is stable up to a maximum OLR of 16 g COD L−1 d−1, whereas after the acclimatization phase, the mono-digestion process was disturbed two times, which occurred at a maximum OLR of 9 and 10 g COD L−1 d−1. The volatile fatty acids (VFAs) observed were 2059.66 mg/L and 1896.9 mg/L, which in mono-digestion causes the inhibition at maximum OLRs. In the co-digestion process, the concomitant COD removal rates and methane content recorded was 90.72 ± 0.63% 64.47% ± 0.59% correspondingly. While in the mono-digestion process, high COD removal rate and methane contents observed were 89.29 ± 0.094% and 61.37 ± 1.06% respectively. From the analysis of microbial communities, it has been observed that both the bacterial and archaeal communities respond differently at unlike stages. However, in both processes, Propionibacteriaceae was the most abundant family in the bacterial communities, whereas Methanosaetaceae was abundant in the archaeal communities. From the current study, it has been concluded that that rice-alcohol wastewater could be a good co-substrate for the anaerobic digestion of molasses in terms of COD removal rate and methane contents production, that could integrate molasses into progressive biogas production with high OLR.

Graphical Abstract

1. Introduction

Side streams produced in huge quantities in agro-industrial processes contain high organic compounds of low value, and these streams are an attractive feedstock to be used in bio-refineries. The highly biodegradable substances present in these streams can be converted into chemicals of interest [1,2]. Among the agro-industrial byproducts, sugarcane-derived products are potential sources of high-value compounds, such as biomethane, biohydrogen, and organic acids, which are obtained through fermentation [3]. During anaerobic digestion, a sufficient glucose or sucrose concentration is required for the growth of microbes that facilitate the generation of byproducts, such as methane, hydrogen, and organic acids [4]. Molasses, which is composed of approximately 45% sugar, is a viable agro-industrial by-product for biofuel production through fermentation [5]. Molasses is a highly dense material produced through the crystallization of sugarcane [6]. It is also considered a major raw material for biogas production due to its high organic fraction content [1,7]. However, its anaerobic digestion is limited due to its high COD, melanoidin content, and ions concentration. In addition, high potassium concentration has negative effects on microbial metabolism during methanogenesis and supporting the accumulation of carboxylate [1]. On the other hand, melanoidin is a strong antioxidant compound that inhibits the growth of the microbes present [8]. Therefore, molasses should be diluted strongly before it can be used in any biological process [9]. Greenhouse gases emitted from industrial wastes have negative impacts on environment and health, and leakage of any toxic substances from industrial liquids may harmful to both flora and fauna. Different techniques, such as recycling, incineration, and landfilling, are being used for the treatment of wastes material. Among these techniques, recycling is considered to be the most effective method for managing wastes material in terms of greenhouse gas emission and for energy recovery [10,11]. The high organic fraction of molasses is attributed to its high sucrose content, and sucrose can be used as a substrate in bio-refineries and is possibly involved in several microbial pathways [2]. Biofuels, such as ethanol, hydrogen, and methane, are well-known products of molasses digestion. Moreover, products such as alcohol, amino acids, and baker’s yeast are also produced from molasses [1].
Anaerobic digestion is an effective, widely acceptable, and cost-effective technology to degrade organic matter to produce mainly methane and carbon dioxide. Many industrial wastes have been extensively treated through anaerobic technologies [12]. The anaerobic digestion process is carried out by four groups of microorganisms that drive hydrolysis, acidogenesis, acetogenesis, and methanogenesis. Methanogenesis is the last and most critical step of the process, mainly dependent on temperature, pH, OLR, and alkalinity. However, any fluctuation in these conditions may lead to process failure [13,14]. The anaerobic co-digestion process is a widely used technique providing a good platform for high biogas production. The co-substrate in this digestion provides additional benefits to the process that help to dilute toxic substances, maintain nutrient balance, and have synergistic effects on microorganisms [15].
An imbalance in microorganisms, such as methanogens and other microbes, can perturb the fermentation process [16]. Therefore, consistency in the microbial community is the most critical factor in ensuring stable fermentation [17]. The stability and efficiency of fermentation are highly dependent on the mutual and syntrophic relationship of different microbial groups responsible for hydrolysis, acetogenesis, acidogenesis, and methanogenesis [18]. The process of fermentation depends on the presence of methanogens and other microbes. The functional stability of the process is highly associated with the consistency of the microbial community which enhances the production of methane [19]. High VFA content has been reported due to the presence of acidogenic and acetogenic microbes, which ultimately leads to process failure [13].
However, in this study, rice-alcohol wastewater (RAW) was used as a co-substrate for the feasibility of molasses digestion. RAW is carbohydrate-rich wastewater, and has been used for biogas production previously [20]. There are more than ten thousand rice fermentation plants throughout China for the production of rice alcohol. The wastewater released from these fermentation plants has a high organic fraction of chemical oxygen demand of about 35–40 g/L [21].
Keeping in view the afore-mentioned importance of molasses and its anaerobic fermentation, this study was conducted for the first time to evaluate the anaerobic co-digestion of molasses with rice-alcohol wastewater and to compare with the mono-digestion of molasses in addition to an analysis of microbial composition. The efficiency of both processes was assessed in terms of COD removal rate and percent methane contents of biogas produced. Additionally, VFAs were monitored periodically, which could cause negative effects on the digestion process, while high throughput sequencing was applied to identify and characterize the Archaeal and bacterial communities in different phases of the process.

2. Materials and Methods

2.1. Sludge and Wastewater

The anaerobic sludge was obtained from IC (internal circulating) reactor treating bagasse spray wastewater at Guangxi Guitang (Group) Co. Ltd. China, while cane molasses was also obtained from the same company. On the other hand, rice-alcohol wastewater (RAW) was obtained from a local rice alcohol fermenting company. The characteristics of both molasses and RAW are given in Table 1.

2.2. Digesters Setup

Plastic containers with a total volume of 5 L and working volume of 4 L were used as digester tanks and sealed with silicon and a rubber stopper. The temperature was maintained between 35 to 37 °C followed by the manual mixing of the reactors. In each container, three ports were made for effluent, influents, and biogas collection. The airtightness of each digester was safeguarded to avoid any leakage (Figure 1). HRT was calculated using the formula: HRT = V/Flow rate, where V is the volume of the reactor.

2.3. Operating Conditions for Co-Digestion and Mono-Digestion Experiment

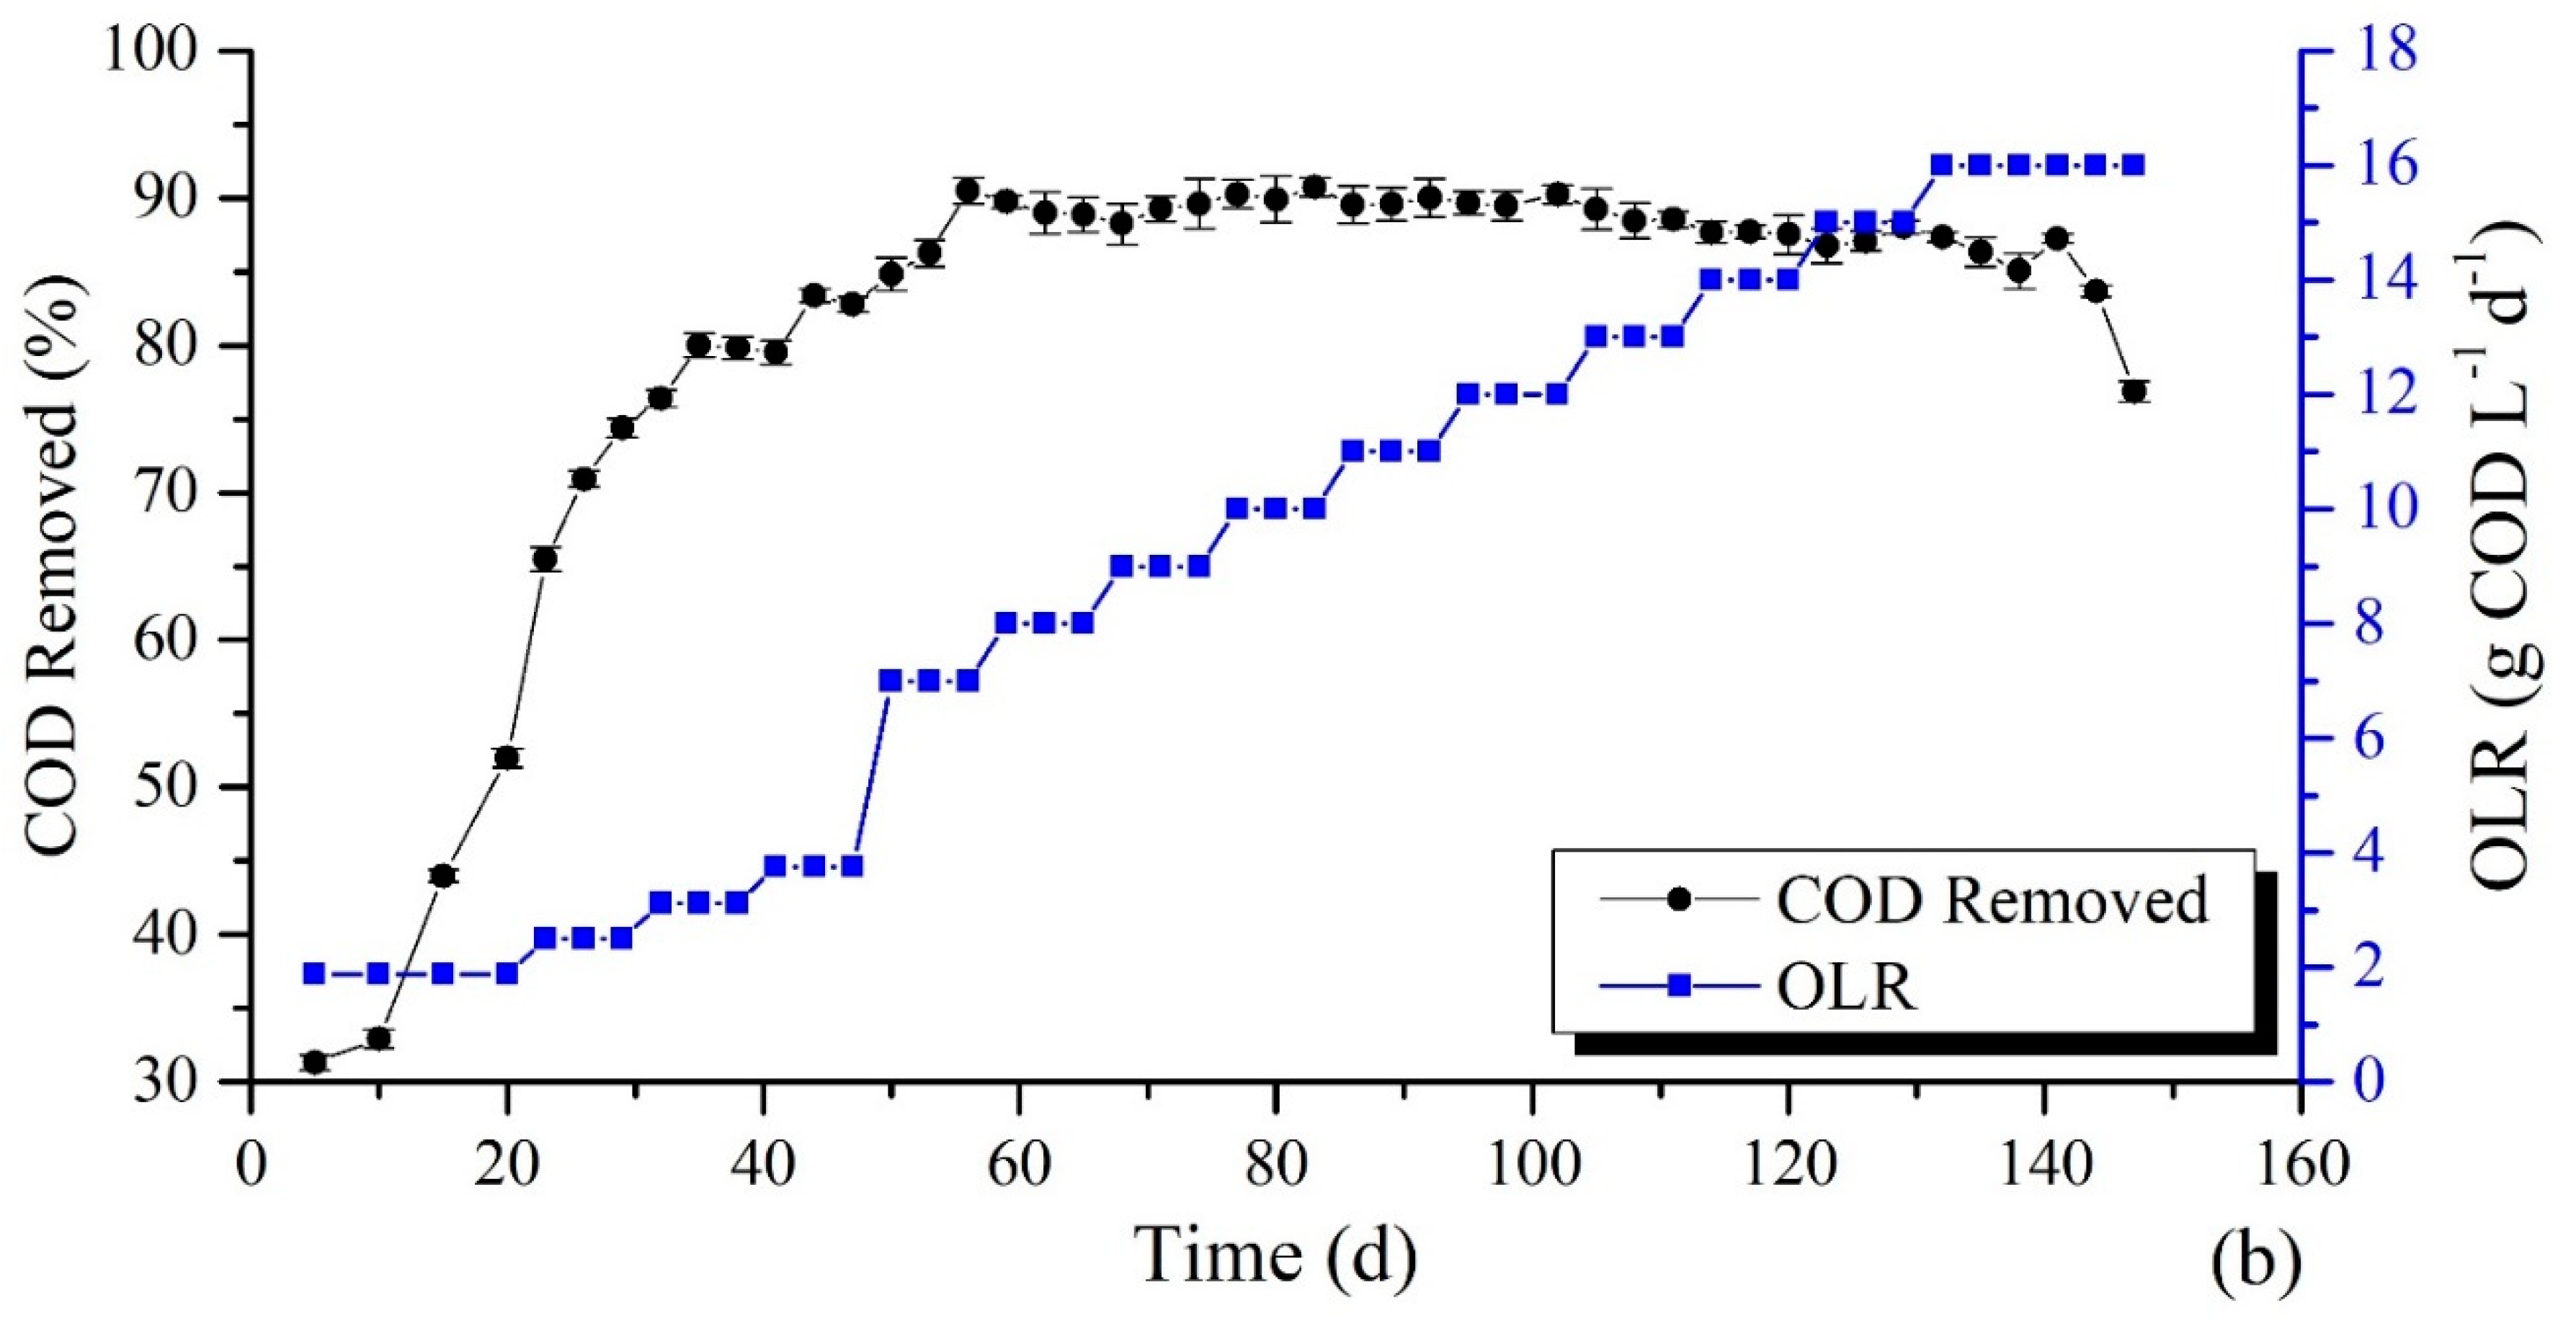
In the co-digestion process of molasses, rice-alcohol wastewater (RAW) was used as a co-substrate. The reaction was started with low OLR (1.875 g COD L−1 d−1) at a 1:1 ratio and manual feeding to the reactors was carried out by using a 200 mL syringe. When the process gets acclimatized after day 29, the concentration of molasses in the feed was increased after regular intervals along with the increase in OLR. However, the RAW concentration was kept constant, as shown in Table 2. The process was stopped when the maximum OLR reached 16 g COD L−1 d−1.
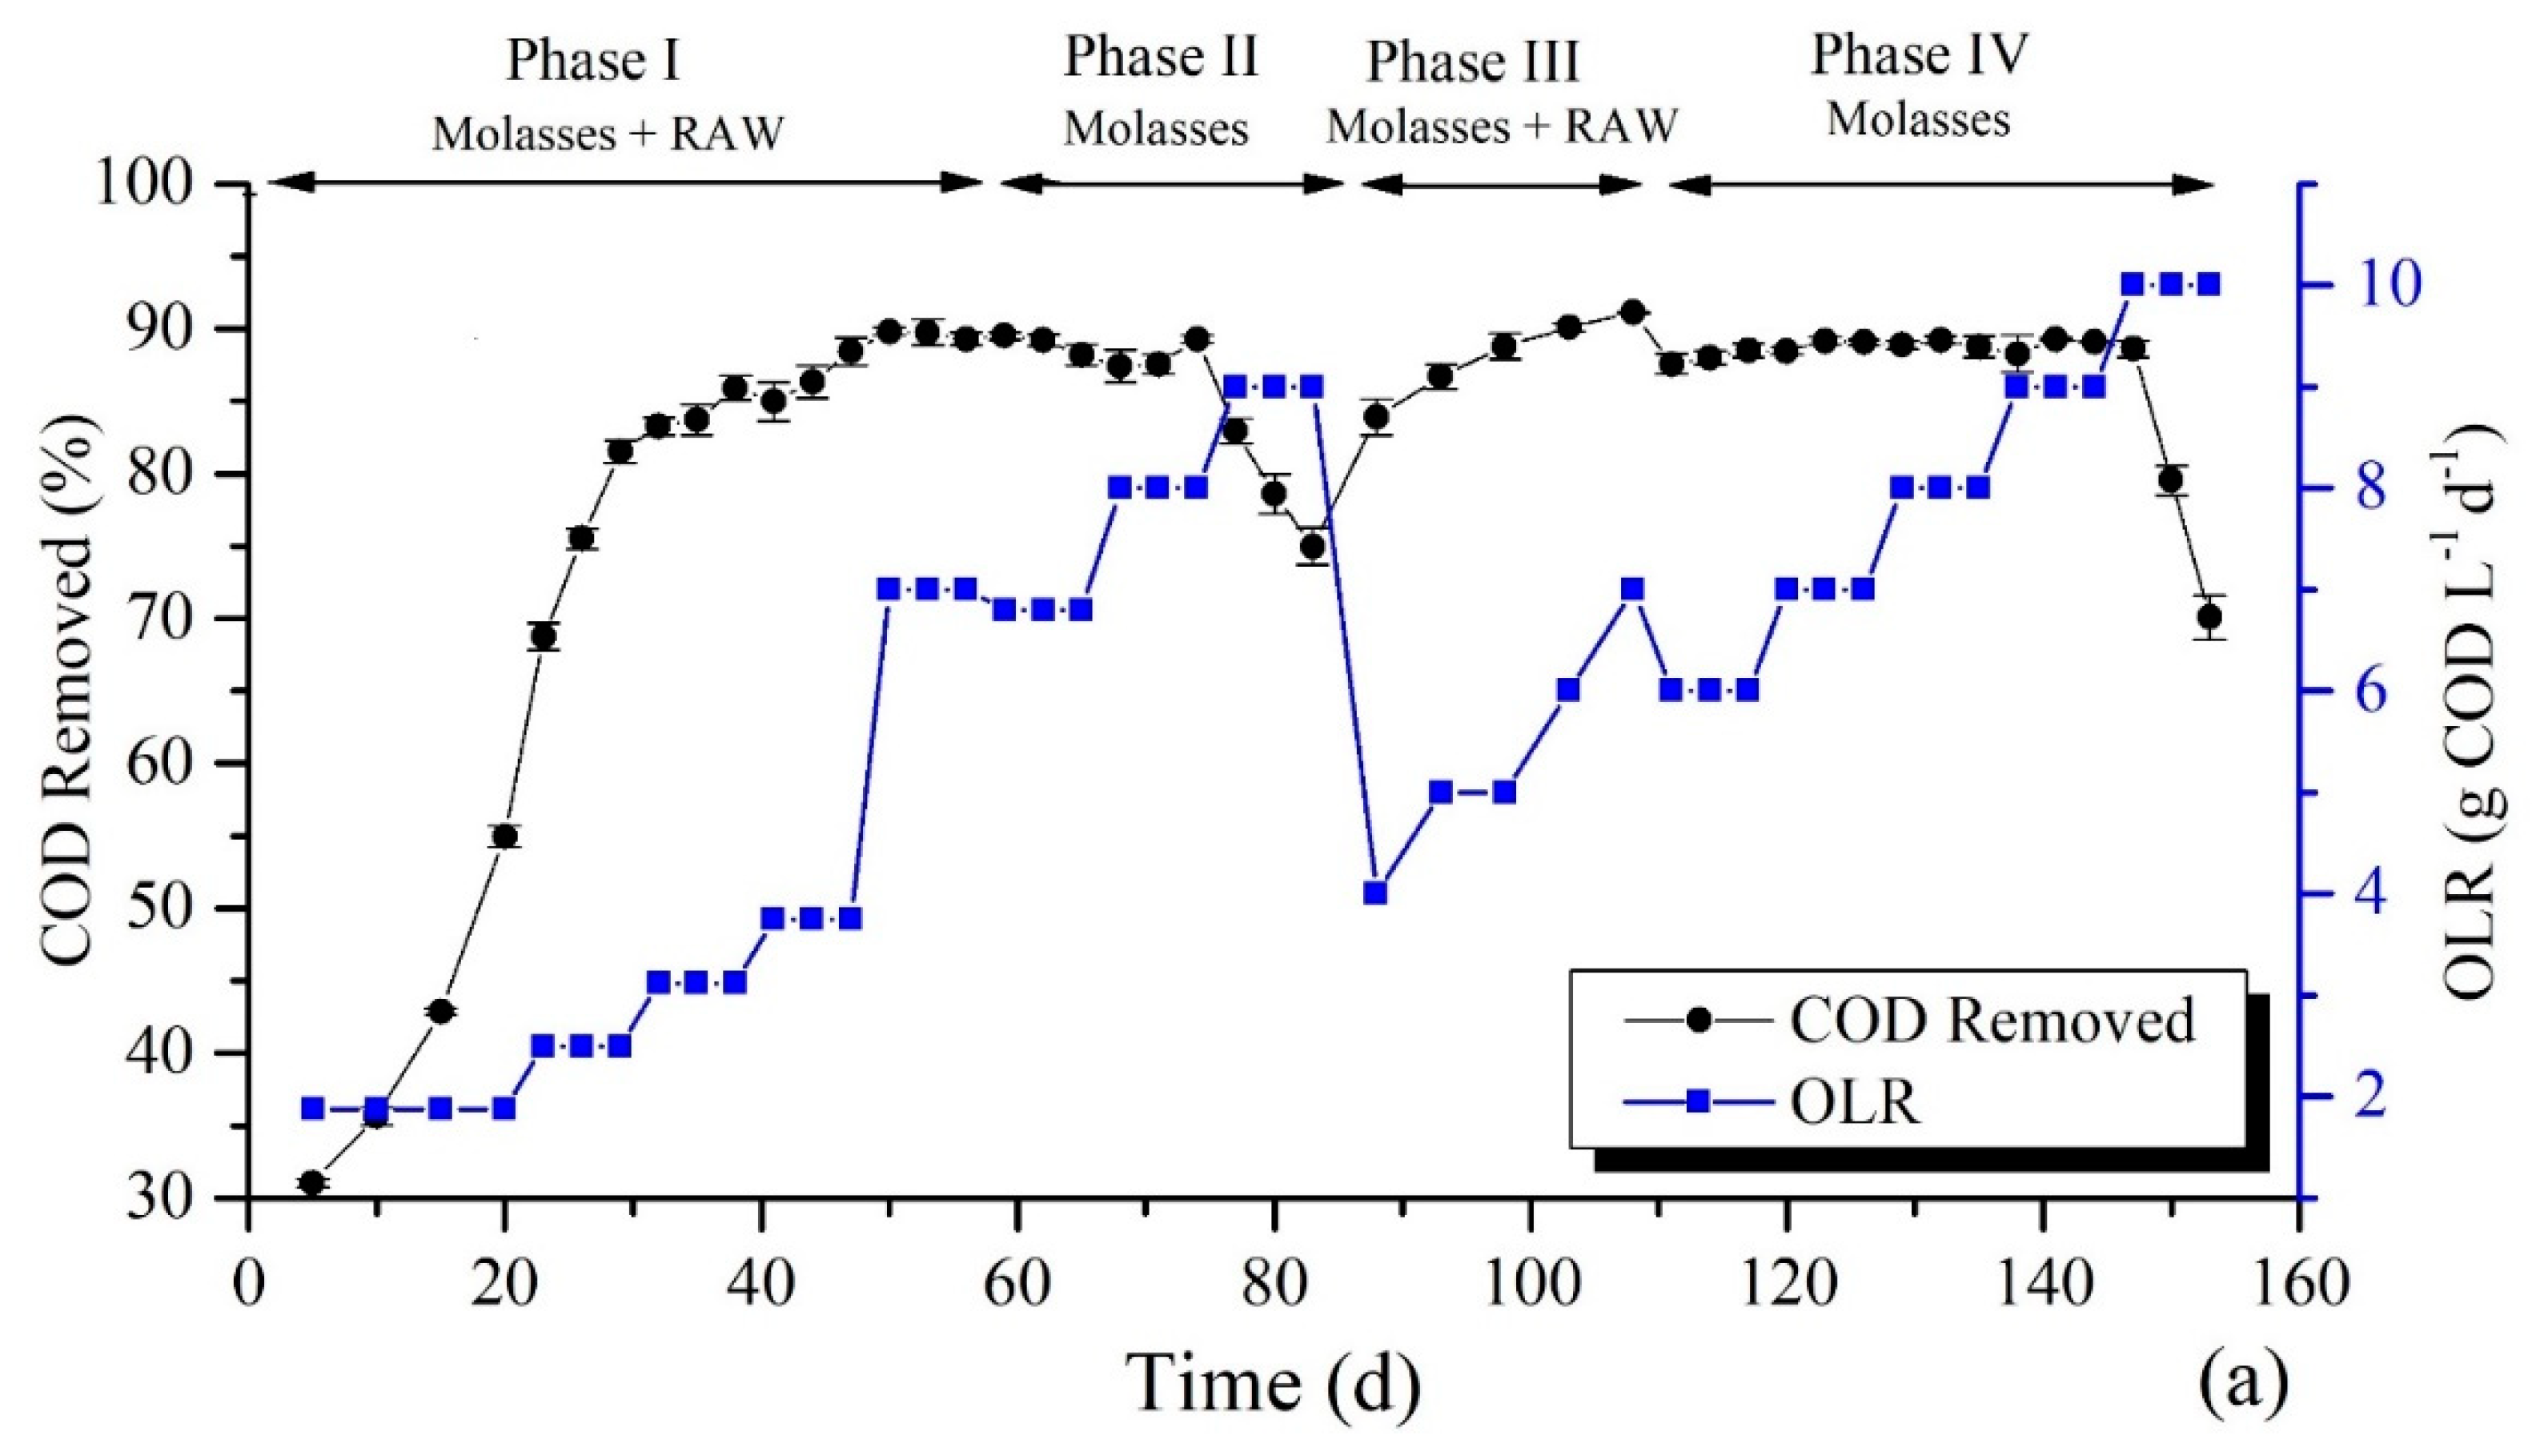
The second set of experiments was carried out as a mono-digestion of molasses along with co-digestion. The process was divided into 4 phases (Table 3). In phase I, RAW was used as co-substrate with molasses just to acclimatize the reaction process (from OLR 1.8 to 7 g COD L−1 d−1). After acclimation, phase II of the process started; in this phase molasses were fed to digesters without RAW at OLR 6.8 g COD L−1 d−1. However, Phase II ended at day 83 when the maximum OLR reached 9 g COD L−1 d−1 and the process efficiency decreased due to a decrease in pH. Phase III of the experiment was started with low OLR, i.e., 4 g COD L−1 d−1, and again RAW was used to reacclimatize the process. The process continues by a gradual increase in OLR to 7 g COD L−1 d−1. Phase IV was the last phase in which molasses was digested alone. In this phase, feeding OLR was started from 6 g COD L−1 d−1 COD L−1 d−1 and ended at OLR 10 g COD L−1 d−1.
Each set of experiments was performed in triplicate at 35 ± 2 °C. In the beginning, the HRT of each experiment was 8 days based on the preliminary experiment. On the maximum COD removal rate at day 39, the HRT was decreased to 5 days and kept constant throughout the experiment. The pH was measured daily with the exchange of wastewater, while the COD removal rate and percent methane content were examined at the interval of 3 days. Samples for VFA contents were collected every week and stored at −20 °C for further analysis.

2.4. Analytical Methods

The effluent and influent pH measurement was carried out on daily basis. Quantification of COD concentration was determined using HACH (DRB 200 (COD 200-15000)). The produced biogas was collected in biogas bags in order to analyze by gas chromatography, Shimadzu GC-14C (Shimadzu Co. Ltd., Kyoto, Japan) using a Porapak Q (80–100 mesh; 0.3 mm × 2 m) capillary column equipped with FID detector. Operating temperatures for inlet, column, and detector were set at 100 °C, 60 °C, and 100 °C, respectively. The pressure of hydrogen gas was set to 40 Kpa, and the pressure of nitrogen as a carrier gas and oxygen pressures were established to 65 Kpa and 30 Kpa, respectively. The gas sample was injected manually with a total volume of 3 µL. The methane concentration was calculated by comparing the peak area which resulted from the standard sample (99.9% methane).
Volatile fatty acids (VFAs) concentrations were measured by Shimadzu 2010 gas chromatograph (Shimadzu Co. Ltd., Japan) using FID and a capillary column type SGE BP 21. Helium was used as a carrier gas at a flow rate of 190.4 mL min−1, with a split ratio of 100 giving a flow rate of 1.86 mL−1 in the column and a 3 mL min−1 purge. The GC oven temperature was programmed to increase from 60 to 210 °C in 15 min, with a final hold time of 3 min. Temperatures of injector and detector were 200 and 250 °C, respectively. Samples were acidified using 3% formic acid. Three standard solutions containing 50, 250, and 500 mg L−1 of acetic acid, propionic acid, isobutyric acid, butyric, isovaleric, valeric acids were used for VFA calibration.

2.5. High-Throughput Sequencing for Microbial Community

For microbial community analysis sludge samples were collected at different stages of the digestion process. Before sample collection, each digester was shaken to homogenize the sludge content with the fermenting substrate. About 50 g of sample was taken and part of it was stored at −80 °C for further analysis. A total of six sludge samples were taken and tagged as M35 (day 53), M50 (day 83), and M51 (day 156) for the mono-digestion process. MR35 (day 56), MR50 (day 83), and MR75 (day 129) were labeled for the co-digestion process. Besides these, a 0-day sample labeled as MR15 was taken from the sludge, as the same sludge was used for both processes.

Extraction of DNA, PCR Amplification and Sequencing

For the extraction of genomic DNA, a Fast DNA Spin Kit for Soil (Q-BIOgene, Carlsbad, CA, USA) was used. V3-V4 regions were amplified and primers 5′-ACTCCTACGGGAGGCAGCA-3′ and 5′-GGACTACHVGGGTWTCTAAT-3′ were used for bacteria, while Arch349F: 5′-GYGCASCAGKCGMGAAW-3′ and Arch806R: 5′-GGACTACVSGGGTATCTAAT-3′ were used for methanogens [14]. PCR amplification was applied according to the protocol used by Shen et al. [8]. Conditions used for PCR were 10× PCR buffer, 0.25 mmol/L deoxyribonucleotide triphosphate (dNTPs), 0.4 µmol/L each primer, 1 U Ex Taq polymerase (TaKaRa Company, Kyoto, Japan), and 10 ng of sample DNA template. All of these were added to molecular grade water to make a total volume of 25 µL. The conditional steps for operating PCR were as follows: after the pre-denaturation step at 94 °C for 5 min, 25 cycles were performed in three steps: denaturation at 94 °C for 1 min, annealing temperature 65 °C for 1 min decreased to 56 °C by decreasing 0.5 °C per cycle, and an extension step at 72 °C for 1 min, again followed by 10 cycles at an annealing temperature of 55 °C and finally followed by an extension for 8 min at 72 °C. The PCR products were then sequenced using high throughput sequencing (HiSeq) technology. The generated sequences were then analyzed for pre-processing (quality adjustment, barcode splitting) to the identify specific operational taxonomic units (OTUs) for bacterial and methanogen taxonomy and their community comparisons at the family level.

3. Results and Discussion

3.1. Impact of Operating Conditions on COD Removal Rate

Mono-Digestion and Co-Digestion Process

In the current study, it was observed that in the mono-digestion process (Figure 2a, Phase I) the COD removal efficiency was gradually increased up to 89.31 ± 0.24% with increasing OLR to 7 g COD L−1 d−1. However, in phase II (feed only molasses) when OLR was increased to 9 g COD L−1 d−1, a decrease in COD removal rate was noted (82.56 ± 0.85%to 74.96 ± 1.28%) (Figure 2a). This decrease in COD removal rate at maximum OLR could be due to the accumulation of high VFA contents or might be the high loading rate which is not tolerable by the methanogens in the digester [22]. After the decrease in COD removal rate, feeding to the reactors was stopped for 4 consecutive days to stabilize the process. The process was then resumed with low OLR (4 g COD L−1 d−1) along with the addition of co-substrate (RAW). The COD removal efficiency was then recorded as 83.91 ± 1.25% to 91.12 ± 0.05% (Figure 2b, Phase III). In phase IV, when only molasses was fed to the digester, the COD removal rate observed was 87.56 ± 0.69% to 89.29 ± 0.094% (Figure 2a) during a stepwise increase in OLR up to 10 g COD L−1 d−1. However, the efficiency of the digester decreased to 70.09 ± 1.53% by continuous addition of OLR 10 g COD L−1 d−1 (Figure 2b). After a phase I, phase II was started from 6.8 g COD L−1 d−1 as in mono-digestion, the process upset occurred at a feeding rate of 9 g COD L−1 d−1. However, in phase IV (mono-digestion), the influent COD rate was reduced to 6 g COD L−1 d−1. This decrease in OLR was performed to avoid microbial activity suppression and this might be the reason that in phase IV, digestion at the highest OLR (10 g COD L−1 d−1) was stable to some extent.
In the present study, the mono-digestion of molasses up to OLR (8 g COD L−1 d−1 and 10 g COD L−1 d−1) could be attributed to the stable microbial communities in the sludge after co-digestion phases I and III (Figure 2a). At the beginning of the experiment, a low COD removal rate was observed with low OLR, which could be due to the non-stability of the microbial community in the sludge. Once the process was stabilized, the COD removal rate was increased gradually with the increase in OLR rather than upset, until it reached to maximum OLR.
Our results are consistent with observations of De Vrieze et al. [23] and Detman et al. [7] regarding the COD removal rate. Moreover, De Vrieze et al. [23] reported a rapid decrease in COD removal rate at OLR of 4.1 g COD L−1 d−1. High strength molasses has been shown to contain high salt concentration which could be inhibitory to anaerobic digestion [24]. Moreover, a high VFA concentration may contribute to processing failure [25]. Therefore, due to these reasons, failure in the mono-digestion process of molasses negatively impacts the microbial community of the system.
In comparison to mono-digestion, the co-digestion process was more stable and suitable for digesting highly concentrated molasses with rice-alcohol wastewater (RAW). This stability could be attributed to sharing essential micro- and macronutrients in the co-substrates and diluting the toxic chemicals in either of the substrates [26]. As shown in Figure 2b, during the acclimatization phase, the COD removal rate increased from 31.33 ± 0.5 to 52.00 ± 0.63% with an OLR value of 1.87 g COD L−1 d−1 in the first 20 days. A sharp increase in COD removal rate (65.48 ± 0.82% to 90.72 ± 0.63%) was observed with a steady increase in OLR from 2.5 g COD L−1 d−1 to 10 g COD L−1 d−1. When OLR was further increased from 10 to 16 g COD L−1 d−1, the COD removal rate remained constant in between 85.05 ± 1.19% to 90.25 ± 0.65%. However, the pH suddenly dropped when digesters were continuously fed with OLR 16 g COD L−1 d−1, due to which the process efficiency decreased in terms of COD removal rate. Before feeding OLR 16 g COD L−1 d−1, no disturbance was observed during the entire process of co-digestion compared to mono-digestion. Thus, co-digestion was found to be a more stable process concerning the COD removal rate from molasses at a high loading rate. Co-digestion stability was also confirmed by digesting pig manure and molasses alcohol wastewater by Shen et al. [8]. Many others have also reported that co-digestion using animal manures enhances the performance of anaerobic digestion [27,28].

3.2. Methane Contents in Biogas under Different OLR Conditions

In the co-digestion process, the percent of methane contents gradually increased (from 42.50 ± 0.93% to 59.83 ± 0.56%) with increasing OLR from 1.87 to 3.75 g COD L−1 d−1 (Figure 3a). However, when the OLR was increased to 7 g COD L−1 d−1, the methane content decreased to 54.71 ± 1.01%. This could be due to the suppressive effect of high load on the methanogens, since it has been investigated that high OLR showed antagonistic effects on methanogenic communities [29]. However, with a further increase in OLR, a gradual increase in methane content was observed, which suggests that microbial communities become familiar to high load rates. At the increasing OLR from 7 to 9 g COD L−1 d−1, the methane content produced was in the range of 54.31 ± 0.82% to 59.20 ± 0.89%. A relative decrease in methane content was produced (55.79 ± 0.83% to 57.07 ± 1.59%) when the influent rate was 10 g COD L−1 d−1. This was then followed by an increased methane content (64.13 ± 0.52%) at OLR 11 g COD L−1 d−1. The highest methane contents (64.47%) were seen at OLR 12 g COD L−1 d−1, and almost remained stable between 60.88 ± 1.07% to 63.80 ± 0.38% until the influent rate reached its maximum OLR 16 g COD L−1 d−1. In general, variation in the methane content in this study could probably be due to varying concentrations of the OLR as consequences of its effect on the methanogen’s suppression. Similar to our results, De Vrieze et al. [30] obtained high methane content when molasses was digested with kitchen waste at an OLR value lower than 5 g COD L−1 d−1. Moreover, Mu et al. [31] reported a synergistic effect on methane production during co-digestion.
Methanogenic activity in co-digestion presented less variation throughout the process compared to mono-digestion. Figure 3b shows that in mono-digestion during phase I, methane contents produced in mono-digestion were quite comparable to co-digestion. However, in phase II, when RAW was removed and only molasses was used as a substrate for digestion, a decrease in methane contents (54.66 ± 0.87% on day 59 to 52.14 ± 0.71% on day 83) were observed by increasing OLR from 6.8 to 9 g COD L−1 d−1. These findings were quite comparable to the study of Eslami et al. [29]. The decrease in methane content could be due to the high loading rate, which leads the active bacterial community to the substantial VFAs accumulation that causes the process failure [32]. As a result, in phase III, RAW and molasses were again combined and the OLR decreased to reacclimatize the process. This greatly enhanced the methanogenic activity and the resulted methane content observed was in the range of 55.06 ± 1.09 to 61.37 ± 1.06%. In phase IV, the methane contents were quite stable and in the range of 54.19 ± 1.003 on day 111 to 60.47 ± 0.37% on day 147. However, on day 153, the process failed to produce stable methane contents at loading OLR 10 g COD L−1 d−1. This twice decrease in methane contents demonstrates that the digestion efficiency of molasses as a sole substrate depends on the inlet OLR. However, due to load shock in the influent OLR, the system causes low methane contents in the biogas produced. Comparatively, a decrease in methane content was reported by Meng et al. [33] and De Vrieze et al. [23]. Since it is evident from our study that compares to mono-digestion, high methane contents (64.47%) could be produced in the co-digestion at high OLR (16 g COD L−1 d−1). The increased production of methane contents in the co-digestion process can be explained by an easily degradable fraction from the co-substrate, and the well-established methanogens community.

3.3. Impact of Increasing OLR on pH

pH is one of the important parameters for evaluating the efficiency of the anaerobic digestion process. In the first 20 days, the acclimation period, variations in pH values were observed in both the mono-digestion and co-digestion process (Figure 4). The COD removal rate and methane contents were also gradually increased during this time. After the acclimation stage, the pH remained stable throughout the co-digestion process regardless of the continuous increase in OLR. However, in the mono-digestion process, the pH dropped twice, particularly when the OLR reached to 9 and 10 g COD L−1 d−1 (Figure 4). This drop in pH in mono-digestion led to the process of instability. The stability in pH of co-digestion suggests that the process is highly buffered [31]. De Vrieze et al. [23] reported that digesting molasses as a single substrate at high OLR can cause a drop in pH, probably due to high salt contents in molasses or a deficiency in some important micronutrients.

3.4. Detection of VFAs Concentration

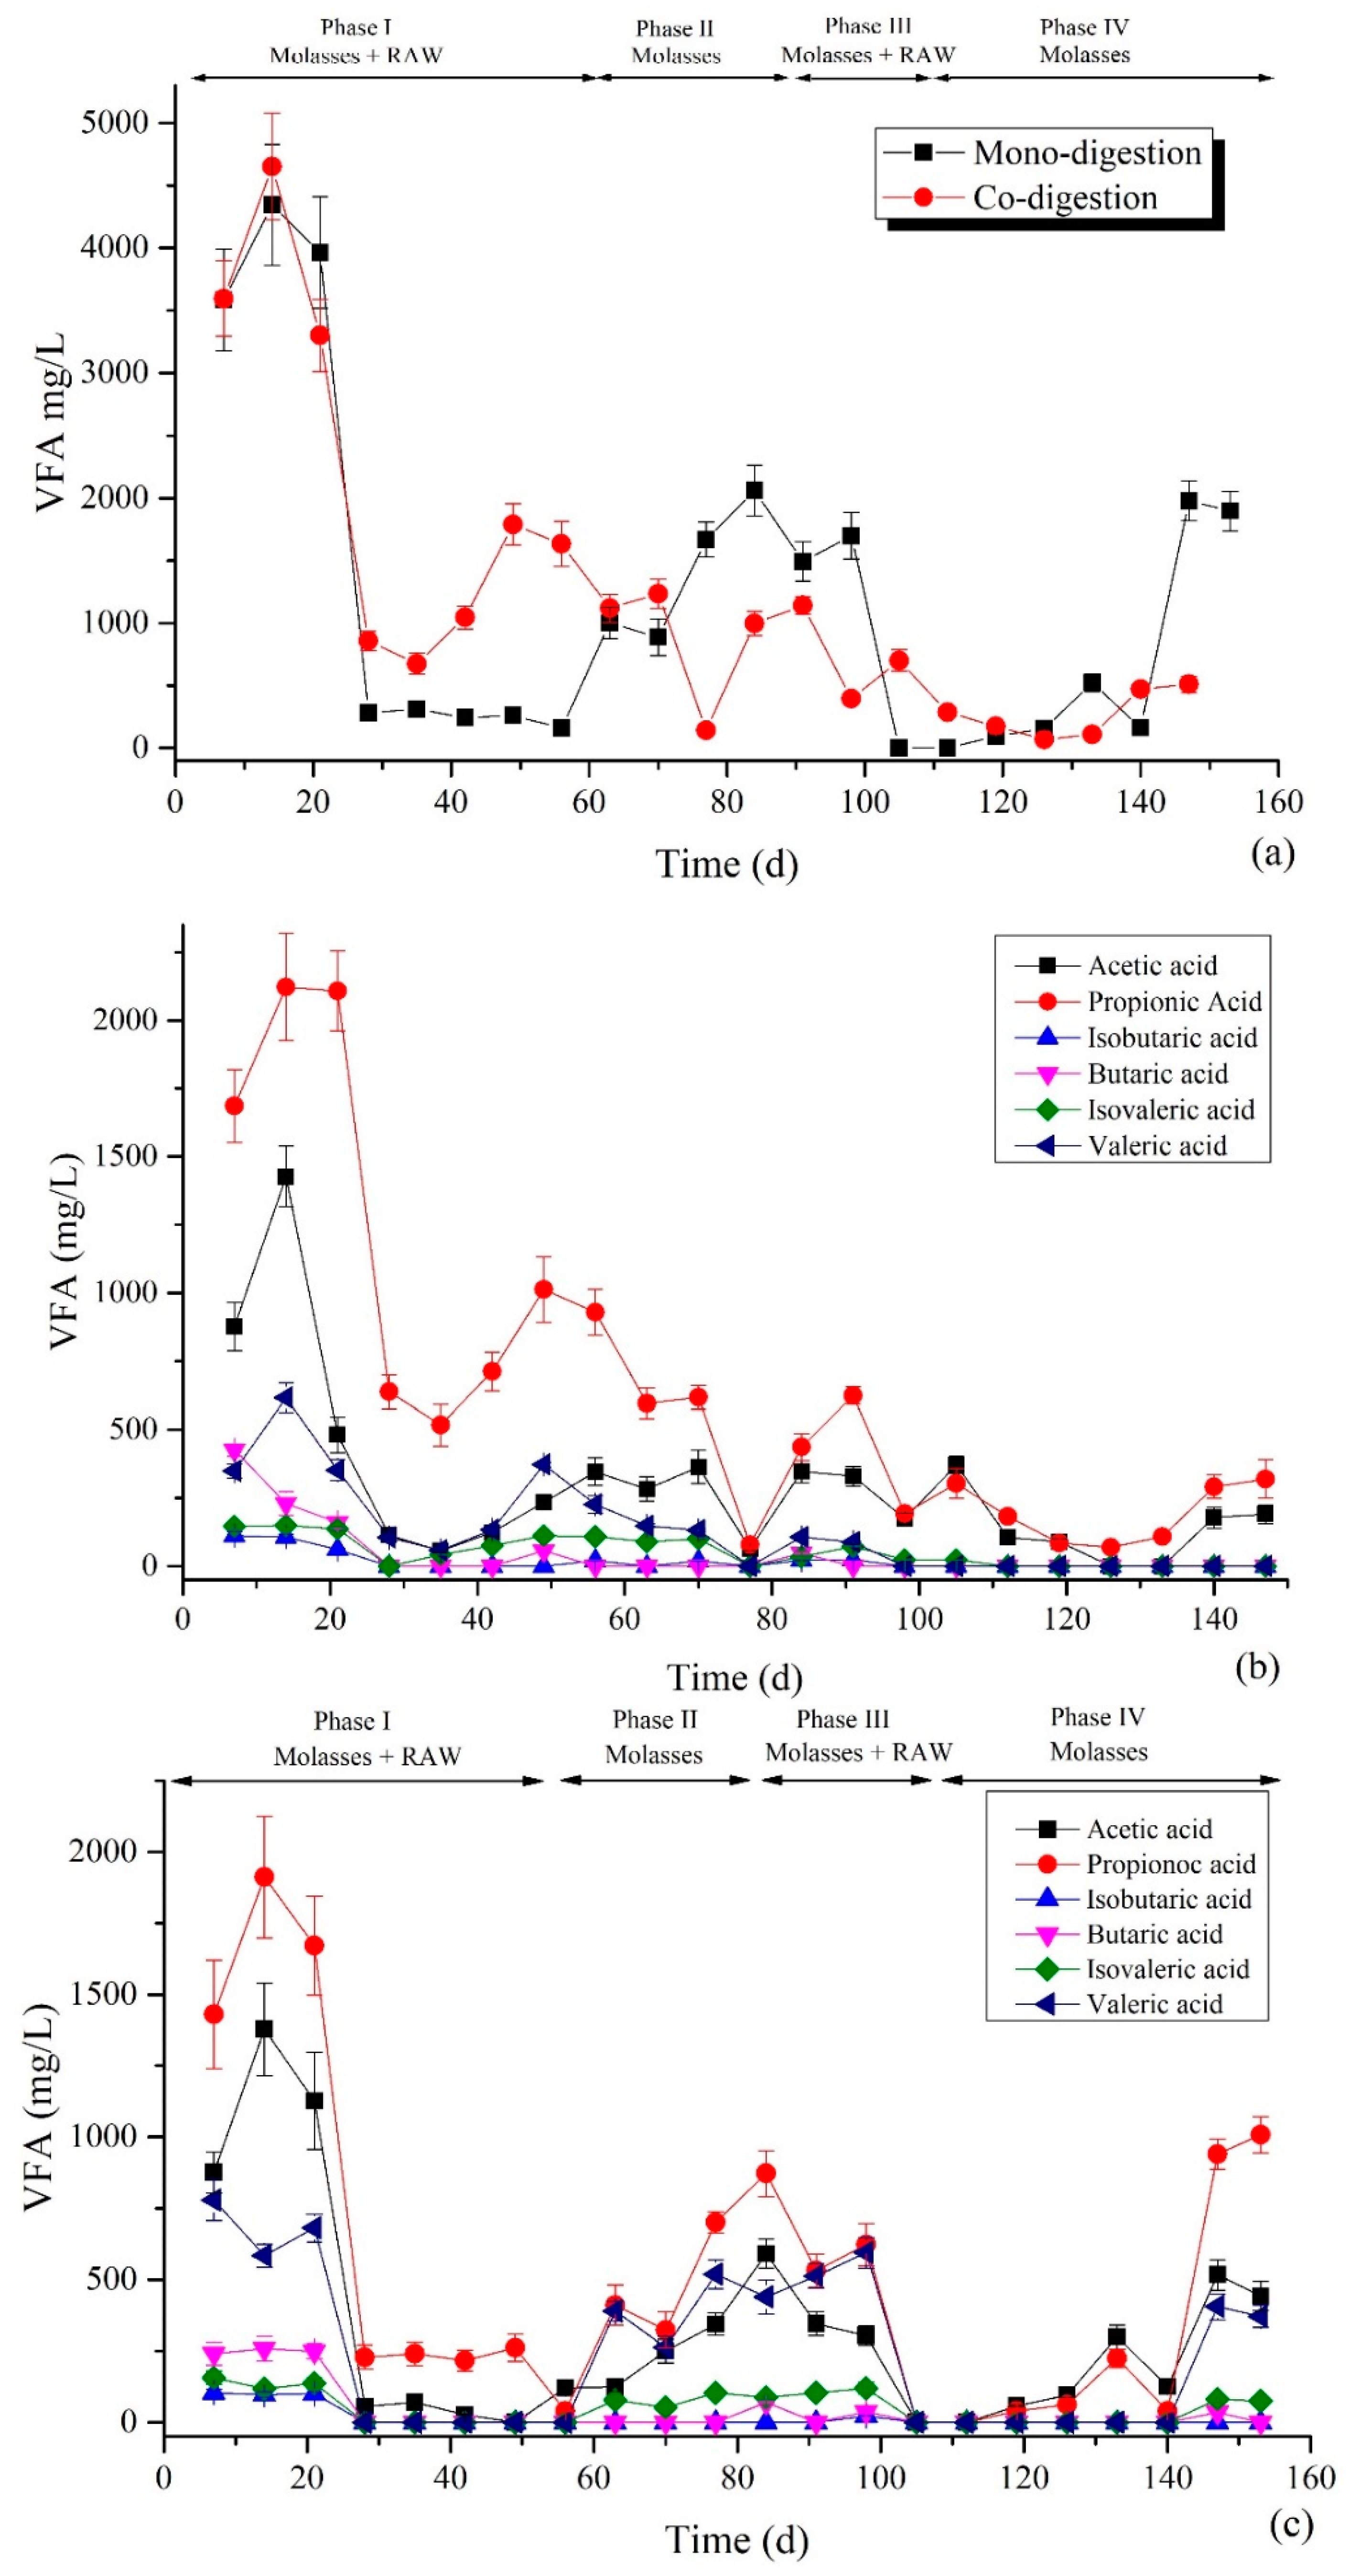
After hydrolysis and the acidogenic phase in anaerobic digestion, the produced VFAs are consumed by methanogens to produce methane and CO2. Total VFA concentrations are shown in Figure 5a. Initially, total VFA accumulation in mono-digestion and co-digestion on day 7 was 3584.75 ± 410.3 mg/L and 3596.96 ± 301.99 mg/L, respectively, followed by an increase to 4344 ± 484.8 and 4653 ± 426.66 on day 14. This rapid VFA accumulation could be due to unbalanced acidogenic, acetogenic, and methanogenic communities [34]. Within the total VFA content, propionic acid and acetic acid were in the highest concentration, followed by Isobutyric acid (Figure 5b,c). However, this did not disturb the process; both processes probably started with a co-substrate with a low OLR 1.87 g COD L−1 d−1. The other possible reason could be the increase in buffering capacity due to co-substrate [35,36]. After the acclimation stage (from day 28 to 56), the total VFA concentration declined in Phase I of mono-digestion and ranged from 159.88 ± 16.25 to 310.81 ± 44.61 mg/L, while in the co-digestion process, a relatively high concentration of VFA (675.93 ± 84.96 to 1633.12 ± 180.26 mg/L) was observed. Furthermore, the mono-digestion process failed twice when the total VFA exceeded 2059.66 mg/L at day 84, and 1896.9 mg/L on the last day (156) of the process. The VFA concentration in co-digestion never reached the inhibitory level. Our results are in agreement with Lee et al. [37] who stated that an alarming concentration of propionic acid is 1000–2000 mg/L, and suggested that exceeding this limit can inhibit methanogens. It was also seen at the inhibitory stages of mono-digestion that acetic acid, propionic acid, and Isobutyric acid were found in their highest concentrations (Figure 5b,c).
Among these acids, propionic acid was produced in high concentrations in both processes, it could be due to the presence of a high abundance of Propionibacteriaceae in bacterial communities (Figure 6a). Propionic acid accumulation has already been reported in the literature for its inhibitory effects, that its higher oxidation is unfavorable for the smooth operation of the anaerobic digestion (AD) process [38]. Lee et al. reported that the accumulation of propionic acid could decrease process performance and lead to process failure [37]. In our study, we confirmed that using molasses as a sole substrate in anaerobic digestion, the monitoring of propionic acid and total VFA should be determined periodically.

3.5. Microbial Community

3.5.1. Sequencing and Microbial Community in Response to Increasing OLRs

A total of 1,677,506 paired reads for the bacterial community was obtained, which were clustered into OTUs based on ≤97% similarity. OTU numbers detected in each sample were in the range of 378 to 494. On the other hand, archaeal community reads were detected in 1,651,713 pairs and after clustering into OTU on basis of ≤97% similarity, the detected OTUs in all samples ranged from 94 to 84. After a continuous increase in the OLR, a clear difference in OTU numbers was observed in each sample of both digestion processes.

Composition of Bacterial Community

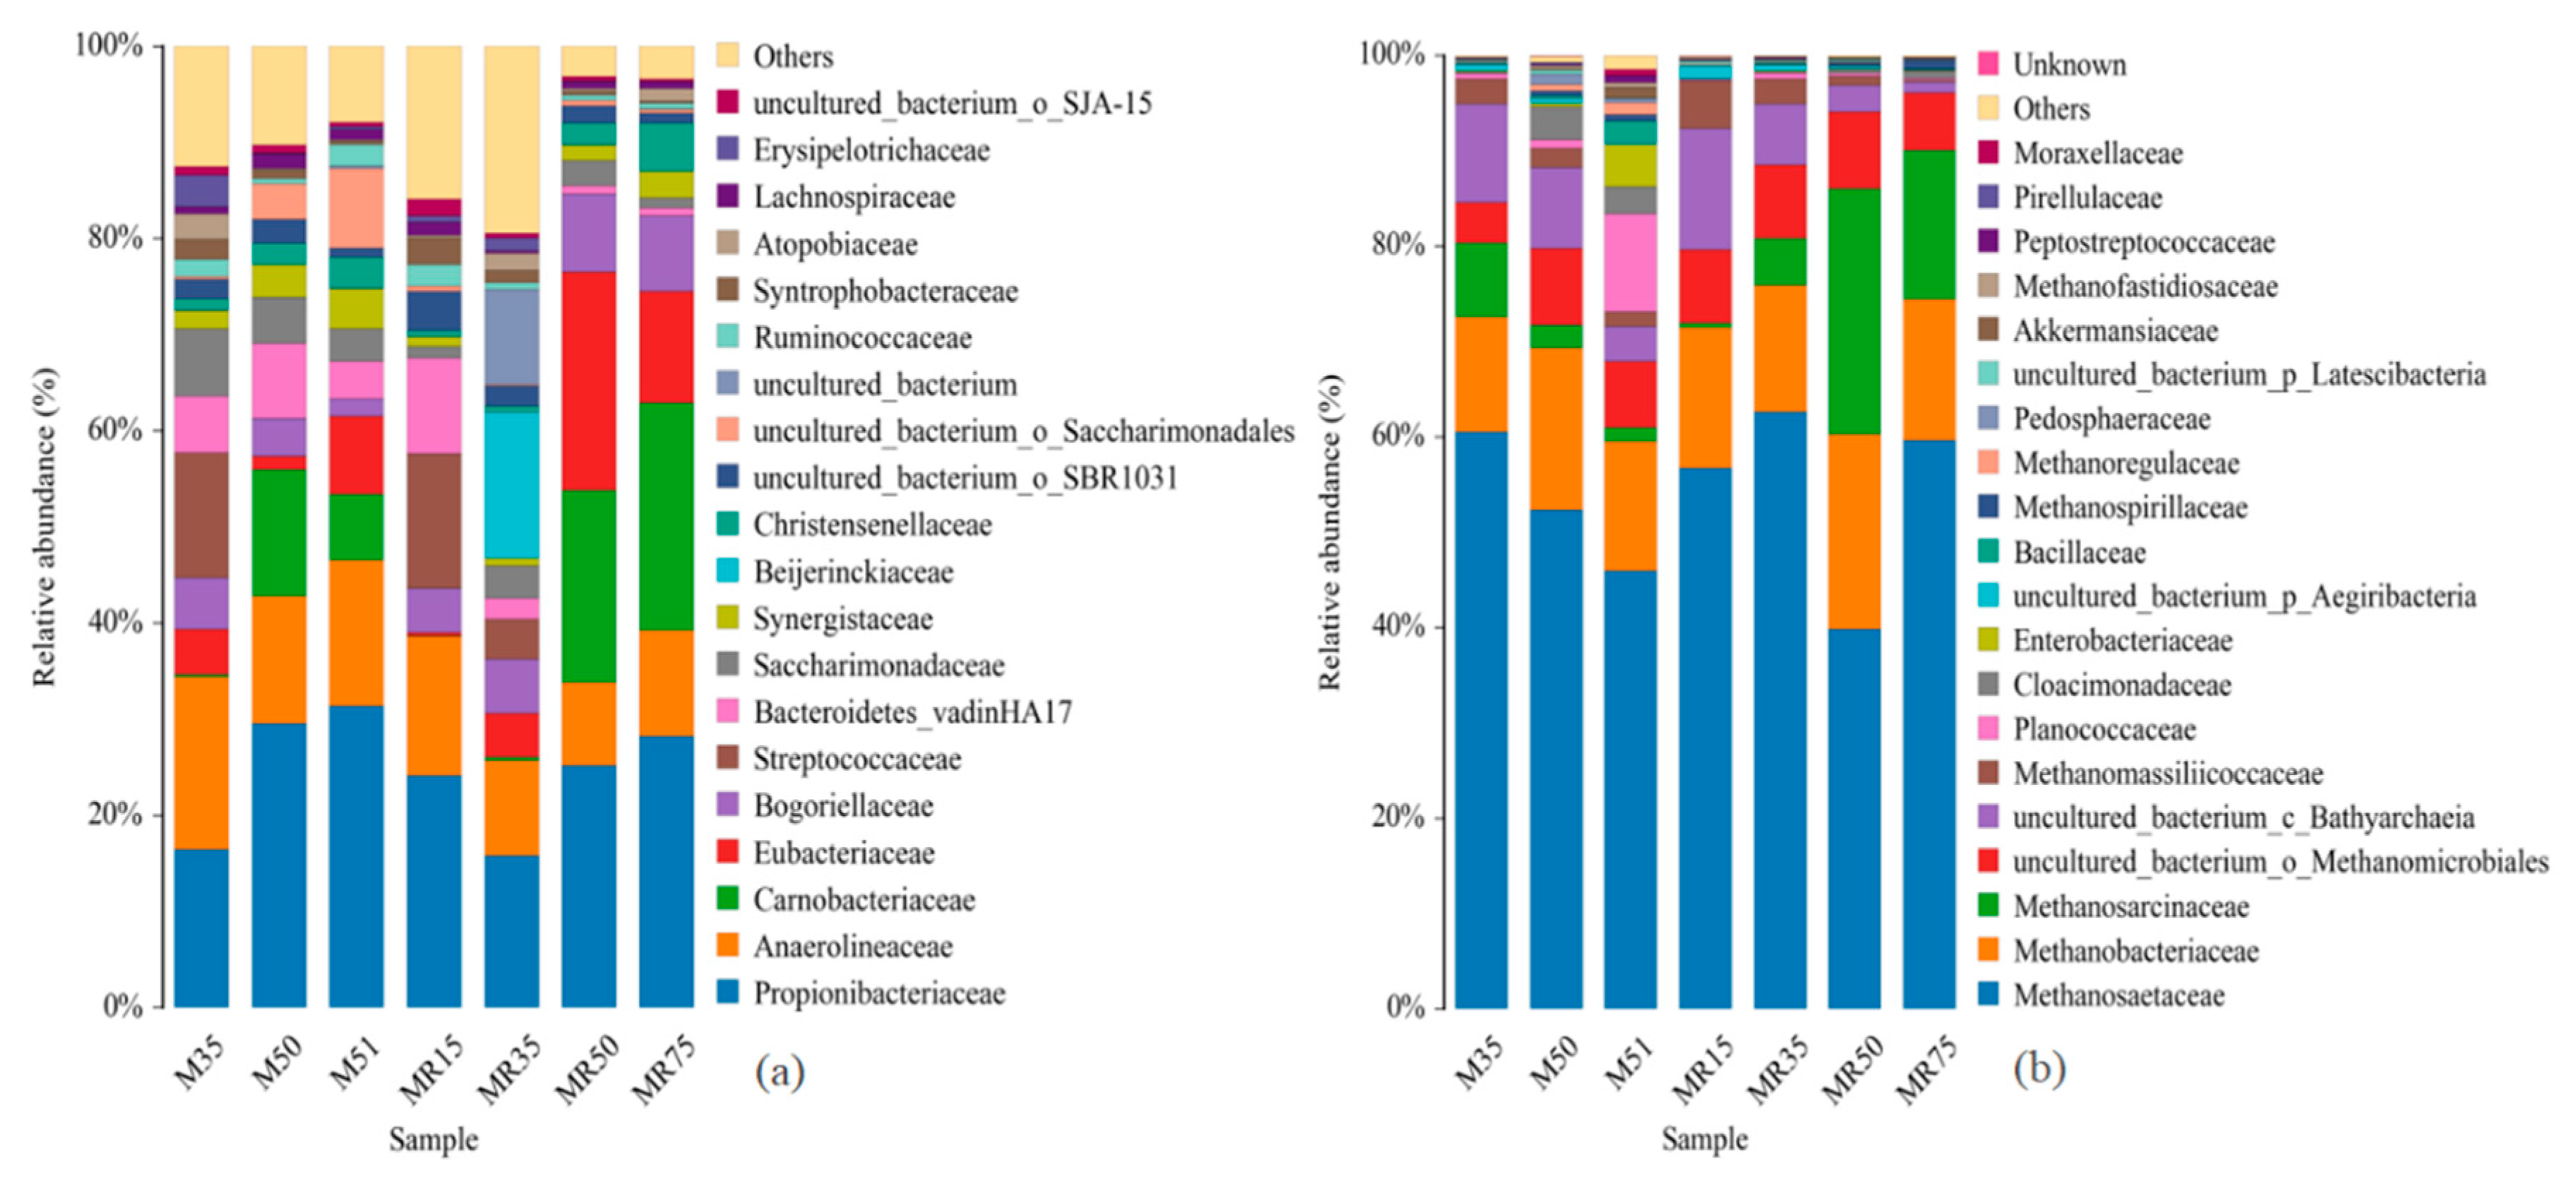
The composition of the bacterial community expressed at the family level classification showed a marked difference in their structure in both mono-digestion and co-digestion processes, and during each particular process (Figure 6a). As mentioned earlier both the processes were started with the same inoculum, and the microbes observed in MR15 (day 0) was dominated by Propionibactereaceae (24.13%) followed by Anaerolinaceae (14.42%), Streptococaceae (14.05%), Bacteriodetes_vadinHA17 (9.91%) and Bogoriellaceae (4.57%). When the digestion process continued, variations in the community were observed in MR35 (day 56) and M35 (day 56). During this time, in MR35 (day 56), an increase in the abundance of Beijerinckiaceae from class alpha-proteobacteria and other uncultured bacterium was observed. Hameed et al. [39] and Zhang et al. [40] identified the genera beijerinckia and other related bacteria from the same family in anaerobic communities in a syntrophic association with methanogens and with stable acetoclastic methanogenesis (74–84%). In contrast to MR35 (day 56), the composition of bacterial communities was quite stable in M35 (day 56) in comparison to day 0 (MR15). A relative decrease in some of the bacterial communities was observed in MR35 and M35 on day 56 such as Propionibacteriaceae (15.77%, 16.4%), Streptococaceae (4.15%, 12.9%) and Bacteriodetes_vadinHA17 (2.12%, 5.88%), respectively, with the increase in the abundance of certain families such as Anaerolinaceae, Eubacteriacea, Beijerinckiaceae and Bogoriellaceae (Figure 6a). This increase and decrease in the abundance of specific families can be correlated with the performance of reactors. A low COD removal rate can be seen in Figure 2 and Figure 3, and methane contents were produced in an early stage of operation. Additionally, the fluctuation in pH and high concentration of propionic acid in the initial days could be attributed to the presence of Propionibacteriaceae in high abundance in both systems. In M35 (day 56) and MR35 (day 56), a remarkable high COD removal rate, methane contents, and low concentration of propionic acid were observed, which can be correlated with a low abundance of Propionibacteriaceae. At the last stages of both mono-digestion on day 153 (M51) and co-digestion on day 129 (MR75), a great difference in microbial compositions was seen. In the mono-digestion process, a twice increase in the abundance of Propionibacteriaceae (31.35%), Carnobacteriaceae (6.92%), and Eubacteriaceae (8.07%) by suppressing other families could be the possible reason for process failure. However, a relative abundance in co-digestion MR75 (day 129) was observed for Propionobacteriaceae, Anaerolinaceae, Carnobacteriaceae, Eubacteriaceae, Bogorielaceae, with their relative abundances such as 28.22%, 10.96%, 23.69%, 11.62%, and 7.80%, respectively, being associated with the good performance of the process. Besides these, some other bacteria were also observed which had an impact on biodegradation.
The relative proportion of bacterial communities responsible for hydrolytic, acidogenic, and acetogenic phases in the digestion process should be co-existed with each other for stable performance. This can be associated with the loading concentration of the influent, which resulted in an increase or decrease in the abundance of specific bacterial communities and led the process to be prone to disturbance, as can be seen from the process upsets in the mono-digestion process and the dynamic changes which occurred in bacterial composition.

Composition of Archaeal Community

The distribution of the archaeal community is shown in Figure 6b. During both digestion processes, the composition and abundance of methanogens varied upon OLRs concentrations. Among all methanogens, Methanosaetaceae and Methanobacteriaceae were dominant in all stages. An increased abundance of Methanosaetaceae and Methanosarcinaceae was seen in M35 (day 56) and MR35 (day 56), which probably decreased the abundance of Methanobacteriaceae. At this stage in the mono-digestion and co-digestion process, methane content in biogas was higher than 55%. This was also accompanied by a good COD removal rate and suggested a good performance of both processes.
On the other hand, in the mono-digestion process at stage M51 (day 153), a decrease in all major methanogens and process performance was observed. This might be associated with the increase in Propionibacteriaceae (Figure 6a) in the digester producing propionic acid (Figure 5c), and could be the cause of suppression of methanogens (Figure 6b). However, a relative abundance of methanogens such as Methanosaetaceae, Methanobacteriaceae, Methanosarcinaceae, and Methanomicrobiales was found to be stable in all stages of co-digestion, with some ups and downs. In general, the whole process performance of co-digestion was better than that of mono-digestion. Methanosaetaceae, the methanogens, can survive at both high and low concentrations of acetate [41]. In both the mono-digestion and co-digestion processes, Methanobacteriaceae was found in all stages and ranged from 12.02% to 20.44%, which is in the line with the work of Gagliano et al. and Ziganshin et al. [42]. Methanobacteriaceae is the primary consumer of formic acids and H2/CO2 substrates for methane formation. The same phenomena were also reported by Lu et al. and Wang et al. [13,14]. In the co-digestion process, Methanosarcinaceae was found to be the second most abundant group after Methanosaetaceae. The members of Methanosarcinaceae are acetoclastic and methanotrophic methanogens, and are capable of using acetic acid, CO2, methanol, and methylamine as substrates for methane formation similar to Methanosaetaceae [14]. The high abundance of Methanosarcinaceae and Methanobacteriaceae in the last two stages of co-digestion confirmed the production of high methane contents.

4. Conclusions

Molasses is a byproduct of the sugarcane industry and is among the attractive sources for biogas production due to its high organic fraction. However, due to its high density and salinity, its anaerobic digestion is difficult. In the current study, we investigated the digestion of molasses utilizing both mono-digestion and co-digestion processes. We have concluded that for byproduct molasses digestion, anaerobic co-digestion was an appropriate process compared to mono-digestion, because of the consistent COD removal rate (90.72 ± 0.63%) and methane contents produced (64.47% ± 0.59%). In addition, in the co-digestion process no single disturbance occurred until the maximum OLR reached 16 g COD L−1 d−1, while in the mono-digestion process, disturbance occurred twice at the maximum OLR 9 and 10 g COD L−1 d−1. This disturbance in the mono-digestion process was due to the increased accumulation of total VFAs (2059.66 mg/L and 1896.9 mg/L), which decreased the COD removal rate and methane contents of biogas. In addition, the composition of the microbial community in the co-digestion process confirmed the presence of hydrolytic and acidogenic bacteria, which co-existed with methanogens compared to in mono-digestion. Overall, co-digestion could potentially be a promising way to digest high strength molasses at a high OLR.

Author Contributions

Conceptualization, S.K. and P.S.; methodology, S.K.; software, S.K.; validation, S.K. and P.S.; formal analysis, F.L., Q.J., C.J. and M.K.; investigation, S.K.; resources, P.S.; data curation, S.K.; writing—original draft preparation, S.K.; writing—review and editing, S.K.; visualization, P.S.; supervision, P.S.; project administration, P.S.; funding acquisition, P.S. All authors have read and agreed to the published version of the manuscript.

Funding

This research was funded by “National Natural Science Foundation of China, grant number 51868003” and “Guangxi Key Research and Development Program, grant number AB16380025”.

Acknowledgments

This work was financially supported by National Natural Science Foundation of China (51868003) and Guangxi Key Research and Development Program (AB16380025).

Conflicts of Interest

The authors declare no conflict of interest. The funders had no role in the design of the study; in the collection, analyses, or interpretation of data; in the writing of the manuscript, or in the decision to publish the results.

References

  1. Scoma, A.; Coma, M.; Kerckhof, F.M.; Boon, N.; Rabaey, K. Efficient molasses fermentation under high salinity by inocula of marine and terrestrial origin. Biotechnol. Biofuels 2017, 10, 23. [Google Scholar] [CrossRef] [PubMed] [Green Version]
  2. Oliveira, C.A.; Fuess, L.T.; Soares, L.A.; Damianovic, M.H.R.Z. Thermophilic biohydrogen production from sugarcane molasses under low pH: Metabolic and microbial aspects. Int. J. Hydrogen Energy 2020, 7, 4182–4192. [Google Scholar] [CrossRef]
  3. Poggi-Varaldo, H.M.; Munoz-Paez, K.M.; Escamilla-Alvarado, C.; Robledo-Narváez, P.N.; Ponce-Noyola, M.T.; Calva-Calva, G.; Rinderknecht-Seijas, N.F. Biohydrogen, biomethane and bioelectricity as crucial components of biorefinery of organic wastes: A review. Waste Manag. Res. 2014, 32, 353–365. [Google Scholar] [CrossRef] [PubMed]
  4. Kongjan, P.; Sompong, O.; Angelidaki, I. Performance and microbial community analysis of two-stage process with extreme thermophilic hydrogen and thermophilic methane production from hydrolysate in UASB reactors. Bioresour. Technol. 2011, 102, 4028–4035. [Google Scholar] [CrossRef] [PubMed]
  5. Keskin, T.; Hallenbeck, P.C. Hydrogen production from sugar industry wastes using single-stage photofermentation. Bioresour. Technol. 2012, 112, 131–136. [Google Scholar] [CrossRef] [PubMed]
  6. Scoma, A.; Rebecchi, S.; Bertin, L.; Fava, F. High impact biowastes from South European agro-industries as feedstock for second-generation biorefineries. Crit. Rev. Biotechnol. 2016, 36, 175–189. [Google Scholar] [CrossRef]
  7. Detman, A.; Chojnacka, A.; Błaszczyk, M.; Kaźmierczak, W.; Piotrowski, J.; Sikora, A. Biohydrogen and biomethane (Biogas) production in the consecutive stages of anaerobic digestion of molasses. Pol. J. Environ. Stud. 2017, 26, 1023–1029. [Google Scholar] [CrossRef]
  8. Shen, P.; Han, F.; Su, S.; Zhang, J.; Chen, Z.; Li, J.; Wu, B. Using pig manure to promote fermentation of sugarcane molasses alcohol wastewater and its effects on microbial community structure. Bioresour. Technol. 2014, 155, 323–329. [Google Scholar] [CrossRef]
  9. Dareioti, M.A.; Dokianakis, S.N.; Stamatelatou, K.; Zafiri, C.; Kornaros, M. Biogas production from anaerobic co-digestion of agroindustrial wastewaters under mesophilic conditions in a two-stage process. Desalination 2009, 248, 891–906. [Google Scholar] [CrossRef]
  10. Calabrò, P.S.; Gori, M.; Lubello, C. European trends in greenhouse gases emissions from integrated solid waste management. Environ. Technol. 2015, 36, 2125–2137. [Google Scholar] [CrossRef]
  11. Calabrò, P.S.; Panzera, M.F. Biomethane production tests on ensiled orange peel waste. Int. J. Heat Technol. 2017, 35, S130–S136. [Google Scholar] [CrossRef]
  12. Li, Y.; Zhang, R.; Chen, C.; Liu, G.; He, Y.; Liu, X. Biogas production from co-digestion of corn stover and chicken manure under anaerobic wet, hemi-solid, and solid state conditions. Bioresour. Technol. 2013, 149, 406–412. [Google Scholar] [CrossRef] [PubMed]
  13. Wang, P.; Yu, Z.; Zhao, J.; Zhang, H. Do microbial communities in an anaerobic bioreactor change with continuous feeding sludge into a full-scale anaerobic digestion system? Bioresour. Technol. 2018, 249, 89–98. [Google Scholar] [CrossRef] [PubMed]
  14. Lu, F.; Jiang, Q.; Qian, F.; Zhou, Q.; Jiang, C.; Shen, P. Semi-continuous feeding combined with traditional domestication improved anaerobic performance during treatment of cassava stillage. Bioresour. Technol. 2019, 291, 121807. [Google Scholar] [CrossRef] [PubMed]
  15. Shah, F.A.; Mahmood, Q.; Rashid, N.; Pervez, A.; Raja, I.A.; Shah, M.M. Co-digestion, pretreatment and digester design for enhanced methanogenesis. Renew. Sustain. Energy Rev. 2015, 42, 627–642. [Google Scholar] [CrossRef]
  16. Vanwonterghem, I.; Jensen, P.D.; Ho, D.P.; Batstone, D.J.; Tyson, G.W. Linking microbial community structure, interactions and function in anaerobic digesters using new molecular techniques. Curr. Opin. Biotechnol. 2014, 27, 55–64. [Google Scholar] [CrossRef]
  17. Wang, P.; Wang, H.; Qiu, Y.; Ren, L.; Jiang, B. Microbial characteristics in anaerobic digestion process of food waste for methane production–A review. Bioresour. Technol. 2018, 248, 29–36. [Google Scholar] [CrossRef]
  18. Werner, T. Next generation sequencing in functional genomics. Brief. Bioinform. 2010, 11, 499–511. [Google Scholar] [CrossRef] [Green Version]
  19. De Vrieze, J.; Verstraete, W.; Boon, N. Repeated pulse feeding induces functional stability in anaerobic digestion. Microb. Biotechnol. 2013, 6, 414–424. [Google Scholar] [CrossRef]
  20. Yu, H.; Zhu, Z.; Hu, W.; Zhang, H. Hydrogen production from rice winery wastewater in an upflow anaerobic reactor by using mixed anaerobic cultures. Int. J. Hydrogen Energy 2002, 27, 1359–1365. [Google Scholar] [CrossRef]
  21. Yu, H.; Gu, G. Biomethanation of brewery wastewater using an anaerobic upflow blanket filter. J. Clean. Prod. 1996, 4, 219–223. [Google Scholar] [CrossRef]
  22. Lukitawesa; Patinvoh, R.J.; Millati, R.; Sárvári-Horváth, I.; Taherzadeh, M.J. Factors influencing volatile fatty acids production from food wastes via anaerobic digestion. Bioengineered 2020, 11, 39–52. [Google Scholar] [CrossRef] [PubMed] [Green Version]
  23. De Vrieze, J.; Hennebel, T.; Van den Brande, J.; Ro’il, M.B.; Bruton, T.A.; Vankelecom, I.F.; Boon, N. Anaerobic digestion of molasses by means of a vibrating and non-vibrating submerged anaerobic membrane bioreactor. Biomass Bioenergy 2014, 68, 95–105. [Google Scholar] [CrossRef]
  24. Fang, C.; Boe, K.; Angelidaki, I. Anaerobic co-digestion of desugared molasses with cow manure; focusing on sodium and potassium inhibition. Bioresour. Technol. 2011, 102, 1005–1011. [Google Scholar] [CrossRef]
  25. Labatut, R.A.; Angenent, L.T.; Scott, N.R. Biochemical methane potential and biodegradability of complex organic substrates. Bioresour. Technol. 2011, 102, 2255–2264. [Google Scholar] [CrossRef]
  26. Pellera, F.M.; Gidarakos, E. Anaerobic digestion of solid agroindustrial waste in semi-continuous mode: Evaluation of mono-digestion and co-digestion systems. J. Waste Manag. 2017, 68, 103–119. [Google Scholar] [CrossRef]
  27. Lateef, S.A.; Beneragama, N.; Yamashiro, T.; Iwasaki, M.; Ying, C.; Umetsu, K. Biohydrogen production from co-digestion of cow manure and waste milk under thermophilic temperature. Bioresour. Technol. 2012, 110, 251–257. [Google Scholar] [CrossRef] [PubMed]
  28. Neshat, S.A.; Mohammadi, M.; Najafpour, G.D.; Lahijani, P. Anaerobic co-digestion of animal manures and lignocellulosic residues as a potent approach for sustainable biogas production. Renew. Sustain. Energy Rev. 2017, 79, 308–322. [Google Scholar] [CrossRef]
  29. Eslami, H.; Hashemi, H.; Fallahzadeh, R.A.; Khosravi, R.; Fard, R.F.; Ebrahimi, A.A. Effect of organic loading rates on biogas production and anaerobic biodegradation of composting leachate in the anaerobic series bioreactors. Ecol. Eng. 2018, 110, 165–171. [Google Scholar] [CrossRef]
  30. De Vrieze, J.; Plovie, K.; Verstraete, W.; Boon, N. Co-digestion of molasses or kitchen waste with high-rate activated sludge results in a diverse microbial community with stable methane production. J. Environ. Manag. 2015, 152, 75–82. [Google Scholar] [CrossRef]
  31. Mu, L.; Zhang, L.; Zhu, K.; Ma, J.; Ifran, M.; Li, A. Anaerobic co-digestion of sewage sludge, food waste and yard waste: Synergistic enhancement on process stability and biogas production. Sci. Total Environ. 2020, 704, 135429. [Google Scholar] [CrossRef]
  32. Rodríguez-Abalde, Á.; Guivernau, M.; Prenafeta-Boldú, F.X.; Flotats, X.; Fernández, B. Characterization of microbial community dynamics during the anaerobic co-digestion of thermally pre-treated slaughterhouse wastes with glycerin addition. Bioprocess Biosyst. Eng. 2019, 42, 1175–1184. [Google Scholar] [CrossRef]
  33. Meng, X.; Yuan, X.; Ren, J.; Wang, X.; Zhu, W.; Cui, Z. Methane production and characteristics of the microbial community in a two-stage fixed-bed anaerobic reactor using molasses. Bioresour. Technol. 2017, 241, 1050–1059. [Google Scholar] [CrossRef]
  34. Capson-Tojo, G.; Rouez, M.; Crest, M.; Steyer, J.P.; Delgenès, J.P.; Escudié, R. Food waste valorization via anaerobic processes: A review. Rev. Environ. Sci. Bio/Technol. 2016, 15, 499–547. [Google Scholar] [CrossRef]
  35. Balussou, D.; Kleyböcker, A.; McKenna, R.; Möst, D.; Fichtner, W. An economic analysis of three operational co-digestion biogas plants in Germany. Waste Biomass Valoriz. 2012, 3, 23–41. [Google Scholar] [CrossRef] [Green Version]
  36. Yang, F.; Li, W.; Sun, M.; Li, Q.; Wang, M.; Sun, Y. Improved buffering capacity and methane production by anaerobic co-digestion of corn stalk and straw depolymerization wastewater. Energies 2018, 11, 1751. [Google Scholar] [CrossRef] [Green Version]
  37. Lee, D.J.; Lee, S.Y.; Bae, J.S.; Kang, J.G.; Kim, K.H.; Rhee, S.S.; Seo, D.C. Effect of volatile fatty acid concentration on anaerobic degradation rate from field anaerobic digestion facilities treating food waste leachate in South Korea. J. Chem. 2015, 2015, 9. [Google Scholar] [CrossRef] [Green Version]
  38. Björnsson, L.; Murto, M.; Mattiasson, B. Evaluation of parameters for monitoring an anaerobic co-digestion process. Appl. Microbiol. Biotechnol. 2000, 54, 844–849. [Google Scholar] [CrossRef]
  39. Hameed, S.A.; Riffat, R.; Li, B.; Naz, I.; Badshah, M.; Ahmed, S.; Ali, N. Microbial population dynamics in temperature-phased anaerobic digestion of municipal wastewater sludge. J. Chem. Technol. Biotechnol. 2019, 94, 1816–1831. [Google Scholar] [CrossRef]
  40. Zhang, X.; Qu, Y.; Ma, Q.; Zhang, Z.; Li, D.; Wang, J.; Zhou, J. Illumina MiSeq sequencing reveals diverse microbial communities of activated sludge systems stimulated by different aromatics for indigo biosynthesis from indole. PLoS ONE 2015, 10, e0125732. [Google Scholar] [CrossRef]
  41. Cui, H.; Su, X.; Wei, S.; Zhu, Y.; Lu, Z.; Wang, Y.; Pang, S. Comparative Analyses of Methanogenic and Methanotrophic Communities between Two Different Water Regimes in Controlled Wetlands on the Qinghai-Tibetan Plateau, China. Curr. Microbiol. 2018, 75, 484–491. [Google Scholar] [CrossRef]
  42. Gagliano, M.C.; Ismail, S.B.; Stams, A.J.M.; Plugge, C.M.; Temmink, H.; Van Lier, J.B. Biofilm formation and granule properties in anaerobic digestion at high salinity. Water Res. 2017, 121, 61–71. [Google Scholar] [CrossRef]
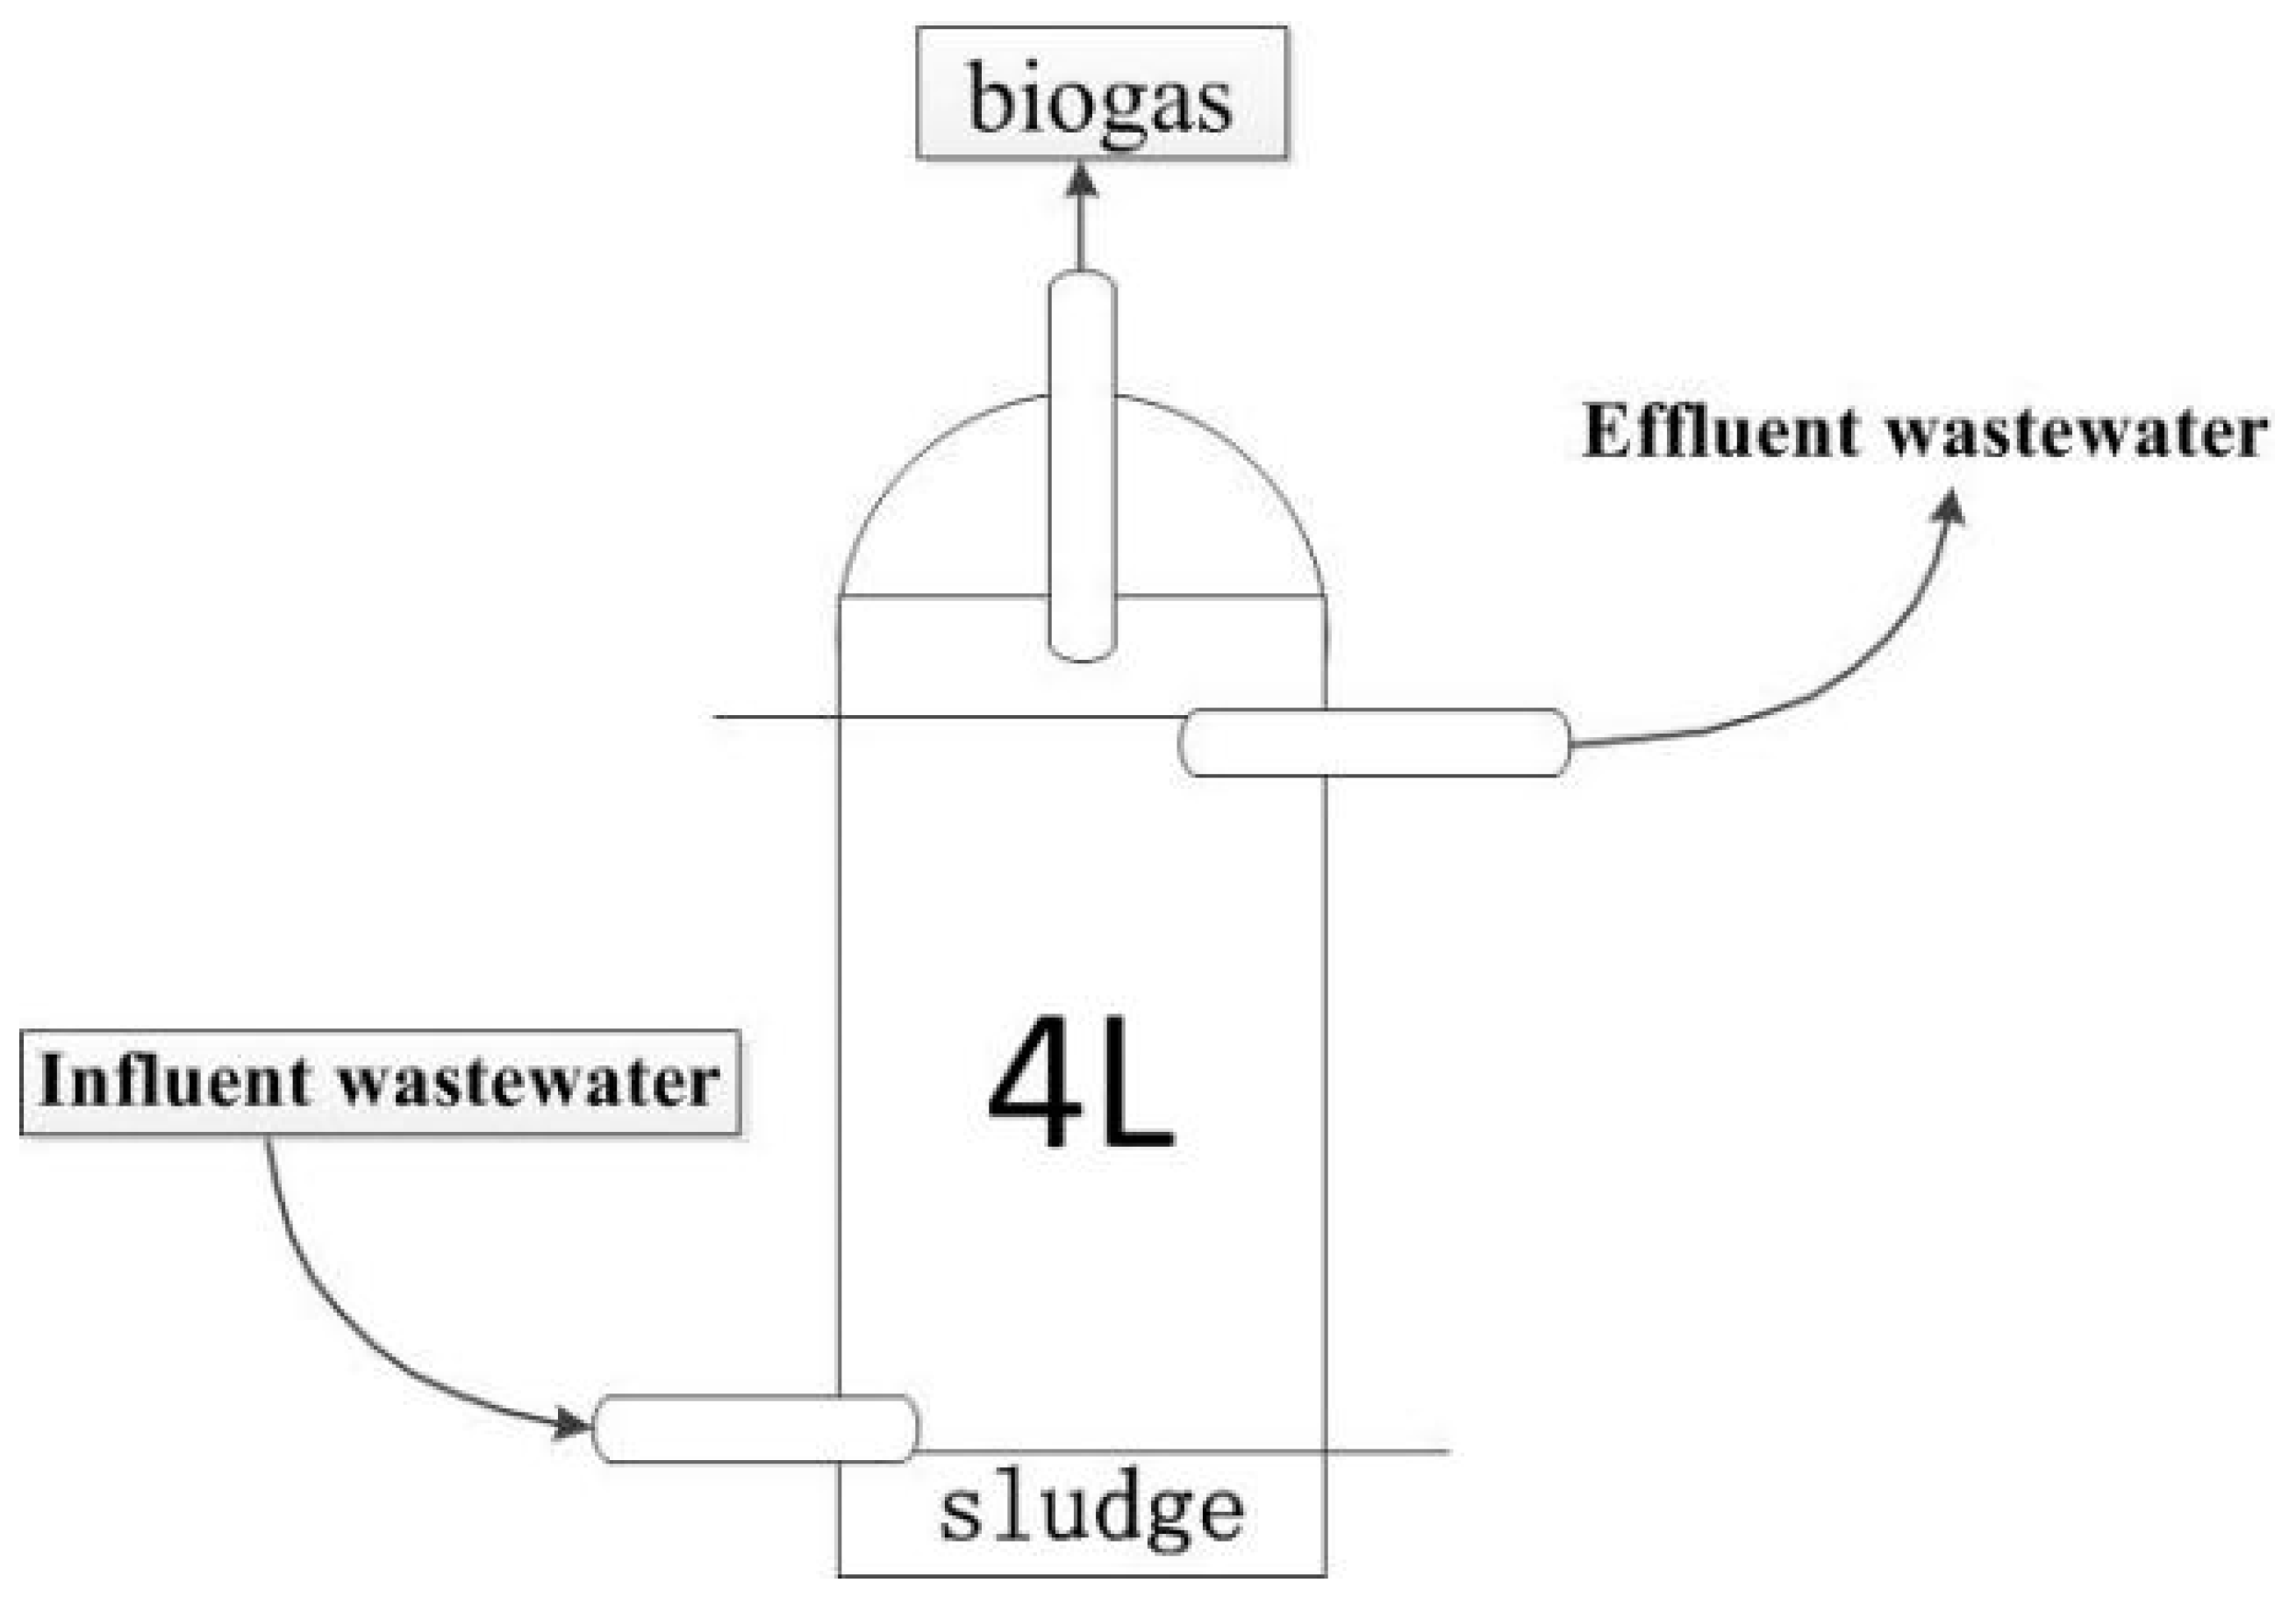
Figure 1. A schematic diagram of anaerobic batch reactor.
Energies 13 04866 g001
Figure 2. (a) Percent chemical oxygen demand (COD) removal rate at increasing organic loading rate (OLR) in the mono-digestion process. Phase I demonstrate the stabilization of the process by digesting molasses and RAW. Phase II expresses the digestions of only molasses. Phase III presents the co-digestion of molasses and RAW to reacclimatize the reaction, and Phase IV showing molasses mono-digestion to assess the process at high OLR. (b) Co-digestion process showing the percent COD removal rate.
Energies 13 04866 g002aEnergies 13 04866 g002b
Figure 3. (a) Percent of methane contents at increasing OLR in the co-digestion process. (b) Percent of methane contents at increasing OLR in the mono-digestion process. Phase I illustrates the acclimatization of the digestion process by co-digestion of Molasses and RAW. Phase II shows the digestion of only Molasses. Phase III presents the acclimatization of the reaction process through co-digestion, while Phase IV only shows molasses digestion to evaluate their efficiency at high OLR.
Energies 13 04866 g003aEnergies 13 04866 g003b
Figure 4. Daily monitoring of pH. Phase I, phase II, phase III, and phase IV above the graph shows the scheme for the mono-digestion process.
Energies 13 04866 g004
Figure 5. (a) Total VFA concentration in both processes. (b) VFAs accumulation in the co-digestion process. (c) VFAs accumulation in the mono-digestion process.
Energies 13 04866 g005
Figure 6. The relative abundance of (a) Bacterial communities and (b) Archaeal communities in mono and co-digestion at different stages. The corresponding samples (M) denote mono-digestion (M35, M50 and M51) and MR denotes co-digestion (MR 35, MR50, and MR75). The sample MR15 was taken at 0 days indicates the startup inoculum for both processes.
Energies 13 04866 g006
Table 1. Characteristics of molasses and Rice alcohol waste water.
COD g/LBOD g/LTNpH
Molasses862.842–935.62486.35–618.461.42–2.25.7–6.2
RAW35–4018.4–21.670.08–0.164.6–5.2
Table 2. Strategy for co-digestion of molasses and rice-alcohol wastewater (RAW) (Operating conditions during co-digestion of molasses and rice-alcohol wastewater. HRT was calculated by using the formula: HRT = V/Flow rate. Where V is the volume of the reactor.
S.No.Run Time (Days) Influent COD(g/L)OLR (g COD/L.d)HRT (Days)Flow Rate (L/d)M:RAW
10–20151.87580.51:1
221–29202.580.51:1
330–38253.1280.52:1
439–4730650.83:1
548–5635750.84:1
657–6540850.85:1
766–7445950.85:1
875–83501050.85:1
984–92551150.85:1
1093–101601250.85:1
11102–111651350.86:1
12112–120701450.86:1
13121–129751550.87:1
14130–147801650.88:1
Table 3. Mono-digestion of molasses: Operating conditions during digestion of molasses (experiment begins with co-digestion). The first 20 days showing the acclimatization phase and up to day 56 showing the evaluation efficiency of the process (Phase I). After day 56, rice-alcohol wastewater was removed to evaluate the mono-digestion of molasses (Phase II). At day 83, the process failed and again rice-alcohol wastewater was added as co-substrate with molasses until it recovered (Phase III). After recovery (day 109), rice-alcohol wastewater was again removed and only molasses was fed to the reactors to evaluate the efficiency.
S.NoRun Time (Days) Influent COD (g/L)OLR (g COD/L.d)HRT (Days)Flow Rate (L/d)M:RAW
10–20151.87580.51:1
221–29202.580.51:1
330–38253.1280.52:1
439–4730650.83:1
548–5635750.84:1
Remove RAW and feed only molasses
657–6535750.81:00
766–7440850.81:00
875–8345950.81:00
Acclimatization of reactors with co-digestion of molasses and RAW
984–8820450.83:1
1089–9825550.84:1
1199–10330650.84:1
12104–10835750.84:1
Remove RAW and feed only molasses
13109–11730650.81:00
14118–12635750.81:00
15127–13540850.81:00
16136–14445950.81:00
17145–153501050.81:00