Article

A Multi-Stage Coordinated Volt-Var Optimization for Integrated and Unbalanced Radial Distribution Networks †

1
School of Electrical Engineering, Shanghai University of Electric Power, Shanghai 200090, China
2
Electric Power Research Institute of State Grid Shanghai Municipal Electric Power Company, Shanghai 200437, China
*
Author to whom correspondence should be addressed.
This paper is an extended version of our paper published in Su, X.; Liu, J.; Fu, Y.; Mi, Y.; Shahnia, F. An Efficient Joint Coordination of Volt-Var Support in Medium and Low Voltage Distribution Feeders. In Proceedings of the 2019 IEEE International Conference on Industrial Technology (ICIT), Melbourne, Australia, 13–15 February 2019.
Energies 2020, 13(18), 4877; https://doi.org/10.3390/en13184877
Submission received: 15 July 2020 / Revised: 24 August 2020 / Accepted: 4 September 2020 / Published: 17 September 2020
(This article belongs to the Section A1: Smart Grids and Microgrids)

Abstract

:
The growing penetrations of rooftop photovoltaics (PVs) into low-voltage (LV) distribution networks are challenging voltage regulation. Developing an effective volt-var (VV) control has been the focus of many researchers with various approaches proposed so far. However, assuming a single voltage level and balanced network model, widely adopted in existing literatures, tends to cause inaccurate and even infeasible control solutions. Besides, existing distribution VV control studies are usually based on the day-ahead predictions of PV generations and loads, introducing inevitable and non-negligible errors. To address the challenges above, this paper proposes a VV co-optimization across unbalanced medium-voltage (MV) and LV networks, by traditional and emerging techniques, to ensure the network operation with the required power quality. Specifically, the operation of MV delta-connected switched capacitors and LV distributed PV inverters is coordinated, under a three-stage strategy that suits integrated and unbalanced radial distribution networks. The proposal aims to simultaneously improve voltage magnitude and balance profiles while reducing network power loss, at the least controlling cost. To effectively solve the proposed VV optimization problem, a joint solver of the modified particle swarm optimization and the improved direct load flow is employed. Finally, the proposal is evaluated by simulations on real Australian distribution networks over 24 h.

Graphical Abstract

1. Introduction

The secure and economic operation of distribution networks can be realized by a suitable volt-var (VV) control. On-load tap changers (OLTCs), switched capacitors (SCs) and voltage regulators (VRs) are the traditional means of VV regulation [1]. However, these mechanical devices often have limited lifetimes and operate on local measurements [2]. With the increasing penetrations of distributed generations (DGs) such as photovoltaics (PVs), the VV control of distribution networks using the latent capacity of DG inverters has attracted great attention worldwide [3]. Comparing with traditional VV devices, DG inverters provide continuous capacitive and inductive reactive supports and have superior transient performance, with no extra investment costs.
In the “smart grid” era, VV optimization by either traditional mechanical devices or emerging DG inverters has proven inadequate. This is because the integration of highly intermittent DGs tends to cause fast voltage fluctuations, leading to frequent operation of traditional devices with a serious lifetime reduction and high maintenance costs [4]. Besides, traditional mechanical devices, which often have a high capacity, can only operate discretely, and may cause local over/under-compensation. In contrast, although DG inverters can provide reactive power continuously, their capacities are constrained by the real power output [5]. Furthermore, most DGs have single-phase connections and their penetrations in the three phases of low-voltage (LV) networks are not balanced. Therefore, coordinated VV optimization by both traditional devices and DG inverters is necessary, considering network unbalance caused by uneven loads and single-phase DGs [6].
So far, many studies have been carried out on distribution VV optimization by coordinating traditional switching devices and DG inverters. Generally, existing schemes are presented in two streams, i.e., decentralized and centralized. In the decentralized scheme, the VV devices are controlled based on local measurements. For instance, a decentralized and adaptive zone-based approach was proposed in [7] to coordinate DG inverters with OLTCs, VRs and SCs, based on the predefined control hierarchies. Considering VV controlling devices, including DG inverters, have different response times, a dual time-scale approach was proposed in [8], where the slow control guarantees the subsequent fast control can maintain voltage security with uncertainties. An online voltage control strategy was proposed in [9] to minimize the operational conflicts between DG inverters and OLTCs or VRs while maximizing the voltage support by DG inverters. In [10], a multi-agent-based distributed algorithm was presented where the optimal settings of VRs and SCs are determined to minimize the network loss and the switching cost of SCs while maintaining nodal voltages within the limits. Decentralized VV control with local variables requires less communication, but is inherently locally optimal, due to the lack of complete system information. In contrast, in the centralized scheme, the optimal settings of VV controlling devices are determined by solving a network-wide optimization problem for the best performance. For example, based on the day-ahead forecasting of loads and DG generations, the optimal dispatching schemes of SCs, DG reactive outputs and OLTC were proposed in [5] and [11] to improve the voltage profile as well as reduce the network losses and the switching costs. A coordinated control of OLTC, wind generators and static var compensators (SVCs) was presented in [12] to regulate voltage and reduce power loss in networks of high wind penetrations. To investigate the impacts of machine-based DGs, a coordination strategy of OLTCs, machine-based DGs and SCs was presented in [13], for minimizing the network loss, voltage deviation and OLTC operation cost. Considering the impacts of different control modes of DG inverters on VRs and SCs, [14] developed a coordinated approach to maximize the overall energy savings by conservative voltage reduction. In [15], a centralized approach was presented for managing voltage constraints in active distribution networks where DG inverters, OLTCs, SCs and remotely controlled circuit breakers are modelled and utilized. A model predictive control approach was proposed in [16], considering load-voltage sensitivities, to determine the tap positions of OLTCs and switching statuses of SCs based on the DG output predictions.
While many studies on distribution VV control have been conducted, some technical challenges still exist. Firstly, to limit the operating times of traditional devices for longer lifetime in networks of high DG penetrations, current practices rely on load and generation forecasting. However, this tends to cause reduced accuracy and even infeasible solutions, due to the inevitable forecasting errors for highly intermittent DGs. Besides, few studies have considered unbalanced and integrated network models simultaneously, causing unreasonable or even infeasible solutions. This is because: (1) Practical distribution networks are unbalanced, as a result of missing line transposition and uneven load allocation. This is of extra importance as most DGs in LV networks have single-phase and random connections. (2) DG penetrations not only impact the LV networks where they are directly connected, but also affect the upstream medium-voltage (MV) networks. Any voltage regulation in either of these networks affects the other. A more effective approach is a joint optimization of the VV controlling devices in both networks.
To address the above technical challenges, the authors have done some preliminary studies. Specifically, reference [17] proposed both reactive power control and real power curtailment as a comprehensive inverter control strategy to improve the operation of three-phase four-wire distribution networks. Based on the natural topology of distribution networks, [18] proposed a hierarchical optimization strategy covering both MV and LV levels, to expand network load capacity and accommodate more renewable connections. Reference [19] presented an online coordination strategy of plugged-in electric vehicles (PEVs) real power charging and reactive power discharging to minimize the network unbalance considering individual node voltage regulation. In [20], the impacts of DG on the optimal power flow were investigated in unbalanced distribution networks. Based on the latent reactive capability and real power curtailment of single-phase inverters, [21] proposed a comprehensive PV operational optimization strategy to improve the performance of unbalanced LV distribution networks with high residential PV penetrations.
Considering the existing technical challenges and based on our previous studies on distribution voltage regulation, this paper proposes a joint optimization of unbalanced, integrated MV and LV networks with high penetrations of single-phase PVs. The preliminary concept has been included in our early conference paper [22], while this study is an extended version with significant and comprehensive improvements in all sections. Specifically, the proposed approach aims to optimally control and coordinate traditional MV three-phase SCs with emerging LV single-phase PV inverters. The formulation looks to optimize the network operation in terms of network power loss, voltage magnitude and balance profiles, under a multi-objective optimization framework. On this basis, a three-stage coordinated control strategy, instead of load and generation forecasting, is presented to limit the switching cost of SCs by employing the PV inverter’s latent capacities. The proposed approach can be employed under a real-time framework discretely with typical intervals such as 15 min, depending on the utility preferences. Finally, the performance of the developed VV control strategy is tested by extensive simulations on real Australian distribution networks over 24 h.
The proposed VV control of this study is compared with existing techniques and our previous research, with the key features and differences summarized and compared in Table 1. From it, the main contributions of this paper are:
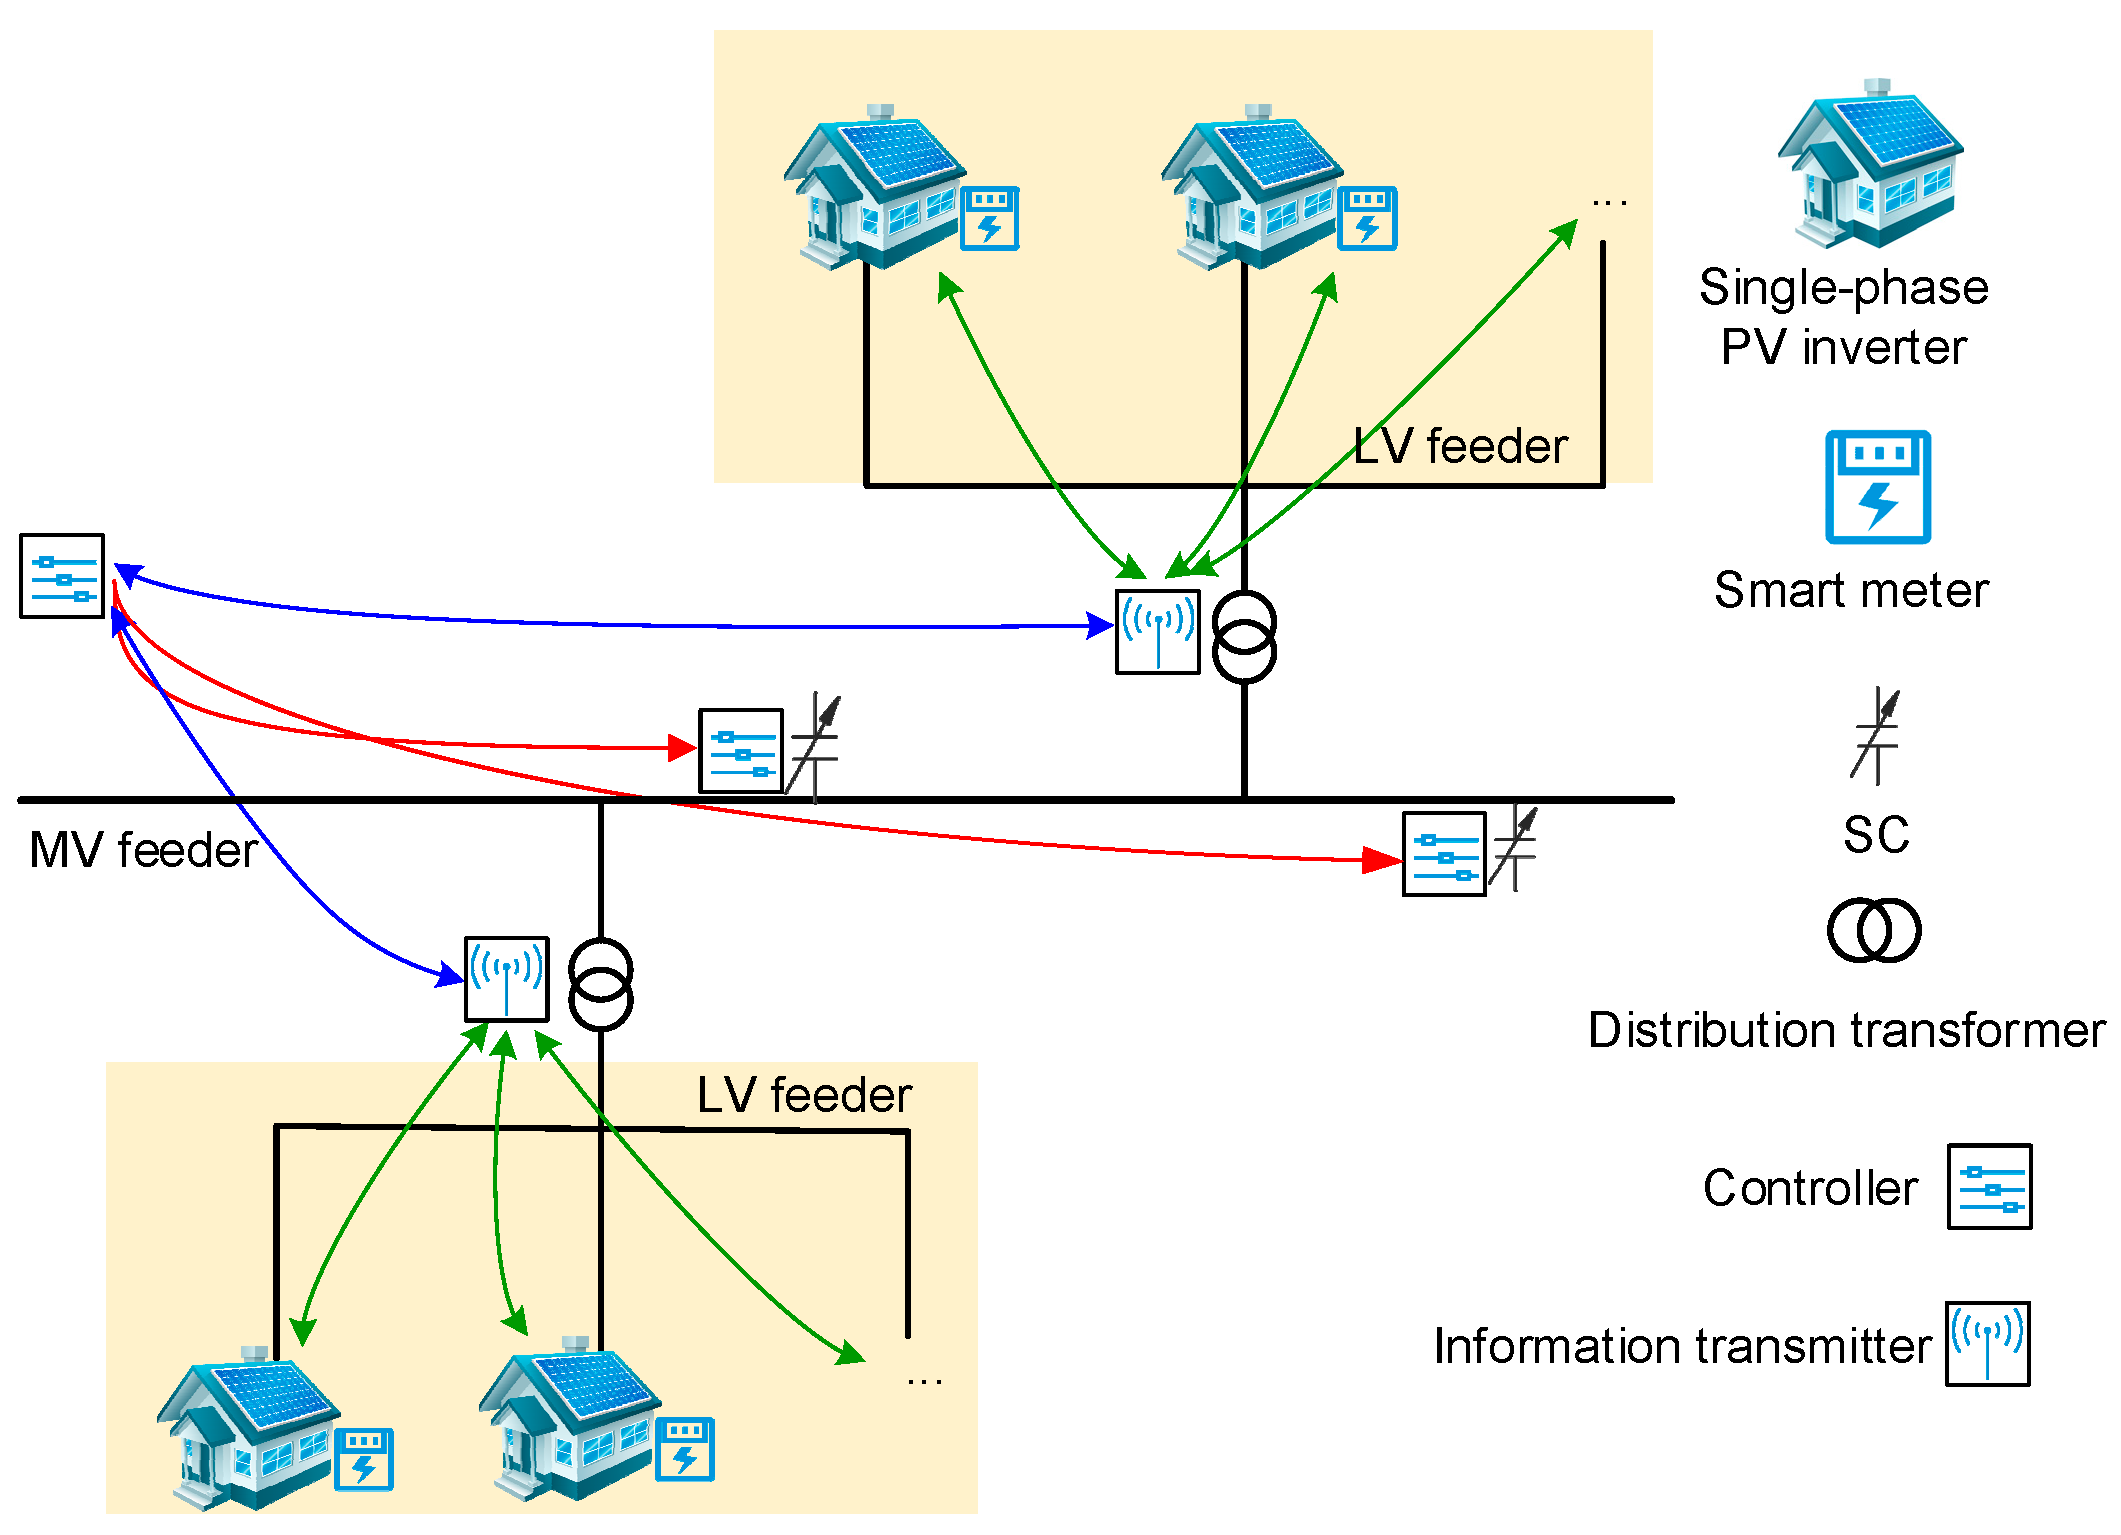
  • Proposing a joint VV control framework that covers unbalanced and integrated MV and LV distribution networks.
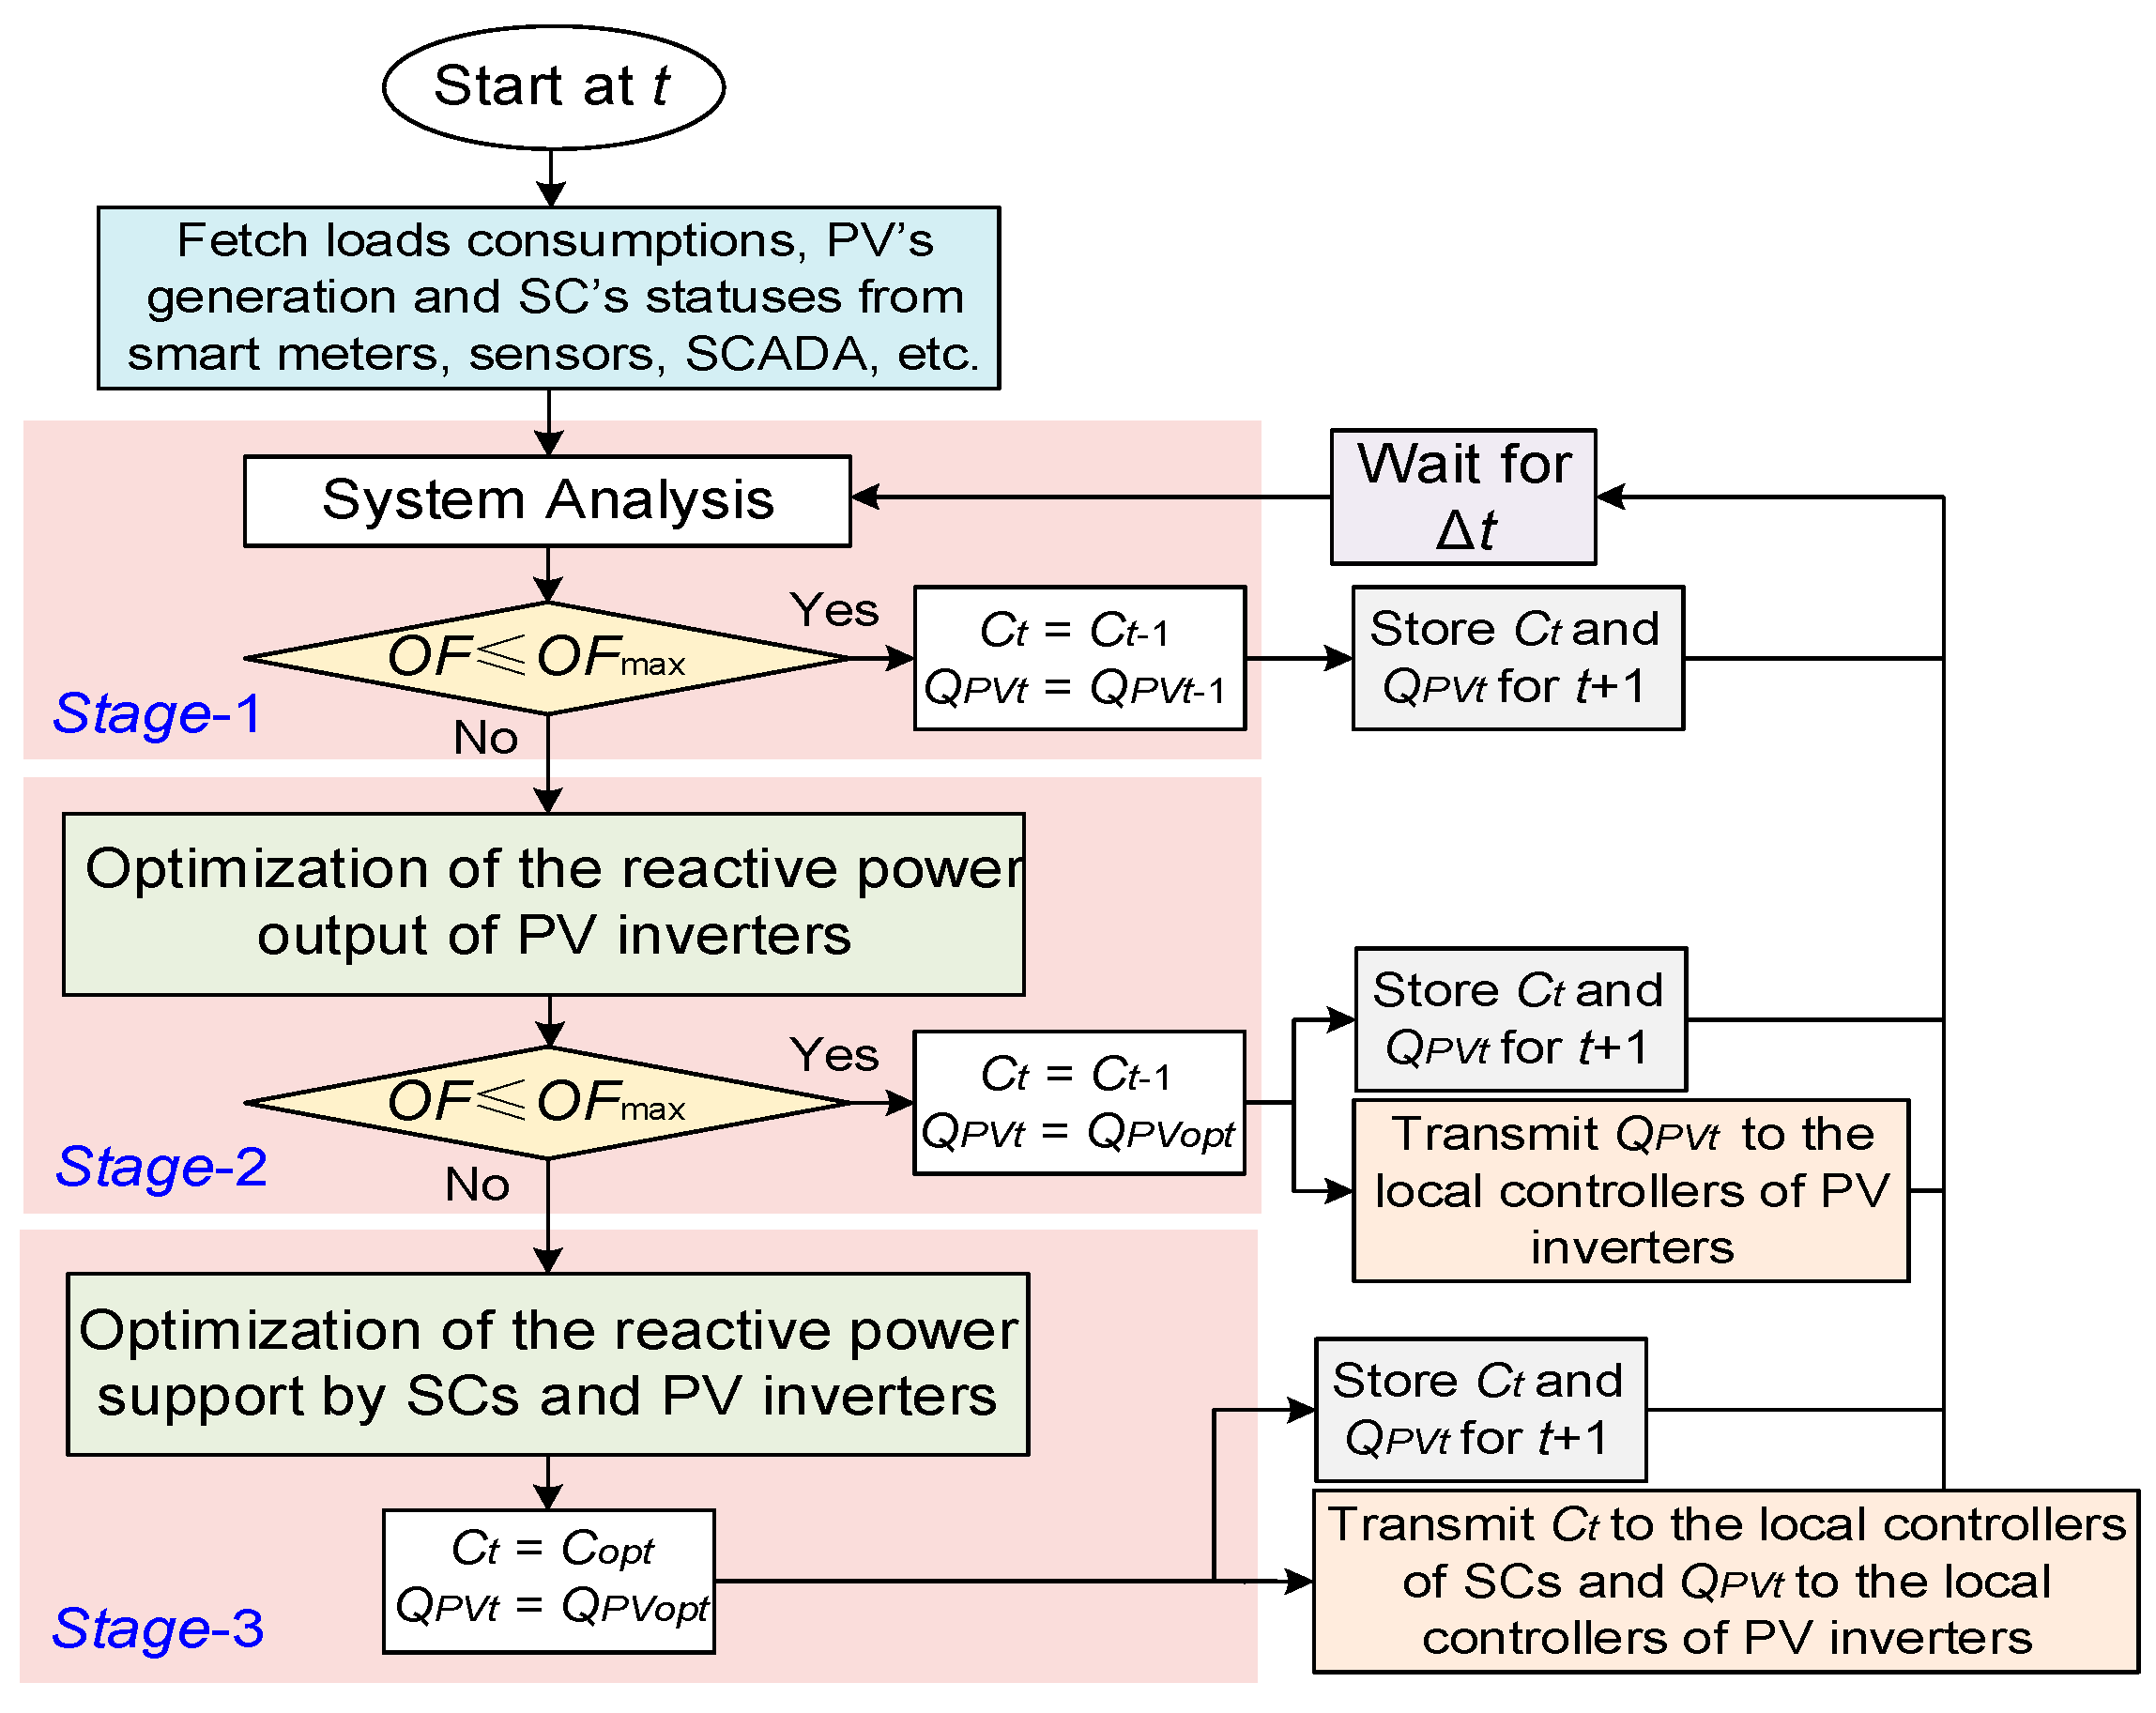
  • Presenting a three-stage strategy that effectively coordinates traditional MV three-phase SCs (high capacity but discrete) and emerging LV single-phase PV inverters (low capacity but continuous).
  • Formulating a multi-objective optimization model that improves the network operation in terms of voltage deviation, voltage unbalance and power loss, as well as the SC switching costs.

2. The Proposal

The key proposal of this study is providing a coordinated and joint VV optimization of single-phase rooftop PV inverters in residential LV networks, and three-phase SCs in MV networks, as illustrated schematically in Figure 1. The SCs have a discrete reactive capability while the PV inverters provide a continuous support. This section firstly introduces the formulated optimization model for the proposed VV control, along with the considered technical constraints. Then, the proposed coordination strategy of MV SCs with LV PV inverters is introduced. The required data computation and communication technologies are also discussed at the end.

2.1. Proposed VV Optimization Formulation

The distribution VV optimization usually involves multiple mutually conflicting objectives. For example, reactive compensation can improve network voltage profile, but overcompensation may lead to more serious power loss. To ensure a reasonable solution, multiple objectives are defined and discussed below:
Network Power Loss: To minimize network power loss, an objective J 1 is considered as:
J 1 = l = 1 N 1 p = 1 3 P L o s s l p
where N is the total bus number of the integrated MV and LV networks while l { 1 ,   ,   N 1 } and p { A ,   B ,   C } are, respectively, the branch and phase numbers. As this study is based on an unbalanced network model, both the branch number l and the phase number p are needed to identify a node. Accordingly, P L o s s l p is the power loss in phase p of branch l , obtained from
[ P L o s s l A P L o s s l B P L o s s l C ] = [ R AA R AB R AC R BA R BB R BC R CA R CB R CC ] [ I l A 2 I l B 2 I l C 2 ]
where R p p and I l p are correspondingly the resistance of the branch and the current passing through. Note that for a 3-phase 3-wire MV network, the off-diagonal elements of the resistance matrix are zero while they are non-zero for a 3-phase 4-wire LV network due to the Kron reduction [23].
Voltage Magnitude Profile: To ensure the voltage magnitude always remains within the utility desired range of [ V lower , V upper ] , a dead band-based objective of J 2 is defined as:
J 2 = i = 1 N p = 1 3 V i p 2
where
V i p = { V lower V i p V i p < V lower 0             V lower V i p V upper V i p V upper V i p > V upper
and i { 1 ,   ,   N } is the bus number.
Voltage Unbalance Profile: To ensure network unbalance within an acceptable range, a dead band-based objective of   J 3 is formulated as:
J 3 = i B u s V U F i 2
where
V U F i = { V U F i V U F upper             V U F i > V U F upper 0 otherwise
V U F i is the voltage unbalance factor at bus i and calculated from the IEEE recommended definition of the magnitude ratio of the negative-sequence voltage versus its positive sequence [24]; V U F upper denotes the maximum allowed VUF in the network while B u s represents the set of all three-phase buses of the integrated MV and LV networks.
For multi-objective optimization problems, a solution that minimizes all the objectives simultaneously does not exist. Among existing techniques, the weighted sum method is widely used to reflect decision makers’ preference [25] and hence is used in this study to form the overall objective function O F as:
O F = m = 1 3 ω m   J m s f m
where ω m is the weighting of objective J m . In practice, these weightings can be flexibly selected to meet specific operation requirements while it is recommended that they are set such that m = 1 3 ω m = 1 and   ω m 0 [19]. The value of a weighting is significant not only relative to other weightings, but also to the magnitude of its own objective. Thus, when using weightings to reflect the preferences, each objective is divided by a scale factor s f m = max ( J m ) so that they all have similar magnitudes and no objective dominates [25].

2.2. Technical Constraints

The minimization of Equation (5) on an unbalanced and integrated distribution network is subject to the technical constraints
P P V i p P L i p P N i p = 0
Q P V i p + Q C i p Q L i p Q N i p = 0
V min V i p V max
and the boundaries on the decision variables
S P V i p 2 P P V i p 2 Q P V i p S P V i p 2 P P V i p 2
0 Q C i p Q C i max p
The equality constraints of Equations (6) and (7) denote the power balance at bus- i , where P P V i p ( Q P V i p ) , P L i p ( Q L i p ) and P N i p ( Q N i p ) are the active (reactive) power of the PV inverter, load and the network while Q C i p is the phase reactive injection by a SC, respectively. Besides, the inequality constraint of Equation (8) depicts the voltage boundary limit set by network operators. Moreover, the reactive capacities of PV inverters and SCs are given by Equations (9) and (10), in which S P V i p is the rating of PV inverter while the per-phase SC reactive capacity is Q C i max p .

2.3. Proposed Coordination Strategy

As discussed above, if the daily operation limit of SCs is not considered, the VV control becomes impractical while the common practice of load and generation forecasting usually leads to inevitable errors. To apply the proposed VV optimization model for practical scenarios, a coordination strategy is proposed to constrain the SC’s daily operation times. As give in Figure 2, the three-stage strategy is discussed below:
Stage 1: The proposed strategy first assesses the integrated network’s status at any time t , based on the measured data of loads and PV outputs, and the SCs setting from the previous time   t 1 . The present value of O F is determined from Equation (5), and then compared with a pre-set threshold O F max . If   O F O F max , the network operation is satisfactory with the inherited SCs settings, which will be maintained and passed to the next moment t + 1 . As such, no other control is needed. Otherwise, the network operation is found to be undesirable and the strategy proceeds to Stage 2.
Stage 2: If undesirable operation is detected at Stage 1, the proposed strategy then determines the optimal reactive outputs of PV inverters to work with the inherited SCs settings. If the determined O F becomes smaller than O F max , the network operation is satisfactory. In this case, the inherited SCs settings will be maintained and passed to t + 1 while the new settings of reactive support by PV inverters are passed to local controllers for execution. However, if it fails, the proposed strategy proceeds to Stage 3.
Stage 3: If undesirable operation is detected after Stage 2, the proposed strategy will determine the optimal reactive outputs of PV inverters and the new settings of SCs simultaneously. The determined values will then be maintained for t + 1 and passed to the local controllers for execution.
As power loss and voltage magnitude and unbalance deviations tend to be more serious at the LV side, the introduced cost-effective PV inverter reactive control can significantly improve the network operation while reducing the switching cost of SCs. This strategy guarantees the cost-effective operation of the system when the determined O F is less than the preset O F max . O F max can be flexibly adjusted to balance the network operation and the control cost of SCs, demonstrated in Section 4.

2.4. Required Computation and Communication

The developed VV control can be realized on industrial-level processors and their associated platforms (such as those from National InstrumentsTM (NI, Austin, TX, USA) [26], Intel® (Intel, Santa Clara, CA, USA.) [27], and Analog DevicesTM (ADI, Norwood, MA, USA) [28]), which are currently available in the market and can meet the required speed and complexity. Moreover, the implementation of the introduced technique for real-time control of distribution networks assumes the wide availability of bi-directional information and communication technology (ICT). This assumption is credible as with the increasing connections of PVs, batteries and electric vehicles, traditional distribution networks are gradually transformed into ‘smart grids’. Actually, at present distribution network operation is already supported by various ICTs, e.g., supervisory control and data acquisition systems, energy management systems, distribution management systems, advanced metering infrastructures and phasor measurement units, which will be further upgraded and expanded with the ongoing investments made by utilities and governments [29,30].
It is to be noted that the required measurements in this study include the outputs of PV inverters and load, as well as the on/off switching statuses of SCs. These data will be based on digital measurements (such as smart meters for loads and PVs, and sensors that denote the status of SCs) with acceptable accuracies. It is expected that measurement errors for the proposed strategy to be negligible. That said, if errors exist in data collection and communication, their impacts will be limited and still acceptable. This is because, as described in Section 2.4, the execution of the proposed VV control is based on the O F , which is comprehensively defined as the weighted sum of network loss J 1 , voltage deviation J 2 and voltage unbalance J 3 . Additionally, the high-performance computing techniques of [31] can be used to minimize the impacts, if applicable.

3. Problem Solution

The formulated O F of Equation (5) includes discrete decision variables for the reactive injections of SCs, and continuous variables for the reactive outputs of PV inverters. Thus, solving Equation (5), subject to constraints of Equations (6)–(10), is a typical mixed-integer nonlinear programming problem. Many analytical and heuristic approaches have been proposed to solve such problems. In this study, a combined solver of the modified particle swarm optimization (MPSO) method and the direct load flow (DLF) algorithm is employed. Specifically, the MPSO method is an improvement variant of PSO where the mutation of genetic algorithm is introduced with a predefined probability to enhance the search exploration and exploitation [32]. The performance of MPSO has been proven for complex and nonlinear optimization problems, e.g., long-term distribution network planning in [33]. Performance comparison of MPSO against the original PSO, genetic algorithm and simulated annealing for distribution network planning in [34] shows a superior efficiency and robustness. In this paper, MPSO is employed to optimally determine and update the settings of MV SCs and the reactive outputs of LV PV inverters. Figure 3 illustrates the considered particle (i.e., the set of decision variables by the MPSO), where Q C i denotes the reactive supply by SC i while superscripts A, B and C denote the MV phases.
The network performance needs to be evaluated for each MPSO particle, which can be realized by load flow. In this paper, the DLF algorithm has been employed, which is an improved variant of the popular backward/forward sweep method for load flow analysis of integrated and unbalanced distribution networks [35]. The DLF supports the MPSO by determining the fitness, i.e., power loss and voltage magnitude and unbalance deviations for all MPSO particles. Figure 4 illustrates the solution flowchart of the employed joint solver of MPSO and DLF.

4. Performance Evaluation
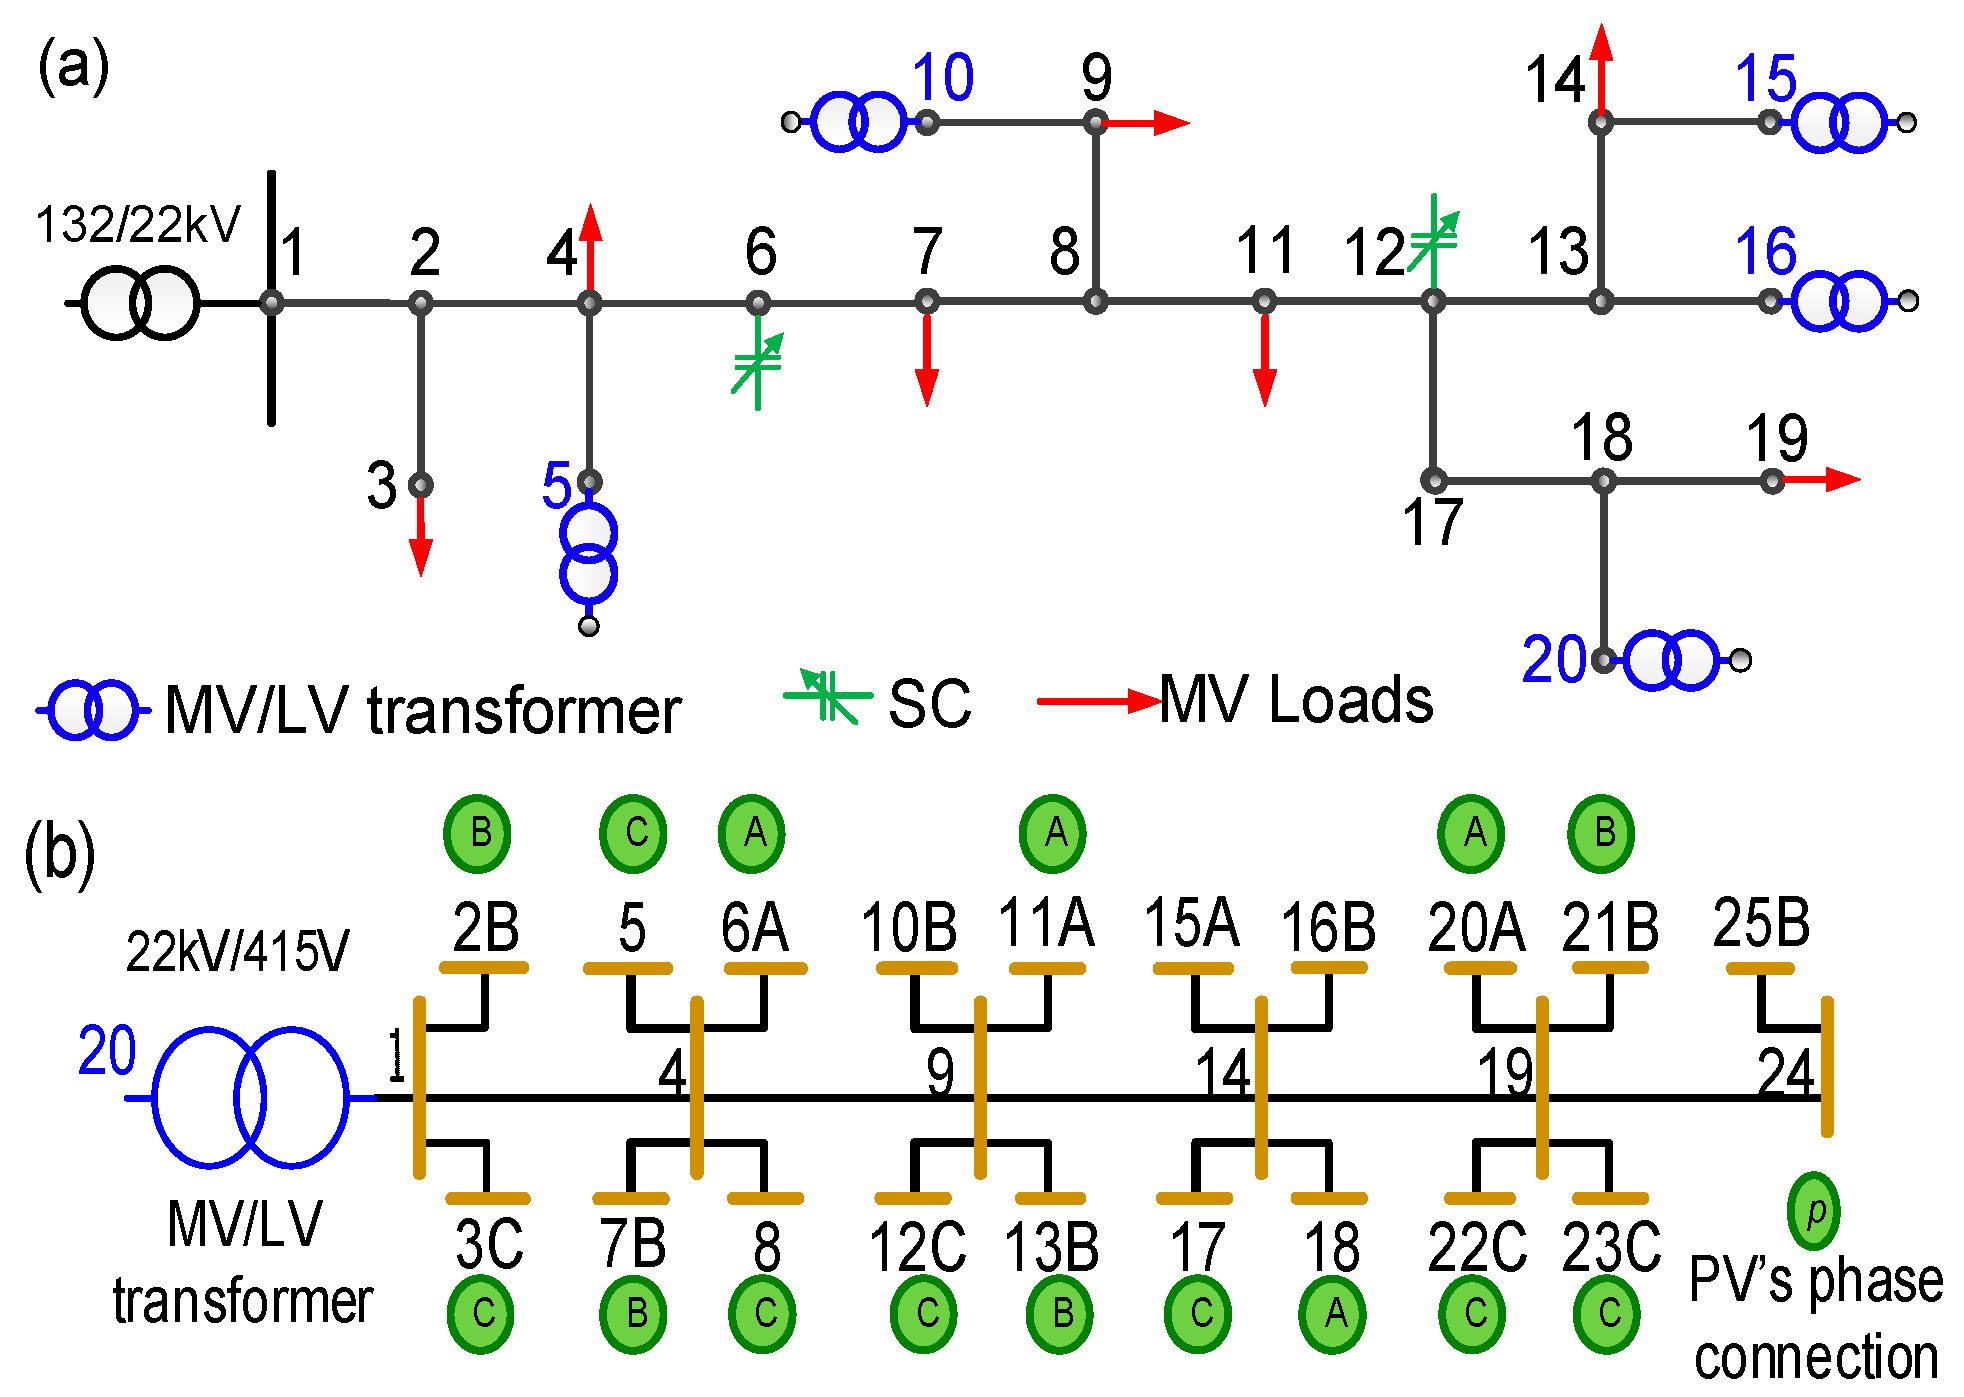
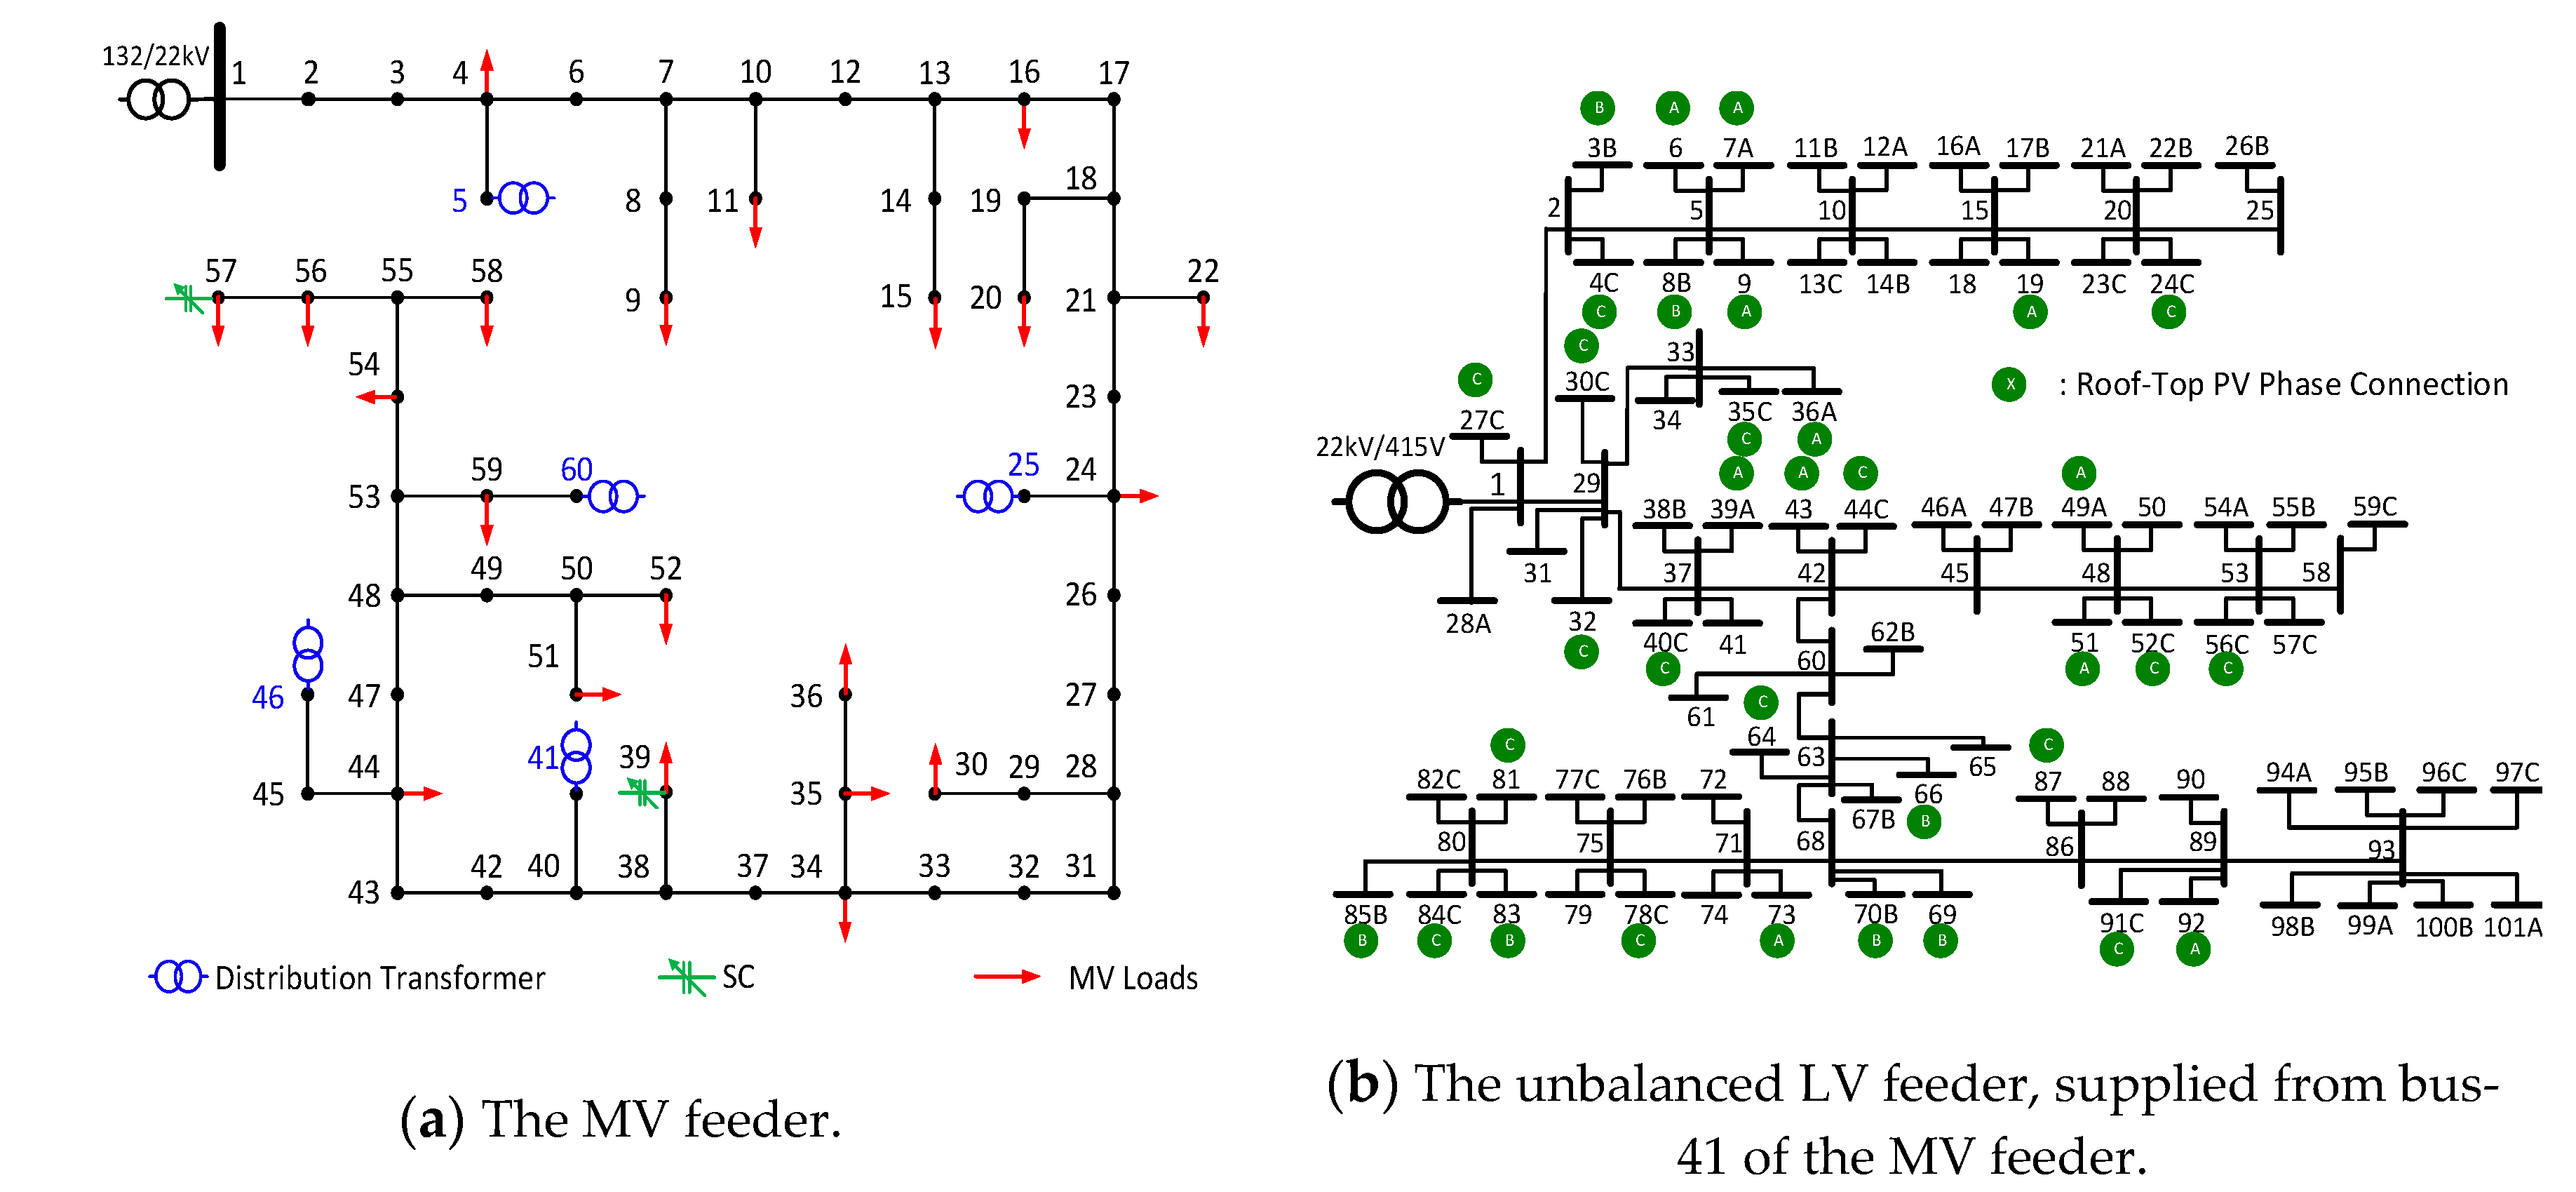
This section evaluates the performance of the proposed VV control of integrated and unbalanced distribution networks, by coordinating MV SCs and LV PV inverters.

4.1. Test Network

A real Australian distribution network (Perth Solar City [36]) is analysed in this paper, over a typical 24 h period. Figure 5a illustrates the 22 kV MV feeder that supplies five LV feeders by 22 kV/415 V Dyn11 distribution transformers at buses 5, 10, 15, 16 and 20, with a total of 145 buses. The MV feeder is unevenly loaded with the peak load of 0.94, 1.39 and 1.56 MW for phase A, B and C, respectively. Two 250 kvar delta connected SCs, with tap sizes of 50 kvar, are installed at MV buses 6 and 12. Figure 5b illustrates the unbalanced LV feeder connected to MV bus-20, as an example. As can be seen, the LV feeder is supplied by a 200 kVA transformer and includes 25 buses and 19 consumers. Among them, 15 consumers have single-phase PV connections with typical sizes of 4.77, 5.64 and 6.3 kW. PV generations and the statuses of SCs, are collected every 15 min, with the support of SCADA and smart meters, across the integrated networks.

4.2. Simulation Parameters and Cases

The weightings of ω 1 , ω 2 and ω 3 in Equation (5) are set, respectively, as 0.5, 0.3 and 0.2, giving the highest priority to loss reduction, followed by voltage magnitude and voltage unbalance. It is worth noting that those weightings are not fixed, network operators can set according to their preferences. Moreover, the deadband limits of V upper and V lower are set as ± 6 % while V U F upper set as 2% to be in line with the IEC standard [23]. Moreover, O F max is set as 0.284; thus, the proposed multi-stage strategy will be triggered if O F > 0.284 in Stages 1 and 2. In addition, to ensure MPSO’s search exploration and exploitation, the particle size, iteration number and inertia weight are set as 10,000, 50 and [0.9 0.4], respectively, with the mutation probability of 0.7.
As for the simulation cases, the proposed VV control consists of three stages, which are triggered sequentially. A reference case, referred to as ‘Original’, is also simulated, based on the considered network status assuming no reactive support from SCs and PV inverters. These four cases form the vertical simulation setting of this study. While the proposed VV control demonstrates different response in different moments with various operation status, simulations over 24 h are also performed in this study, which forms the horizontal simulation setting.

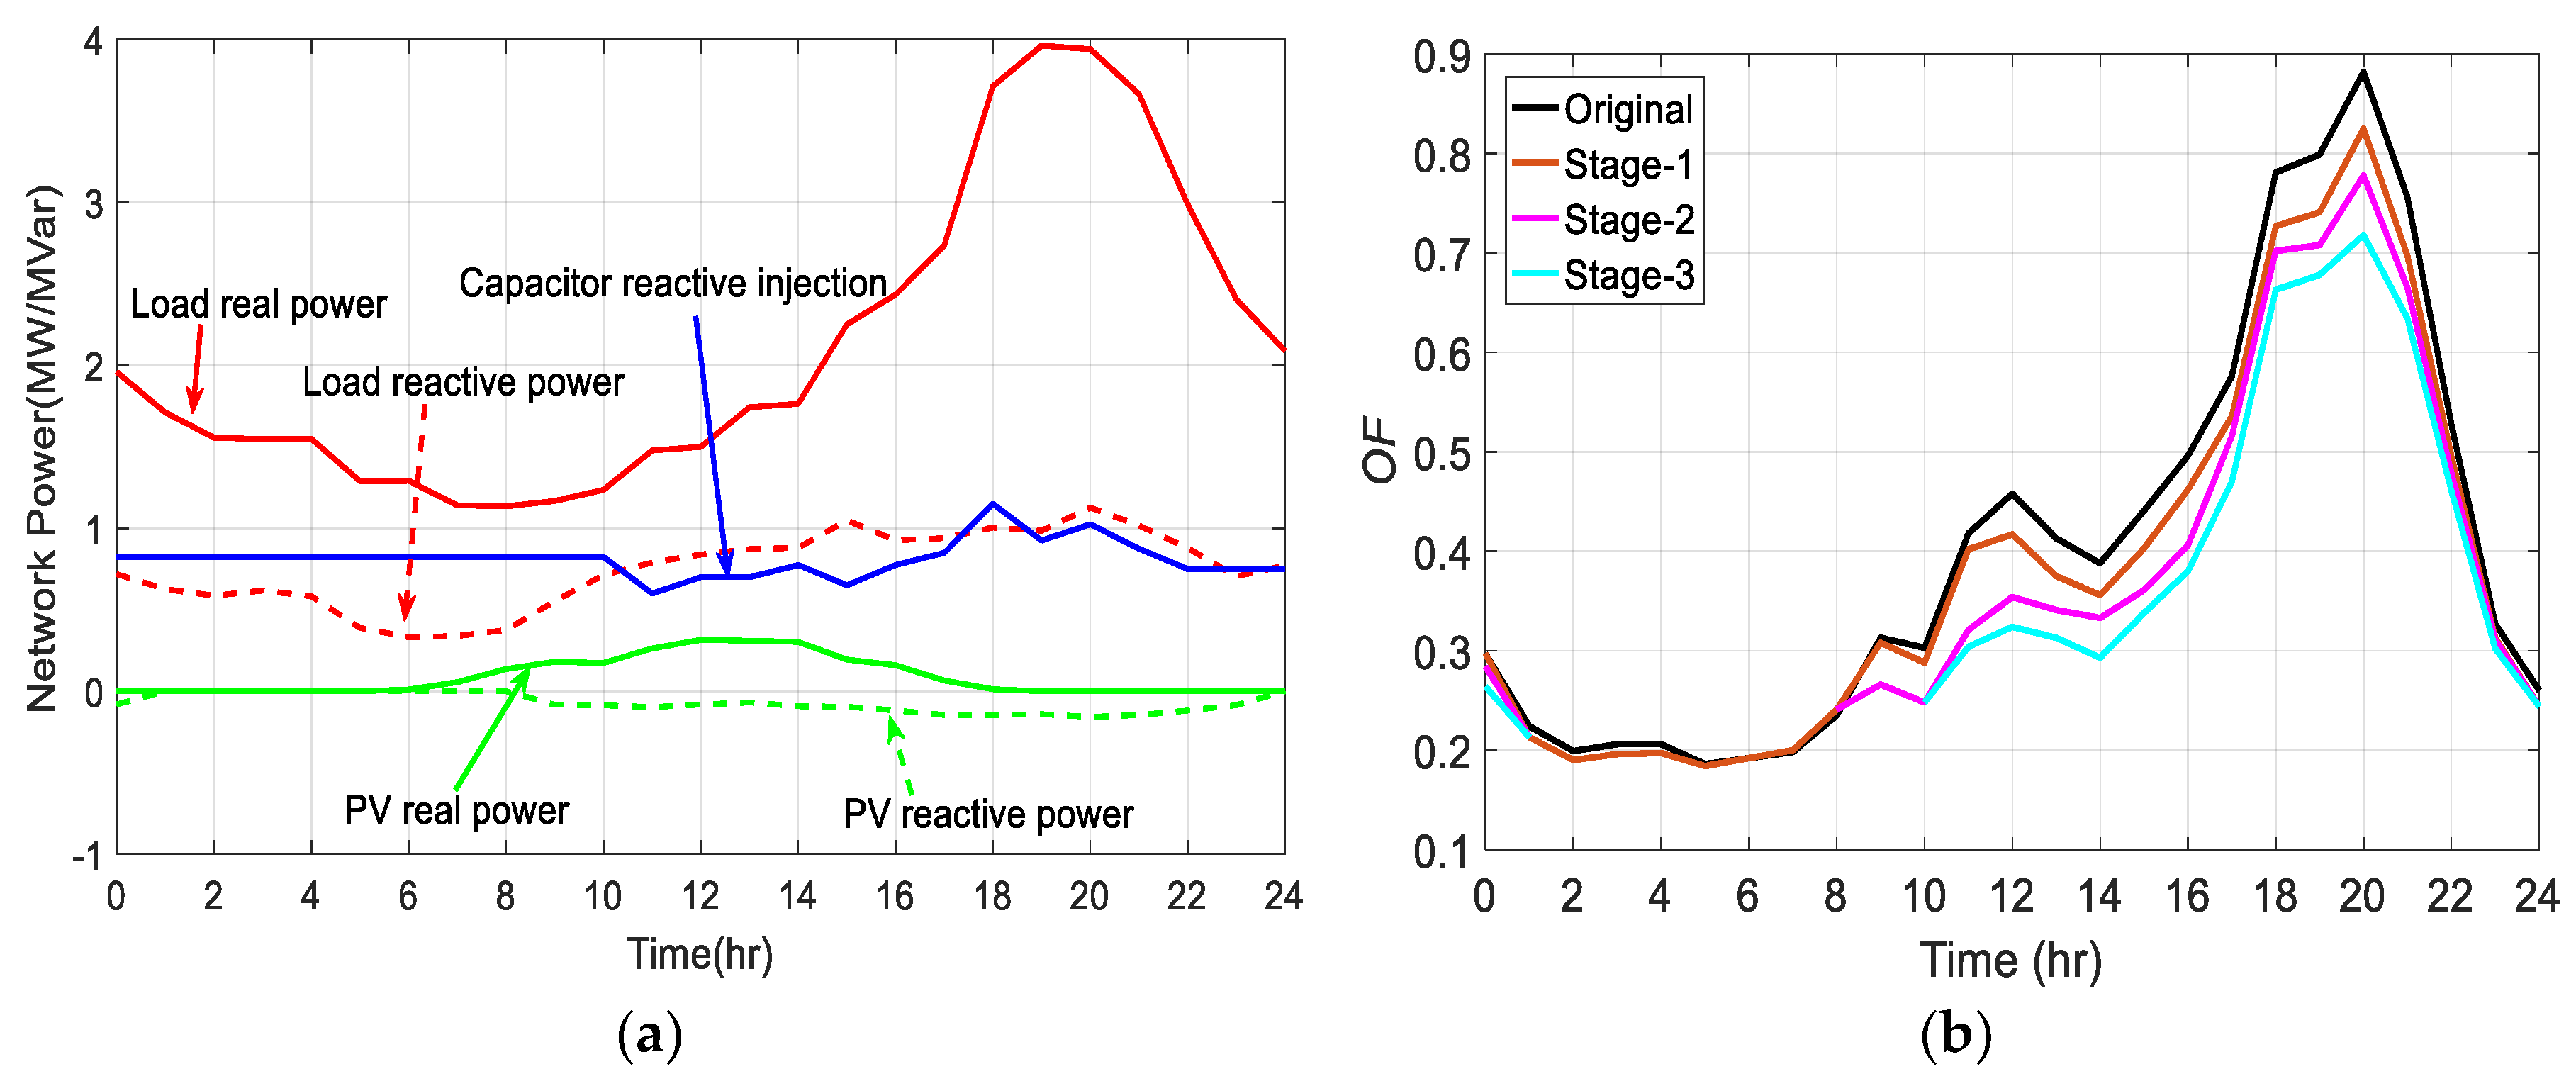
4.3. Simulation Results and Analyses

As illustrated in Figure 6a,b and Table 2, the network operation is originally poor and prone to serious losses, voltage deviation and unbalance, especially during the peak load period (i.e., 17:00–22:00) and the peak PV generation period (i.e., 10:00–15:00), as is evident from the large values of J 1 , J 2 and J 3 in those periods. Now, let us put the developed optimal VV control in operation. At the starting hour (i.e., 00:00), the network operation is found to be poor with the O F of 0.297, exceeding O F max of 0.284. As such, Stage 2 of the developed strategy is activated to determine the optimal reactive support by PV inverters. As seen from Figure 6b and Table 2, the network operation improves with the decrease of O F to 0.285, which however is still higher than the given threshold. Thus, Stage 3 is then triggered which helps settling of O F at 0.264, below the threshold. The determined optimal setting for SCs is then passed to the next hour (i.e., 01:00), as the inherited setting.
In the following hours between 01:00 and 08:00, O F is maintained below the threshold of O F max by the inherited settings of SCs, without engaging the other two stages. During this period, the network operation deteriorates at some points (denoted by red background in Table 2) but still remains acceptable, as the setting of SCs inherited from 00:00 causes overcompensation with the load decreasing. Then, between 09:00 and 10:00, as the load starts to increase, the reactive support by the inherited SC settings fails to meet the network operation requirements, leading to the activation of Stage 2 of LV PV inverters regulation. This reduces the O F at these hours from 0.308 and 0.288 to 0.266 and 0.248, respectively. Over the following hours 11:00–23:00, the network operation deteriorates with the O F above the threshold O F max , as a result of high PV generations around noon and heavy evening demand. Thus, all the three stages of the developed control technique are activated sequentially to improve the network operation. Figure 7 shows the optimal reactive injection by the MV SCs and the LV PV inverters, after applying the proposed strategy over 24 h. For example, peak PV generation and moderate load at 12:00 causes reverse load flow and poor operation, with the O F of 0.458. The developed three-stage technique reduces the O F to 0.417, 0.354 and 0.324, respectively, as seen from Table 2. Another example is at 20:00 when the network observes the peak demand but no PV generations (see Figure 6a). By the MV SCs and LV PV inverters reactive power, as the PV inverters have higher reactive capacity at this time, more reactive power can be used to alleviate the poor network operation. As seen from Table 2, the O F decreases from 0.882 to 0.825, 0.778 and 0.718, respectively, after each stage control.
In this study, it is set that ω 1 > ω 2 > ω 3 . As such, the highest priority is given to loss reduction, which is evident by comparing the network loss (   J 1 ) in Table 2 before and after applying control. In contrast, objectives with lower priority (i.e., voltage magnitude and balance profiles) may be sacrificed at some points (highlighted in red in Table 2), to ensure the minimization of network loss and the O F . Besides, in Section 2 the deadband-based objectives of J 2 and J 3 are defined to constrain the voltage magnitude and unbalance profiles within the desirable limits. Figure 8 and Figure 9 illustrate the voltage magnitude and unbalance profiles for both MV and LV buses across the considered network, over 24 h, before and after the proposed control. Due to space limit, only the results on phase-C of the LV feeder, which has the most PV and load connections, and the corresponding phase-BC of the MV feeder are presented. As seen from Figure 8, the minima of the MV phase-BC voltage and the LV phase-C voltage are both improved from the original 21.67 kV (–1.68%) and 223.04 V (–7.07%) to 21.81 kV (–0.86%) and 227.94 V (–5.03%), respectively, both within the specified deadband of ±6%. Figure 9 also shows that the voltage unbalance profiles for both MV and LV networks improve from the maxima VUF of 0.22% and 2.44% to 0.17% and 1.65%, respectively, both within the limit of 2%.

4.4. Sensitivity Analysis on Crtical Parameters

As described in Section 2, the pre-set threshold O F max has a critical impact on the proposed VV control strategy. By controlling it, the network operation and the switching cost of SCs can be actively managed. The switching frequency of SCs in Section 4 is relatively high, as seen from Figure 8a, because of a relatively low pre-set threshold for O F max . In practice, O F max can be flexibly determined based on the expectations of network operators. To investigate the impact of the threshold O F max on the proposed VV optimization strategy, a sensitivity analysis of SC operation times versus O F max is conducted. Figure 10 illustrates the sensitivity of SCs operating frequency versus O F max . It can be seen that with the increasing O F max , the operating frequency of SCs is significantly reduced.
Besides, preferences can also be flexibly managed by adjusting the weightings of objective function defined in (5). Again, in practice these weightings can be determined based on the expectations of network operators. To verify the effect of weightings adjustment on the network operation, three different groups of weightings ω 1 , ω 2 and ω 3 are set in the forms of (0.9, 0.05, 0.05), (0.05, 0.9, 0.05) and (0.05, 0.05, 0.9). They are applied for the optimization of the simulated network of Figure 5 at the peak hour 20:00. As shown in Table 3, the objectives with the largest weighting always generate the best optimization, i.e., value reduction, indicating that network operation can be actively managed by adjusting the weightings.

5. Performance Evaluation on Large Network

The performance of the proposed VV is evaluated on a larger-scale and more complex distribution network. Let us consider Figure 11 of a larger and real distribution network, consisting of a 22 kV MV feeder and its five 451 V LV feeders, with a total of 565 buses. The LV feeders are supplied by 22 kV/415 V distribution transformers, at MV buses 5, 25, 41, 46 and 60 while two delta-connected SCs are placed at MV buses 39 and 57, with capacities of 450 and 1050 kvar, respectively. The LV feeder originated from MV bus 41 is supplied by a 200 kV distribution transformer and includes 101 buses and 77 consumers (see Figure 11b). Of these, 51 consumers are single-phase, and 34 consumers have single-phase rooftop PV inverters.
As demonstrated by Figure 12, the operation performance of the complex 565-bus distribution network of Figure 11 is significantly improved when operating under the proposed technique. As detailed control performance analysis has been carried out in Section 4, this section will only focus on the real-time performance evaluation. This study is performed by MATLAB® on a personal computer with a 3.2 GHz processor of Intel® Core i5 and a memory of 4 GB. As given in Table 4, for the test network of Figure 5 with total 145 buses and 77 controllable units (i.e., two MV SCs and 75 LV PV inverters), the average computational time for Stages 1, 2 and 3 are, respectively, 0.03, 4.56 and 10.21 s. In contrast, for the complex network of Figure 11, with a total of 565 buses and 172 controllable units (i.e., two MV SCs and 170 LV PV inverters), the average computational time increases, respectively, to 0.2, 78.04 and 147.16 s. This is because both the joint solver of MPSO and DLF needs more time to perform load flow and operation optimization with more decision variables.
It is to be noted that, as mentioned earlier in this study, the proposed technique operates iteratively every 15 minutes to be compatible with typical ICT infrastructures, such as smart meters and SCADA, across the test network. As such, the system data including loads, PV generations and the SC statuses is collected every 15 mins. Considering the computational time for each stage by the proposed strategy on both networks at maximum 147.16 s, far less than 15 mins, proving the suitability of the proposed VV control for real-time applications.

6. Conclusions and Future Work

Based on the reactive capabilities of MV delta-connected SCs and LV distributed PV inverters, a multi-objective, multi-stage joint VV optimization model and coordination strategy is proposed for integrated and unbalanced radial distribution networks. The proposed technique improves the network operation in terms of power loss, as well as voltage magnitude and balance profiles, while reducing the switching cost of SCs. The proposed strategy coordinates the reactive support of MV SCs with LV PV inverters in a three-stage manner. It actively regulates the network operation and the daily switching cost of SCs, avoiding forecasting of low accuracy. Simulations and analyses on two real Australian distribution networks demonstrate that the proposed VV control technique is feasible and effective in improving the operation of integrated and unbalanced radial distribution networks, as well as limiting the switching cost of SCs, with superior computational performance for real-time applications.
The pre-set threshold of O F max is assumed constant in this study. Future research could be focused on developing a time-varying threshold O F max to further control the network operation performance and the daily switching cost of SCs. Besides, the proposal can also be further expanded to coordinate OLTCs, VRs and battery inverters for a more comprehensive VV control in future distribution networks assuming a high presence of VV controlling devices in various forms.

Author Contributions

Conceptualization, X.S.; methodology, S.T.; software, J.L.; validation, P.L.; formal analysis, Y.F.; investigation, S.W.; writing—review and editing, C.S. All authors have read and agreed to the published version of the manuscript.

Funding

This research was funded by NATIONAL KEY RESEARCH AND DEVELOPMENT PROGRAM, grant number 2017YFB0902800, and SCIENCE AND TECHNOLOGY PROJECT OF STATE GRID CORPORATION OF CHINA, grant number 52094017003D.

Conflicts of Interest

The authors declare no conflict of interest.

References

  1. Ganguly, S. Multi-Objective Planning for Reactive Power Compensation of Radial Distribution Networks with Unified Power Quality Conditioner Allocation Using Particle Swarm Optimization. IEEE Trans. Power Syst. 2014, 29, 1801–1810. [Google Scholar] [CrossRef]
  2. Tushar, M.H.K.; Assi, C. Volt-VAR Control Through Joint Optimization of Capacitor Bank Switching, Renewable Energy, and Home Appliances. IEEE Trans. Smart Grid 2017, 9, 4077–4086. [Google Scholar] [CrossRef]
  3. Spring, A.; Wirth, G.; Becker, G.; Pardatscher, R.; Witzmann, R. Grid Influences from Reactive Power Flow of Photovoltaic Inverters With a Power Factor Specification of One. IEEE Trans. Smart Grid 2015, 7, 1. [Google Scholar] [CrossRef]
  4. Liu, M.; Canizares, C.; Huang, W. Reactive Power and Voltage Control in Distribution Systems with Limited Switching Operations. IEEE Trans. Power Syst. 2009, 24, 889–899. [Google Scholar] [CrossRef]
  5. Zhang, L.; Tang, W.; Liang, J.; Cong, P.; Cai, Y. Coordinated Day-Ahead Reactive Power Dispatch in Distribution Network Based on Real Power Forecast Errors. IEEE Trans. Power Syst. 2015, 31, 2472–2480. [Google Scholar] [CrossRef]
  6. Ranamuka, D.; Agalgaonkar, A.P.; Muttaqi, K.M. Examining the interactions between DG units and voltage regulating devices for effective voltage control in distribution systems. IEEE Trans. Ind. Appl. 2017, 53, 1485–1496. [Google Scholar] [CrossRef]
  7. Barr, J.; Majumder, R. Integration of Distributed Generation in the Volt/VAR Management System for Active Distribution Networks. IEEE Trans. Smart Grid 2014, 6, 576–586. [Google Scholar] [CrossRef]
  8. Zheng, W.; Wu, W.; Zhang, B.; Wang, Y. Robust reactive power optimisation and voltage control method for active distribution networks via dual time-scale coordination. IET Gener. Transm. Distrib. 2017, 11, 1461–1471. [Google Scholar] [CrossRef] [Green Version]
  9. Dothinka, R.R.; Agalgaonkar, A.; Muttaqi, K. On-line voltage control in distribution systems with multiple voltage regulating devices. In Proceedings of the 2014 IEEE PES General Meeting | Conference & Exposition, National Harbor, MD, USA, 27–31 July 2014; Volume 5, p. 1. [Google Scholar] [CrossRef]
  10. Zhang, X.; Flueck, A.J.; Nguyen, C.P. Agent-Based Distributed Volt/Var Control with Distributed Power Flow Solver in Smart Grid. IEEE Trans. Smart Grid 2016, 7, 600–607. [Google Scholar] [CrossRef]
  11. Kim, Y.J.; Kirtley, J.L.; Norford, L.K. Reactive Power Ancillary Service of Synchronous DGs in Coordination with Voltage Control Devices. IEEE Trans. Smart Grid 2015, 8, 1. [Google Scholar] [CrossRef]
  12. Hong, Y.-Y.; Luo, Y.-F. Optimal VAR Control Considering Wind Farms Using Probabilistic Load-Flow and Gray-Based Genetic Algorithms. IEEE Trans. Power Deliv. 2009, 24, 1441–1449. [Google Scholar] [CrossRef]
  13. Viawan, F.; Karlsson, D. Voltage and Reactive Power Control in Systems with Synchronous Machine-Based Distributed Generation. IEEE Trans. Power Deliv. 2008, 23, 1079–1087. [Google Scholar] [CrossRef]
  14. Anilkumar, R.; Devriese, G.; Srivastava, A.K. Voltage and Reactive Power Control to Maximize the Energy Savings in Power Distribution System with Wind Energy. IEEE Trans. Ind. Appl. 2018, 54, 656–664. [Google Scholar] [CrossRef]
  15. Capitanescu, F.; Bilibin, I.; Romero-Ramos, E. A Comprehensive Centralized Approach for Voltage Constraints Management in Active Distribution Grid. IEEE Trans. Power Syst. 2013, 29, 933–942. [Google Scholar] [CrossRef] [Green Version]
  16. Wang, Z.; Wang, J.; Chen, B.; Begovic, M.M.; He, Y. MPC-Based Voltage/Var Optimization for Distribution Circuits with Distributed Generators and Exponential Load Models. IEEE Trans. Smart Grid 2014, 5, 2412–2420. [Google Scholar] [CrossRef]
  17. Su, X.; Wolfs, P.; Masoum, M.A. Comprehensive optimal photovoltaic inverter control strategy in unbalanced three-phase four-wire low voltage distribution networks. IET Gener. Transm. Distrib. 2014, 8, 1848–1859. [Google Scholar] [CrossRef]
  18. Su, X.; Masoum, M.A.S.; Wolfs, P. Multi-Objective Hierarchical Control of Unbalanced Distribution Networks to Accommodate More Renewable Connections in the Smart Grid Era. IEEE Trans. Power Syst. 2015, 31, 3924–3936. [Google Scholar] [CrossRef]
  19. Jabalameli, N.; Su, X.; Ghosh, A. Online Centralized Charging Coordination of PEVs With Decentralized Var Discharging for Mitigation of Voltage Unbalance. IEEE Power Energy Technol. Syst. J. 2019, 6, 152–161. [Google Scholar] [CrossRef]
  20. Wang, T.; Meskin, M.; Su, X.; Grinberg, I.; Wang, Z. Optimal inverter based distributed generation units control strategy to improve voltage profiles in unbalanced distribution networks. IET Gener. Transm. Distrib. 2019, 13, 4910–4921. [Google Scholar] [CrossRef]
  21. Su, X.; Masoum, M.A.S.; Wolfs, P. Optimal PV Inverter Reactive Power Control and Real Power Curtailment to Improve Performance of Unbalanced Four-Wire LV Distribution Networks. IEEE Trans. Sustain. Energy 2014, 5, 967–977. [Google Scholar] [CrossRef]
  22. Su, X.; Liu, J.; Fu, Y.; Mi, Y.; Shahnia, F. An Efficient Joint Coordination of Volt-Var Support in Medium and Low Voltage Distribution Feeders. In Proceedings of the 2019 IEEE International Conference on Industrial Technology (ICIT), Melbourne, Australia, 13–15 February 2019; pp. 1668–1672. [Google Scholar]
  23. Kersting, W.H. Distribution System Modeling and Analysis; CRC Press: Boca Raton, FL, USA, 2011. [Google Scholar]
  24. Pillay, P.; Manyage, M. Definitions of voltage unbalance. IEEE Power Eng. Rev. 2001, 21, 50–51. [Google Scholar] [CrossRef]
  25. Marler, R.T.; Arora, J.S. Weighted sum method for multi-objective optimization: New sights. Struc. Multidiscip. Optim. 2010, 41, 853–862. [Google Scholar] [CrossRef]
  26. Industrial Controllers, National InstrumentsTM Website. 2017. Available online: http://www.ni.com/industrial-controller (accessed on 12 October 2019).
  27. Intel Hardware, Software and Technologies for Industrial Automation, Intel® Website. 2017. Available online: https://www-ssl.intel.com/content/www/us/en/industrial-utomation/products-and-solutions/hardware-software-technologies.html (accessed on 16 May 2020).
  28. Process Control and Industrial Automation, Analog DevicesTM Website. 2017. Available online: http://www.analog.com/en/applications/markets/process-control-and-industrial-automation.html (accessed on 26 November 2019).
  29. Gungor, V.C.; Sahin, D.; Kocak, T.; Ergut, S.; Buccella, C.; Cecati, C.; Hancke, G. A Survey on Smart Grid Potential Applications and Communication Requirements. IEEE Trans. Ind. Inform. 2012, 9, 28–42. [Google Scholar] [CrossRef] [Green Version]
  30. Del Valle, Y.; Venayagamoorthy, G.; Mohagheghi, S.; Hernandez, J.-C.; Harley, R.G. Particle Swarm Optimization: Basic Concepts, Variants and Applications in Power Systems. IEEE Trans. Evol. Comput. 2008, 12, 171–195. [Google Scholar] [CrossRef]
  31. Yan, Y.; Qian, Y.; Sharif, H.; Tipper, D. A Survey on Smart Grid Communication Infrastructures: Motivations, Requirements and Challenges. IEEE Commun. Surv. Tutor. 2013, 15, 5–20. [Google Scholar] [CrossRef] [Green Version]
  32. Arefi, A.; Abeygunawardana, A.M.A.K.; Ledwich, G. A New Risk-Managed Planning of Electric Distribution Network Incorporating Customer Engagement and Temporary Solutions. IEEE Trans. Sustain. Energy 2016, 7, 1646–1661. [Google Scholar] [CrossRef]
  33. Ziari, I.; Ledwich, G.; Ghosh, A. Optimal distribution network reinforcement considering load growth, line loss and reliability. IEEE Trans. Power Syst. 2013, 28, 1. [Google Scholar] [CrossRef]
  34. Teng, J.-H. A direct approach for distribution system load flow solutions. IEEE Trans. Power Deliv. 2003, 18, 882–887. [Google Scholar] [CrossRef]
  35. Anwar, A.; Mahmood, A.N.; Taheri, J.; Tari, Z.; Zomaya, A. HPC based Intelligent Volt/VAr Control of Unbalanced Distribution Smart Grid in the presence of Noise. IEEE Trans. Smart Grid 2017, 8, 1. [Google Scholar] [CrossRef]
  36. City, P.S. Perth Solar City Annual Report; Western Power: Perth, Australia, 2012. [Google Scholar]
Figure 1. Schematic illustration of the key concept of this research.
Energies 13 04877 g001
Figure 2. Flowchart of the proposed coordination strategy.
Energies 13 04877 g002
Figure 3. Considered particle of decision variables to be determined by MPSO in: (a) Stage 2; (b) Stage 3.
Energies 13 04877 g003
Figure 4. Solution flowchart of modified particle swarm optimization (MPSO) and direct load flow (DLF) based Dynamic optimal power flow (DOPF) solver.
Energies 13 04877 g004
Figure 5. Considered 145-bus Australian distribution network: (a) Medium-voltage (MV) feeder; (b) unbalanced low-voltage (LV) feeder supplied from bus-20 of the MV feeder.
Energies 13 04877 g005
Figure 6. (a) Active and reactive power profiles of load, photovoltaic (PV) inverters and switched capacitors (SCs); (b) objective functions after control over 24 h.
Energies 13 04877 g006
Figure 7. Optimal reactive injections after the proposed multi-stage technique over a 24-h period from (a) MV SCs, and (b) LV PV inverters.
Energies 13 04877 g007
Figure 8. Voltage magnitude profile before and after the proposed control: (a) Line-BC voltage on the MV feeder; (b) phase-C voltage on the LV feeder.
Energies 13 04877 g008
Figure 9. Voltage unbalance profile before and after the proposed control: (a) MV feeder; (b) LV feeder.
Energies 13 04877 g009
Figure 10. Sensitivity of the SC operation frequency versus O F max .
Energies 13 04877 g010
Figure 11. Considered 565-bus Australian distribution network.
Energies 13 04877 g011
Figure 12. Comparison of the (a) power profiles; (b) Optimization objectives, for the considered network of Figure 11, over 24 h.
Energies 13 04877 g012
Table 1. Comparison of existing volt-var (VV) optimization and coordination approaches and the proposed technique in this paper.
Ref.ControlVoltage LevelNetwork
Balance
Day-Ahead/Real-TimeConsidered Objectives
CentralizedDecentralizedMVLVBalancedUnbalancedDay-AheadQuasi-
Real-Time
Real-TimeVoltage MagnitudeVoltage UnbalancePower LossSwitching Costs
[5]
[6]
[7]
[8]
[9]
[10]
[11]
[12]
[13]
[14]
[15]
[16]
[17]
[18]
[19]
[20]
[21]
This paper
Table 2. Network operation compared over a 24-h period before and after applying the developed optimal VV control.
Time
(h)
Before Applying the Proposed TechniqueAfter Applying the Proposed Multi-Stage Technique
Original CaseStage 1Stage 2Stage 3
J 1 J 2 J 3 O F O F O F m a x J 1 J 2 J 3 O F O F O F m a x J 1 J 2 J 3 O F O F O F m a x J 1 J 2 J 3 O F
000.2450.4020.2700.2970.2450.4020.270.2970.2390.3800.2520.2850.2330.3240.2510.264
010.1460.3440.2420.2240.1390.3120.2490.213------------------
020.1130.3250.2260.1990.1110.2950.2320.190------------------
030.1180.3300.2410.2060.1120.2990.2490.196------------------
040.1180.3340.2330.2060.1140.3030.2420.197------------------
050.0880.3150.2390.1860.0960.2880.2470.184------------------
060.0910.3120.2620.1920.1030.2860.2720.192------------------
070.0840.3020.3260.1980.0940.2840.3390.200------------------
080.0990.3120.4570.2410.1060.3110.4730.235------------------
090.1640.3550.6350.3130.1580.3390.6540.3080.1510.3230.4370.266--------
100.1710.3640.540.3030.1670.3360.5560.2880.1520.3050.3670.248--------
110.2490.3940.8980.4180.2220.3710.8760.4020.2210.3500.5280.3210.2090.3520.4670.304
120.2760.40210.4580.2560.3840.9110.4170.2390.3630.5850.3540.2400.3620.4750.324
130.2710.3950.7950.4130.2520.3660.7330.3750.2360.3660.5270.3410.2310.3560.4520.313
140.2600.3820.7140.3880.2360.3540.6810.3560.2270.3570.5380.3330.2190.3430.4060.293
150.3660.4910.5570.4410.3450.4450.540.4030.3220.3720.3870.3610.3160.3920.3110.338
160.4230.5620.580.4960.4110.5160.570.4620.3860.4740.2920.4060.3970.4140.2880.380
170.5770.7110.4060.5760.5630.6380.3970.5360.5310.5490.3120.5160.5290.4990.2790.470
180.8810.8980.3770.7810.8730.7920.3570.7270.8360.6830.2840.7020.8520.6080.2710.663
190.9270.8820.3560.7990.9140.7570.3480.7410.8890.6490.2820.7080.8880.6060.2640.678
201.0001.0000.4120.8820.9930.8880.4340.8250.9440.7490.2870.7780.9440.6430.2670.718
210.8350.8470.4220.7560.8210.7380.410.6970.7880.6430.3060.6650.8080.5900.2680.634
220.5560.6180.3680.5280.5390.5560.3720.4960.5100.4880.270.4790.5350.4650.2690.461
230.3040.4210.2650.3270.2960.3860.2820.3130.2830.3700.2370.3110.3020.3400.2460.302
240.1910.3680.2680.2600.1780.3380.2670.244------------------
Table 3. Sensitivity analysis of objectives versus weightings.
GroupGroup 1Group 2Group 3
CaseBefore
Control
After
Control
Reduction (%)Before
Control
After
Control
Reduction (%)Before
Control
After
Control
Reduction (%)
J 1 1.0000.66733.31.0000.9782.21.0000.9772.3
J 2 1.0000.9336.71.0000.64635.41.0000.85814.2
J 3 0.4120.31124.50.4120.3934.60.4120.25737.6
Table 4. Computational performance evaluation by comparison.
PerformanceNetwork of Figure 5Network of Figure 11
Number of buses145565
Number of controllable units77172
Average
computational
time (s)
Stage 10.030.20
Stage 24.5678.04
Stage 310.21147.16

