Article

Simulating Fracture Sealing by Granular LCM Particles in Geothermal Drilling

Department of Energy and Mineral Engineering, Pennsylvania State University, University Park, PA 16802, USA
*
Author to whom correspondence should be addressed.
Energies 2020, 13(18), 4878; https://doi.org/10.3390/en13184878
Submission received: 23 August 2020 / Revised: 11 September 2020 / Accepted: 15 September 2020 / Published: 17 September 2020

Abstract

:
Lost circulation occurs when the returned fluid is less than what is pumped into the well due to loss of fluid to pores or fractures. A lost-circulation event is a common occurrence in a geothermal well. Typical geothermal reservoirs are often under-pressured and have larger fracture apertures. A severe lost-circulation event is costly and may lead to stuck pipe, well instability, and well abandonment. One typical treatment is adding lost-circulation materials (LCMs) to seal fractures. Conventional LCMs fail to properly seal fractures because their mechanical limit is exceeded at elevated temperatures. In this paper, parametric studies in numerical simulations are conducted to better understand different thermal effects on the sealing mechanisms of LCMs. The computational fluid dynamics (CFDs) and the discrete element method (DEM) are coupled to accurately capture the true physics of sealing by granular materials. Due to computational limits, the traditional Eulerian–Eulerian approach treats solid particles as a group of continuum matter. With the advance of modern computational power, particle bridging is achievable with DEM to track individual particles by modeling their interactive forces between each other. Particle–fluid interactions can be modeled by coupling CFD algorithms. Fracture sealing capability is investigated by studying the effect of four individual properties including fluid viscosity, particle size, friction coefficient, and Young’s modulus. It is found that thermally degraded properties lead to inefficient fracture sealing.

1. Introduction

Geothermal energy is heat derived within the earth subsurface. In general, water and/or steam carry the geothermal energy to the Earth’s surface. Depending on its characteristics, geothermal energy can be used for heating and cooling purposes or be harnessed to generate clean electricity. A successful drilling and completion operation of a geothermal well are crucial as the extraction of geothermal energy relies on circulating high temperature fluids from the reservoir depth for heat exchange. Geothermal reservoirs exhibit temperatures ranging from 160 to above 300 °C, high compressive strength of 240+ MPa, and highly fractured formations [1]. Major issues in geothermal drilling operations include lost circulation, rig and equipment selection, cementing, rate of penetration, drilling program, and time management [2]. Most of these challenges in drilling geothermal wells are rooted in the fact that these reservoirs are typically under-pressured, and possess abundant natural fractures, which may often have large apertures in the order of centimeters. Therefore, lost circulation is usually anticipated and should be always prevented and in case of occurrence remediated. Lost circulation in drilling is defined as the total or partial loss of circulating drilling fluids into highly permeable zones, cavernous formations, and natural or induced fractures. To cure lost-circulation problems, lost-circulation materials (LCMs) may be added to drilling fluid to bridge and seal the flow pathways. Failing to properly seal fractures to stop lost circulation could lead to stuck pipe, well instability, blowout, and even loss of the wellbore. Fluid design for drilling ultrahigh temperature zones in geothermal wells should be considered by using materials with a high thermal-resistant formula, but this is not the whole story. Many specifications given for laboratory tested products are measured in ambient temperature or within a thermal tolerance condition. To understand the economic importance of LCM design, we should note that lost circulation and its associated problems represent at least an average of 15% increase in well cost at the most mature U.S. geothermal area [3]. Moreover, recent studies also show that an estimated USD 185,000 or more is added to the cost (which averaged over 100 h of unprogrammed nonproductive time) because of lost-circulation events [4].
A typical drilling fluid contains some concentrations of LCMs in anticipation of a lost-circulation situation. The fracture-sealing effectiveness depends on the size and mechanical strength of the LCMs. Most of the LCMs available in the market can be categorized as either fibrous, flaky, or granular. In recent years, developments have gone towards smart LCMs that are designed to expand in a targeted temperature range [5,6]. Nevertheless, the fibrous and flaky materials are out of the scope of this paper, and only granular materials are discussed. A mixture of rigid granular particles generally provides the best sealing capabilities [7]. However, fracture apertures in excess of 5 mm represent a serious challenge for currently available LCMs [8]. If the sizes of LCMs are too large, they can also plug up downhole drilling equipment. Even though conventional LCMs work in a typical oil and gas sedimentary formation, they may not work at an elevated-temperature condition.
Mechanical properties of LCMs can be altered due to elevated temperatures such as particle thermal degradation. When LCMs undergo the transport process, abrasion typically occurs and can be intensified by the increase in the downhole temperature. Additionally, materials may be softened under high temperature conditions, which results in the reduction in Young’s modulus. The sealing capability may not be improved by increasing concentrations of thermally degraded materials [9]. This means that having larger quantities of the already degraded LCMs would not help or reduce the impact of a lost-circulation event. Additionally, rheological properties of the drilling fluid can be affected at elevated temperatures and consequently influence particle–fluid interactions. Furthermore, similar to the viscosity changes in the base fluid, particle–particle frictions can also be influenced by the change of temperature. Sufficient friction forces are needed to develop and strengthen the fracture bridging to withhold pressure differences. In summary, many factors are involved in the sealing process, hence, all the possible combinations of these parameters cannot be captured in a reasonable number of lab experiments to determine the optimal design.
Considering the fact that most of the LCM designs are still based on empirical relationships and past experiences, it would be crucial to develop a modelling tool to not only understand the fracture sealing process and relevant parameters, but also to have a toolbox to reduce the required number of experiments in the lab. Obviously, such simulations should always be multiphysics ones [10]. The significance of such simulation tools becomes clearer by knowing the fact that the geothermal industry is now targeting the zones that have never been considered for drilling. Drilling at these new temperature windows through brittle fractured rocks requires a good planning for loss circulation management. Popular models to describe particle-laden fluid flow are mainly the two-fluid model (TFM) and the coupled computational fluid dynamic–discrete element method (CFD–DEM). In the TFM, both fluid and particle are treated as continuum phases distributed homogenously in each computational grid cell. Thus, the fluid-like particle behavior will be observed as another dissolved liquid basically [11]. Due to the locally averaged approach in the continuum method, the computational consumption is a lot lower than the discrete method [12]. However, the individual particle motion cannot be predicted, such as particle settling, accumulation, and plugging. A coupled CFD–DEM modelling employs the continuum description of fluid flow and the discrete description of individual particle movement. The discrete particle method can accurately track the physics of individual particle flow, and it does not require grid cells. The goal of this paper is to study the sealing capability of granular LCMs. Therefore, the coupled CFD–DEM modeling will be adopted, and thorough parametric studies are conducted to investigate how the sealing mechanisms of granular LCMs can be affected by elevated temperatures.

2. The Altered Particle and Fluid Properties by Thermal Effect

2.1. Fluid Viscosity

The gel and rheological properties of drilling fluids are dependent on temperature. Liquid viscosity usually decreases with increasing temperature. However, water-based drilling fluids consist of mostly bentonite and clay constituents. They can flocculate in a high temperature environment. One way to control and decrease the flocculation temperature is to add lignosulfonate or other types of deflocculants. Deflocculants can also be thermally degraded, nulling the original intention of keeping rheological properties of the drilling fluid constant. Nevertheless, the fluid viscosity may increase or decrease depending on many factors including both physical behaviors and chemical reactions. Even though researchers have been developing better thermally resistant drilling fluids, it is still unavoidable for fluid viscosities to change due to temperature fluctuation such as the fluid samples seen in Table 1.

2.2. Mechanical Properties of LCM Particles

The sealing capability may drastically change with the change of the mechanical strength of LCM particles and the reservoir rock since the geothermal reserves possess temperatures even as high as 300+ °C. The mechanical strength of particles and reservoir rock includes Young’s modulus, Poisson’s ratio, compressive strength, and friction coefficient. It has been observed that the elastic modulus of limestone and marble can decrease significantly when exposed to temperature above 300 °C [16,17]. Table 2 presents some of the commonly used LCMs in drilling fluids with the softening temperatures. Softening temperatures were measured by placing the particles under compression in the elastic region of the stress and strain curve while particle temperature was slowly increased. At the softening temperature, the particle strain increases drastically and continues with further increase in temperature until failure occurs.
When choosing the size of LCMs, a general rule states that the maximum particle diameter should be one-half of the fracture width and 5% fluid volume should be the bridging size [18]. However, the LCM sizes degrade over time when the transport process takes place from surface equipment to the downhole environment. This is due to the rapid movement that causes shear and collisions between the particles. Other attributes, such as chemical reactions and thermally induced stresses, can promote particle degradation as well. Furthermore, increase in temperature typically leads to decrease in viscosity, resulting in less friction or resistant force for particulate flows. Smaller particle sizes, which can be induced by higher temperature, can also further induce particle degradation [19,20]. Particle attrition increases when temperature increases due to the increase in thermal stress. Additionally, the attrition rate is increased with the decrease in particle sizes because the collision probability increases with particle surface area [21]. All in all, particle degradation is aggravated by an increase in temperature, both directly and indirectly.

3. Methodology

3.1. Governing Equations

The aim of this paper is to understand fracture sealing mechanisms of LCMs at elevated temperatures. The findings may help engineers modify their fluid recipes for drilling into high temperature zones and geothermal wells. Thus, sensitivity studies based on numerical simulations are conducted to investigate the sealing effectiveness of various properties. The properties include both LCM particles and drilling fluid. Thermal influence on LCM particles includes change in the elasticity, the particle size, and interparticle interactions. Therefore, the Young’s modulus, size variations, and frictions of the particles are investigated. The most notable fluid property change due to thermal effect is its viscosity. Change of viscosity alters particle–fluid interactions, which may lead to undesired bridging and sealing.

3.2. Fluid Flow and Particle Transport Coupling

The motions of LCMs carried by drilling fluid are simulated in a coupled CFD–DEM environment. The simulation tools employed here are open-source software applicable for particulate flows. The fluid-granular system under CFD–DEM framework is such that the fluid flow is calculated by OpenFOAM under the CFD algorithms, and the motion of particles is resolved by LIGGGHTS in the DEM process [22,23]. The basis and theory of the CFD–DEM technique have been comprehensively reviewed in the literature [24,25].
By using the Lagrangian approach in the DEM, we can track the trajectory of individual particles as a consequence of different interactive forces with other particles, passing flow and fracture walls. The governing equation for the motion is essentially Newton’s second law, which incorporates both the translational and rotational movements. Equilibrium forces are calculated and movement on individual particles is traced in the DEM as the following [26].
m i d ν i d t = m i g + j = 1 c ( f n , i j + f t , i j ) + f p f , i ,
I i d ω i d t = j = 1 c ( M t , i j + M r , i j ) ,
where m i is the mass of particle i, ν i is the translational velocity of particle i, ω i is the angular velocity of particle i, g is the gravitational acceleration, f n , i j is the normal contact force on particle i by particle j, f t , i j is the tangential contact force on particle i by particle j, and f p f , i is the force exerted from surrounding fluid to particles i. For particle rotational motion, I i is the inertial tensor of particle i, M t , i j is the torque generated by tangential force on particle i by particle j, and T p r is the additional torque used to model non-sphericity by means of a rolling friction model.
The particle contact forces from Equations (1) and (2) are represented by the non-linear Hertz contact model in both the normal and tangential directions [27]. The contact forces are modeled such that particles are allowed to overlap for a small amount of displacement. The contact forces can be rewritten as
f n , i j = k n δ n , i j γ n , i j ν n , i j ,
f t , i j = k t δ t , i j γ t , i j ν t , i j ,
where k is the elastic constant in the normal or tangential direction, δ i j is the overlap distance of particle i and particle j in the normal or tangential direction, γ is the viscoelastic damping constant in the normal or tangential direction, and ν i j is the relative velocity of particle i and particle j in the normal or tangential direction.
The particle–fluid interaction force from Equation (1) consists of different types of interaction forces acting on particle i imposed by the fluid, which is written as
f p f , i = f d , i + f p , i + f · τ , i ,
where f d , i is the drag force, f p , i is the pressure gradient force, and f · τ , i is the viscous force. The Di Felice drag model is implemented as the drag force [28]. It is accurate for a wide range of modified Reynolds numbers, which considers the correction of drag force under the influence of surrounding particles. The equation is stated as the following:
f d , i = 0.125 C d 0 , i ρ f π d i 2 ε i 2 | u f ν i | ( u f ν i ) ε i β ,
where
C d 0 , i = ( 0.63 + 4.8 R e i 0.5 ) 2 ,   ε i = 1 i = 1 n V p , i Δ v ,   β = 3.7 0.65 exp { [ 1.5 log 10 ( R e i ) ] 2 2 } ,
and
R e i = ρ f d i ε i | u f ν i | μ f .
The drag force is a function of modified Reynolds number R e i , where ρ f is the fluid density, d i is the particle i diameter, ε i is the void fraction of particle i per unit volume, u f is the fluid velocity, and μ f is the fluid viscosity. Other empirical parameters include the dimensionless drag coefficient of isolated particle i, C d 0 , i , and the corresponding empirical exponent, β .
The pressure gradient force and viscous force for particle i can be written as
f p , i = p · V p , i ,
and
f · τ , i = ( · τ ) V p , i ,
where V p , i is the volume of particle i, p is the pressure, and τ is the liquid stress tensor. The pressure gradient force includes the buoyance force. The viscous force is the force induced by the fluid shear stress or deviatoric stress tensor.
It is necessary to map the discrete particle physics onto a large-scale level in connection with the fluid flow. The CFD that is governed by the Navier–Stokes equations describing the continuum fluid motion in an Eulerian approach is used. This is modeled on the locally averaged level where the particle–fluid interaction is the link between the discrete particles and the continuous fluid. The coupled CFD–DEM is effective in simulating the two-phase flow, and therefore is implemented to study the sealing mechanisms of LCMs in a single fracture. The motion of a continuous fluid phase in the presence of a particulate solid phase, referred as set I in [29], is written as
ε f t + · ( ε f u f ) ,
and
( ρ f ε f u f ) t + · ( ρ f ε f u f u f ) = p F p f + · τ + ρ f ε f g ,
where
F p f = 1 Δ V i = 1 n ( f d , i + f p , i + f · τ , i ) .
ε f is the volume fraction of fluid, and F p f is the particle–fluid interaction force on a locally averaged level that averages the drag force, the pressure gradient force, and the viscous force from many particles within a grid cell.
The mass conservation and momentum conservation of the two-phase system are presented in Equations (11) and (12), respectively. The particle–fluid interactions include the drag force, pressure gradient force, and viscous force in the present model. It is worth noting that the forces are summed and averaged for a given cell volume, as shown in Equation (13). This is an important link that connects the Lagrangian DEM approach to the Eulerian CFD technique. Finally, the detailed modelling of particle–fluid interactions is especially important because the numerical results are heavily dependent on the different force models implanted in the simulation.

3.3. Model Setup and Input Parameters

A sketch of the fracture geometry is shown in Figure 1. Its length and height are 200 mm by 50 mm while the inlet and the outlet width are 1 mm and 0.5 mm, respectively. The particles are created in the insertion zone and are carried by the drilling fluid to flow from the inlet to the outlet of the fracture. Researchers have investigated the appropriate grid cell to particle size in a fluidized bed simulation. Particularly, if the ratio of grid to particle size is smaller than 1.63, uncharacteristic behavior of the fluid–solid flow would be obtained due to incorrect calculations to satisfy the fluid properties [30]. The appropriate grid size is determined by the void fraction calculation from the coupled CFD–DEM. In this model, each grid cell is set to be 2 mm by 2 mm in length and height to ensure the accuracy and convergence of coupled CFD–DEM results. Fracture walls are rigid and assumed to have no-slip conditions, and both inlet and outlet are under constant pressure boundary conditions to represent wellbore and formation pressures, respectively. The fracture inlet is set at 875 KPa (127 psi) and the outlet pressure is set to be zero or basically formation pressure (if we assume that the inlet pressure is basically different pressure). The liquid phase is assumed to be Newtonian and incompressible. Gravity takes effect in the negative y-axis direction with the magnitude of 9.81 m/s2.
Only single particle diameter is specified for every simulation for the purpose of studying the sealing mechanisms of uniformly sized particles. Parametric studies are necessary to study the thermal influence on the particle and fluid properties. The properties of the drilling fluid and particles are listed in Table 3, where base case is highlighted in bold and italic. Simulation duration is 1 s with every timestep being 10−5 s for the CFD and 10−7 s for the DEM. Therefore, the coupling step of the CFD–DEM coupling is at every 100 DEM timestep. The unresolved solver uses a Pressure-Implicit Split-Operator (PISO) algorithm to solve the flow equations [31].

4. Results and Discussion

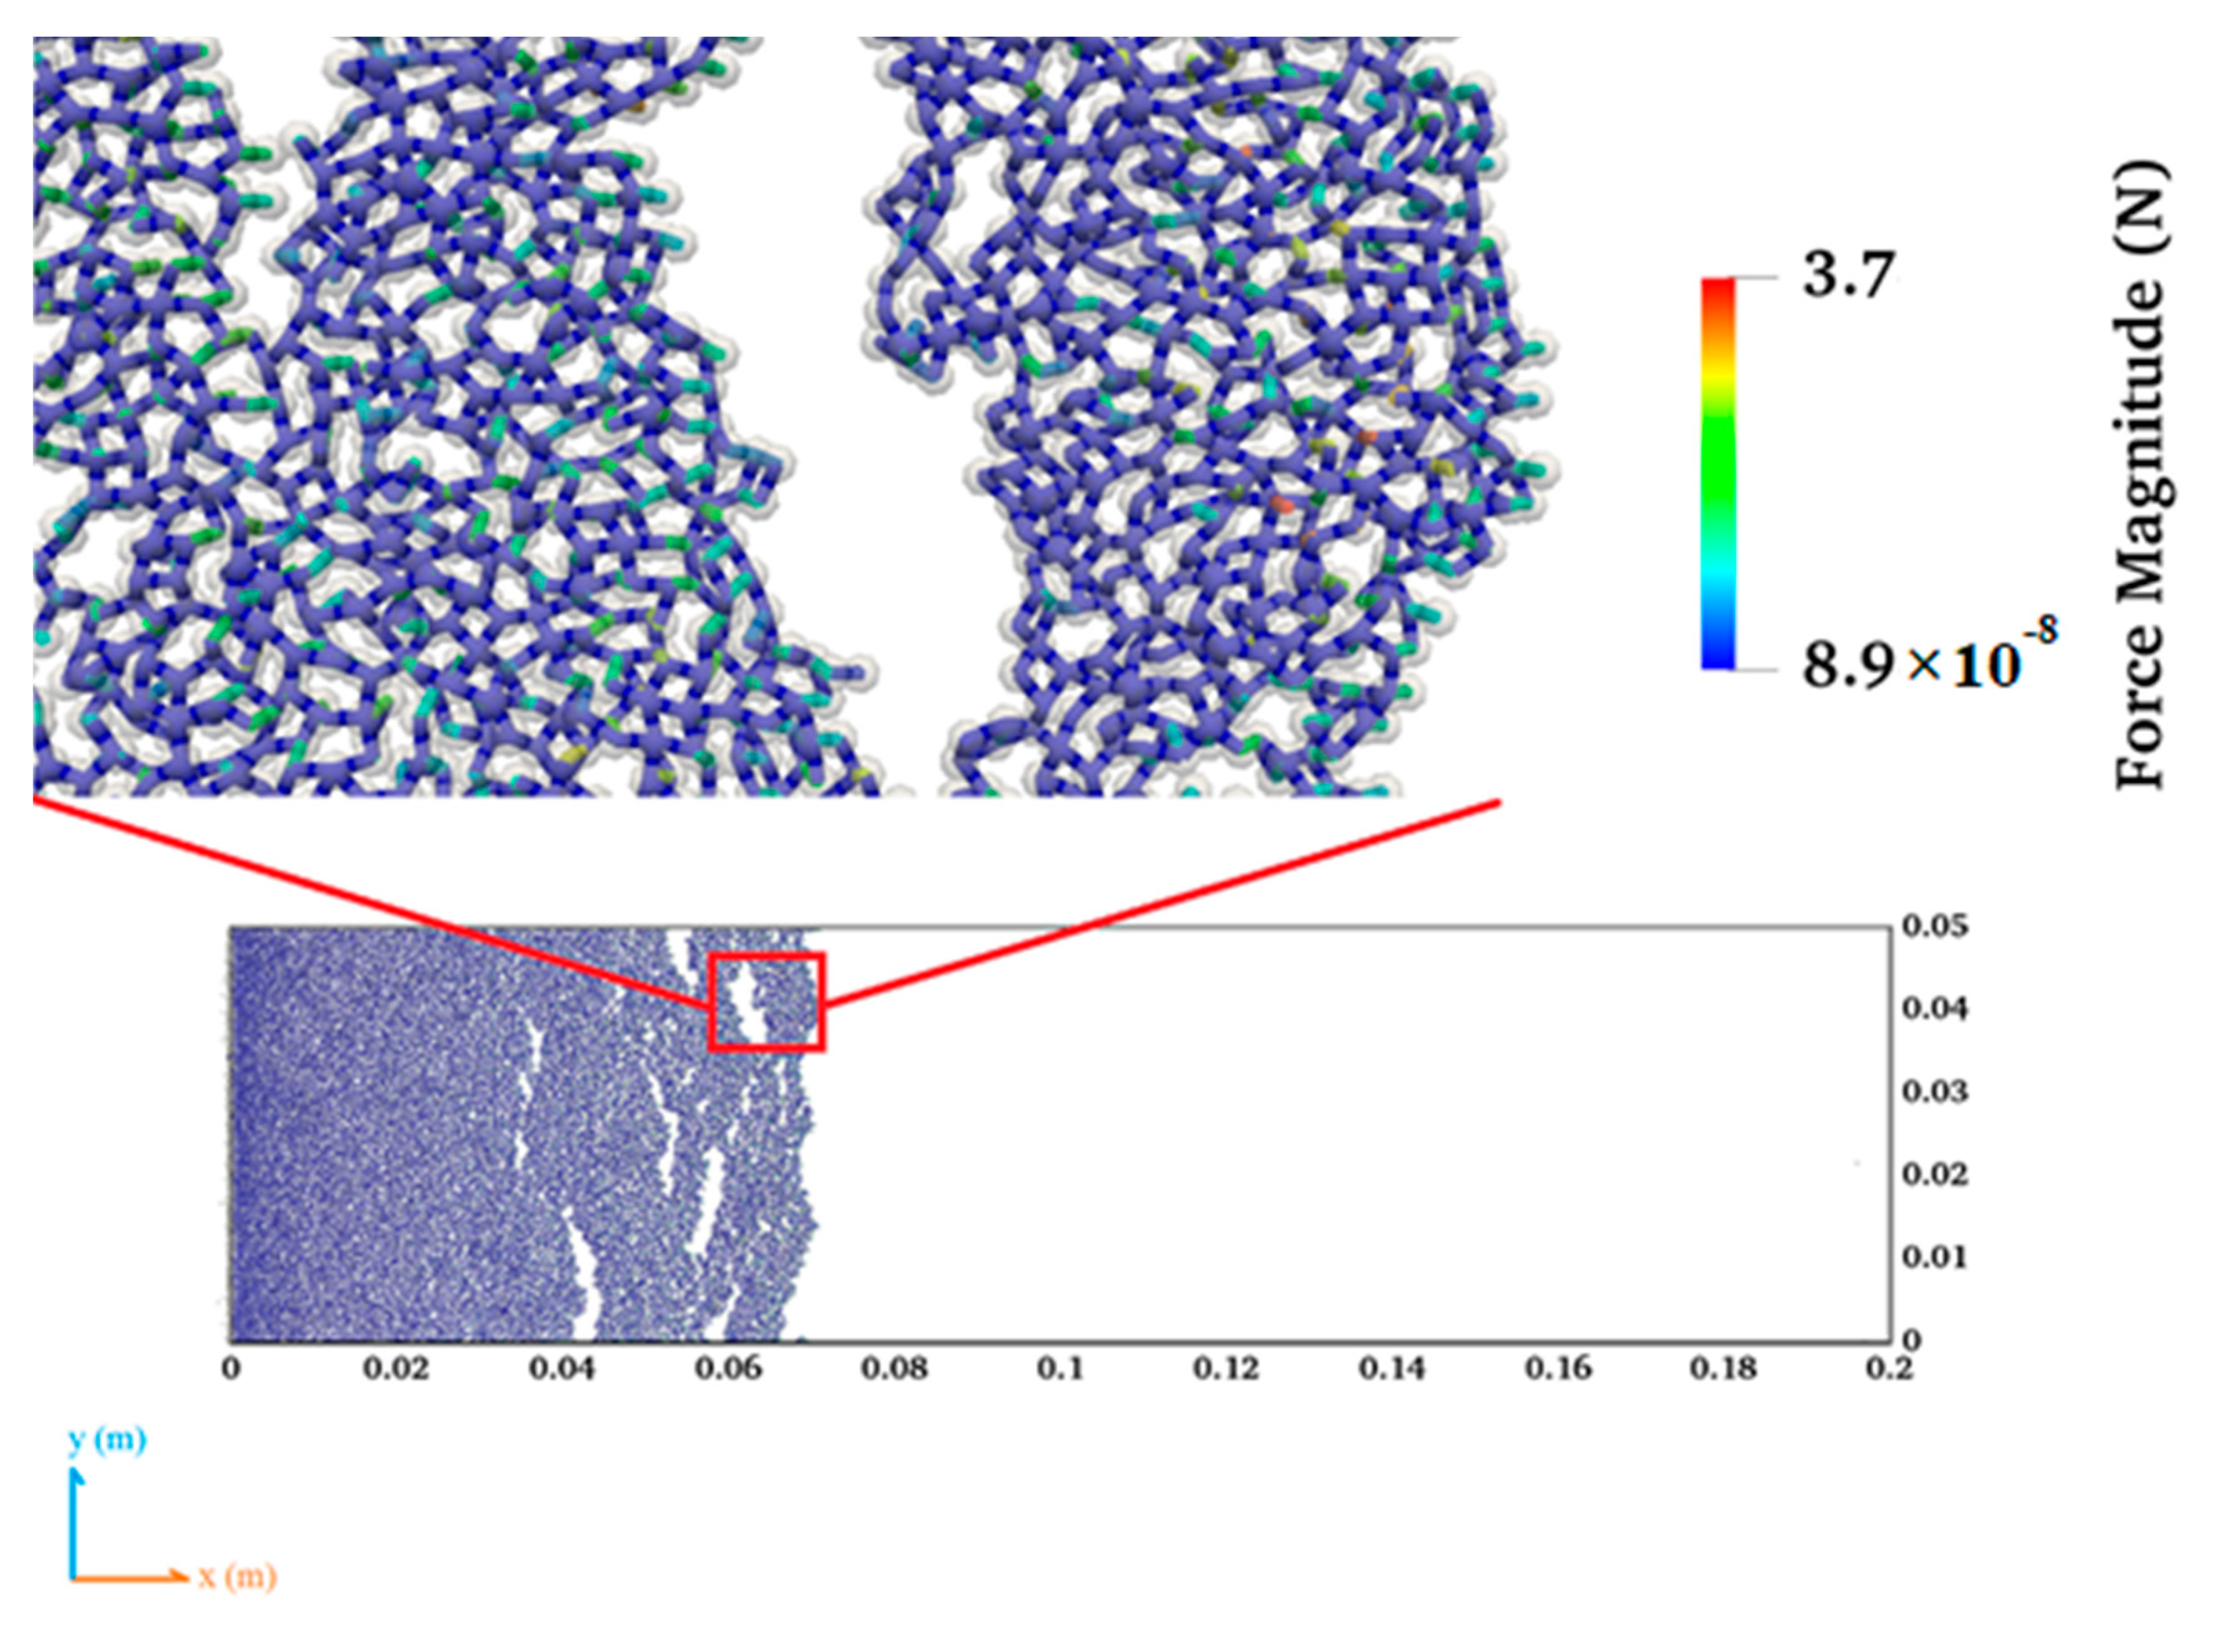
4.1. Fracture Sealing and Force Chain

In order to study fracture sealing mechanisms, interparticle contact forces are monitored in each simulated case. For example, Figure 2 shows an example of fracture sealing by depicting the contact force chains, where a complete force chain seals the fracture from the initial bridging location to the inlet. Patterns such as this are commonly seen upon bridging and sealing of the fractures. The particles are in contact with mutually compressive forces. A small amount of contact force is formed first when particles bridge at a location inside the fracture. These force chains grow with more incoming particles that accumulate behind the bridging front, resulting in sealing of the fracture. Figure 3a exhibits the onset of clogging inside the fracture due to initial particle bridging. At this point, many particles may still flow through the soon-to-be bridged location. In Figure 3b, flowrate may become constant when particles can no longer be inserted at the fracture inlet. The fracture volume has been filled up with the LCMs starting from the initial bridging location all the way back to the fracture inlet. In summary, one may identify three stages during the fracture sealing process. First, initial particle packing occurs in an island or islands inside the fracture. This can be seen in the graphical representation of Figure 3a, where the flowrate decreases right after the peak rate. Second, the faster trailing particles collide with the slower frontal particles, which leads to the growth of the particle packing. This is indicated in the region of further declining flowrate. Lastly, once the complete seal is formed, the flowrate stabilizes at a lower flowrate. The duration of forming a seal is the difference between the time at the peak flow and the time when the flow is stabilized at a constant rate, which is indicated by the dimensionless volume. Dimensionless volume is designed to indicate the severity of fluid loss for the duration of the simulation time, which is defined as the ratio of injected fluid volume to fracture volume. Since the injected fluid is cumulative throughout the simulation and the fracture volume is fixed, the dimensionless volume monotonically increases with time.

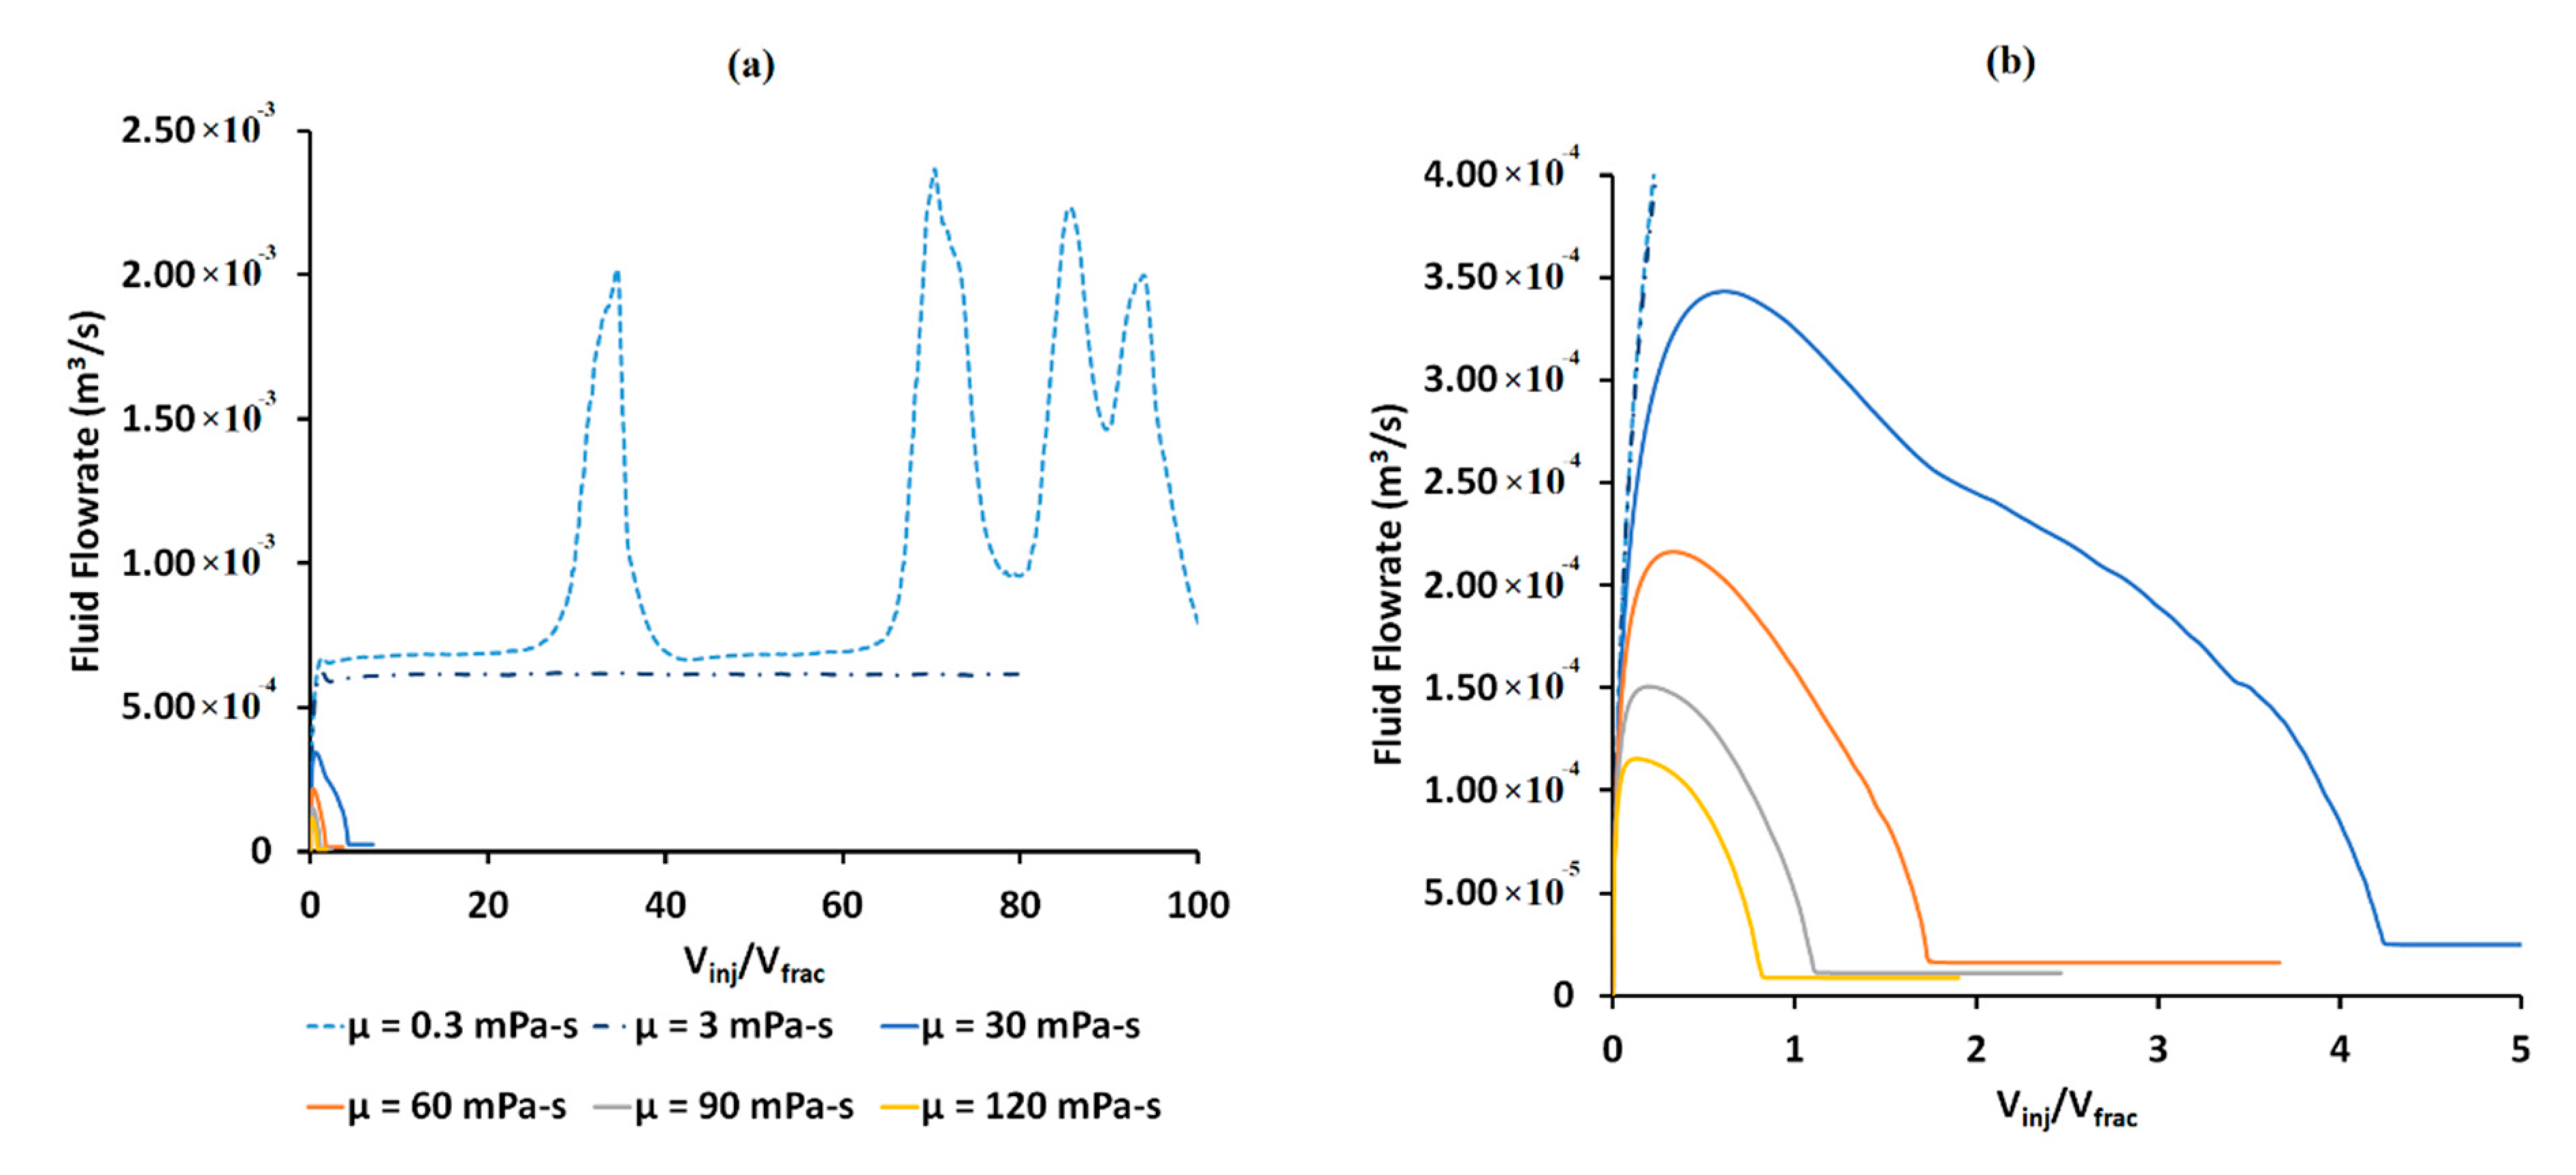
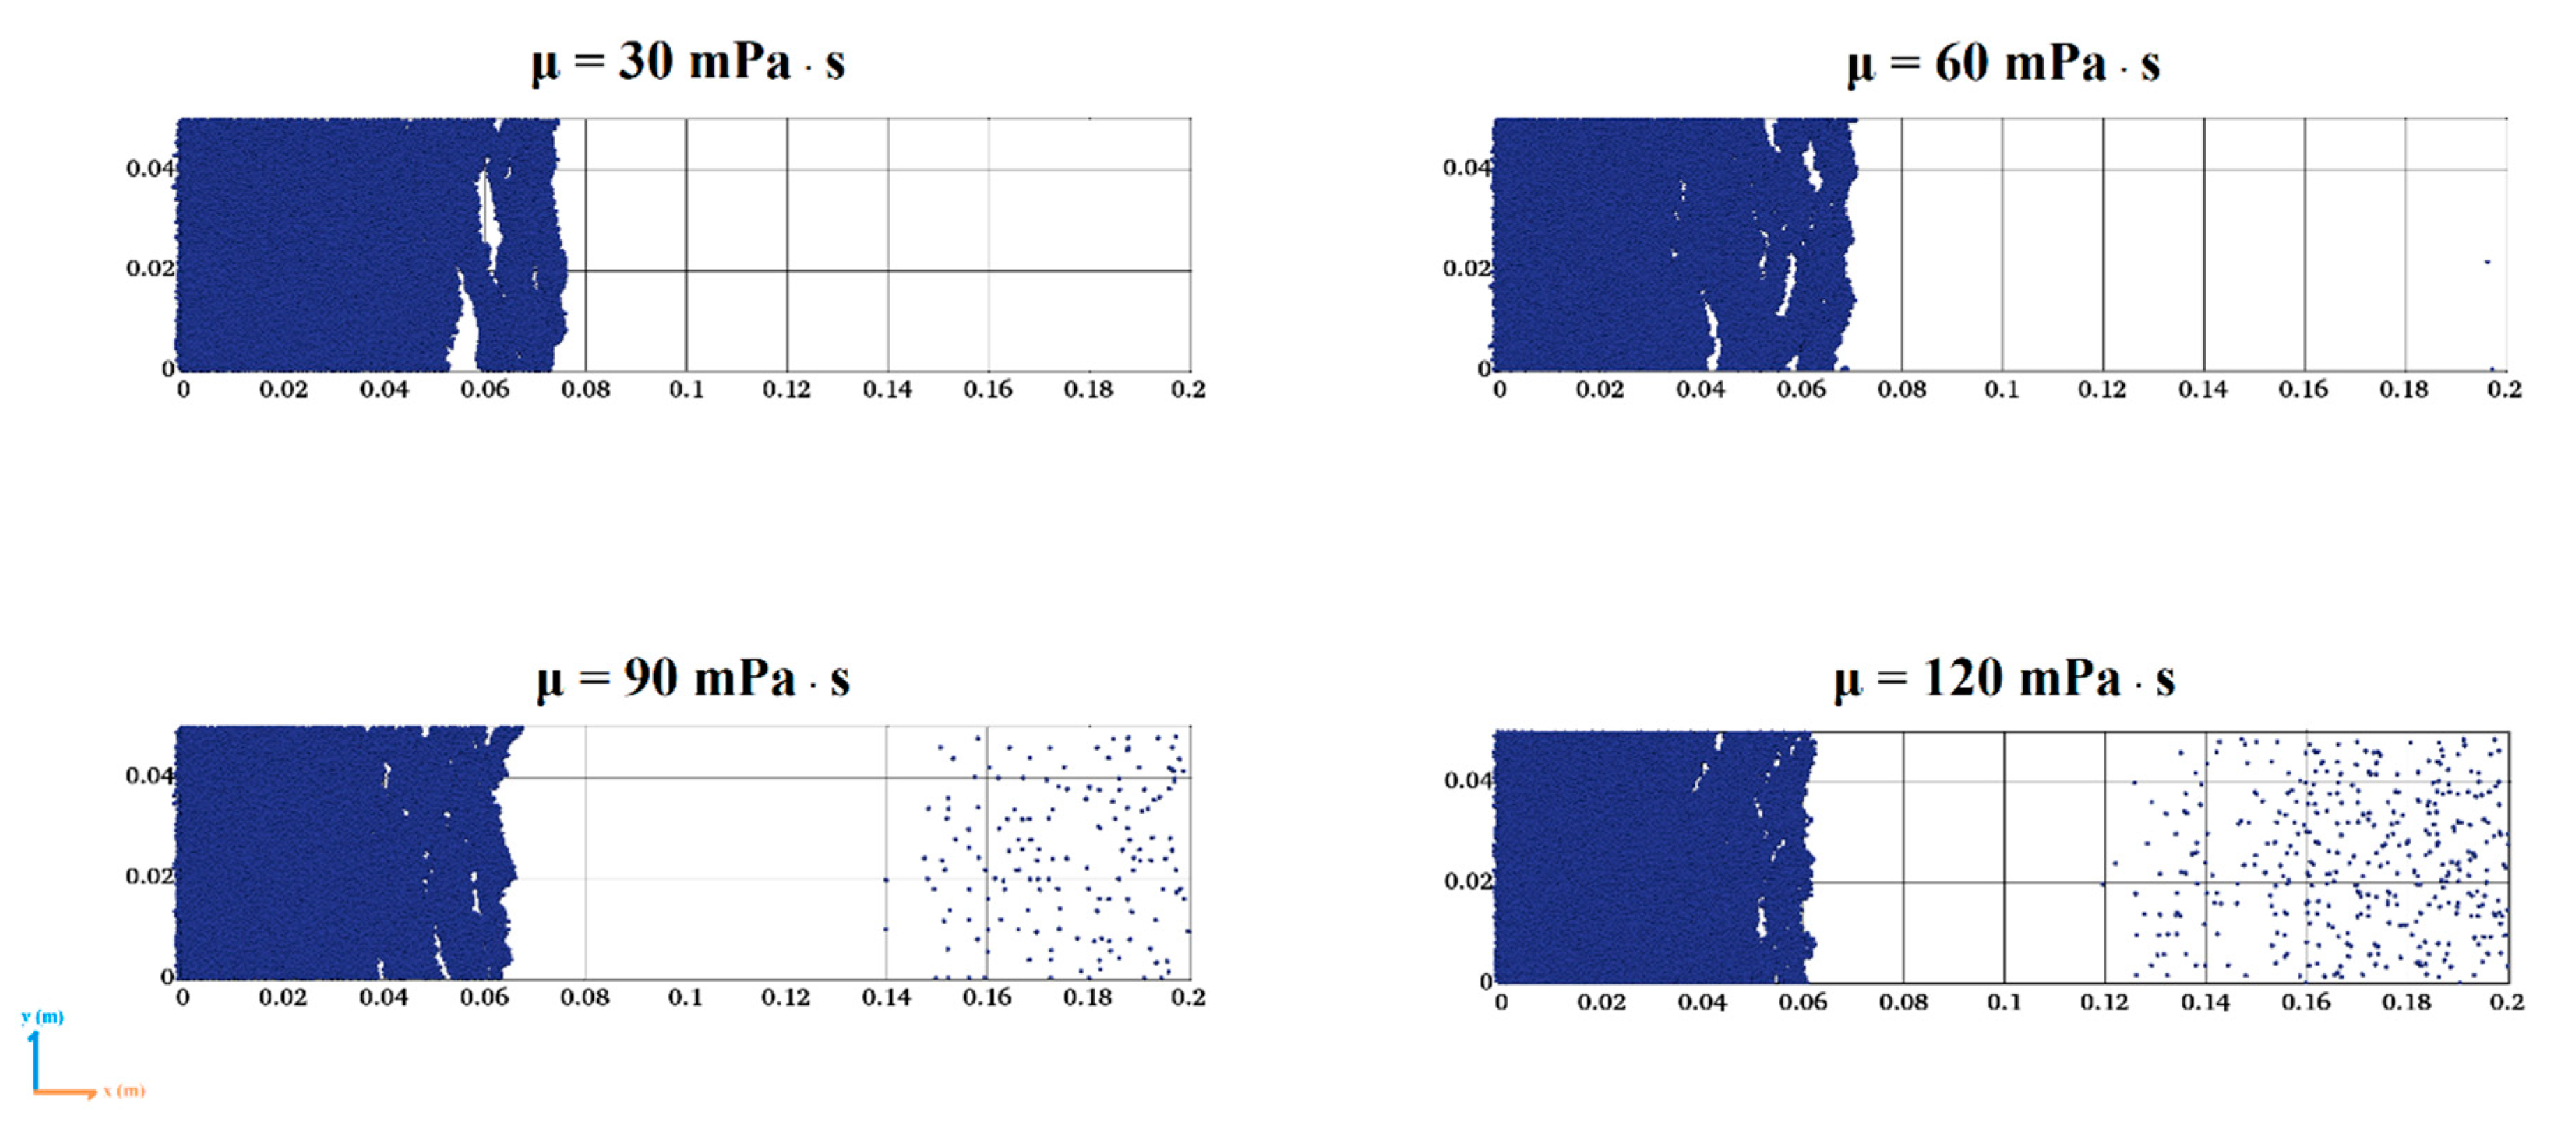
4.2. Fracture Sealing Capability of Thermally Affected Fluid Viscosity

Fluid viscosity can be easily altered at elevated temperatures. As shown in Figure 4, six different cases of fluid viscosities have been simulated and studied. Two of the lowest viscosity cases fail to successfully seal fractures, which can be verified by the large amount of flow through the fracture, along with the large dimensionless volumes in Figure 4a. On the other hand, the other four higher viscosity cases lead to successful sealing results, as shown in Figure 4b. Higher fluid viscosity leads to a faster bridging as indicated by sealing in smaller dimensionless volumes, although their final bridging locations are relatively similar to each other (around 70 mm more or less from the inlet), as shown in Figure 5. All snapshots in Figure 5 are presented at the end of simulation where the remaining frontal particles, in higher viscosity cases (90 and 120 mPa·s), move relatively slower.
It is worth noting that the lowest fluid viscosity (0.3 mPa·s) displays turbulent flow. This explains the spikes in Figure 4a. A snapshot of such a situation is shown in Figure 6, where packs of particles are distorted and have swept the surrounding area. This turbulent effect dissipates when the distorted particle movement reaches the fracture inlet. The highest particle velocity magnitude exhibits as high as 40+ m/s, and the corresponding Reynolds number is around 7500.

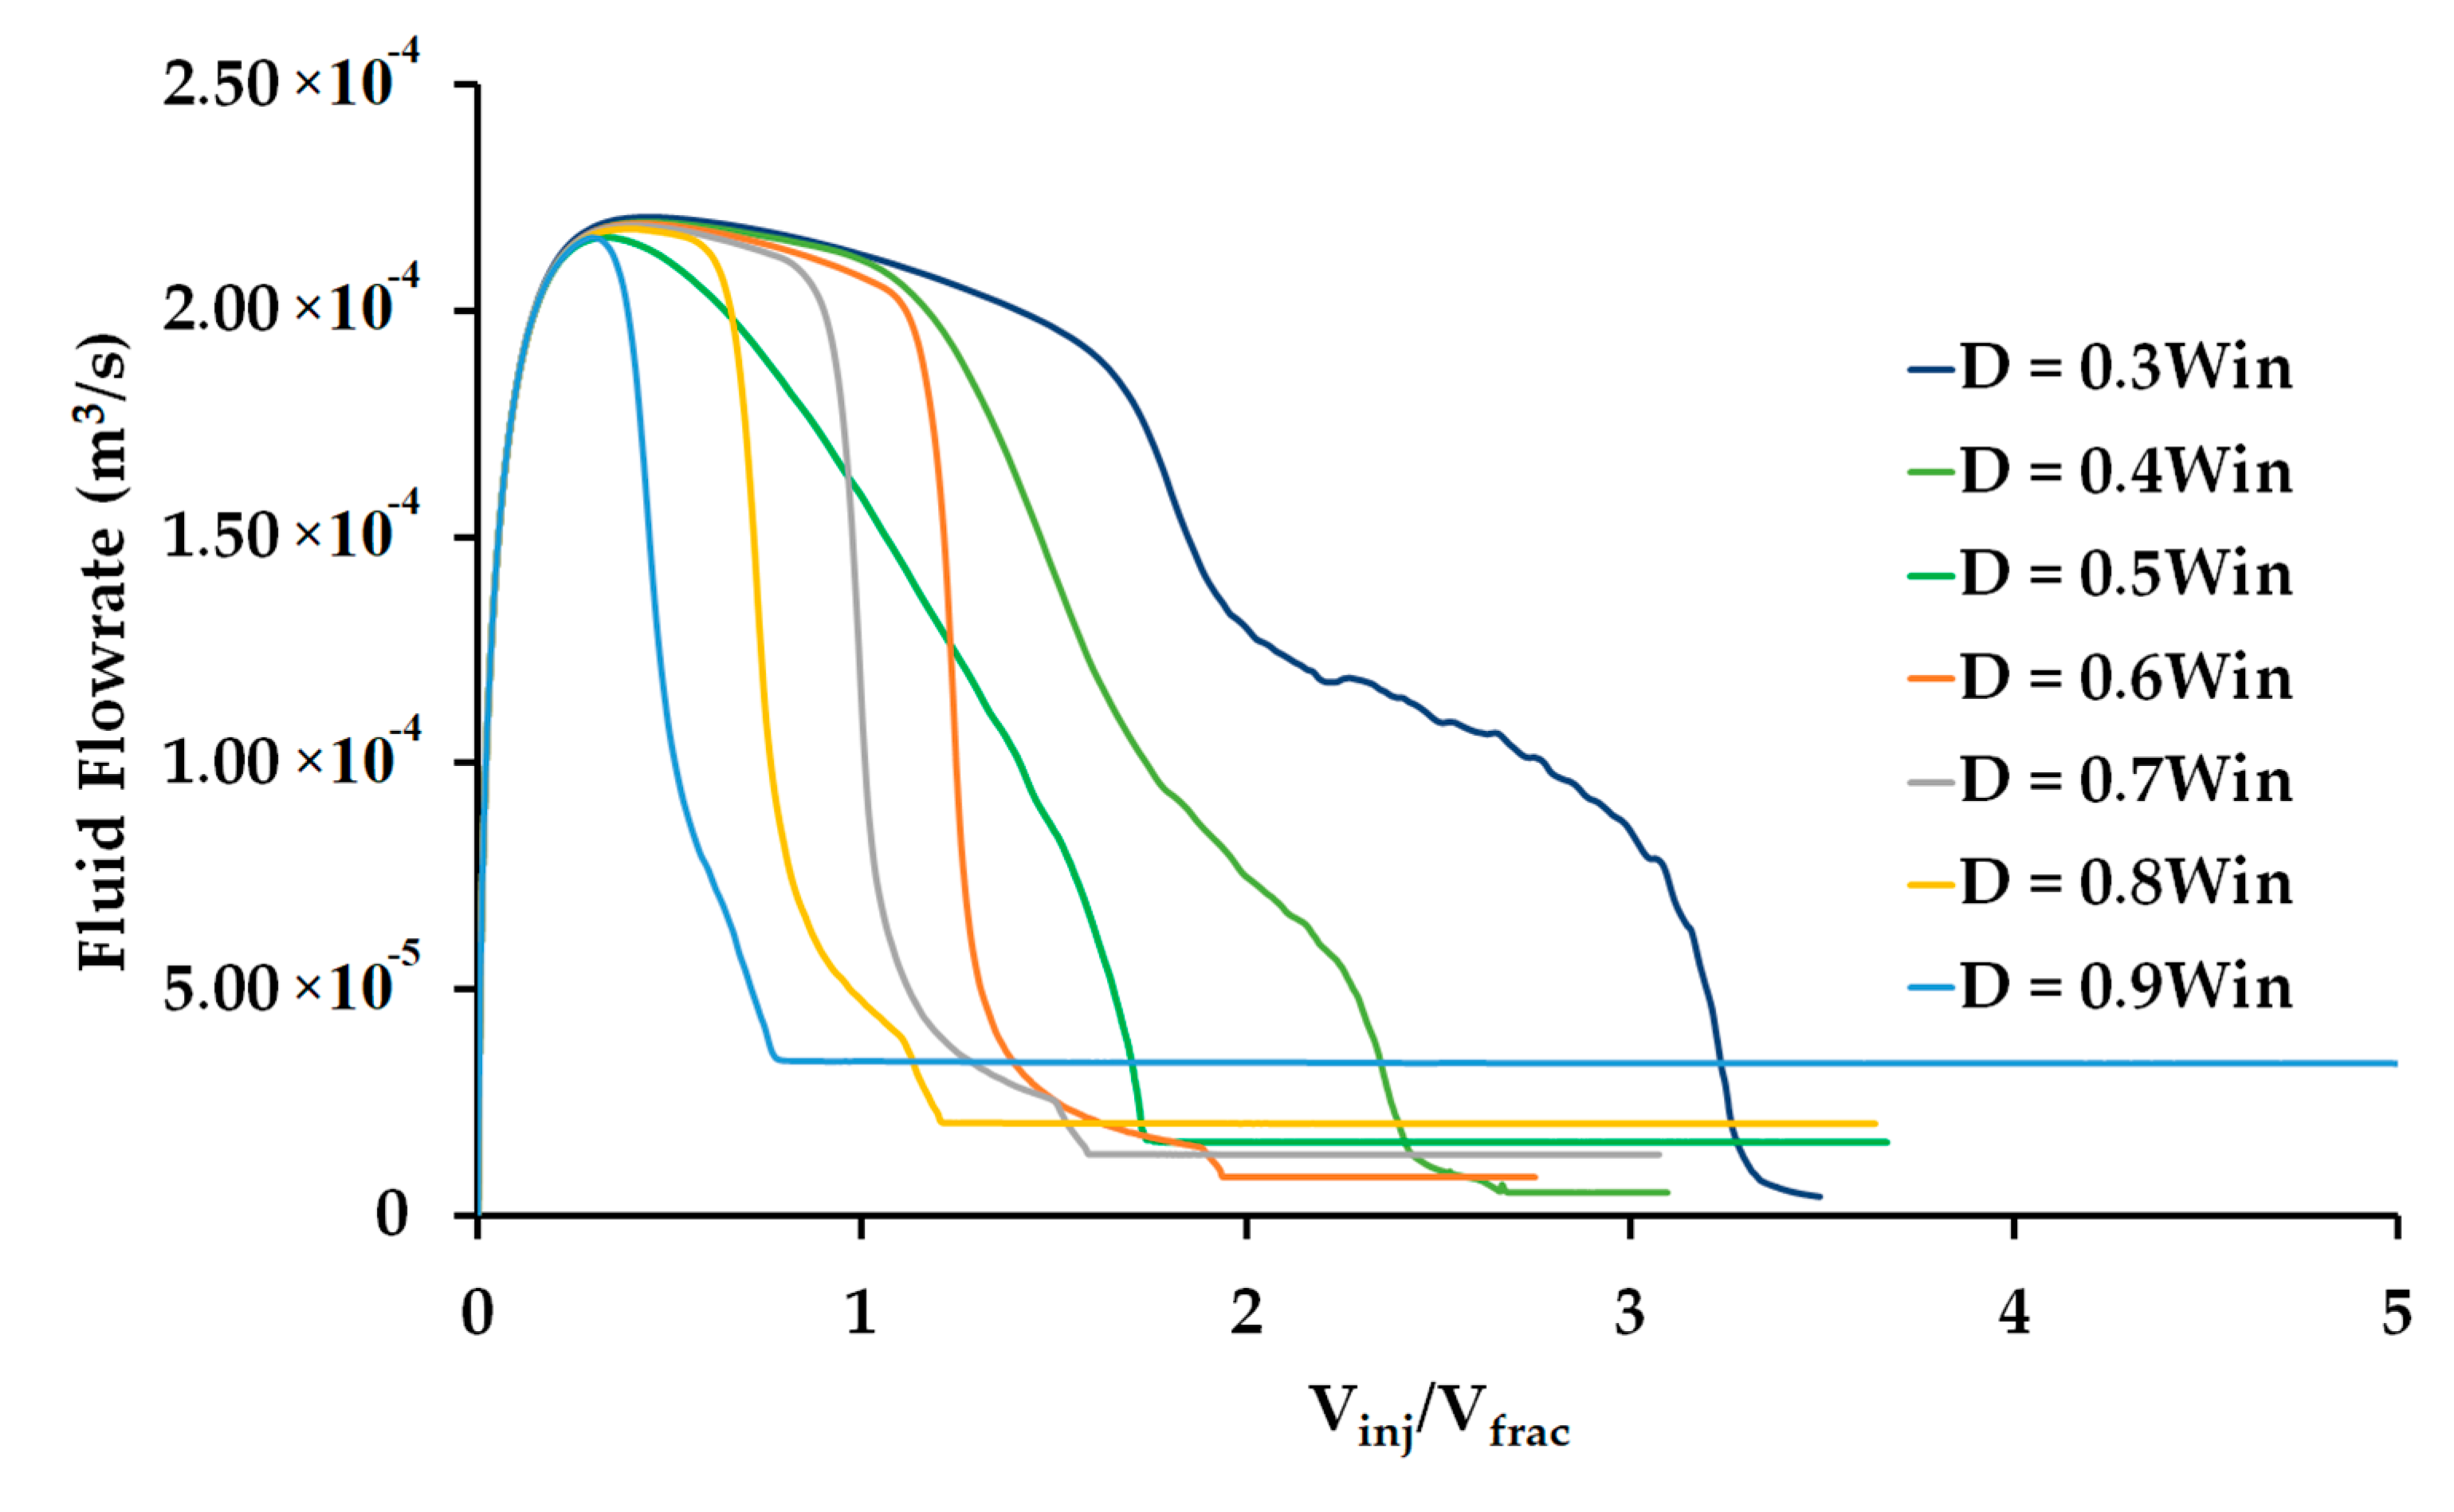
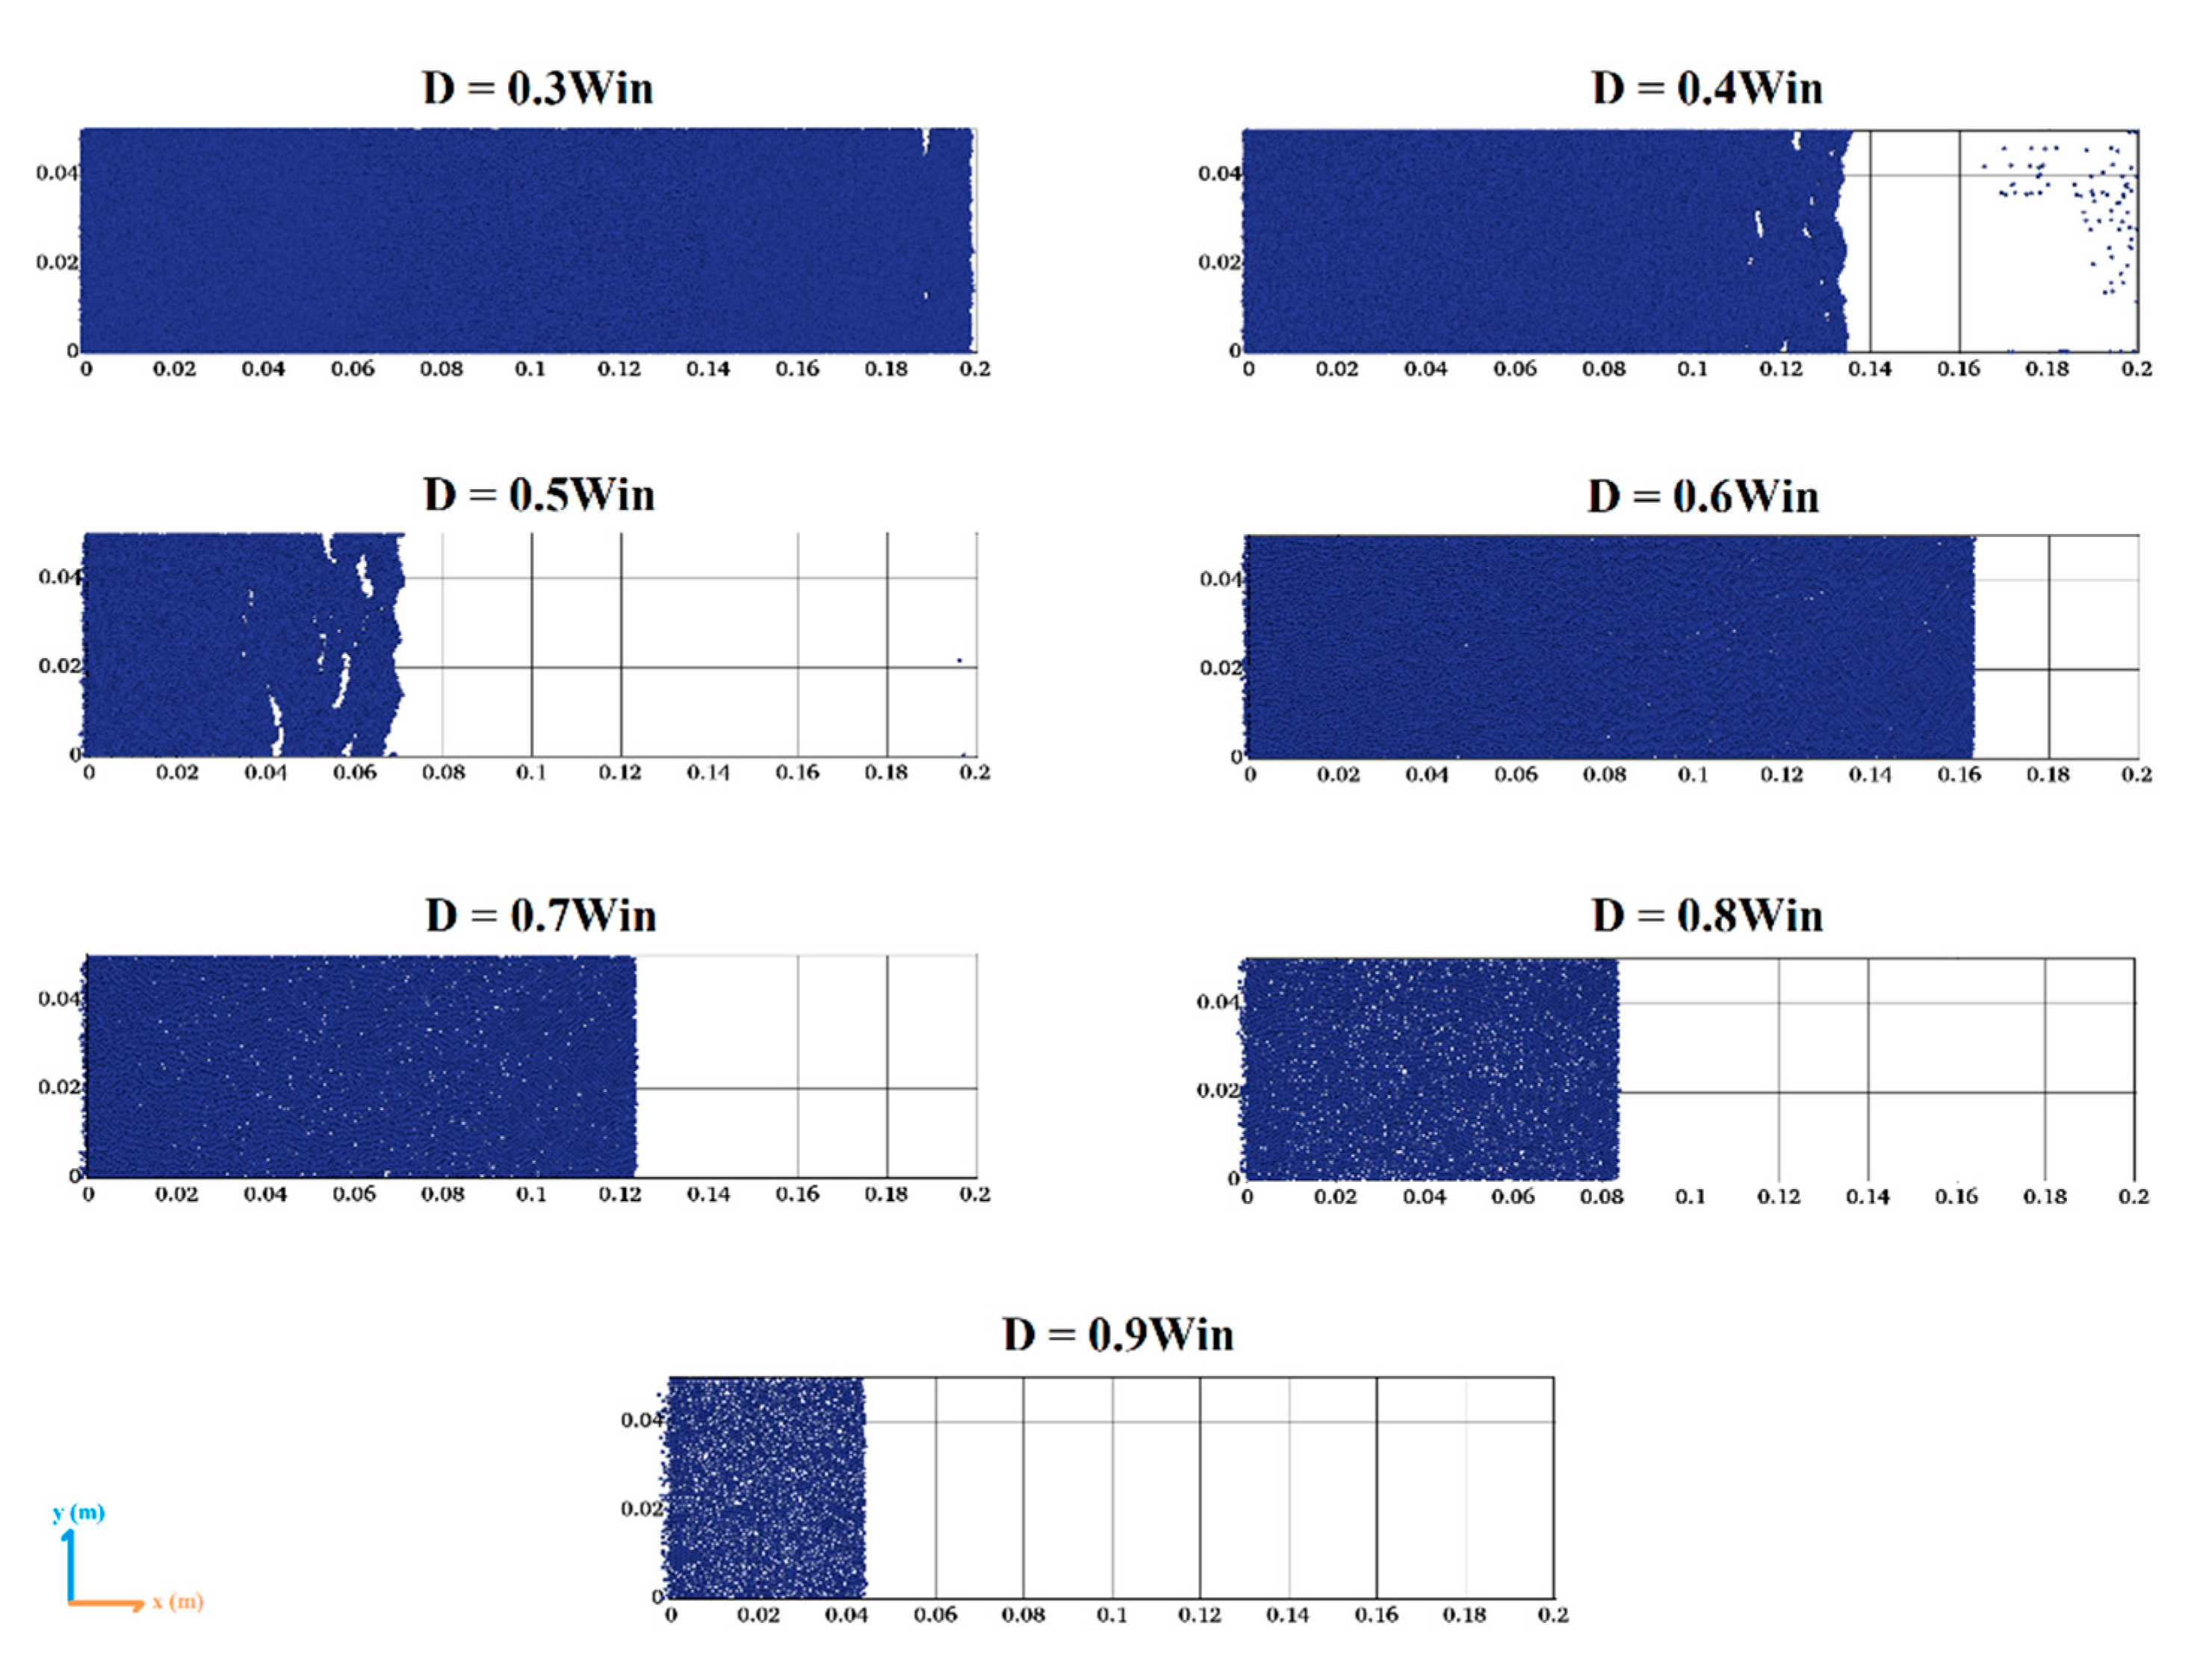
4.3. Particle Size Degradation Due to Temperature Related Issues

As mentioned before, size degradation plays a significant role to reach an effective sealing. It is the key that cost-effective designs must take into consideration; a proper particle size or a distribution of particles is required to effectively bridge and seal a fracture. Seven simulation cases of different particle sizes are run. The particle diameters range from 0.3 to 0.9 mm. These simulation results display the initial packing around the same dimensionless volume as shown in Figure 7. This is most likely due to having the same fluid viscosity. Flowrates peak at around V i n j / V f r a c = 0.4 . and decrease depending on how fast the complete seal is formed. Although successful results are obtained for all cases, the bridging and sealing mechanisms can be categorized into two types. For diameters equal or less than the fracture outlet, initial particle packing occurs in an island or islands inside the fracture. Then, the faster trailing particles collide with the slower frontal particles, resulting in the seal of a fracture. For diameters larger than the fracture outlet, only bridging occurs simply because the particles are not able to pass through the narrow end of fractures. It is shown in Figure 8 that the bridging front of each case situates closer to the fracture inlet as the particle size increases until its diameter becomes larger than fracture outlet. It is worth noting that the fracture outlet is at 0.5 W i n . Therefore, for larger diameters, 0.6 to 0.9 mm, bridging occurs at the location whose width is equal to particle diameter. The bridging by large particles results in insufficient packing where fluid can still flow through the interstitial void space.

4.4. Thermal Influence on Friction Coefficient

Particle–particle friction and particle–wall friction are factors to be considered at elevated temperatures. Particles are easily flushed out to the outlet in a low-friction environment for the LCMs to initiate bridging. The particle bridging occurs in high coefficient cases as shown in Figure 9. For coefficient of 0 and 0.2, there is not enough interparticle forces to form a proper seal. For coefficient of 0.6, 0.8 and 1, bridging occurs in almost the same locations for these cases. However, the bridging locations and the associated fluid losses are similar for the high coefficient cases. This is because all of their initial buildup of force chains starts in the same location close to the inlet, and thus similar results are obtained. These cases show that sufficient friction force is necessary for bridging to occur. This is similar to the variation of fluid viscosity where there is a threshold of the friction force needed between the particles and fluid.

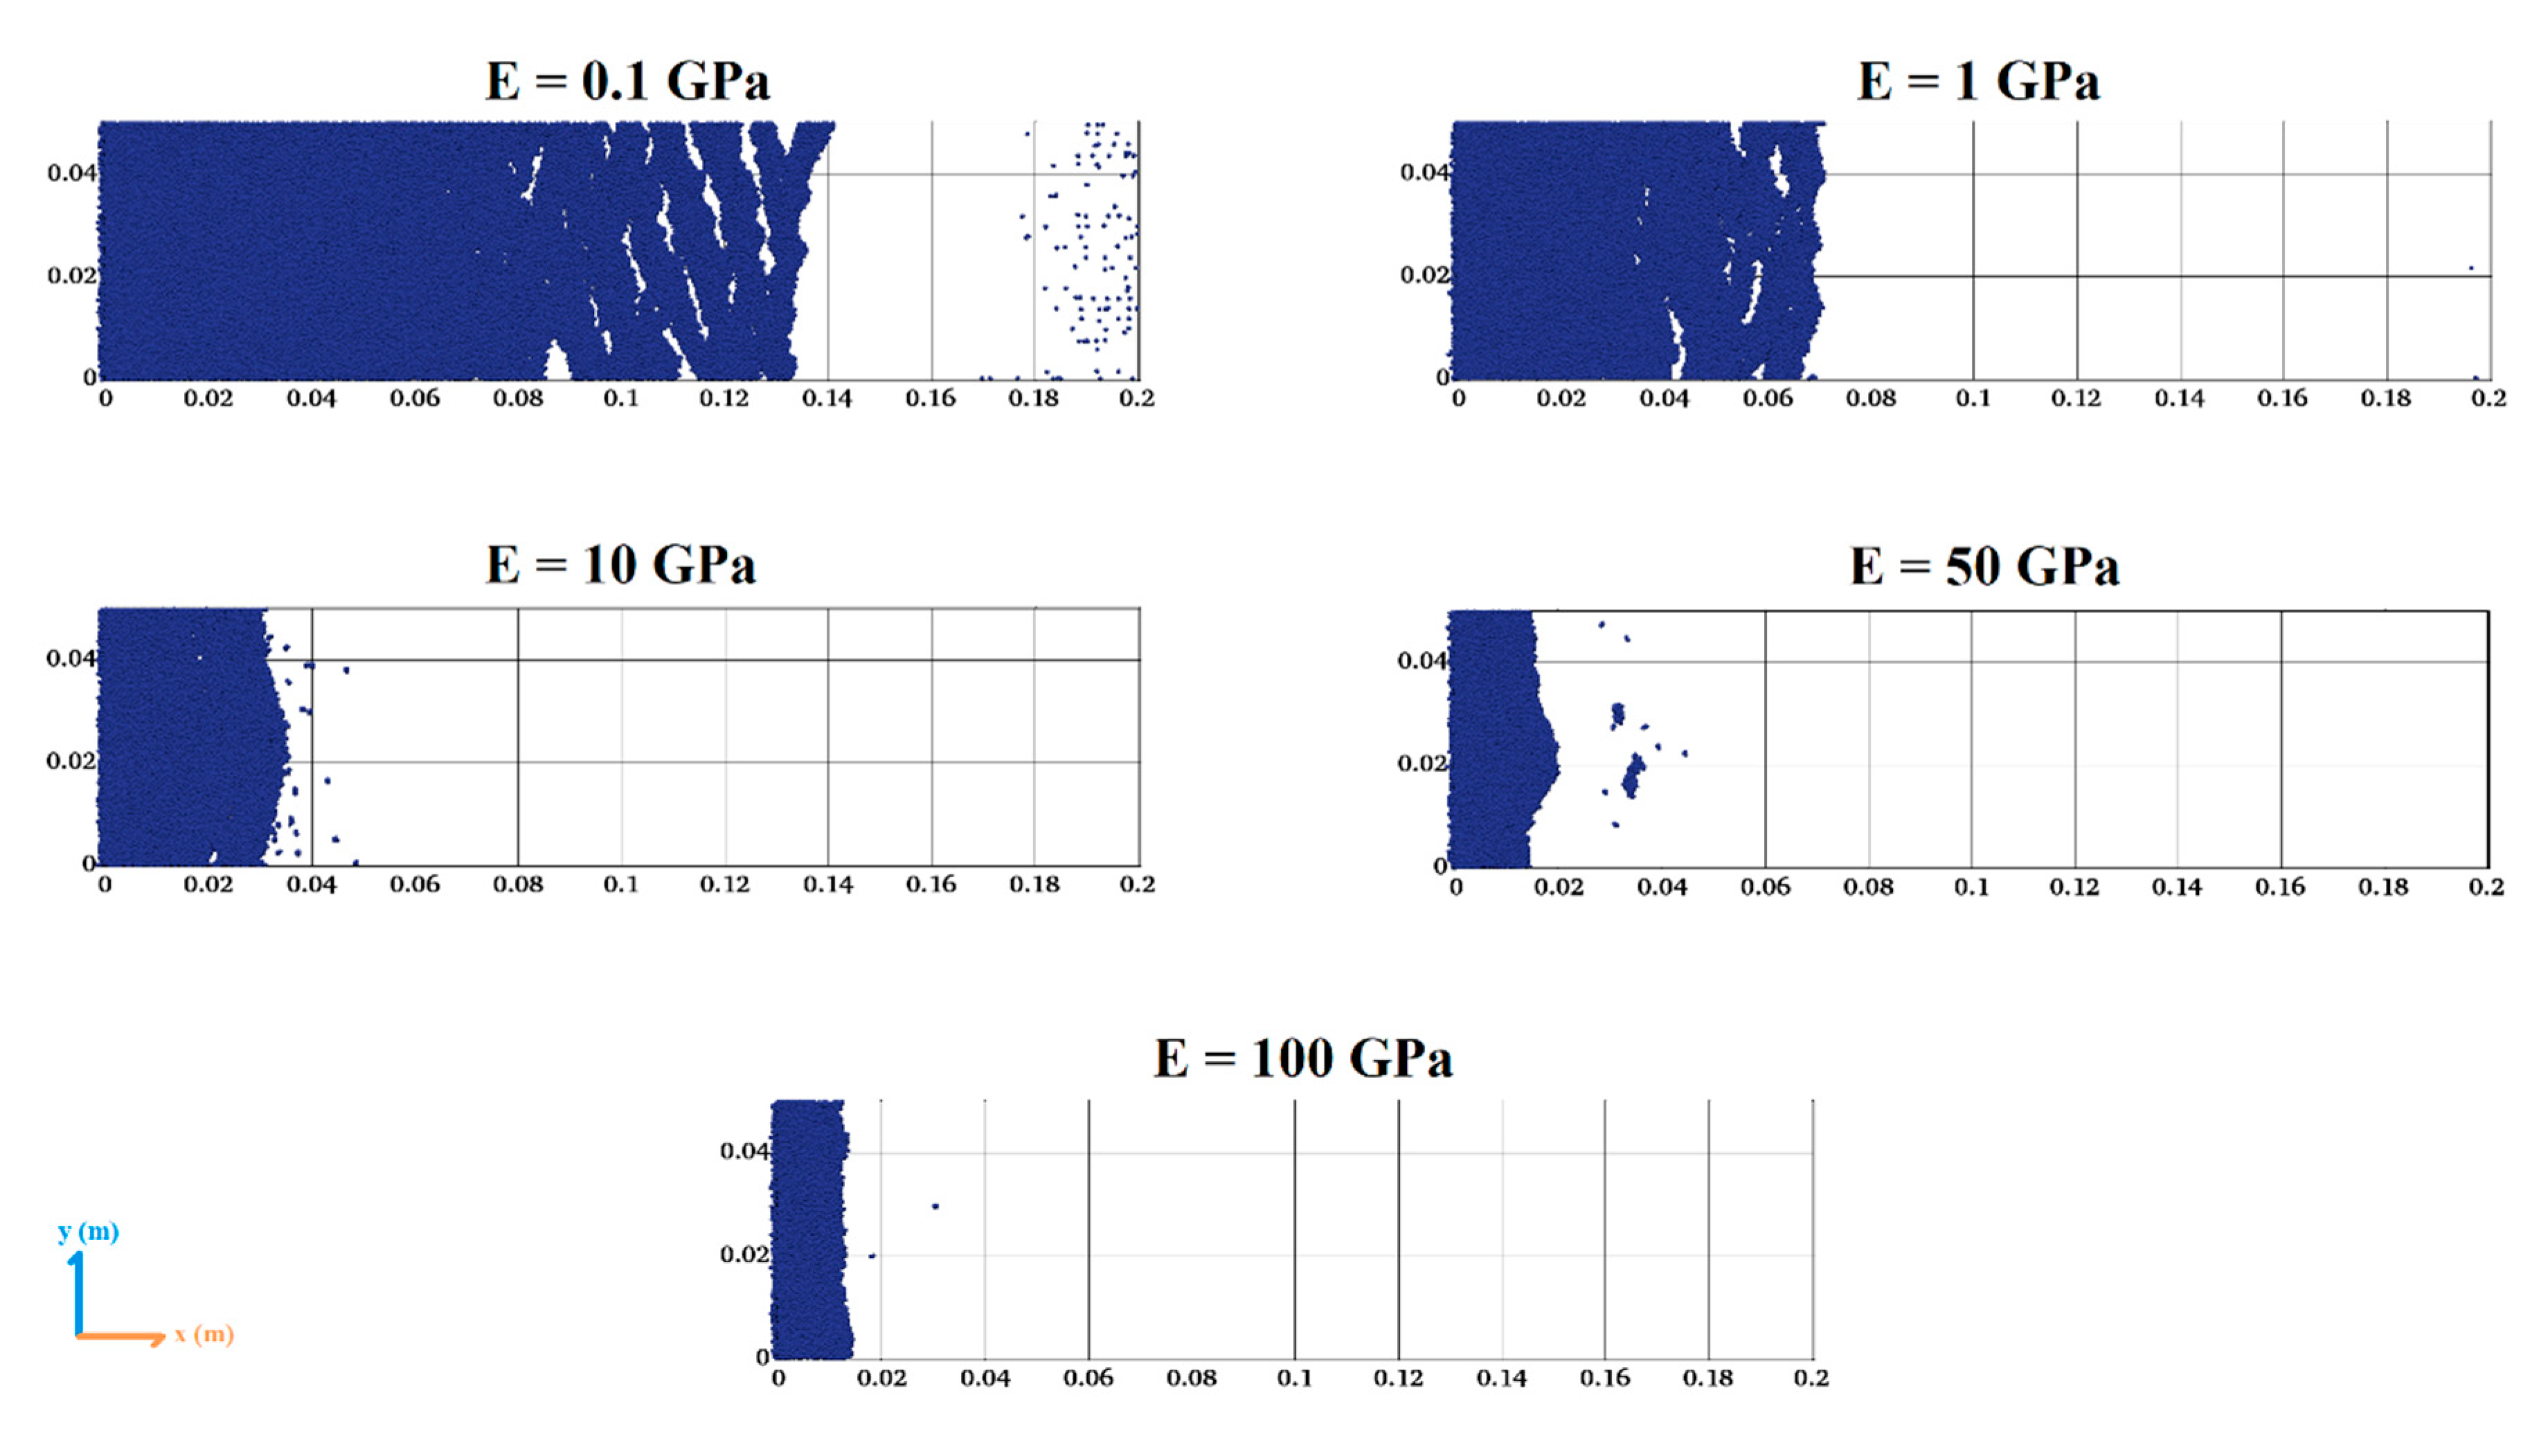
4.5. Thermal Reduction in Young’s Modulus

Particle elasticity or Young’s modulus can greatly affect its fracture sealing capability. Thermally exposed materials can be softened and have a reduction in their elasticity. Fluids with stiffer particles can result in earlier bridging and sealing, as shown in Figure 10 and Figure 11. Rigid LCMs with Young’s modulus of 10+ GPa bridge in a short period and form a seal close to the fracture inlet. Softer materials have a sealing position that is much different than the rigid ones, and their bridging locations are further out towards the fracture outlet. Such differences between the rigid and soft materials come from the fact that the LCMs undergo rapid collisions. Additionally, the softest material (0.1 GPa) experience the longest sealing period, whereas the most rigid material (100 GPa) bridge and seal in a very short time. During the transport process in the fracture, it is easier for the softer materials to bypass each other and penetrate deeper into a location inside a fracture.

5. Conclusions

Parametric studies have been conducted to study the transport of LCM particles in the drilling fluid at elevated temperatures. Each case study only represents the influence of a single parameter. The optimal design would rely on a combination of many factors affected by thermal degradation. Nevertheless, this paper can provide a tool for a better understanding of the sealing mechanisms and how they can be possibly affected at elevated temperatures.
A developed model of coupled CFD–DEM is employed to simulate the fracture sealing phenomenon in a single-sized particle–fluid system. Thermally induced property degradation includes fluid viscosity and particle mechanical properties. Fluid viscosity, particle mechanical strength, and particle size usually decline at elevated temperatures. It is found that differences in viscosity can greatly affect the fracture sealing capability. Sufficient viscous force from the fluid is essential in providing the initial particle bridging. Similarly, the friction coefficient between the solid materials are also necessary in providing enough force to sustain the bridging effect inside the fracture.
Size degradation can also be aggravated by elevated temperatures. Smaller particles can bridge in a deeper location. It is found that a particle diameter of 0.3 mm (3/5 of the outlet width) exhibits successful bridging and sealing from the fracture outlet all the way to the fracture inlet. Particles that are larger than the outlet width exhibit bridging in certain depths of a fracture. However, large particle packing also shows insufficient packing where the fluid can still flow through the interstitial void space. Lastly, Young’s modulus is another important factor that greatly influences the sealing mechanisms. Rigid granular particles tend to bridge and seal in a shallower fracture zone whereas softer materials tend to penetrate deeper in a fracture.

Author Contributions

Conceptualization, A.D.T.; methodology, L.L.; software, L.L.; validation, L.L.; formal analysis, L.L.; data curation, L.L.; writing—original draft preparation, L.L.; writing—review and editing, A.D.T.; visualization, L.L.; supervision, A.D.T.; project administration, A.D.T.; funding acquisition, A.D.T. Both authors have read and agreed to the published version of the manuscript.

Funding

This research was funded by the U.S. Department of Energy’s Office of Energy Efficiency and Renewable Energy (EERE) under the Geothermal Program Office, award number DE EE0008602.

Acknowledgments

An earlier work was presented at the 45th Workshop on Geothermal Reservoir Engineering, Stanford University, Stanford, California, 10–12 February 2020. The authors also acknowledge and appreciate the developers’ contributions towards the open-source software, OpenFOAM, LIGGGHTS, and CFDEM coupling.

Conflicts of Interest

The authors declare no conflict of interest.

References

  1. Finger, J.T.; Blankenship, D.A. Handbook of Best Practices for Geothermal Drilling; Sandia National Laboratories: Albuquerque, NM, USA, 2010.
  2. Denninger, K.; Eustes, A.; Visser, C.; Baker, W.; Bolton, D.; Bell, J.; Bell, S.; Jacobs, A.; Nagandran, U.; Tilley, M.; et al. Optimizing Geothermal Drilling: Oil and Gas Technology Transfer. In Proceedings of the 40th Workshop on Geothermal Reservoir Engineering, Stanford, CA, USA, 26–28 January 2015. [Google Scholar]
  3. Carson, C.C.; Lin, Y.T. Impact of Common Problems in Geothermal Drilling and Completion. In Proceedings of the Annual Geothermal Resources Council Meeting, San Diego, CA, USA, 11 October 1982. [Google Scholar]
  4. Cole, P.; Young, K.R.; Doke, C.; Duncan, N.; Eustes, B. Geothermal Drilling: A Baseline Study of Nonproductive Time Related to Lost Circulation. In Proceedings of the 42nd Workshop on Geothermal Reservoir Engineering, Stanford, CA, USA, 13–15 February 2017. [Google Scholar]
  5. Mansour, A.; Taleghani, A.D.; Salehi, S.; Li, G.; Ezeakacha, C. Smart lost circulation materials for productive zones. J. Pet. Explor. Prod. Technol. 2018, 9, 281–296. [Google Scholar] [CrossRef] [Green Version]
  6. Mansour, A.K.; Taleghani, A.D. Smart Loss Circulation Materials for Drilling Highly Fractured Zones. In Proceedings of the SPE/IADC Middle East Drilling Technology Conference and Exhibition, Abu Dhabi, UAE, 29–31 January 2018. [Google Scholar]
  7. Messenger, J.U. Lost Circulation; Pennwell Corporation: Tulsa, Oklahoma, 1981. [Google Scholar]
  8. Lavrov, A. Lost Circulation: Mechanisms and Solutions; Elsevier: Amsterdam, The Netherlands, 2016. [Google Scholar]
  9. Loeppke, G.E.; Glowka, D.A.; Wright, E.K. Design and Evaluation of Lost-Circulation Materials for Severe Environments. J. Pet. Technol. 1990, 42, 328–337. [Google Scholar] [CrossRef]
  10. Taleghani, A.D.; Ahmadi, M. Thermoporoelastic Analysis of Artificially Fractured Geothermal Reservoirs: A Multiphysics Problem. J. Energy Resour. Technol. 2020, 142, 1–30. [Google Scholar] [CrossRef]
  11. Anderson, T.B.; Jackson, R. Fluid Mechanical Description of Fluidized Beds. Equations of Motion. Ind. Eng. Chem. Fundam. 1967, 6, 527–539. [Google Scholar] [CrossRef]
  12. Basu, D.; Das, K.; Smart, K.; Ofoegbu, G. Comparison of Eulerian-Granular and Discrete Element Models for Simulation of Proppant Flows in Fractured Reservoirs. In Proceedings of the ASME 2015 International Mechanical Engineering Congress and Exposition, Houston, TX, USA, 13–19 November 2015. [Google Scholar]
  13. Wang, F.; Tan, X.; Wang, R.; Sun, M.; Wang, L.; Liu, J. High temperature and high pressure rheological properties of high-density water-based drilling fluids for deep wells. Pet. Sci. 2012, 9, 354–362. [Google Scholar] [CrossRef] [Green Version]
  14. Mohammed, A.S. Effect of Temperature on the Rheological Properties with Shea Stress Limit of Iron Oxide Nanoparticle Modified Bentonite Drilling Muds. Egypt. J. Pet. 2017, 26, 791–802. [Google Scholar] [CrossRef] [Green Version]
  15. Avcı, E.; Mert, B.A. The Rheology and Performance of Geothermal Spring Water-Based Drilling Fluids. Geofluids 2019, 2019, 3786293. [Google Scholar] [CrossRef]
  16. Zhang, L.; Mao, X.; Lu, A. Experimental study on the mechanical properties of rocks at high temperature. Sci. China Ser. E Technol. Sci. 2009, 52, 641–646. [Google Scholar] [CrossRef]
  17. Brotons, V.; Tomás, R.; Ivorra, S.; Alarcón, J. Temperature influence on the physical and mechanical properties of a porous rock: San Julian’s calcarenite. Eng. Geol. 2013, 167, 117–127. [Google Scholar] [CrossRef]
  18. Goodman, M. Lost Circulation in Geothermal Wells: Survey and Evaluation of Industry Experience; Enertech Engineering and Research Co.: Houston, TX, USA, 1981. [Google Scholar]
  19. Arena, U.; D’Amore, M.; Massimilla, L. Carbon attrition during the fluidized combustion of a coal. AIChE J. 1983, 29, 40–49. [Google Scholar] [CrossRef]
  20. Kang, Y.; Tan, Q.; You, L.; Zhang, X.; Xu, C.; Lin, C. Experimental investigation on size degradation of bridging material in drilling fluids. Powder Technol. 2019, 342, 54–66. [Google Scholar] [CrossRef]
  21. Lin, C.-L.; Wey, M.-Y. Influence of hydrodynamic parameters on particle attrition during fluidization at high temperature. Korean J. Chem. Eng. 2005, 22, 154–160. [Google Scholar] [CrossRef]
  22. Goniva, C.; Kloss, C.; Deen, N.G.; Kuipers, J.A.; Pirker, S. Influence of rolling friction on single spout fluidized bed simulation. Particuology 2012, 10, 582–591. [Google Scholar] [CrossRef]
  23. Kloss, C.; Goniva, C.; Hager, A.; Amberger, S.; Pirker, S. Models, algorithms and validation for opensource DEM and CFD-DEM. Prog. Comput. Fluid Dyn. Int. J. 2012, 12, 140–152. [Google Scholar] [CrossRef]
  24. Zhu, H.; Zhou, Z.; Yang, R.; Yu, A. Discrete particle simulation of particulate systems: Theoretical developments. Chem. Eng. Sci. 2007, 62, 3378–3396. [Google Scholar] [CrossRef]
  25. Zhu, H.; Zhou, Z.; Yang, R.; Yu, A. Discrete particle simulation of particulate systems: A review of major applications and findings. Chem. Eng. Sci. 2008, 63, 5728–5770. [Google Scholar] [CrossRef]
  26. Cundall, P.A.; Strack, O.D.L. A discrete numerical model for granular assemblies. Géotechnique 1979, 29, 47–65. [Google Scholar] [CrossRef]
  27. Hertz, H. Ueber die Berührung fester elastischer Körper. J. Reine Angew. Math. 1882, 1882, 156–171. [Google Scholar] [CrossRef]
  28. Di Felice, R. The voidage function for fluid-particle interaction systems. Int. J. Multiph. Flow 1994, 20, 153–159. [Google Scholar] [CrossRef]
  29. Zhou, Z.; Kuang, S.; Chu, K.; Yu, A. Discrete particle simulation of particle–fluid flow: Model formulations and their applicability. J. Fluid Mech. 2010, 661, 482–510. [Google Scholar] [CrossRef]
  30. Peng, Z.; Doroodchi, E.; Luo, C.; Moghtaderi, B. Influence of void fraction calculation on fidelity of CFD-DEM simulation of gas-solid bubbling fluidized beds. AIChE J. 2014, 60, 2000–2018. [Google Scholar] [CrossRef]
  31. Issa, R. Solution of the implicitly discretised fluid flow equations by operator-splitting. J. Comput. Phys. 1986, 62, 40–65. [Google Scholar] [CrossRef]
Figure 1. A schematic diagram of the fracture geometry used in the numerical simulation.
Energies 13 04878 g001
Figure 2. Fracture bridging and sealing by lost-circulation material (LCM) particles.
Energies 13 04878 g002
Figure 3. Fracture sealing and its graphical representation. (a) Initial packing of few particles. (b) A complete seal by LCM particles.
Energies 13 04878 g003
Figure 4. Flowrate at the fracture outlet for fluids with various viscosities. (a) Comparison of all six varying cases. (b) A closer look at the four most viscous fluids.
Energies 13 04878 g004
Figure 5. Successful fracture sealing of the four most viscous fluids.
Energies 13 04878 g005
Figure 6. Turbulent flow attributed to the ultra-low fluid viscosity.
Energies 13 04878 g006
Figure 7. Flowrate at fracture outlet of seven different particle diameters.
Energies 13 04878 g007
Figure 8. Successful bridging in all simulated particle diameters.
Energies 13 04878 g008
Figure 9. Flowrate at fracture outlet on five different friction coefficients.
Energies 13 04878 g009
Figure 10. Flowrate at the fracture outlet from cases with various Young’s moduli.
Energies 13 04878 g010
Figure 11. Successful fracture sealing in all simulated cases of Young’s moduli.
Energies 13 04878 g011
Table 1. Drilling fluid viscosities under various temperatures.
Fluid TypeT (°C)Apparent Viscosity (mPa·s)Plastic Viscosity (mPa·s)
Fresh-Water Based [13]20–24088–7067–33
Brine-Based [13]20–24047–14831–34
Water-Based with Iron Oxide Nanoparticle [14]25–8515.7–2.345.6–9.9
Geothermal Spring [15]15–15019.7–1.86710.65–2.282
Table 2. Granular material properties and softening temperatures [9].
MaterialCompressive Strength at Ambient Temperature (MPa)Young’s Modulus at Ambient Temperature (MPa)Softening Temperature (°C)
Thermoset Rubber14.0043.6443–89
Coal1.4512.96121–166
Expanded Aggregate5.9344.20>260
Gilsonite2.3412.00174–191
Mixed Nut Shells56.74196.50193–249
Black Walnut Shells68.05141.34182–260
Table 3. Properties of drilling fluid and particles (base/reference case in bold and italic).
Drilling FluidDensity (kg/m3)2000
Viscosity (mPa·s)0.3/3/30/60/90/120
LCM ParticlesDiameter (mm)0.3/0.4/0.5/0.6/0.7/0.8/0.9
Density (kg/m3)2500
Young’s Modulus (GPa)0.1/1/10/50/100
Poisson’s Ratio0.2/0.3/0.4/0.5
Friction Coefficient0/0.2/0.4/0.6/0.8/1
Restitution Coefficient0.5

