Abstract
Integrating active power curtailment (APC) of renewable energy sources (RES) in power system planning reduces necessary investments in the power system infrastructure. In current target grid planning methods, APC is considered by fixed curtailment factors without considering the provided flexibility to its full extent. Time-series-based planning methods allow the integration of the time dependency of RES and loads in power system planning, leading to substantial cost savings compared to the worst-case method. In this paper, we present a multi-year planning strategy for high-voltage power system planning, considering APC as an alternative investment option to conventional planning measures. A decomposed approach is chosen to consider APC and conventional measures in a long-term planning horizon of several years. The optimal investment path is obtained with the discounted cash flow method. A case study is conducted for the SimBench high-voltage urban benchmark system. Results show that the time-series-based method allows for reducing investments by up to 84% in comparison to the worst-case method. Furthermore, a sensitivity analysis shows the variation in total expenditures with changing cost assumptions.
1. Introduction
The primary objective of strategic power system planning is to meet future demand and integrate renewable energy sources (RES), with the restriction of being as reliable, economical, and environmentally friendly as possible [1]. These requirements result in many different optimization targets and planning problem formulations, as the exhaustive literature overviews show [2,3,4]. Standard industry practice in power system planning of distribution and sub-transmission grids is to manually design the power system based on a few hypothetical worst-casesituations [5]. RES are only considered to a limited extent with this method. Due to the ambitious goal of Germany to obtain 100% of RES in electricity consumption by 2050 [6], high investments in the grid-infrastructure are expected in coming years, as shown by several studies [7,8,9,10,11,12]. Integrating operational flexibility, for example active power curtailment (APC), in power system planning may reduce the amount of these investments. Recent studies show that when distribution and sub-transmission system operators manage to consider operational flexibility in grid planning, it is possible to reduce additional investments from €36.8 billion to €16.8 billion by 2035 [13,14]. The authors of [15] further show that it is of increasing importance to integrate short-term operational flexibility in planning models. Today, APC is considered by fixed curtailment factors, such as 3% of the annually generated energy, without considering the provided flexibility to its full extent [16]. Several curtailment concepts are currently investigated based on power flow analysis [17] or optimal power flow studies [18,19]. The author of [20] presents a time-series-based method to minimize development costs and shows optimization results for a one-year time horizon using twenty-four representative days. Time-series-based planning methods allow the integration of the time dependency of RES and loads in power system planning, leading to substantial cost savings in comparison to the worst-case method [21]. However, most of the time-series-based strategies considering curtailment focus on a single future year without recommending a possible transformation path to the grid power system planner [22]. In this paper, we present a multi-year planning strategy for high voltage (HV) power system planning, considering APC as an alternative investment option to conventional planning measures. We target the following research questions:
- What is the optimal transformation path considering conventional planning measures and APC for a planning horizon of several years?;
- When is the optimal year to invest in power line replacement measures in comparison to applying APC?;
- How can short-term expenditures from power system curtailment be compared with long-term investments in the power line replacements?
2. Method
2.1. Multi Year Power System Planning
The multi-year planning strategy considers long-term planning horizons by regarding multiple consecutive years. In each year, additional growth of demand and generation is expected. This growth leads to higher infrastructure requirements, and ultimately necessitates grid expansion measures such as power line installations. The typical period for the planning, approval, and construction of a HV overhead line is about 3–5 years, depending on the length and routing of the line. Power line installations result in high capital expenditures (CAPEX) for the grid operator ranging from €0.42 to 1.0 million per kilometer of newly built overhead lines and cables. These installations are designed and maintained over several decades [24]. Efficient usage of operational measures, such as the curtailment of generation, allows the postponing the installation of new power lines. Applying APC, however, increases the operational expenditures (OPEX). The power system operator must decide when to invest in the infrastructure within the planning horizon. The question arises as to when it is more economical to invest in infrastructure than to curtail the in-feed of RES. To answer this question, a discrete optimization problem is formulated with the following assumptions:
- A strong increase of RES is expected in the area of consideration;
- Investments in power lines/transformers are necessary in this area in order to guarantee future supply;
- APC is an alternative option to the investment.
2.1.1. Decision Path Approach
In this paper, we choose a decomposition method to solve the discrete optimization problem. A separated calculation of APC and the planning measures in each year enables the power system operator to evaluate several investment paths under different cost assumptions. We consider the costs per kilometer for power lines, as well as the costs for the curtailed energy, interest rates, and annuities. The decomposed decision path method is depicted in Figure 1. If the power system operator invests in the infrastructure in the first year, CAPEX of are obtained in the same year. Without an investment, the OPEX of from APC are excepted in year one. For each of the two options, two new options are available in year two, leading to four possible combinations of expenditures. Finally, in the last year, decision paths are obtained, which require year simulations in total. We select the optimal path by comparing the net present value (NPV) of the cash flows in the regarded time horizon. In this paper, we compare long-term CAPEX with short-term OPEX with the discounted cash flow (DCF) and the annuity method.
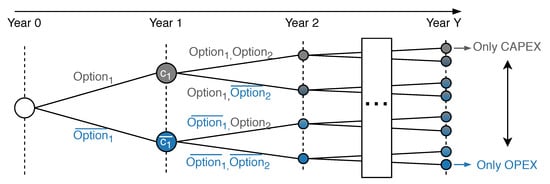
Figure 1.
Multi-Year Decision Path for Y years.
2.1.2. Annuity and Discounted Cash Flow Method
Power system infrastructure, such as power lines, transformers, or substation equipment, are utilized over many decades. The annuity method can be used to find an investment decision in a new project and to compare the resulting CAPEX with annual operational cash flows. The annuity of a project is calculated to finance the installation expenses and is used to obtain continuous payments over a defined time period. The annuity A is calculated as
The annuity consists of the acquisition cost multiplied with the annuity factor . The annuity factor is calculated by the interest factor with a given interest rate and the depreciation years n of the asset [25]. In this paper, we consider the replacement of existing power lines (cables and overhead lines) with the annuity method and assumed that the investment is debt-financed. Figure 2a depicts the annuity method. The initial investment in year zero is divided into equal payments of A for the next n years with . The resulting annuities of power line replacements can then be considered as cash flows within one year and are comparable to the cash flows of the OPEX resulting from APC. To find the optimal investment alternative, the DCF method is applied. DCF is an investment method for determining the value of investment projects. It is based on the financial mathematical concept of discounting cash flows to determine the present capital value. The DCF method discounts future cash flows to a given valuation date. The NPV, calculated in this way, is the discounted cash flow . Figure 2b shows the discounted cash flow method. The cash flows − are discounted with the interest rate to obtain the NPV in year zero. The NPV for a given interest rate is obtained by sum of the discounted cash flows of each period t for a total time horizon of T years [26]
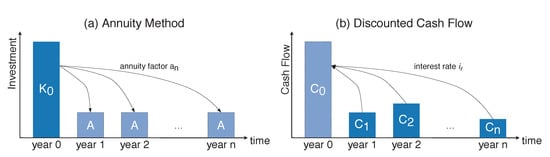
Figure 2.
(a) Annuity Method and (b) Discounted Cash Flow.
2.2. Problem Formulation
Equations (3)–(10) formulate the decision problem. The NPV of cash flows with the interest rate during the planning horizon Y are minimized. In each year y, we assume that it is either invested in the infrastructure, resulting in , or operational measures are taken, resulting in . The two types of expenditure are assumed to be mutually exclusive within one year, formulated by (4). This mutual exclusiveness allows a separate calculation of operational measures and planning measures in each year. Therefore, the curtailed energy and replaced kilometers of power lines are determined separately, without the need to define the costs for each measure prior to the simulation. A comparison of different cost assumptions and the evaluation of several investment paths is thereby possible without the need for recalculation of the regarded time horizon. Technical limits are considered by (5)–(10) during the optimization. The constraints are equal to the standard alternating current (AC)-optimal power flow (OPF) formulation, as defined by, e.g., [27].
Figure 3 shows a flowchart of the implementation. First, a time series for future years is generated by applying growth factors of loads and RES to historically measured time series. The time series are the input to the time series simulation of one year, which determines the critical loading situations in this year. A power flow calculation is performed for each time step with pandapower [28]. The results of the time series simulation are the critical load cases of the currently regarded year. A critical load case is defined as a time step in which either bus voltage magnitude violations or branch loading violations are the result of the power flow calculation. Some thousand load cases can be obtained for a time series in 15 resolution. These load cases are input to the operational optimization in the second step. Each load case is solved individually by applying APC. The same load cases are input to a second optimization considering only grid expansion measures. This planning optimization consists of two steps. First, the most severe load cases are determined as the basis for planning. Second, the optimization algorithm is started considering only planning measures, e.g., power line/transformer replacements or additional line measures. Planning results are the discrete planning measures for the current year. The result of the operational and grid planning optimizations is input to the following year’s two optimizations. This process is repeated until the pre-defined planning horizon of Y years is analyzed. The result is a decision tree consisting of solution paths. The optimal investment path is finally obtained by comparing the NPV of all cash flow paths, as shown in Figure 1. The optimization process results are the applied planning measures of each year as well as the corresponding operational measures. Furthermore, technical limits and expenditures are evaluated. Section 2.2.1 and Section 2.2.2 detail the objective functions of the operational and planning optimization.
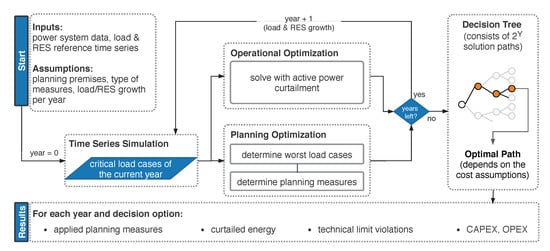
Figure 3.
Implemented combined optimization strategy considering APC and conventional planning measures.
2.2.1. Operational Optimization
The objective of the operational optimization is to minimize curtailment while maintaining the power flow limits as defined by Equations (5)–(10). A minimization of curtailment is achieved by maximizing the power output of the RES generators. Thus, we define the following objective to minimize APC
with as the cost of the generated real power for the RES generators installed in the power system. The cost is a positive value so that the generated power is maximized and the curtailment is minimized. is, for example, the market price at a time step or fixed remuneration value depending on the remuneration of the RES generator. We use pandapower [28] in combination with PowerModels.jl [29] to solve the OPF problem defined by (11) and (5)–(10).
2.2.2. Planning Optimization
In the planning optimization, power line measures are applied to satisfy the power flow constraints defined by (5)–(10). These measures include either power line replacements or the installation of additional lines. We formulate the planning problem considering both measures as
The replacement measures are defined by the set of possible line replacements . The objective (12) is to minimize the sum of line replacement costs . A line is replaced when the binary value is one, and it is not replaced when is zero. Similarly, additional measures are defined by the set of additional lines . The objective is to minimize the line installation cost when the new power line is installed. is a binary variable, which equals one if an additional line is installed and zero otherwise. and are equal to the annuities of these power lines. Further explanations of the problem can be found in [30], which is integrated as transmission network expansion planning (TNEP) in PowerModels.jl [29]. We use the hybrid optimization method combining mathematical programming and heuristic methods from [31] to solve the planning problem.
3. Results—SimBench Case Study
In this section, we apply the proposed framework to the “SimBench” urban HV-system with the SimBench grid code “1-HV-urban–0-sw” [23]. The case study compares the costs of RES curtailment to the costs of line replacement measures for a planning horizon of 10 years. The grid data and the corresponding time series are obtained from [32].
3.1. Benchmark Data and Assumptions
In the following case study, a long-term planning horizon of 10 years is considered. The time series provided with the SimBench HV urban power system are the basis of the optimization. Each year, we assume that consumption and generation time series are scaled by a percentage of the previous year to obtain future scenarios. Table 1 lists the assumed costs, interest rates, and growth factors for loads and RES. Fixed costs are assumed for the curtailed energy of 33 EUR MWh−1 resulting from the average values of market prices between 2014 and 2018 [33]. Furthermore, a depreciation horizon of 50 years with an interest rate of 4%, and replacement costs of 150 kEUR km−1 are assumed for power line replacements as in [34]. As conventional measures, power lines replacements with half the installed impedance are considered. The NPVs of all investment paths are determined by discounting the cash flows with the given interest rate. The optimal path is then selected based on the NPVs, as detailed in Section 2.

Table 1.
SimBench Case study assumptions for load/renewable energy sources (RES) growth, costs, interest rate, and depreciation horizon.
Figure 4 shows the overloaded hours per year with the assumed growth factors of 5% RES per year and 1% load growth. A total of 3672 of line overloadings are expected for the next 10 years with a maximum of 908 in year 10, which equals 10.4% of all 8760 h of the year. The line overloading results from the high in-feed of RES.
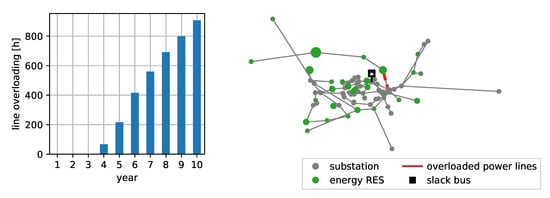
Figure 4.
Forecast of power line loading violations for the SimBench urban HV grid.
3.2. Planning Scenarios
These line overloadings can be mitigated by APC or grid reinforcement measures. In the following comparison, four possible solutions are compared:
- A worst-case solution considering reinforcement under worst-case assumptions and RES reduction factors without time series as a baseline value (reference method);
- A time-series-based reinforcement-only solution without considering any curtailment;
- A time-series-based curtailment-only solution without considering any grid reinforcement measures;
- A time-series-based combined solution of reinforcement and curtailment measures as a result of the integrated optimization method proposed in this paper.
3.3. Planning Results
Calculating grid reinforcement measures based on worst-case assumptions is the state-of-the-art method of grid operators. In the following comparison, the worst-case solution is the baseline value for the time-series-based calculation results. With the worst-case method, the costs of reinforcement and curtailment are calculated based on fixed worst-case scaling factors, as in [7]. Growth factors for load and generation are applied in each year, and power values are scaled with worst-case factors. Figure 5 shows the worst-case result for the SimBench urban case. Each year, the curtailment of generation increases up to a value of 2.0% of the yearly generated energy, resulting from the reduction factor of 0.8 for RES in the worst-case planning calculation. The result of the curtailment is the NPV of OPEX with €2.71 million in the 10 year horizon. Line replacements are necessary in year 10 with a total of being replaced by a parallel line with the same standard type. An annuity of €0.07 million of CAPEX are expected, starting from year 10 onward. The NPV of the total expenditures (TOTEX) during the regarded time horizon is €2.77 million.
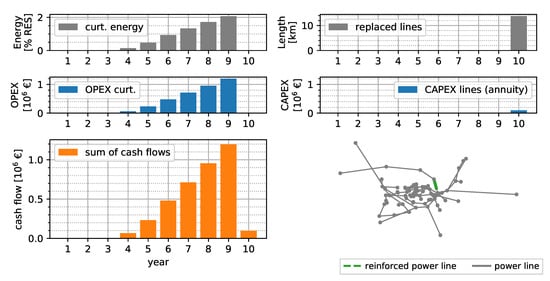
Figure 5.
Worst-case solution assuming an interest rate of 4%, depreciation of 50 years, 150 kEUR km−1 replaced line, and 33 EUR MWh−1 curtailment expenditures.
Figure 6 shows the replaced line lengths and resulting annuities per year when only grid reinforcement measures are applied. Line overloadings are mitigated by replacing of lines in year 3. The resulting NPV of the CAPEX is €0.6 million over the next 10 years.
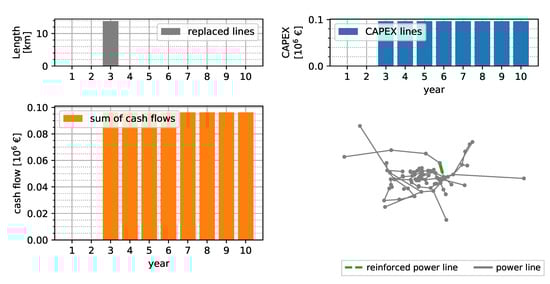
Figure 6.
Reinforcement-only solution assuming an interest rate of 4%, depreciation of 50 years, and 150 kEUR km−1 replaced line.
Figure 7 shows the curtailment-only solution without considering any conventional measures in the 10 year horizon for the SimBench power system. The curtailed energy is shown in per year, as well as relative values to the absolute generation an that year. Up to year 10, the curtailed energy per year is less than 2% of the total generated energy per year. A total of 155 of energy is curtailed in the 10 year horizon. The cash flows of the OPEX range from zero in the first 3 years up to a value of more than €1.46 million in year 10. An NPV of the TOTEX of €3.69 million is obtained for the 10 year horizon.
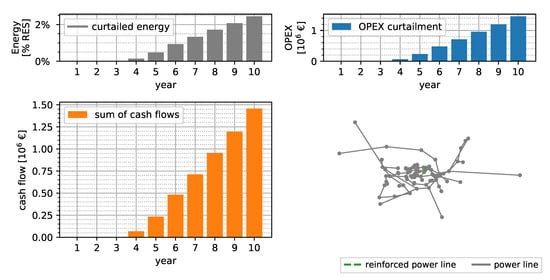
Figure 7.
Curtailment-only solution assuming an interest rate of 4% and 33 EUR MWh−1 curtailment expenditures.
Figure 8 shows the results of a combined optimization of grid reinforcement measures and curtailment of RES with the time-series-based method, as proposed in this paper. Up to year 5, no reinforcement measures are reasonable from an economic point of view. Line overloadings are mitigated by curtailing a total of of energy, resulting in a NPV of €0.06 million of OPEX for the curtailment. In year 5, of lines are replaced, resulting in an annuity of €0.96 million per year and an NPV of CAPEX of €0.43 million. The NPV of TOTEX of the 10 year horizon is €0.49 million.
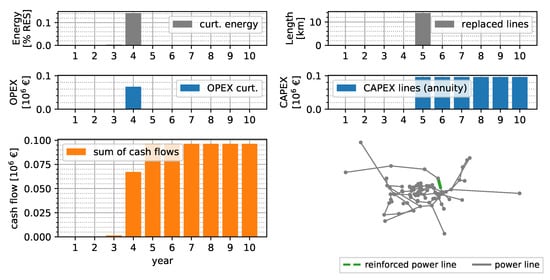
Figure 8.
Combined solution of reinforcement and curtailment measures assuming an interest rate of 4%, depreciation of 50 years, 150 kEUR km−1 replaced line, and 33 EUR MWh−1 curtailment expenditures.
Figure 9 compares the NPVs of cash flows of the regarded investment period (left) and the DCFs of the final year (right). Results are shown for the worst-case, the reinforcement-only, the curtailment-only, and the combined optimization solutions. The highest total NPV of €3.69 million is expected when applying only curtailment measures. A reduction of 25% in costs with a NPV of €2.77 million is obtained by applying the worst-case method. An NPV of CAPEX of €0.6 million is expected when considering only power line replacement measures in a time series simulation. The combined optimization of reinforcement and curtailment measures yields the lowest overall expenditures with an NPV of €0.49 million. The NPV of the total cash flows is 87% less compared to the curtailment-only solution. The DCFs of the final year show that all solutions, except the curtailment-only solution, yield the same expenditures in the final year. This indicates that the expenditures in this year result entirely from the CAPEX and a long-term curtailment strategy is no economic solution. The comparison shows that investments in power line replacements can be deferred in the first years by applying APC.
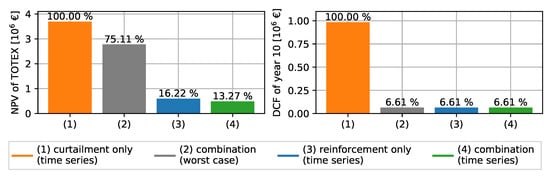
Figure 9.
Comparison of curtailment-only, worst-case, reinforcement-only, and the combined method based on time series. The NPVs of the 10-year horizon (left) and DCFs of year 10 are shown (right).
Figure 10 shows the Pareto frontier of the 10-year planning horizon for all solution paths. Each point represents the NPVs of OPEX or TOTEX with increasing CAPEX. The highest TOTEX are obtained by the curtailment-only, the lowest TOTEX with the combined, and slightly higher values with the reinforcement-only solution. The figure outlines that the law of diminishing return applies when using the proposed time-series-based method. The law of diminishing returns states that lower incremental TOTEX are obtained with increasing CAPEX. Eventually, the TOTEX start increasing with higher CAPEX than obtained by the optimal value of €0.49 million, which is the result of the combined solution.
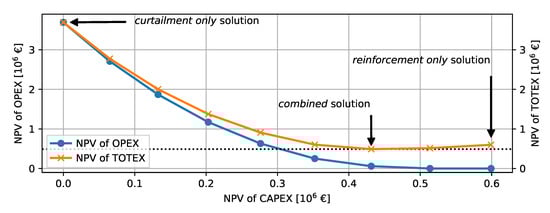
Figure 10.
Pareto frontier of the NPVs in the 10-year horizon of all time-series-based solutions.
The NPVs of the 10 year horizon consider only the investments of the 10-year horizon. Power line installations are, however, long-term investments for even longer periods, e.g., 50 years. The question arises as to what extent the power line installation is a more economical solution than the curtailment-only solution in a 50 year horizon. When analyzing such long-term future horizons, a very high uncertainty follows regarding the increase in RES and load development. To account for this uncertainty, we look at three scenarios: (a) RES constant, (b) RES increase, and (c) RES strong increase. In Scenario (a), we assume that there is no future increase in RES from year 10 onward. Scenario (b) assumes that the increase in curtailment is 5 % per year, and Scenario (c) assumes an even higher increase of 10% curtailment per year. Figure 11 compares the NPVs of TOTEX for the next 50 years for these scenarios. Results are shown without investment and with the power line investment proposed by the worst-case, reinforcement, and combined solution. The comparison shows that the investment is reasonable even when there is no increase in RES, since significantly less energy must be curtailed due to the installed power lines. The difference accounts for factors between 15–55 in TOTEX depending on the assumed scenario. The power line investment is, therefore, a much more valuable asset than the curtailment-only solution.
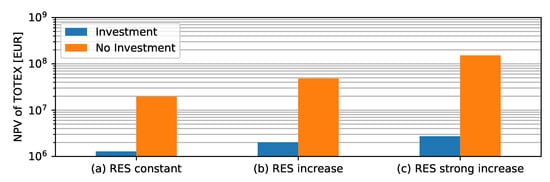
Figure 11.
Prognosis of TOTEX for 50-years with or without investment.
3.4. Sensitivity Analysis
The NPVs of the shown results are obtained based on fixed assumptions for the different parameters. To obtain a sensitivity on the TOTEX of one parameter, we vary each parameter while keeping the remaining ones constant for the combined method based on the time series. Figure 12 shows a detailed sensitivity analysis on the NPV of TOTEX for the parameters curtailment cost, depreciation horizon, interest rate, and line cost per kilometer. We vary each parameter between −90% and 100% of its initial value while fixing the remaining parameters to their original value. A steeper gradient of the resulting curve equals a high sensitivity to the parameter. Increasing the depreciation horizon further from 50 years has the lowest impact on the NPV of the TOTEX. A decreasing depreciation horizon increases the TOTEX significantly. Varying the interest rate and the costs for curtailment has a similar effect on the NPV of TOTEX. Decreasing the costs per kilometer leads to a sharper reduction in the expenditures. The extreme values, such as a short depreciation horizon and low costs per kilometer, are not realistic and should only illustrate the sensitivity to the parameter.
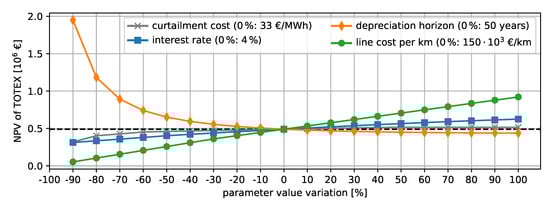
Figure 12.
Sensitivity analysis. Each parameter is varied between −90% and 200% of the initial values.
4. Discussion
The comparison shows that the proposed time-series-based planning method allows reducing planning expenditures in comparison to the worst-case reference method significantly. The proposed method helps to achieve cost savings when integrating RES in power systems, since the power system operator can determine curtailment accurately per year and plan the power system accordingly. Power system operators can compare several investment paths with the proposed method, and the optimal path can be chosen based on the NPV of the regarded planning horizon. The combined consideration of curtailment measures and line replacements reduces the NPV of TOTEX by 87% to €0.49 million in comparison to the baseline value from the worst-case method (€2.77 million). A decrease of 84% of the TOTEX, as with the worst-case method, are expected when using only conventional replacement measures. When applying only curtailment measures, expenditures are increased by 35% in comparison to the baseline. Curtailing the energy from RES for the next 10 years is, therefore, an expensive solution. As shown by the results, it is possible to determine the necessary APC more accurately based on time series in comparison to static curtailment factors, e.g., 3% of the yearly generated energy, as applied in [7,16]. Grid reinforcement measures can be cost-effective from early on when less than 1% of RES energy needs to be curtailed. The results, however, strongly depend on the employed input time series and the assumed costs. When regarding the long-term horizon of 50-years, power line installations are a much more valuable asset than applying only APC measures. The resulting power line installation solution of the case study is even economical if there is no further increase in RES after the 10-horizon.
The resulting expenditures vary according to the assumed costs, as shown by the sensitivity analysis. The sensitivity analysis highlights that the most crucial factors are the assumed cost of the curtailed energy, the interest rate, and the cost per kilometer for each replaced line. Power system operators should, therefore, try to minimize these costs as far as possible. Longer depreciation horizons than 50 years have little impact on the TOTEX. A drawback of the proposed method is the long simulation time in comparison to the worst-case method. For a time horizon of ten years, the calculation takes 6–8 compared to less than half an hour on a modern desktop computer for the SimBench HV test case. Shorter calculation times can be achieved by splitting the analyzed decision tree into several shorter periods of, e.g., 4–5 years. Splitting the tree into shorter periods decreases accuracy and may increase planning costs. Another disadvantage of the proposed method is the requirement of measured or synthetically generated time series as inputs. These time series are, however, commonly available at the HV level.
5. Conclusions
This paper proposes a time-series-based method for power system planning, considering conventional measures and APC. With the presented method, power system planners are able to obtain investment paths for long-term planning horizons of multiple years. The method determines the optimal year to built power lines within the regarded planning horizon. Compared to the worst-case reference method, a cost reduction of up to 87% is achievable under the given cost assumptions, as shown by the SimBench results. Additionally, a variation in the cost assumption is easily possible with the proposed decomposition approach. An exemplary cost sensitivity analysis shows the impact of the assumed parameters. We further show that the law of diminishing return applies when using the proposed time-series-based method, leading to potential cost savings in the long-run.
In future works, we recommend analyzing the impact of multiple shorter planning periods compared to the calculation of the full investment tree and alternative financing strategies to reduce calculation times. Additionally, the results could be compared to an integrated optimization of APC and CAPEX within the same year. Furthermore, additional operational flexibility options, e.g., storage systems or demand side management, could be integrated into the proposed framework.
Author Contributions
Conceptualization, methodology, software, validation, formal analysis, investigation, data preparation, visualization, and writing of the original draft preparation was done by F.S.; Reviewing and editing, supervision, project administration, and funding acquisition was done by M.B. All authors have read and agreed to the published version of the manuscript.
Funding
The research is part of the project “Spitzenkappung und Netzausbauplanung—automatisiert und intelligent (SpinAI)” and funded by the German Federal Ministry for Economic Affairs and Energy (grant number 0350030B). The authors are solely responsible for the content of this publication.
Conflicts of Interest
The authors declare no conflict of interest. The funders had no role in the design of the study; in the collection, analyses, or interpretation of data; in the writing of the manuscript, or in the decision to publish the results.
Nomenclature
| binary variable which is 1 if a power line is replaced and 0 otherwise | |
| binary variable which is 1 if an additional power line is installed and 0 otherwise | |
| branch voltage angle difference bounds | |
| replacement cost of power line measure m in EUR km−1 | |
| installation cost of an additional line measure m in EUR km−1 | |
| cost of power generation in EUR MWh−1 | |
| interest rate | |
| branch current limit | |
| q | interest factor |
| branch apparent power limit | |
| voltage bounds | |
| A | annuity |
| B | set of branches |
| G | set of generators |
| acquisition cost | |
| N | set of buses |
| power line replacement measure set | |
| additional line measure set | |
| real power injection of generator k | |
| R | reference buses |
| load apparent power demand | |
| generator apparent power dispatch | |
| branch apparent power flow (PF) | |
| generator complex power bounds | |
| bus complex voltage |
Abbreviations
The following abbreviations are used in this manuscript:
| AC | alternating current |
| APC | active power curtailment |
| CAPEX | capital expenditures |
| DCF | discounted cash flow |
| HV | high voltage |
| NPV | net present value |
| OPEX | operational expenditures |
| OPF | optimal power flow |
| PF | power flow |
| RES | renewable energy sources |
| TNEP | transmission network expansion planning |
| TOTEX | total expenditures |
References
- Bundesministerium der Justiz und Verbraucherschutz. Gesetz über die Elektrizitäts- und Gasversorgung (Energiewirtschaftsgesetz - EnWG). 2005. Available online: https://www.gesetze-im-internet.de/enwg_2005/ (accessed on 18 September 2020).
- Ude, N.G.; Yskandar, H.; Graham, R.C. A Comprehensive State-of-the-Art Survey on the Transmission Network Expansion Planning Optimization Algorithms. IEEE Access 2019, 7, 123158–123181. [Google Scholar] [CrossRef]
- Resener, M.; Haffner, S.; Pereira, L.A.; Pardalos, P.M. Optimization Techniques Applied to Planning of Electric Power Distribution Systems: A Bibliographic Survey. Energy Syst. 2018, 9, 473–509. [Google Scholar] [CrossRef]
- Mahdavi, M.; Antunez, C.S.; Ajalli, M.; Romero, R. Transmission Expansion Planning: Literature Review and Classification. IEEE Syst. J. 2019, 13, 3129–3140. [Google Scholar] [CrossRef]
- Schlabbach, J.; Rofalski, K.H. Power System Engineering: Planning, Design, and Operation of Power Systems and Equipment, 2nd ed.; John Wiley & Sons: Hoboken, NJ, USA, 2014. [Google Scholar]
- Hansen, K.; Mathiesen, B.V.; Skov, I.R. Full energy system transition towards 100% renewable energy in Germany in 2050. Renew. Sustain. Energy Rev. 2019, 102, 1–13. [Google Scholar] [CrossRef]
- Höflich, B.; Richard, P.; Völker, J.; Rehtanz, C.; Greve, M.; Gwisdorf, B.; Kays, J.; Noll, T. dena-Verteilnetzstudie Ausbau-Und Innovationsbedarf der Stromverteilnetze in Deutschland bis 2030; Deutsche Energie-Agentur: Berlin Germany, 2012. [Google Scholar]
- Buechner, J.; Katzfey, J.; Floercken, O.; Moser, A.; Schuster, H.; Dierkes, S.; van Leeuwen, T.; Verheggen, L.; Uslar, M.; van Amelsvoort, M. Moderne Verteilernetze für Deutschland (Verteilernetzstudie); Bundesministeriums für Wirtschaft und Energie (BMWi): Bonn, Germany, 2014. [Google Scholar]
- Ackermann, T.; Martensen, N.; Brown, T.; Untsch, S.; Tröster, E.; Geidel, S.; Koch, M.; Bauknecht, D.; Heinemann, C.; Ritter, D.; et al. Verteilnetzstudie Rheinland-Pfalz. In Hg. v. Ministerium für Wirtschaft, Klimaschutz, Energie und Landesplanung Rheinland-Pfalz (MWKEL); Energynautics GmbH: Langen, Germany, 2014. [Google Scholar]
- Rehtanz, C.; Moser, A.; Kays, J. Leistungsfähigkeit und Ausbaubedarf der Verteilnetze in Nordrhein-Westfalen (Gutachten); Dortmund: Aachen, Germany, 2014. [Google Scholar]
- Rehtanz, C.; Greve, M.; Häger, U.; Hagemann, Z.; Kippelt, S.; Kittl, C.; Koubert, M.L.; Pohl, O.; Rewald, F.; Wagner, C. Verteilnetzstudie für das Land Baden-Württemberg; Ministerium für Umwelt, Klima und Energiewirtschaft Baden Württemberg: Dortmund, Deutschland, 2017.
- Braun, M.; Krybus, I.; Becker, H.; Bolgaryn, R.; Dasenbrock, J.; Gauglitz, P.; Horst, D.; Pape, C.; Scheidler, A.; Ulffers, J. Verteilnetzstudie Hessen 2024–2034. 2019. Available online: https://www.energieland.hessen.de/verteilnetzstudie_hessen (accessed on 21 July 2020).
- E-Bridge Consulting GmbH. Wirtschaftlicher Vorteil der netzdienlichen Nutzung von Flexibilität in Verteilnetzen. 2019. Available online: https://www.e-bridge.de/wp-content/uploads/2019/02/20190212_Studie-E-Bridge_Vorteil_netzdienlicher-Flexibilität_final.pdf (accessed on 24 July 2020).
- Deutsche Energieagentur (Dena). Dena-Netzflexstudie Optimierter Einsatz von Speichern für Netz-und Marktanwendungen in der Stromversorgung. 2017. Available online: https://www.dena.de/themen-projekte/projekte/energiesysteme/netzflexstudie (accessed on 24 July 2020).
- Deng, X.; Lv, T. Power system planning with increasing variable renewable energy: A review of optimization models. J. Clean. Prod. 2020, 246, 118962. [Google Scholar] [CrossRef]
- VDE Verband der Elektrotechnik|FNN. FNN-Hinweis Spitzenkappung: Spitzenkappung—Ein Neuer Planerischer Freiheitsgrad: Spitzenkappung. 2017. Available online: https://www.vde.com/resource/blob/1578210/285c23868325c8e31c60d81ebb0b2967/hinweis-spitzenkappung-data.pdf (accessed on 24 July 2020).
- Liere-Netheler, I.; Schuldt, F.; von Maydell, K.; Agert, C. Simulation of Incidental Distributed Generation Curtailment to Maximize the Integration of Renewable Energy Generation in Power Systems. Energies 2020, 13, 4173. [Google Scholar] [CrossRef]
- Liere-Netheler, I.; Schuldt, F.; von Maydell, K.; Agert, C. Optimised curtailment of distributed generators for the provision of congestion management services considering discrete controllability. IET Gener. Transm. Distrib. 2020, 14, 735–744. [Google Scholar] [CrossRef]
- Meier, F.; Tobermann, C.; Braun, M. Retrospective optimal power flow for low discriminating active power curtailment. In 2019 IEEE Milan PowerTech; IEEE: Piscataway, NJ, USA, 2019. [Google Scholar] [CrossRef]
- Andrychowicz, M. Comparison of the Use of Energy Storages and Energy Curtailment as an Addition to the Allocation of Renewable Energy in the Distribution System in Order to Minimize Development Costs. Energies 2020, 13, 3746. [Google Scholar] [CrossRef]
- Müller, U.P.; Schachler, B.; Scharf, M.; Bunke, W.D.; Günther, S.; Bartels, J.; Pleßmann, G. Integrated Techno-Economic Power System Planning of Transmission and Distribution Grids. Energies 2019, 12, 2091. [Google Scholar] [CrossRef]
- Dalhues, S.; Zhou, Y.; Pohl, O.; Rewald, F.; Erlemeyer, F.; Schmid, D.; Zwartscholten, J.; Hagemann, Z.; Wagner, C.; Gonzalez, D.M.; et al. Towards research and practice of flexibility in distribution systems: A review. CSEE J. Power Energy Syst. 2019, 5, 285–294. [Google Scholar] [CrossRef]
- Meinecke, S.; Sarajlić, D.; Drauz, S.R.; Klettke, A.; Lauven, L.P.; Rehtanz, C.; Moser, A.; Braun, M. SimBench—A Benchmark Dataset of Electric Power Systems to Compare Innovative Solutions Based on Power Flow Analysis. Energies 2020, 13, 3290. [Google Scholar] [CrossRef]
- Scheffler, J. Verteilnetze auf dem Weg zum Flächenkraftwerk; Springer: Berlin/Heidelberg, Germany, 2016. [Google Scholar] [CrossRef]
- Schwab, A.J. Elektroenergiesysteme; Springer: Berlin/Heidelberg, Germany, 2017. [Google Scholar] [CrossRef]
- Hillier, D.; Ross, S.; Westerfield, R.; Jaffe, J.; Jordan, B. Corporate Finance, 12th ed.; McGraw Hill: New York, NY, USA, 2019. [Google Scholar]
- Wood, A.J.; Wollenberg, B.F.; Sheblé, G.B. Power Generation, Operation, and Control; John Wiley & Sons: Hoboken, NJ, USA, 2013. [Google Scholar]
- Thurner, L.; Scheidler, A.; Schäfer, F.; Menke, J.H.; Dollichon, J.; Meier, F.; Meinecke, S.; Braun, M. Pandapower—An Open-Source Python Tool for Convenient Modeling, Analysis, and Optimization of Electric Power Systems. IEEE Trans. Power Syst. 2018, 33, 6510–6521. [Google Scholar] [CrossRef]
- Coffrin, C.; Bent, R.; Sundar, K.; Ng, Y.; Lubin, M. PowerModels. JL: An Open-Source Framework for Exploring Power Flow Formulations. In Proceedings of the 2018 Power Systems Computation Conference (PSCC), Dublin, Ireland, 11–15 June 2018; IEEE: Piscataway, NJ, USA, 2018. [Google Scholar] [CrossRef]
- Bent, R.; Toole, G.L.; Berscheid, A. Transmission Network Expansion Planning With Complex Power Flow Models. IEEE Trans. Power Syst. 2012, 27, 904–912. [Google Scholar] [CrossRef]
- Schäfer, F.; Scheidler, A.; Braun, M. A Hybrid Optimization Method Combining Network Expansion Planning and Switching State Optimization. IEEE Open Access J. Power Energy 2020, 7, 234–242. [Google Scholar] [CrossRef]
- Fraunhofer IEE and University of Kassel. SimBench—Benchmark Data Set for Grid Analysis, Grid Planning And Grid Operation Management. Available online: https://simbench.de/en (accessed on 24 August 2020).
- Muehlenpfordt, J. Open Power System Data Time series Database. 2019. Available online: https://data.open-power-system-data.org/time_series/2019-06-05 (accessed on 24 August 2020). [CrossRef]
- Mitteldeutsche Netzgesellschaft Strom mbH. Neubau 110-kV-Hochspannungsfreileitung Abzweig Oberelsdorf Bl. 1013 Vergleichsrechnung zur Bewertung einer alternativen Verkabelung. 2017. Available online: https://lbgr.brandenburg.de/media_fast/4055/Vergleichsrechnung_Gr%C3%A4-Schw-Fiwa_40Jahre%2011_17.pdf (accessed on 28 August 2020).


© 2020 by the authors. Licensee MDPI, Basel, Switzerland. This article is an open access article distributed under the terms and conditions of the Creative Commons Attribution (CC BY) license (http://creativecommons.org/licenses/by/4.0/).