Gas Pressure Cycling (GPC) and Solvent-Assisted Gas Pressure Cycling (SA-GPC) Enhanced Oil Recovery Processes in a Thin Heavy Oil Reservoir


Abstract
:
1. Introduction
2. Materials and Methods
2.1. Materials
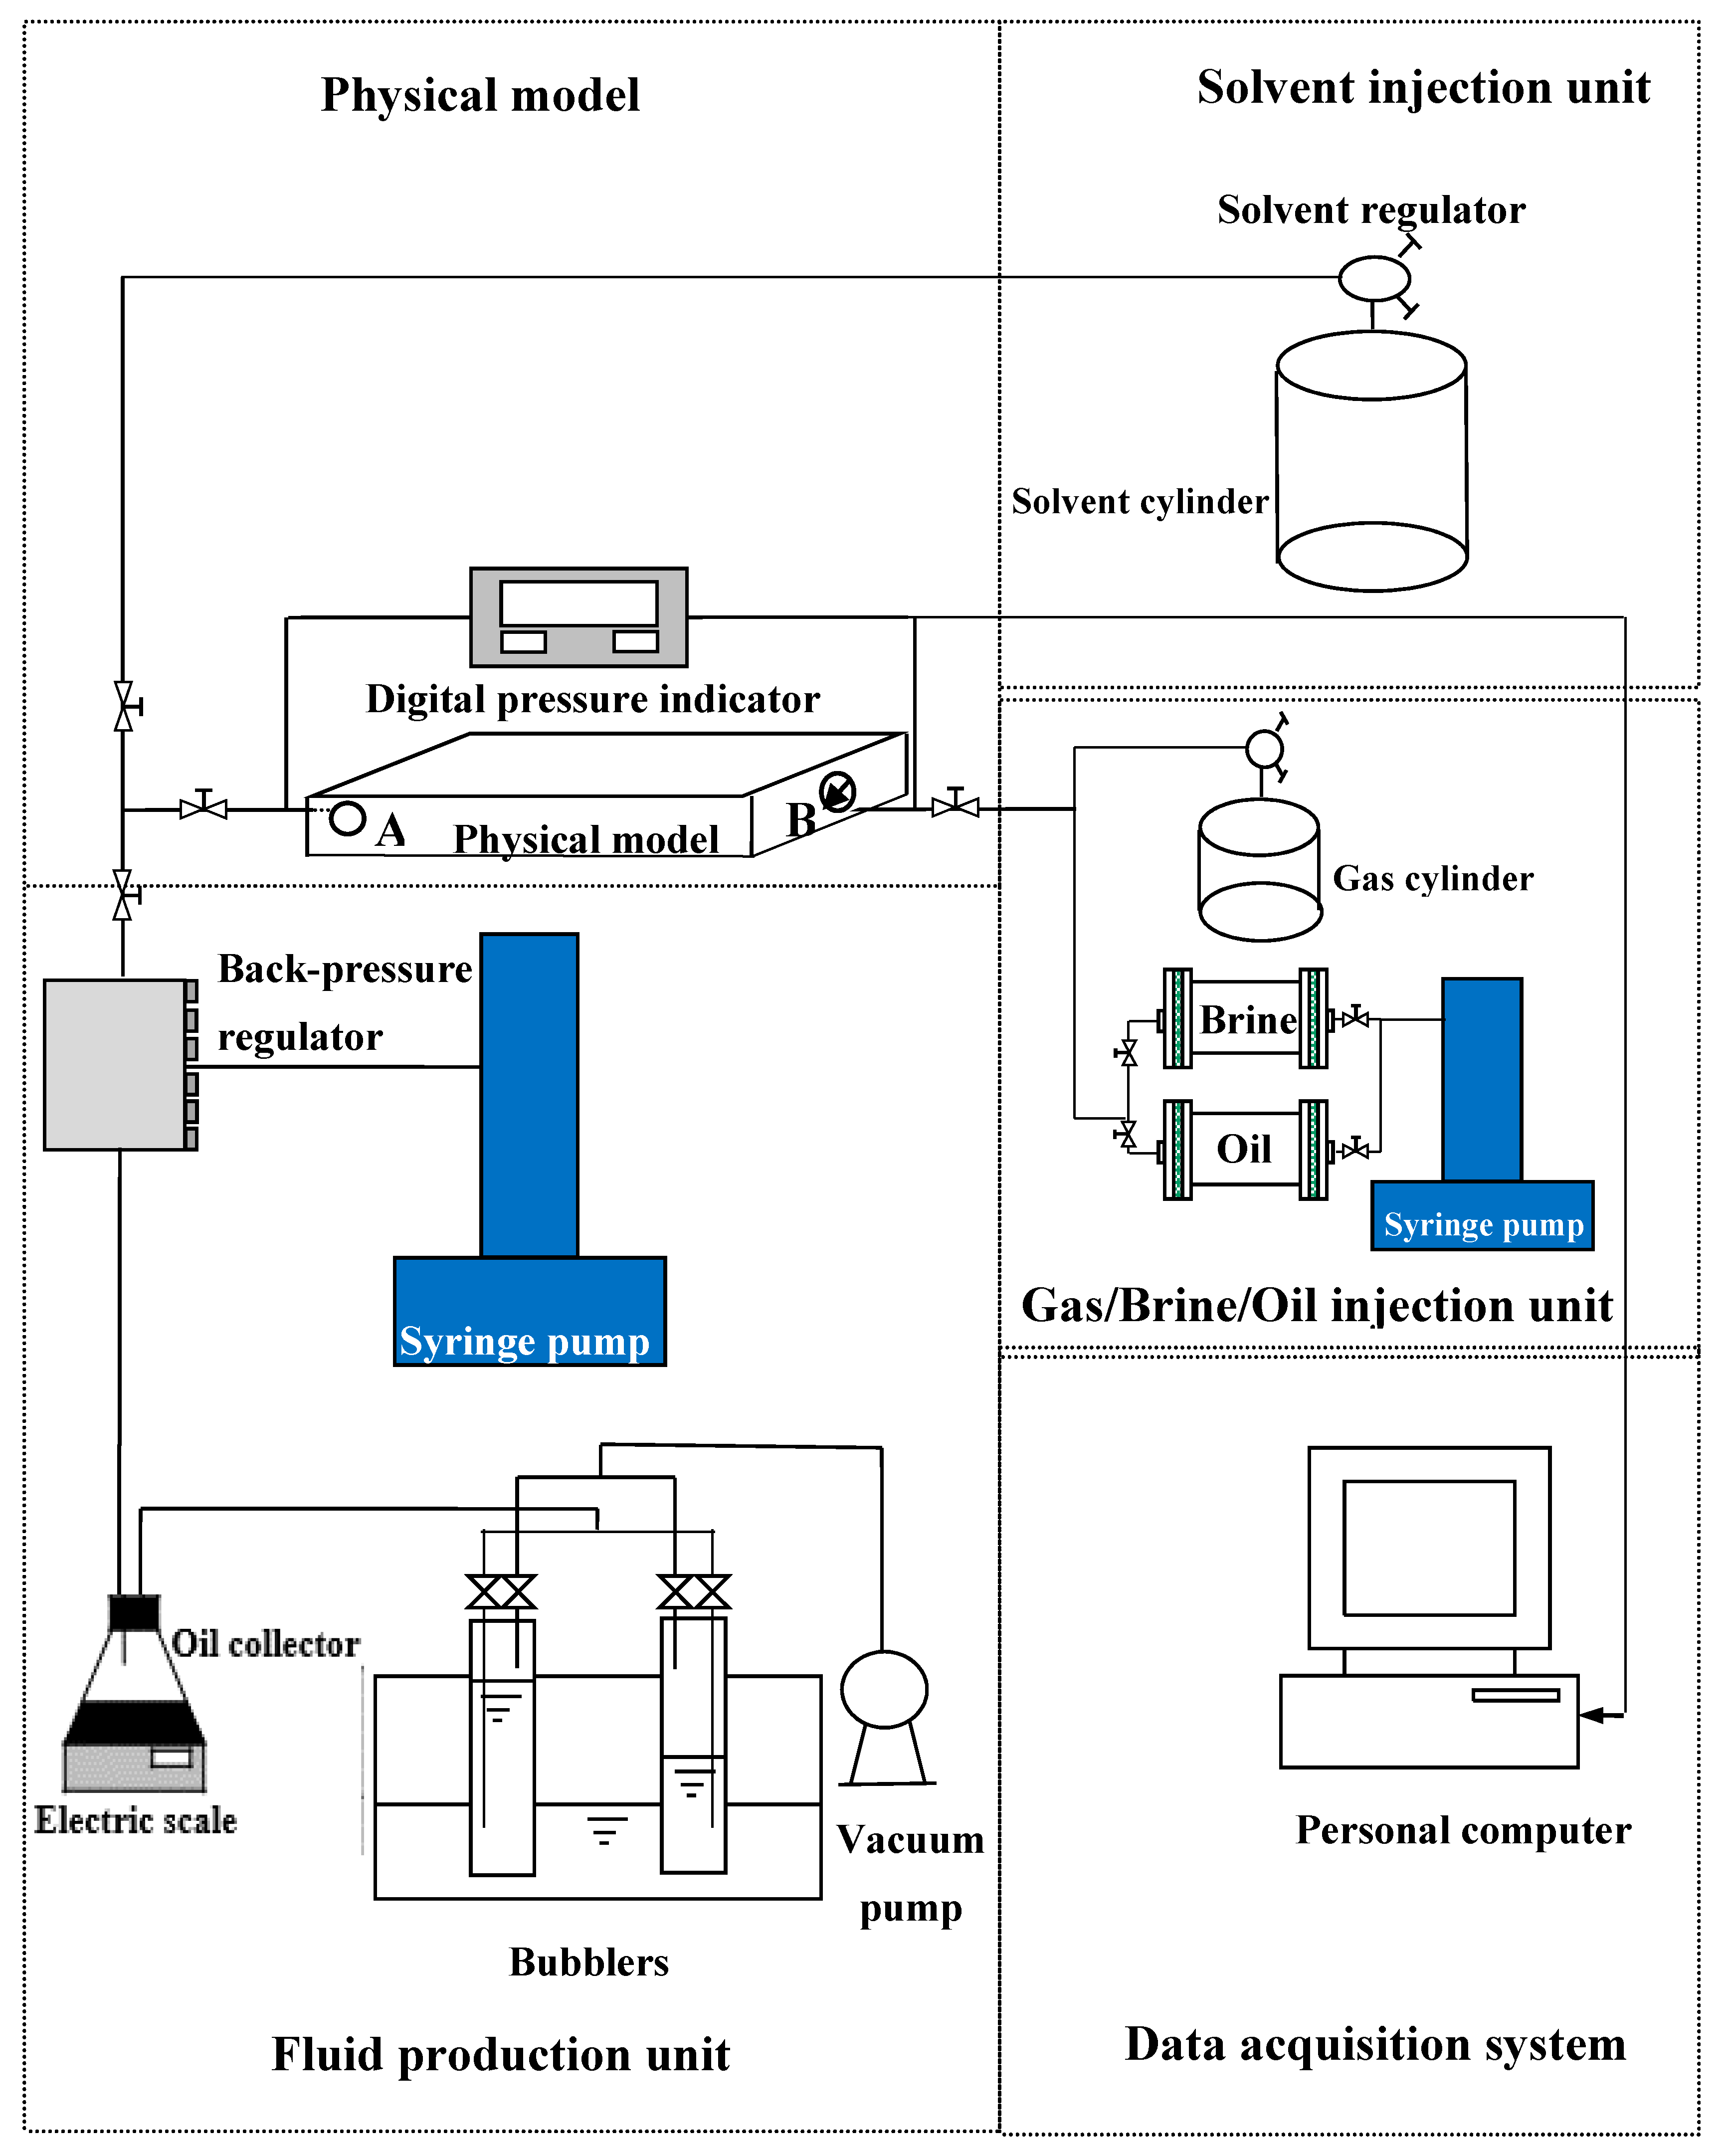
2.2. Experimental Set-Up
2.3. Experimental Preparation
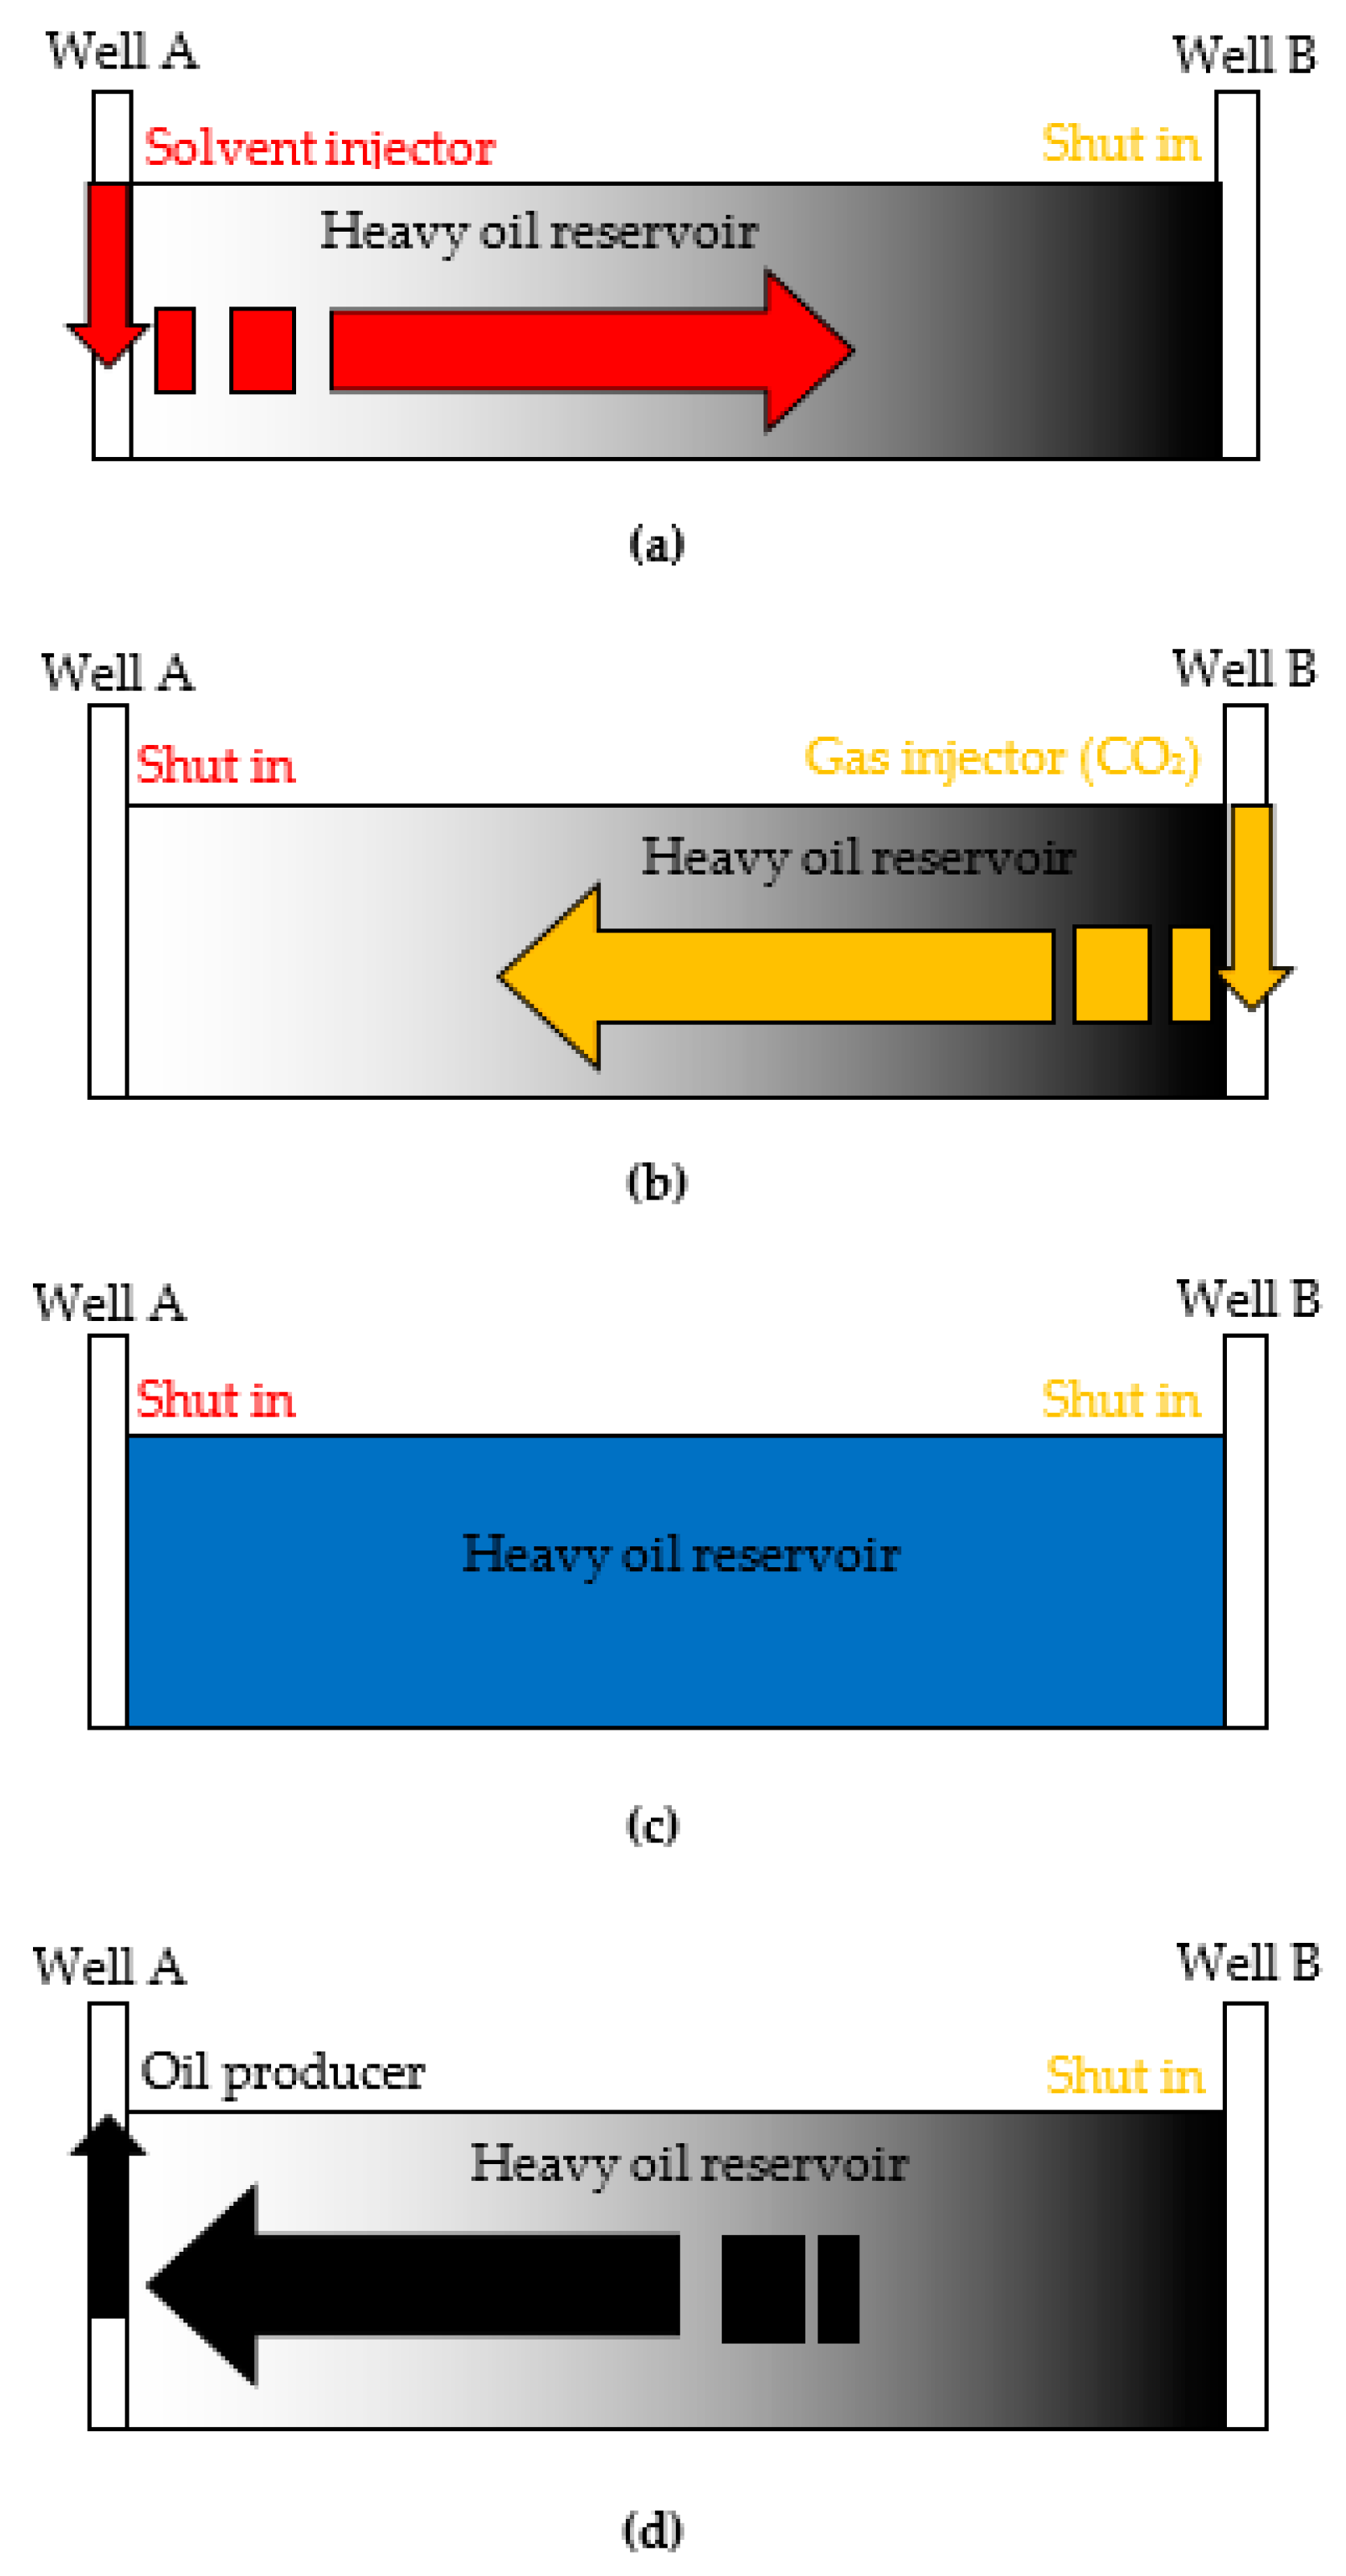
2.4. Experimental Procedures
3. Results and Discussion
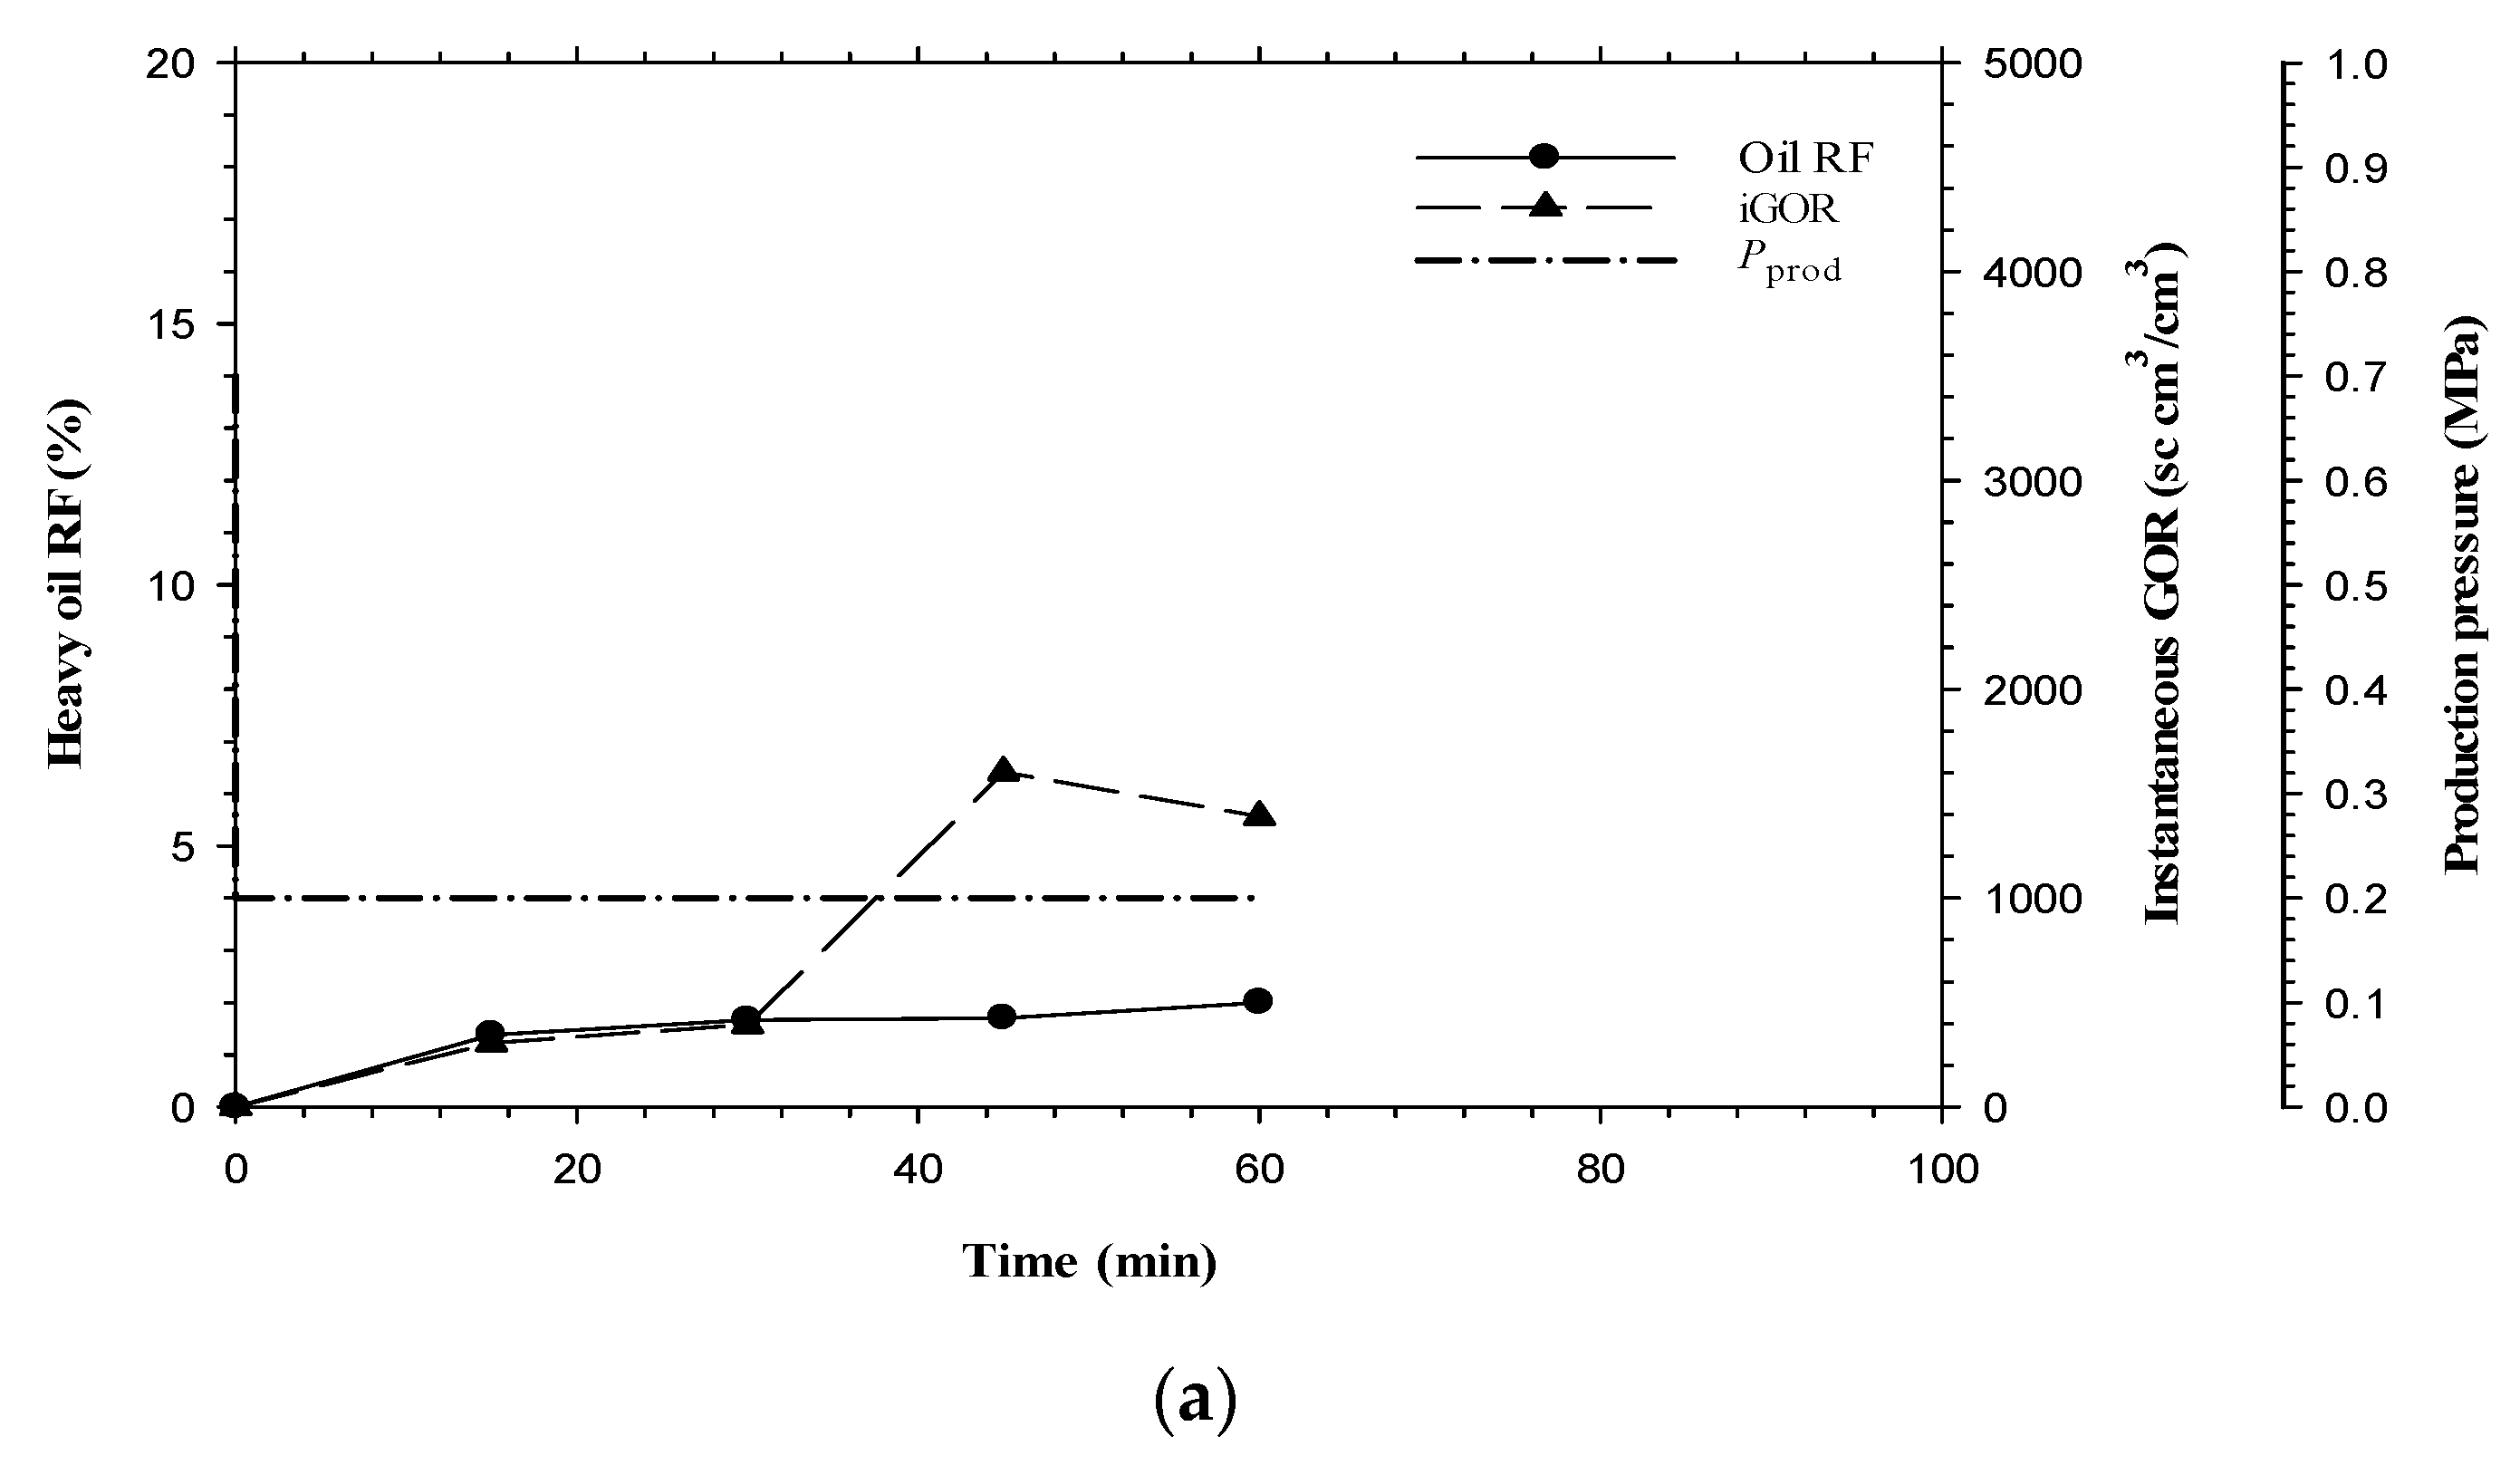
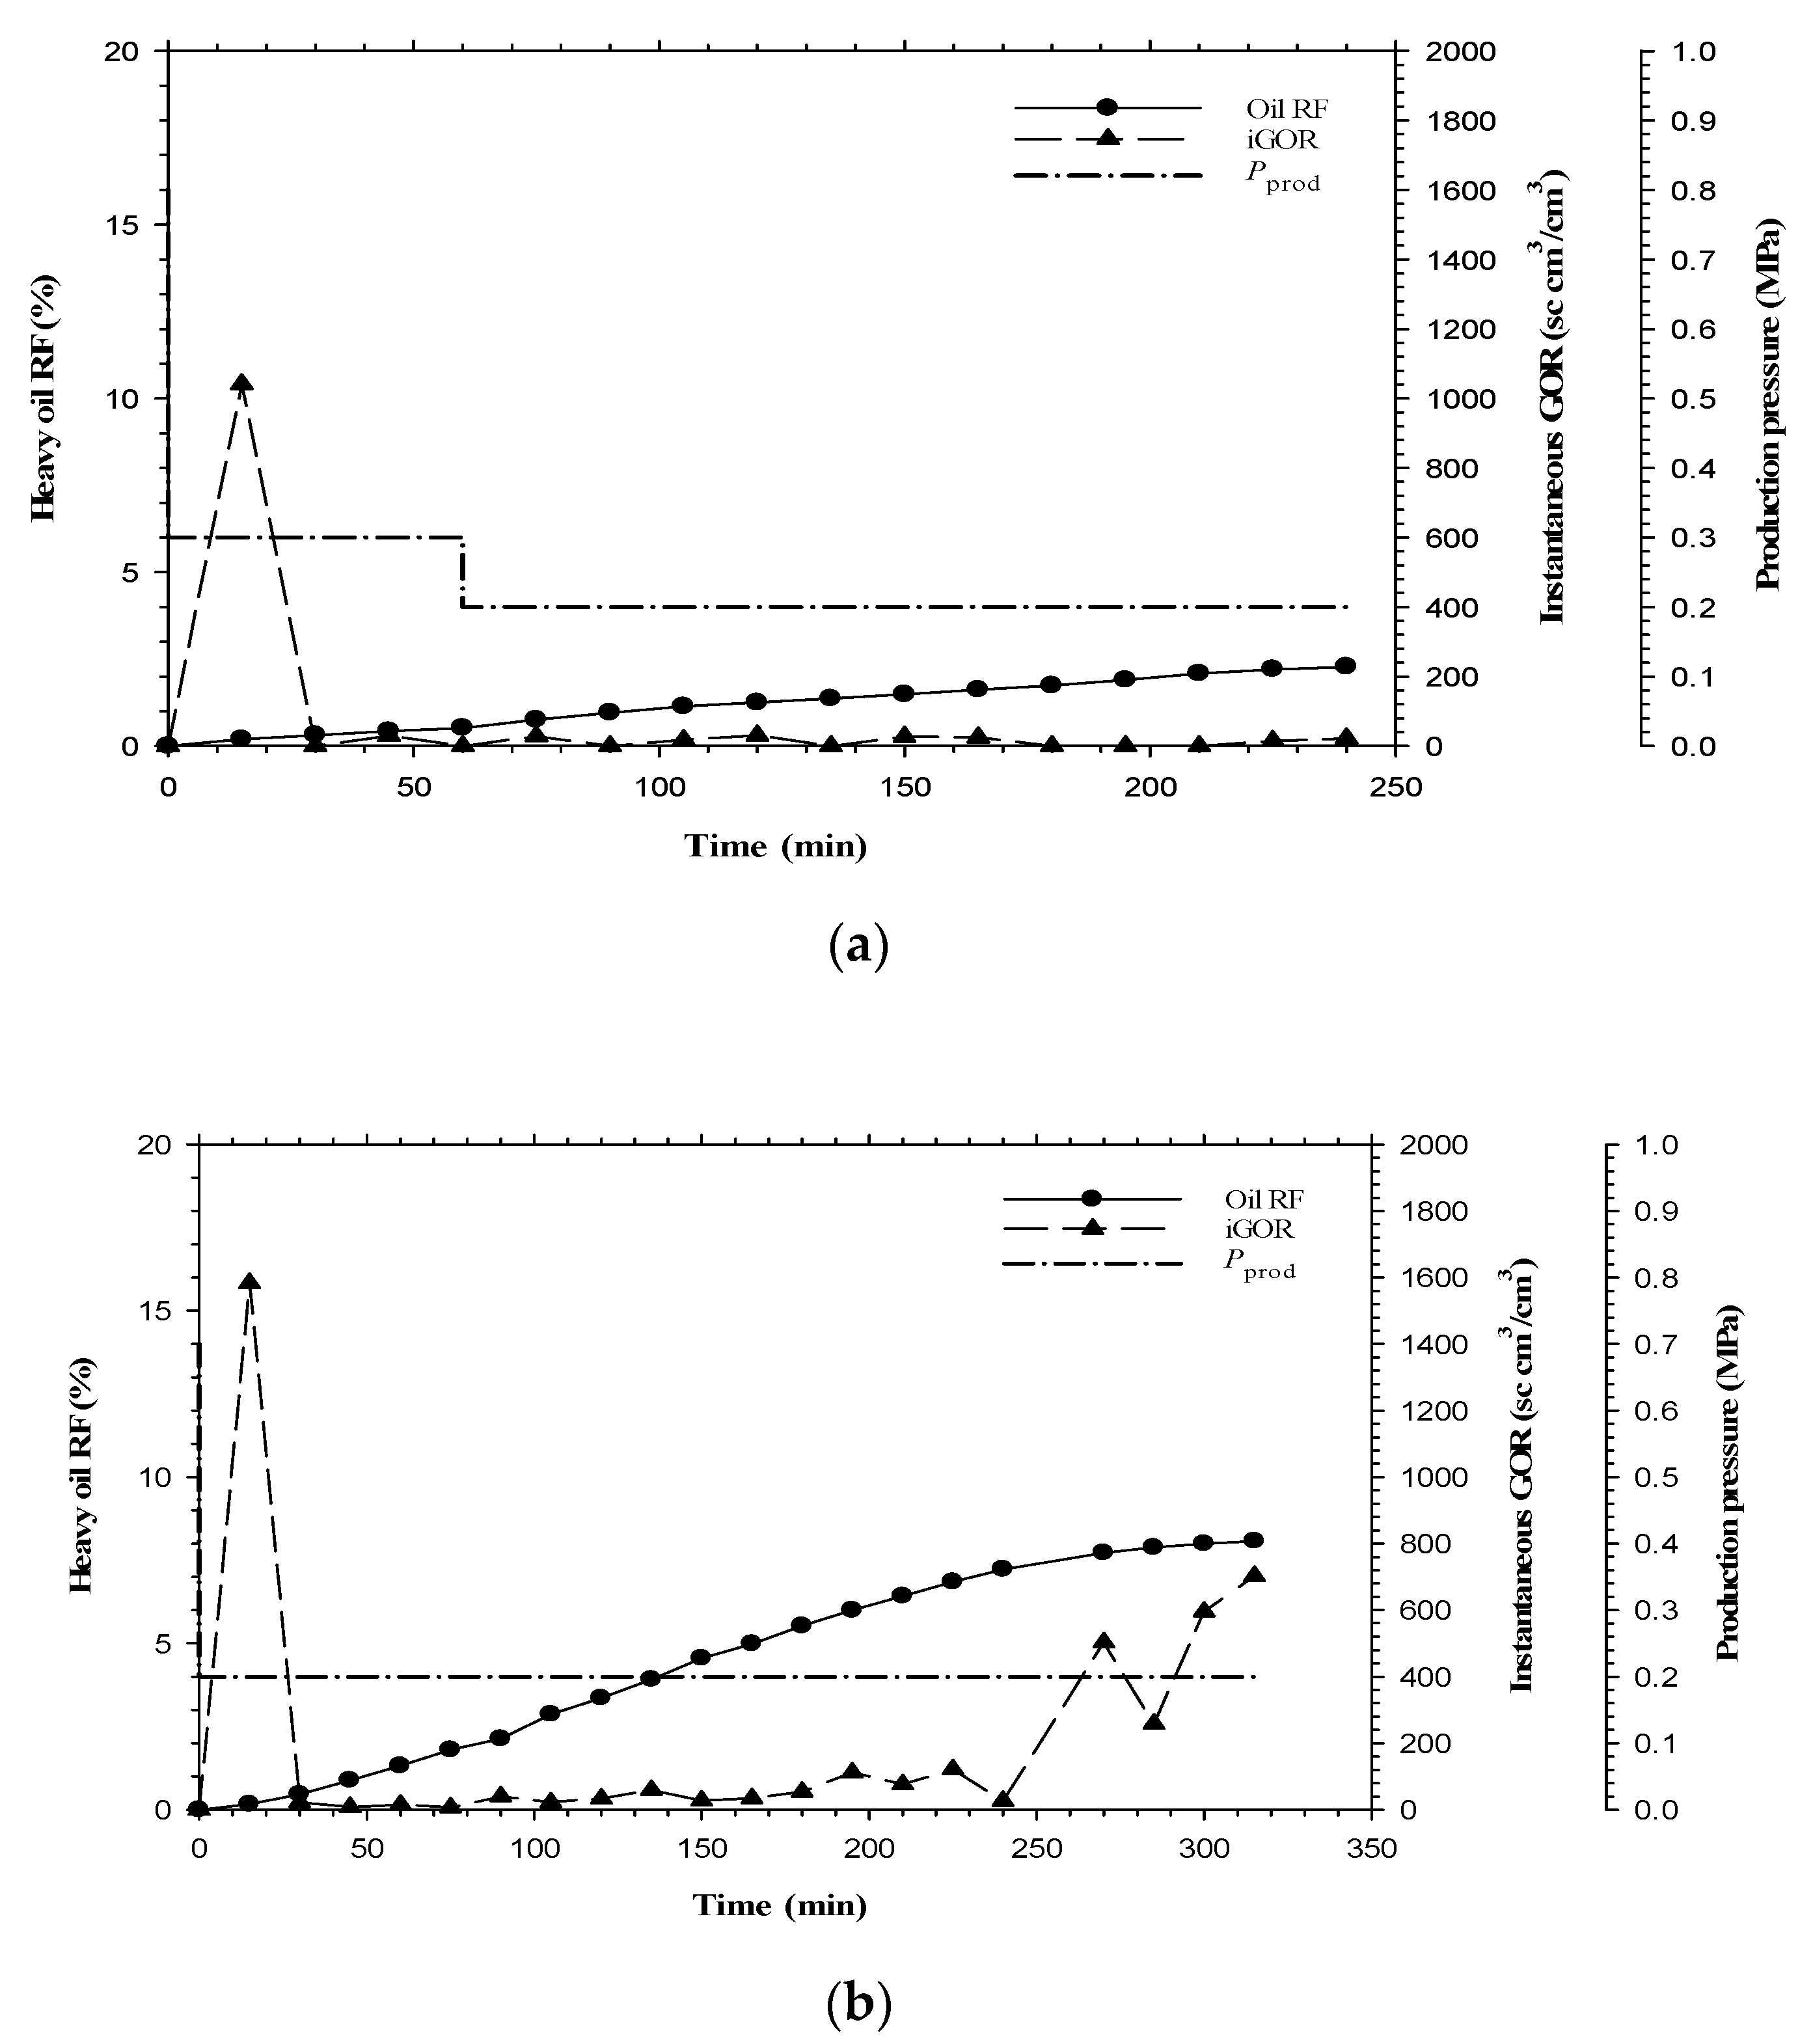
3.1. CSI
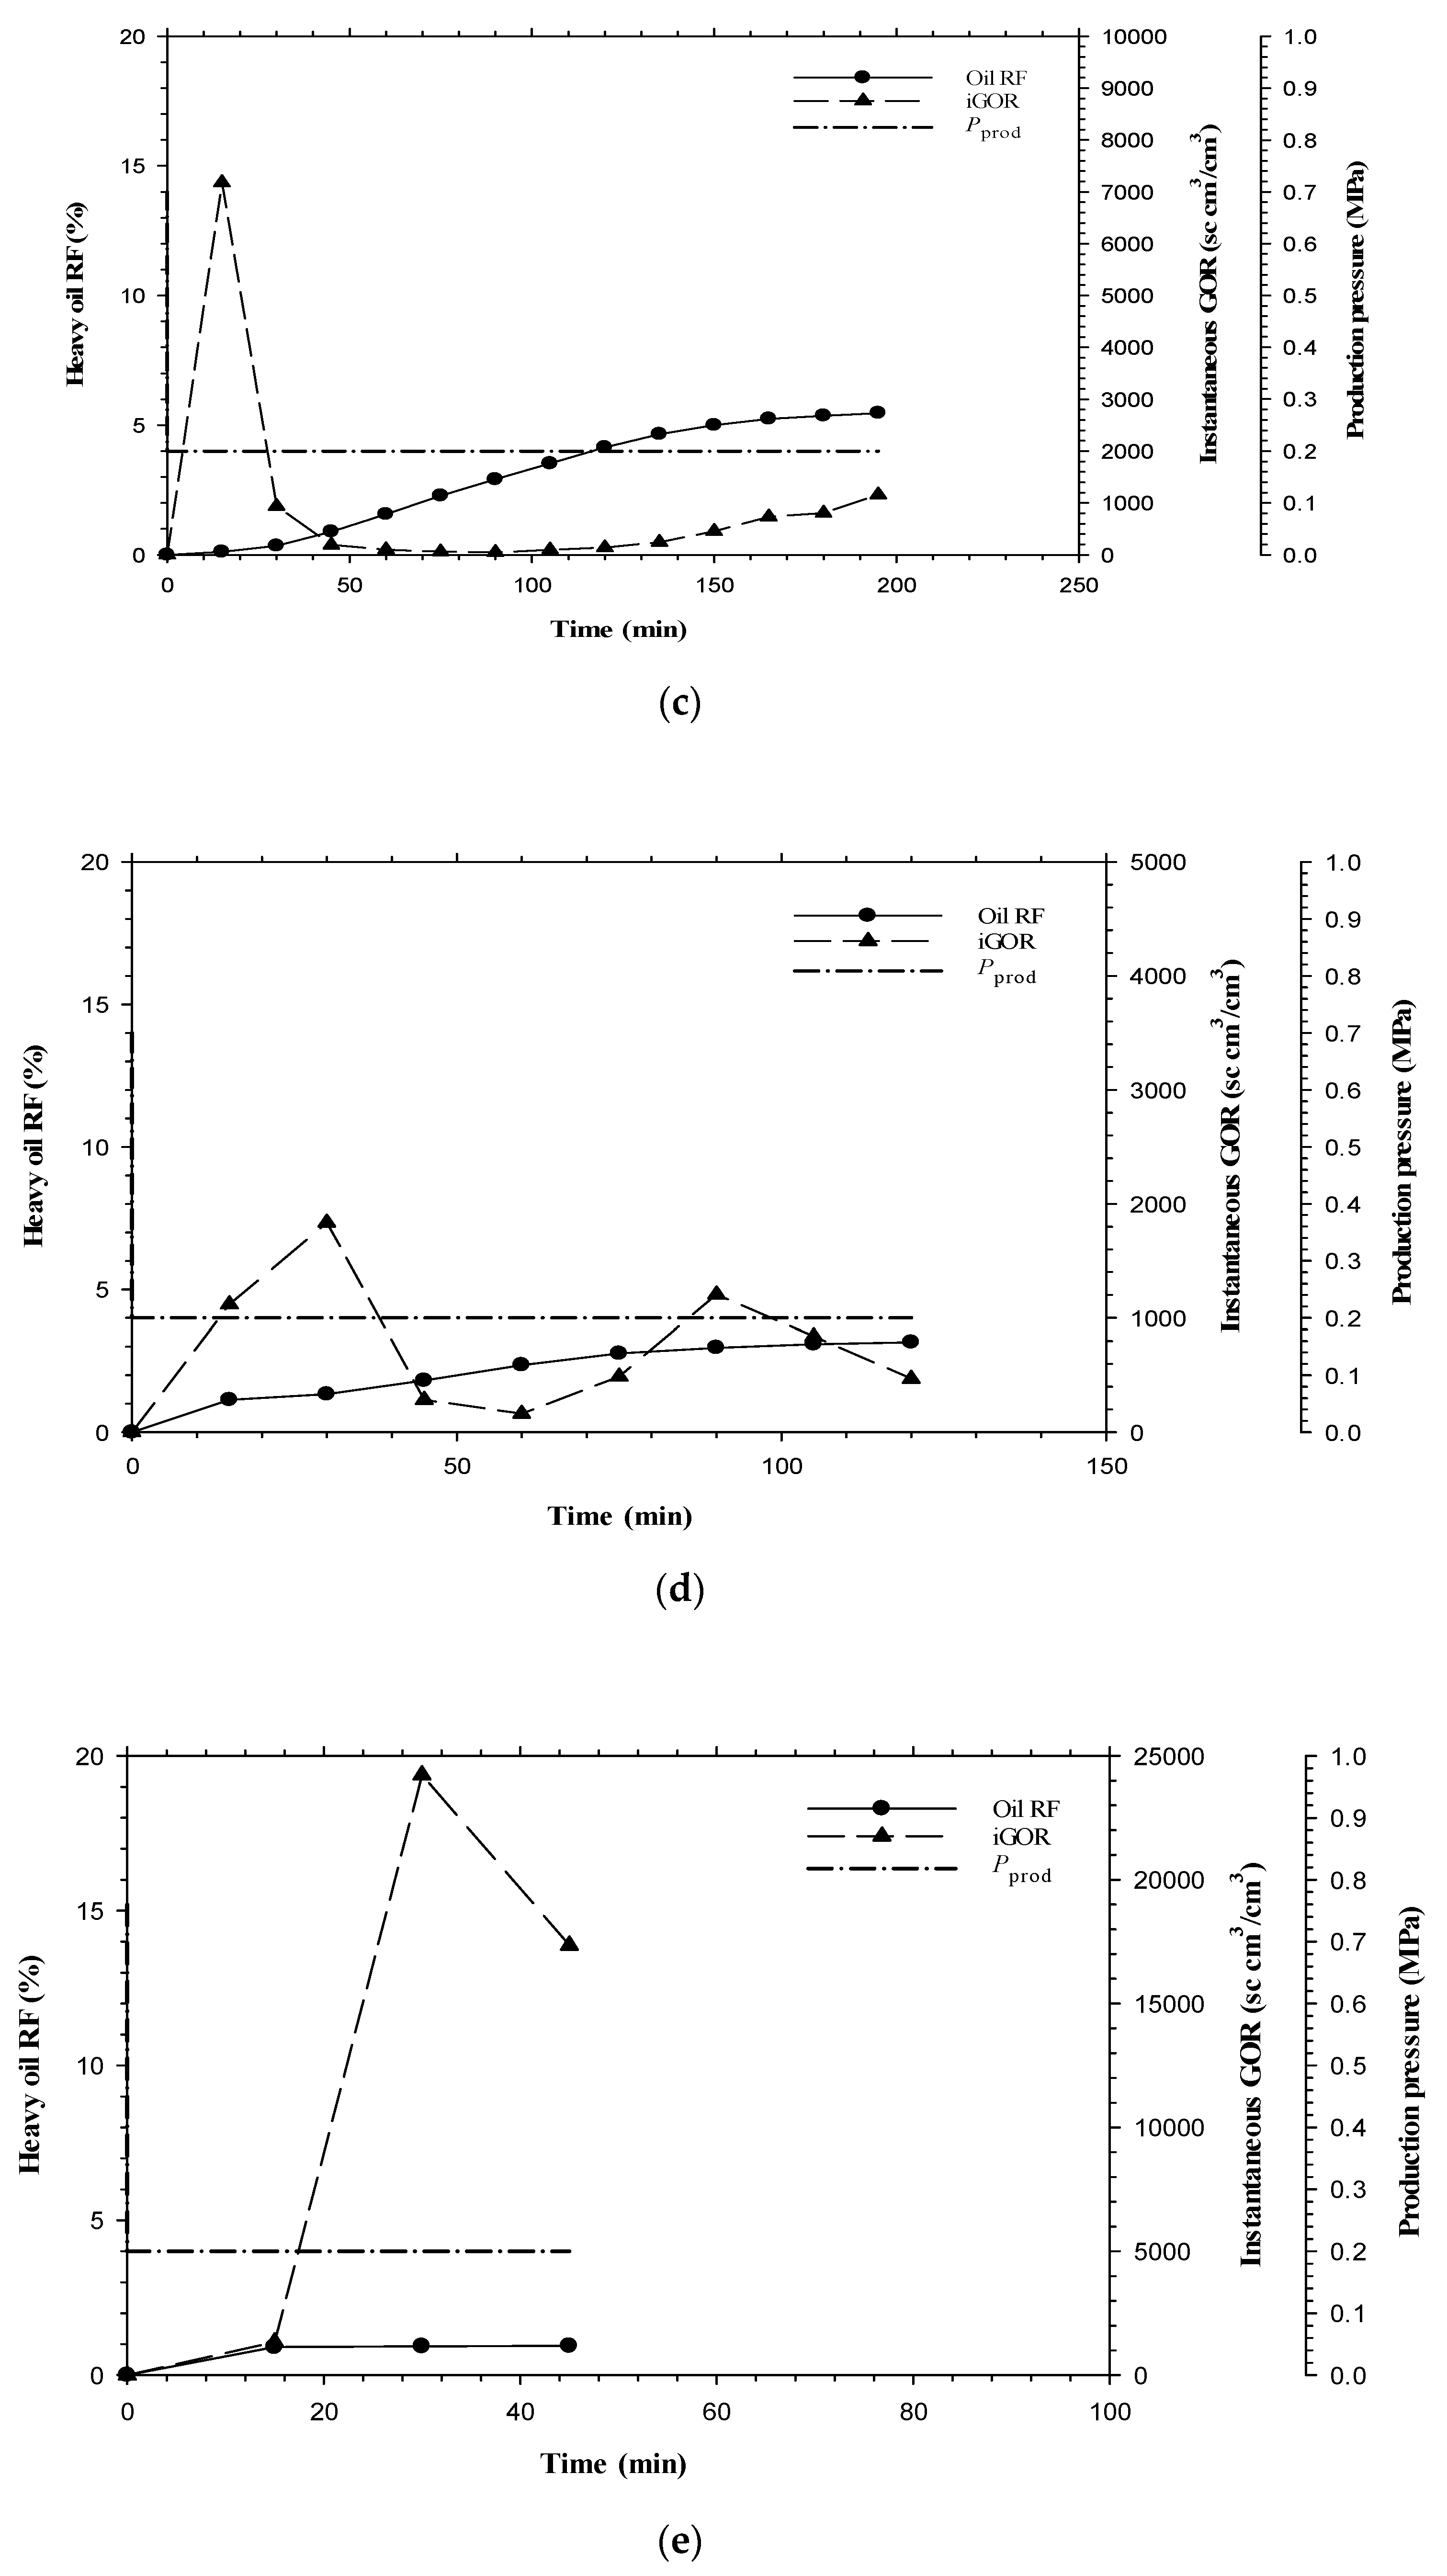
3.2. GPC
3.2.1. Gas Effect
3.2.2. Pressure Depletion Effect
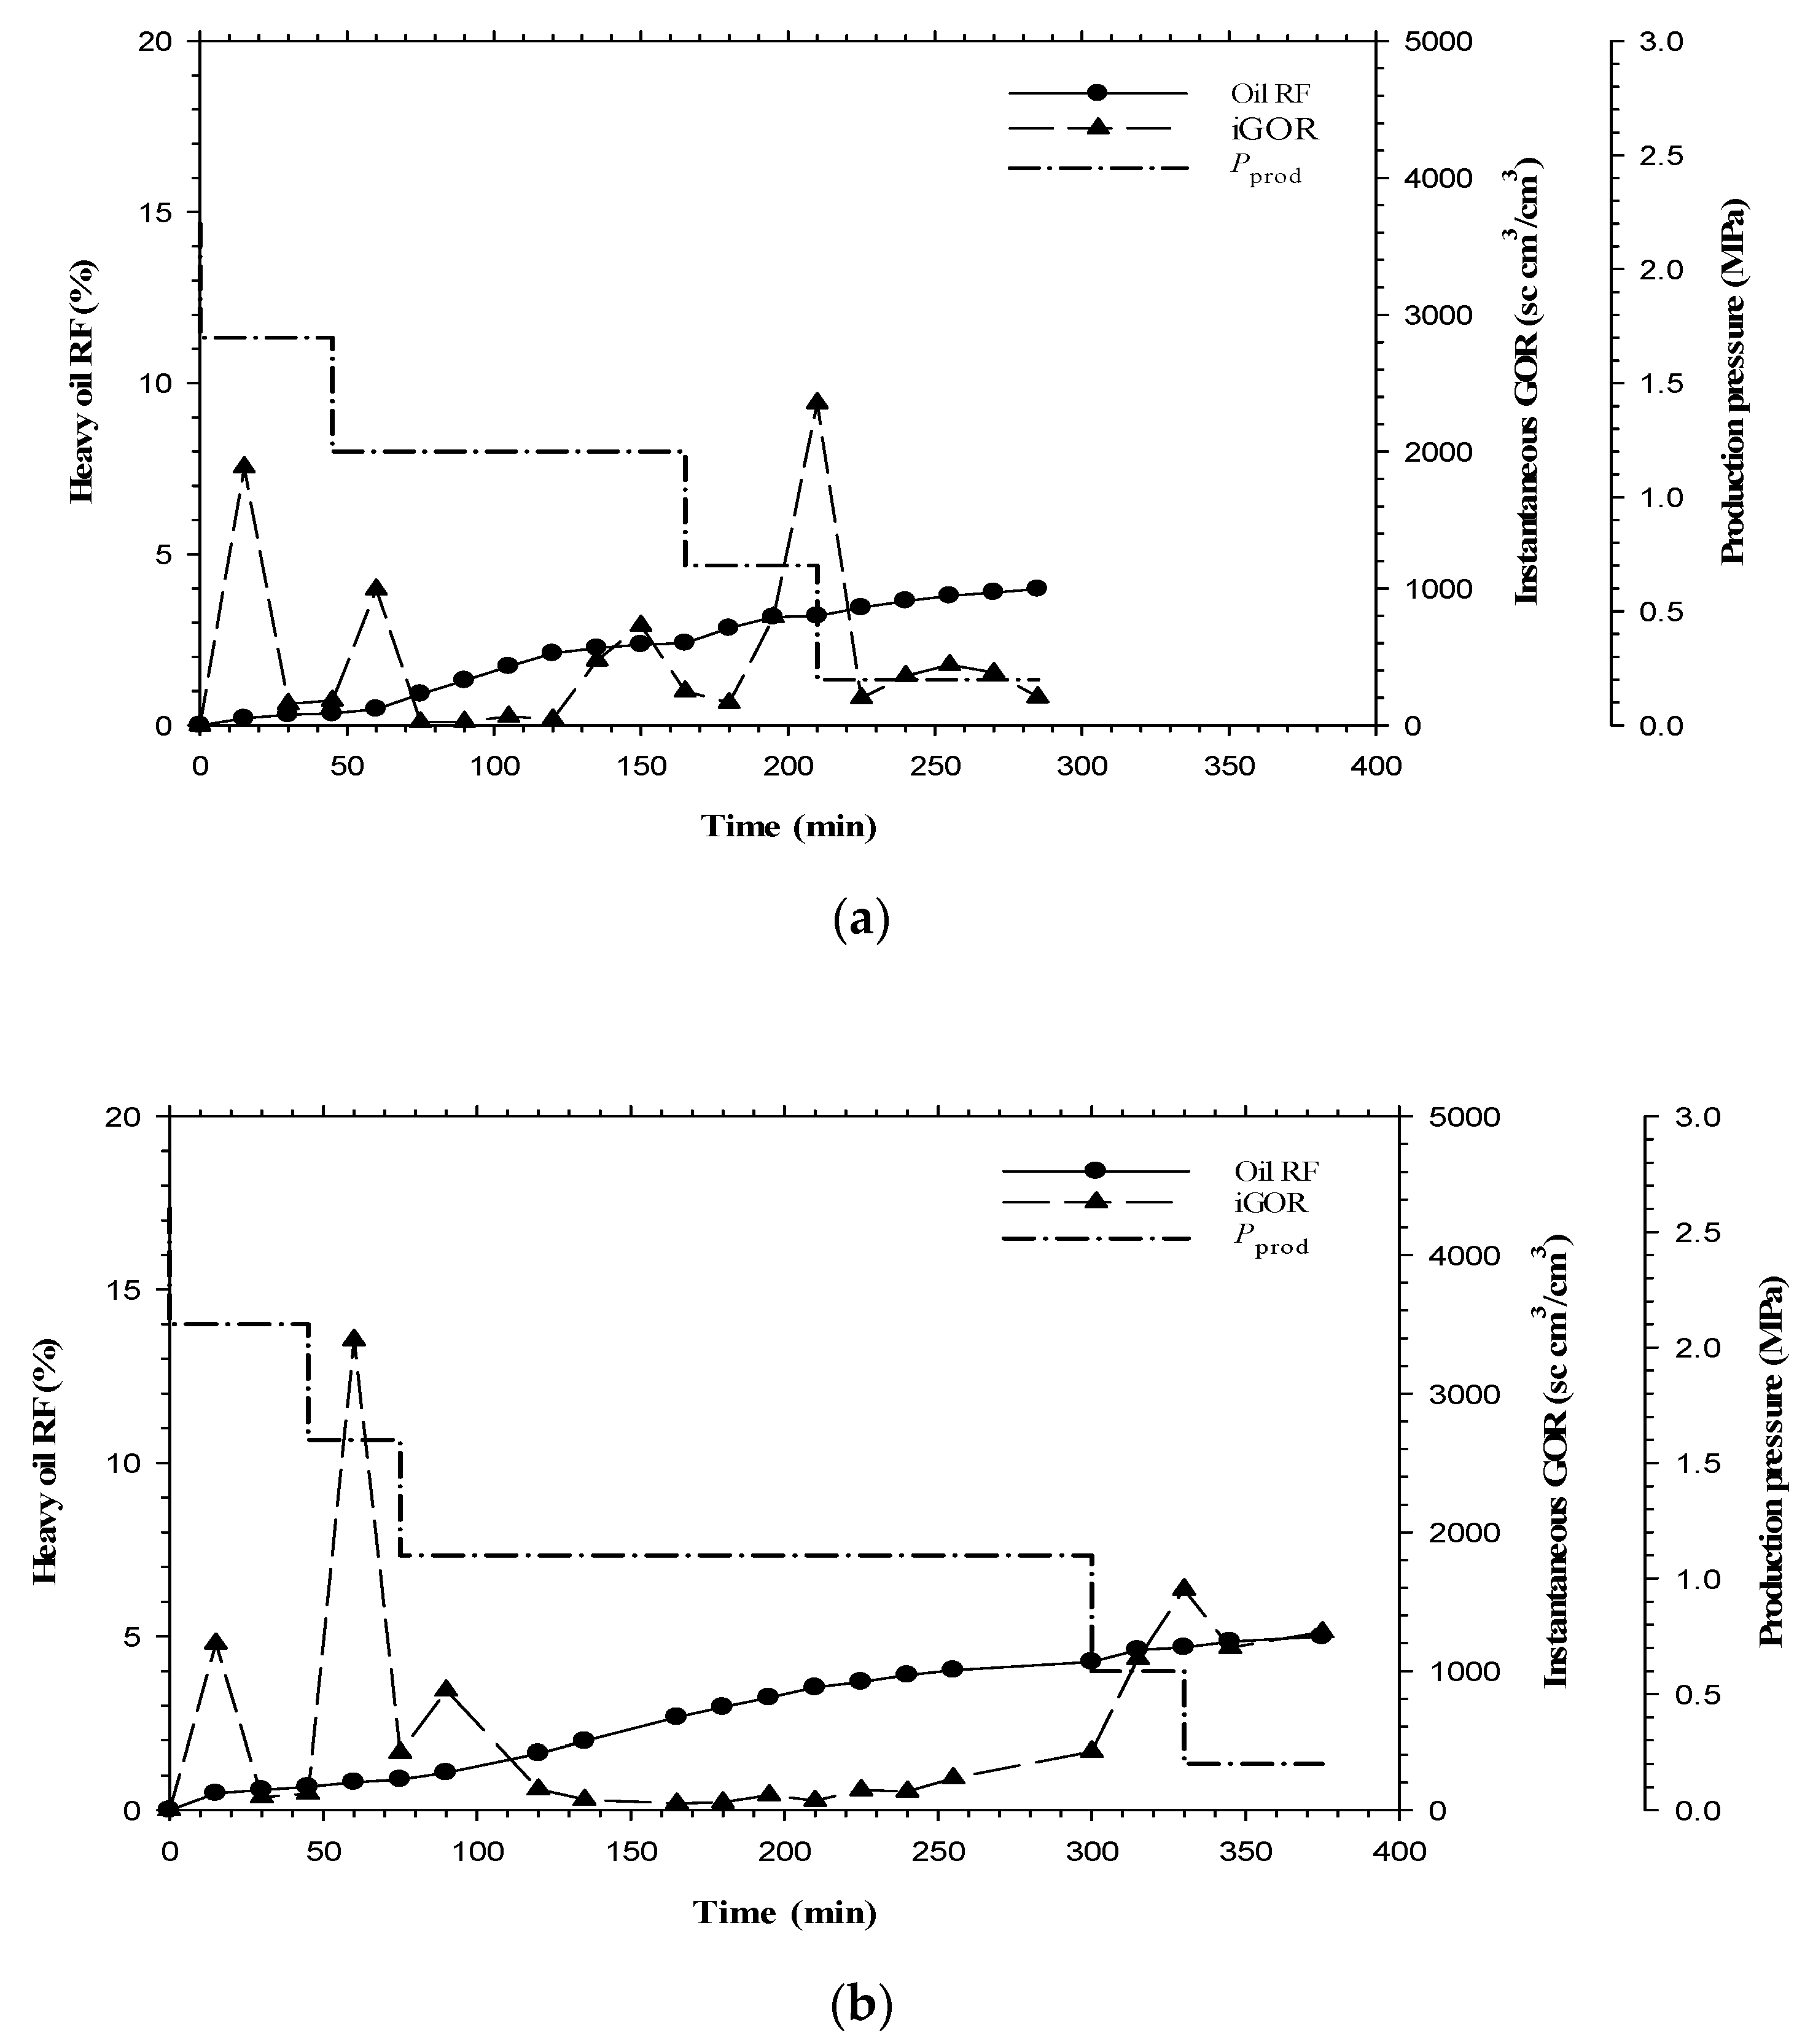
3.3. SA-GPC
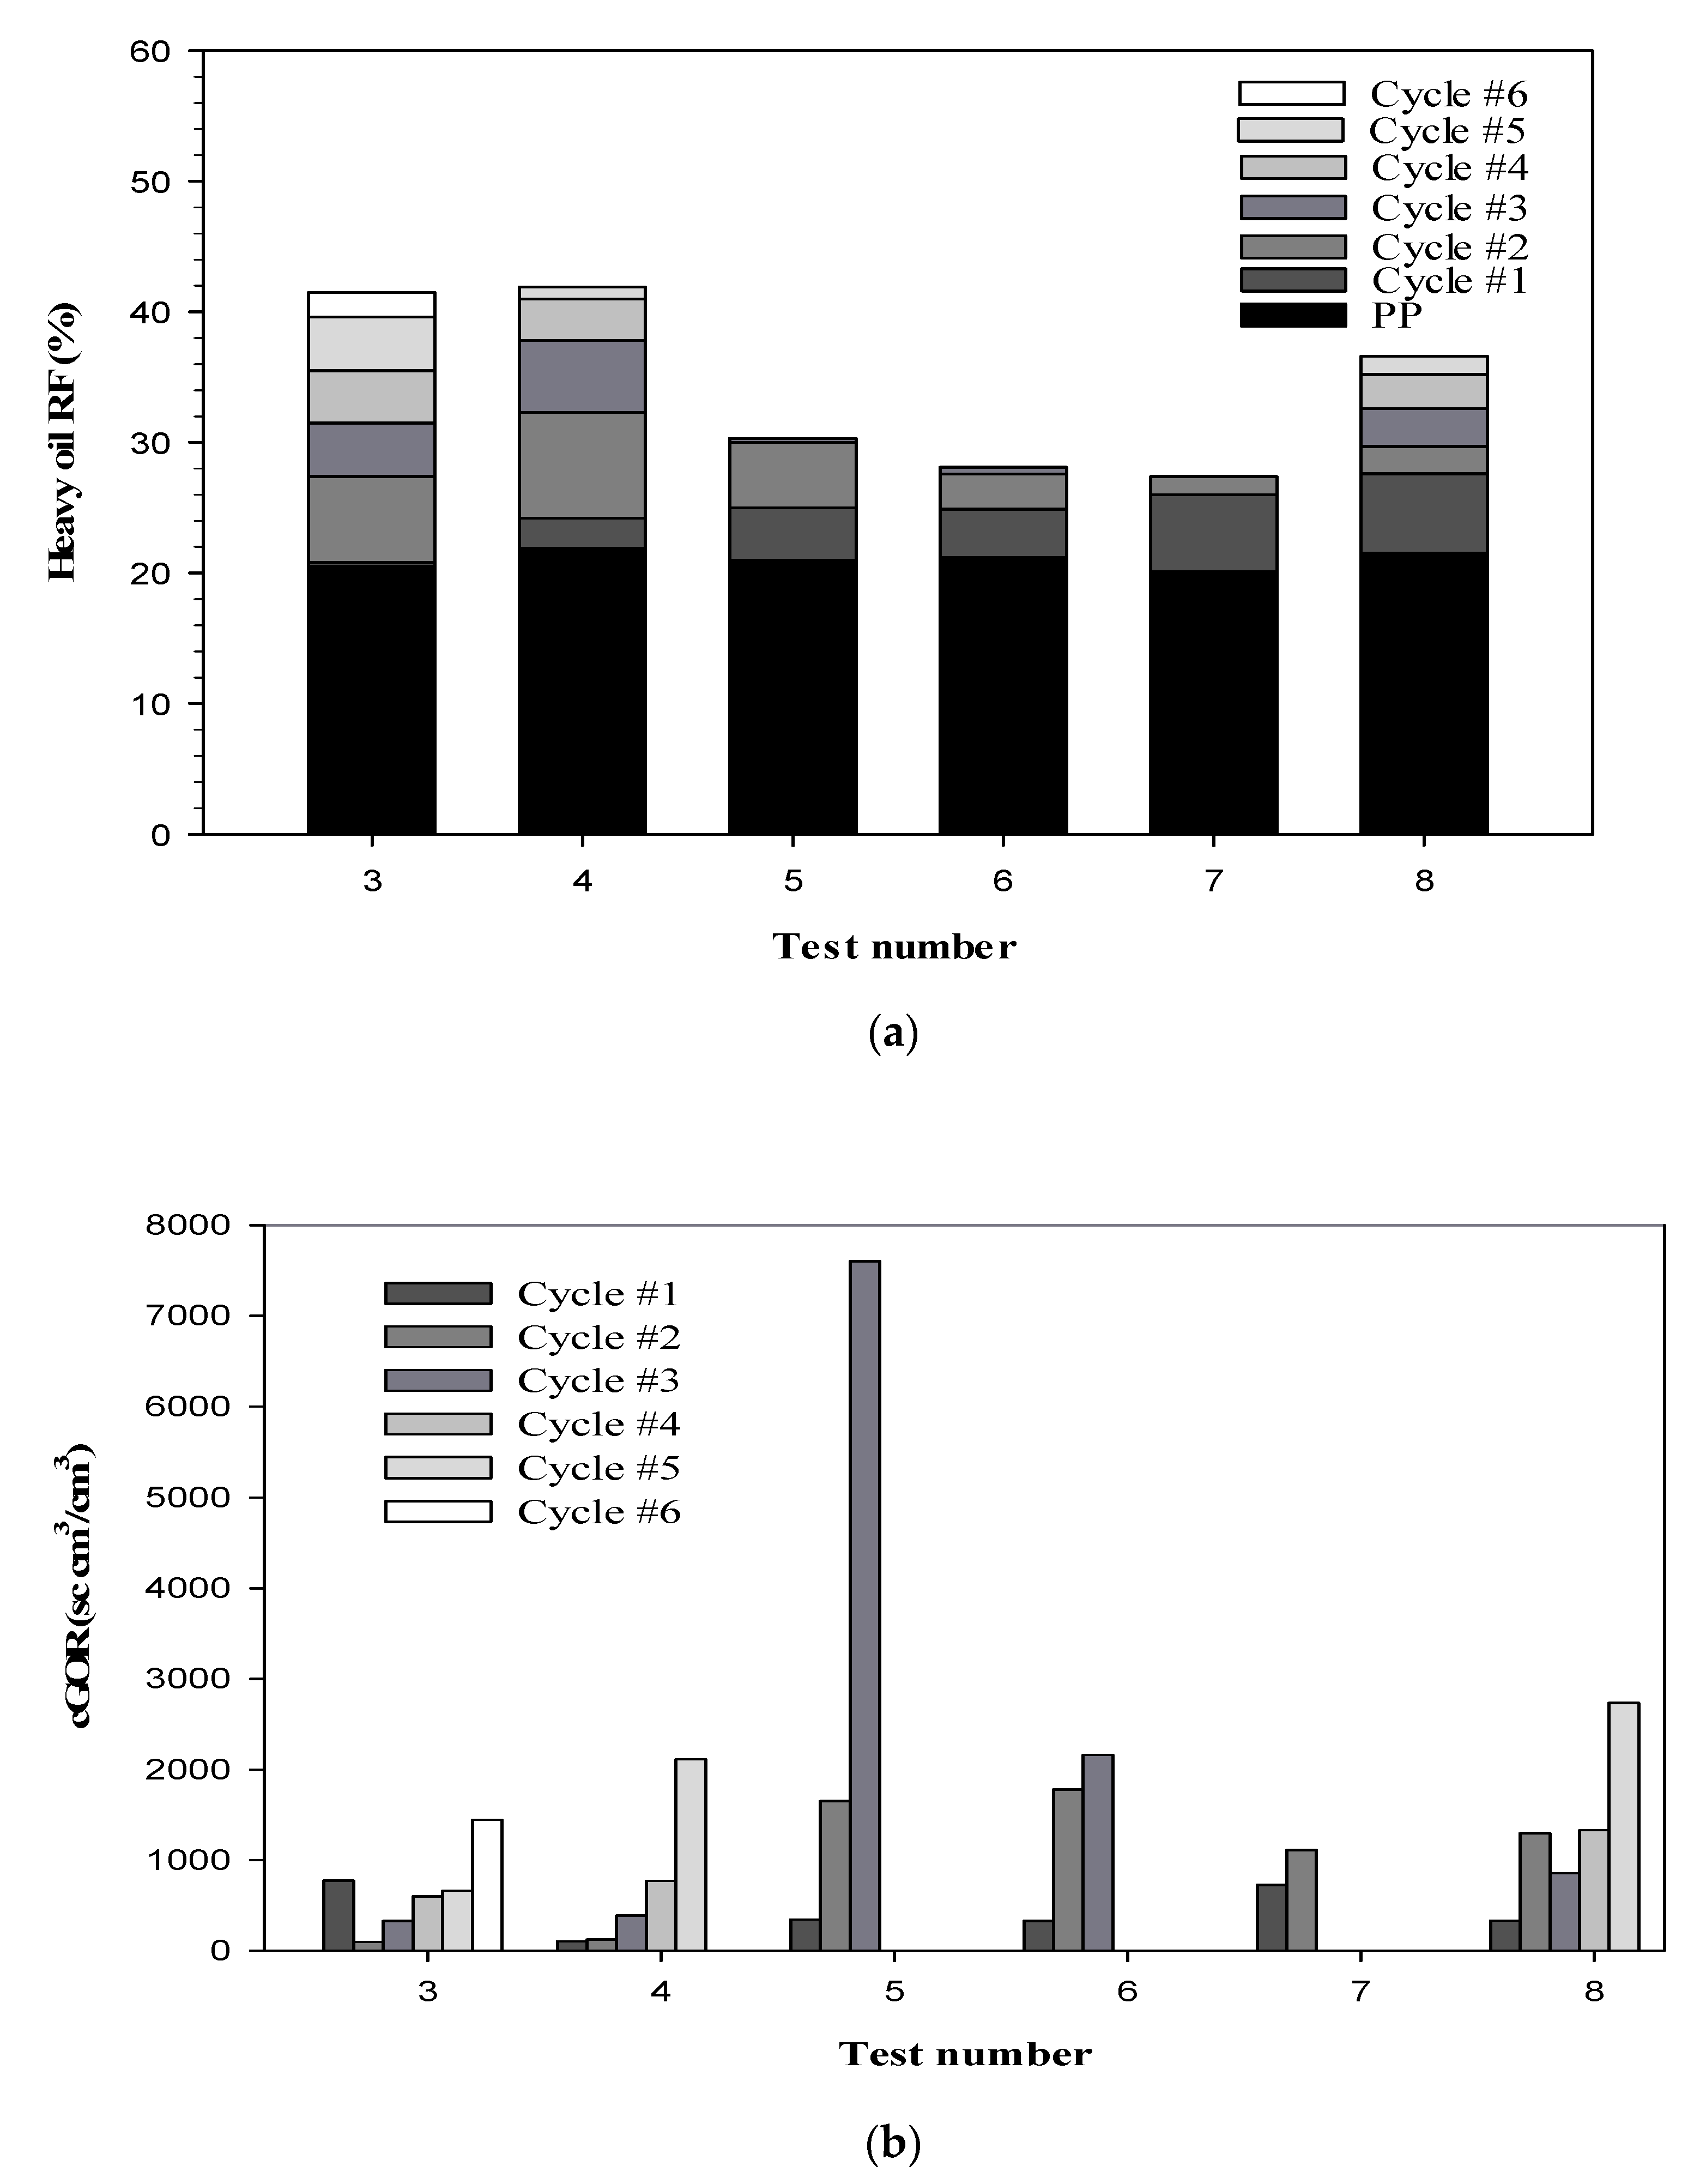
3.4. Comparisons
3.4.1. CSI vs. GPC
3.4.2. GPC vs. SA-GPC
4. Conclusions
- During the CSI, a new phenomenon termed the solvent-trapping effect was encountered in its late cycle, in addition to the known technical limitations of the back-and-forth movements of foamy oil, fast reservoir pressure depletion, and quick heavy oil viscosity regainment.
- The proposed GPC process could recover 41.9% of the original oil-in-place (OOIP) because an injector was utilized in a two-well configuration to inject gas and mobilize the foamy oil toward the producer. Thus the microscopic displacement efficiency was increased to effectively enhance heavy oil production. C3H8-GPC test had higher heavy oil recovery factor (RF) in comparison with CO2-GPC test. Although the heavy oil RF in C3H8-GPC test at ∆PEOR = 0.1 MPa was similar to that in C3H8-GPC test at ∆PEOR = 0.5 MPa, a higher ∆PEOR meant a shorter production period.
- C3H8 is a much better extracting solvent than CO2 in GPC process in terms of the heavy oil RF, production rate, and cumulative gas-oil ratio (cGOR). This was due to a high solubility of C3H8 and its ability to significantly reduce the heavy oil viscosity. Certainly, the production performance of CO2-GPC is expected to be much better if a much higher solvent injection pressure is used.
- The proposed SA-GPC process could recover 36.6% of the OOIP, which was 9% more than the CSI heavy oil RF. This was attributed to the effect of the two-well configuration. Moreover, SA-GPC test at ∆PEOR = 1.0 MPa had the highest heavy oil RF in comparison with the other two SA-GPC tests at ∆PEOR = 0.1 and 0.5 MPa, respectively.
- GPC recovered more heavy oil than CSI because GPC utilized a two-well configuration to minimize or eliminate the major technical limitations associated with CSI. In addition, C3H8-GPC recovered more heavy oil than SA-GPC. This was because GPC utilized a higher solubility of C3H8 to reduce heavy oil viscosity, induce a stronger foamy-oil flow, and slow heavy oil viscosity regainment, in comparison with approximately 24 mol.% C3H8 + 76 mol.% CO2 used in SA-GPC.
- Different solvent-based EOR processes were evaluated and ranked based on the heavy oil RFs as follows: C3H8-GPC > C3H8-SA-CO2-GPC > CO2-GPC > C3H8-CSI > CO2-CSI. From an engineering point of view, nevertheless, an economic analysis of each solvent-based EOR process is required in order to find the best EOR choice on a field scale.
Author Contributions
Funding
Conflicts of Interest
Nomenclature
| Notations | |
| H | Height of the 2-D physical model, m |
| k | Absolute water permeability, D |
| L | Length of the 2-D physical model, m |
| Pa | Atmospheric pressure, atm |
| Pe | Ending production pressure in each EOR process, MPa |
| Pf | Final primary production pressure, MPa |
| Pi | Initial reservoir pressure, MPa |
| Pinjg | Gas injection pressure, MPa |
| Pinjs | Solvent injection pressure, MPa |
| Pprod | Production pressure, MPa |
| Ps | Soaking pressure, MPa |
| Psat | Saturation pressure, MPa |
| Soi | Initial oil saturation, % |
| Swi | Initial water saturation, % |
| Tres | Reservoir temperature, °C |
| W | Width of the 2-D physical model, m |
| Greek symbols | |
| ∆PEOR | Pressure depletion step size during CSI/GPC/SA-GPC, MPa |
| ∆PPP | Pressure depletion step size in the primary production, MPa |
| ϕ | Porosity, % |
| Subscripts | |
| a | Atmospheric |
| e | Ending |
| EOR | Enhanced oil recovery |
| f | Final |
| i | Initial |
| injg | Gas injection |
| injs | Solvent injection |
| oi | Initial oil |
| PP | Primary production |
| prod | Production |
| res | Reservoir |
| s | Soaking |
| sat | Saturation |
| wi | Initial water |
| Acronyms | |
| BPR | Back-pressure regulator |
| BT | Breakthrough |
| cGOR | Cumulative gas-oil ratio |
| CHOPS | Cold heavy oil production with sand |
| CSI | Cyclic solvent injection |
| DAS | Data acquisition system |
| ECSP | Enhanced cyclic solvent process |
| EOR | Enhanced oil recovery |
| GOR | Gas-oil ratio |
| GPC | Gas pressure cycling |
| iGOR | Instantaneous gas-oil ratio |
| IOR | Improved oil recovery |
| OOIP | Original oil-in-place |
| PP | Primary production |
| PP-CSI | Pressure pulsing cyclic solvent injection |
| P-T | Pressure vs. temperature |
| RF | Recovery factor |
| SA-GPC | Solvent-assisted gas pressure cycling |
References
- Herron, E.H.; King, S.D. Heavy Oil As the Key to U.S. Energy Security. In Reports & Presentations; Petroleum Equities Inc.: McLean, VA, USA, 2004. [Google Scholar]
- Frances, J.H. Heavy oil and oil (tar) sands in North America: An overview & summary of contributions. Nat. Resour. Res. 2006, 15, 67–77. [Google Scholar]
- Zhang, Y.; Luo, P.; Huang, S. Improved heavy oil recovery by CO2 injection augmented with chemicals. Presented at the CPS/SPE International Oil and Gas Conference and Exhibition in China, Beijing, China, 8–10 June 2010. Paper SPE 131368. [Google Scholar]
- Spencer, D. BP Statistical Review of World Energy; BP: London, UK, 2019; Volume 68, pp. 1–69. [Google Scholar]
- Hutchence, K.; Huang, S.S. Gas Pressure Cycling for Thin Heavy Oil Reservoirs. Presented at the Technical Meeting/Petroleum Conference of the South Saskatchewan Section, Petroleum Society of Canada, Regina, SK, Canada, 18–21 October 1999. Paper 99107. [Google Scholar]
- Farouq-Ali, S.M. Practical Heavy Oil Recovery; Jones, J.A., Ed.; Monterey Resources Inc.: Bakersfield, CA, USA, 1997. [Google Scholar]
- Beckie, K.N.; McIntosh, R.A.; Meyer, R.F.; Wiggins, E.J. Geology and resources of the Primrose crude bitumen deposits, northeastern Alberta. In Proceedings of the Fourth UNITAR/UNDP Conference on Heavy Crude and Tar Sands, Edmonton, AB, Canada, 7–12 August 1988. Paper 0773203028. [Google Scholar]
- Lin, L.; Ma, H.; Zeng, F.; Gu, Y. A Critical Review of the Solvent-Based Heavy Oil Recovery Methods. Presented at the SPE Heavy Oil Conference Canada, Calgary, AB, Canada, 10–12 June 2014. Paper SPE 170098. [Google Scholar]
- Sayegh, S.G.; Maini, B.B. Laboratory Evaluation of the CO2 Huff-N-Puff process for heavy oil reservoirs. J. Can. Pet. Technol. 1984, 23, 29–36. [Google Scholar] [CrossRef]
- Simpson, M.R. The CO2 huff ‘n’ puff process in a bottom water-drive reservoir. J. Pet. Technol. 1988, 40, 887–893. [Google Scholar] [CrossRef]
- Qazvini Firouz, A.; Torabi, F. Feasibility study of solvent-based huff-n-puff method (cyclic solvent injection) to enhance heavy oil recovery. Presented at the SPE Heavy Oil Conference Canada, Calgary, AB, Canada, 12–14 June 2012. Paper SPE 157853. [Google Scholar]
- Lim, G.B.; Kry, R.P.; Harker, B.C.; Jha, K.N. Cyclic stimulation of Cold Lake oil sand with supercritical ethane. Presented at the SPE International Heavy Oil Symposium, Calgary, AB, Canada, 19–21 June 1995. Paper SPE 30298. [Google Scholar]
- Ivory, J.; Chang, J.; Coates, R.; Forshner, K. Investigation of cyclic solvent injection process for heavy oil recovery. J. Can. Pet. Technol. 2010, 49, 22–33. [Google Scholar] [CrossRef]
- Jiang, T.; Zeng, F.; Jia, X.; Gu, Y. A new solvent-based enhanced heavy oil recovery method: Cyclic production with continuous solvent injection. Fuel 2014, 115, 426–433. [Google Scholar]
- Jia, X.; Zeng, F.; Gu, Y. Gas flooding-assisted cyclic solvent injection (GA-CSI) for enhancing heavy oil recovery. Fuel 2015, 140, 344–353. [Google Scholar] [CrossRef]
- Jia, X.; Gu, Y.; Zeng, F. Pressure pulsing cyclic solvent injection (PP-CSI): A new way to enhance the recovery of heavy oil through solvent-based enhanced oil recovery techniques. Presented at SPE Annual Technical Conference and Exhibition, New Orleans, LA, USA, 30 September–2 October 2013. Paper SPE 166453. [Google Scholar]
- Jamaloei, B.Y.; Dong, M.; Yang, P.; Yang, D.; Mahinpey, N. Impact of solvent type and injection sequence on Enhanced Cyclic Solvent Process (ECSP) for thin heavy oil reservoirs. J. Pet. Sci. Eng. 2013, 110, 169–183. [Google Scholar] [CrossRef]
- Ojumoola, O.; Ma, H.; Gu, Y. Solvent-Assisted Water Pressure Cycling (SA-WPC) in a thin heavy oil reservoir. Fuel 2020, 270, 117195. [Google Scholar] [CrossRef]
- Ma, H.; Huang, D.; Yu, G.; She, Y.; Gu, Y. Combined cyclic solvent injection and waterflooding in the post-cold heavy oil production with sand reservoirs. Energy Fuels 2017, 31, 418–428. [Google Scholar] [CrossRef]
- Sheng, J.J. Foamy Oil Flow in Porous Media. Ph.D. Thesis, University of Alberta, Edmonton, AB, Canada, 1997. [Google Scholar]
- Wu, X.; Zhao, R.; Wang, R. Visual experimental study of the factors affecting the stability of foamy oil flow. Pet. Sci. Technol. 2011, 29, 1449–1458. [Google Scholar]


| Test No. | Physical Characteristics | ||
|---|---|---|---|
| ϕ (%) | k (D) | Soi (%) | |
| 1 | 39.4 | 3.9 | 99.0 |
| 2 | 39.7 | 3.8 | 99.5 |
| 3 | 39.6 | 4.4 | 98.7 |
| 4 | 39.0 | 4.2 | 98.6 |
| 5 | 38.7 | 3.8 | 98.3 |
| 6 | 40.0 | 4.6 | 97.8 |
| 7 | 39.4 | 4.7 | 98.0 |
| 8 | 39.3 | 4.1 | 98.1 |
| Test No. | Process | Primary Production | CSI/GPC/SA-GPC | |||||||||
|---|---|---|---|---|---|---|---|---|---|---|---|---|
| Pi (MPa) | ∆PPP (MPa) | Pf (MPa) | Solvent Injection | Gas Injection | Soaking | Production | ||||||
| Solvent Type | Pinjs (MPa) | Gas Type | Pinjg (MPa) | ts (min) | Ps (MPa) | ∆PEOR (MPa) | Pe (MPa) | |||||
| 1 | CSI | 3.0 | 1.0 | 0.2 | C3H8 | 0.8 | - | - | 24 × 60 | 0.7 | 0.5 | 0.2 |
| 2 | CSI | 3.0 | 1.0 | 0.2 | CO2 | 3.0 | - | - | 24 × 60 | 2.1–2.4 | 0.5 | 0.2 |
| 3 | GPC | 3.0 | 1.0 | 0.2 | - | - | C3H8 | 0.8 | 24 × 60 | 0.7–0.76 | 0.1 | 0.2 |
| 4 | GPC | 3.0 | 1.0 | 0.2 | - | - | C3H8 | 0.8 | 24 × 60 | 0.7–0.76 | 0.5 | 0.2 |
| 5 | GPC | 3.0 | 1.0 | 0.2 | - | - | CO2 | 3.0 | 24 × 60 | 2.2–2.6 | 0.5 | 0.2 |
| 6 | SA-GPC | 3.0 | 1.0 | 0.2 | C3H8 | 0.8 | CO2 | 3.0 | 24 × 60 | 2.2–2.7 | 0.1 | 0.2 |
| 7 | SA-GPC | 3.0 | 1.0 | 0.2 | C3H8 | 0.8 | CO2 | 3.0 | 24 × 60 | 2.2–2.7 | 0.5 | 0.2 |
| 8 | SA-GPC | 3.0 | 1.0 | 0.2 | C3H8 | 0.8 | CO2 | 3.0 | 24 × 60 | 2.2–2.7 | 1.0 | 0.2 |
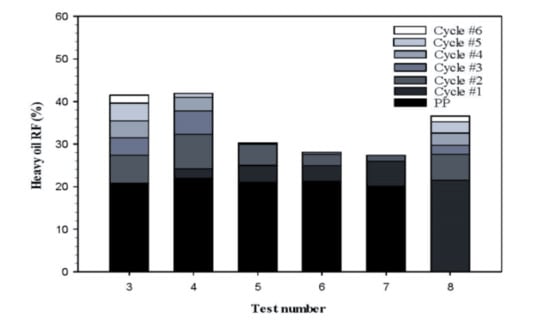
| Test No. | Heavy Oil Recovery Factor (%) | |||||||
|---|---|---|---|---|---|---|---|---|
| Primary Production | Cycle #1 | Cycle #2 | Cycle #3 | Cycle #4 | Cycle #5 | Cycle #6 | Total | |
| 1 | 21.0 | 2.0 | 3.3 | 1.3 | - | - | - | 27.6 |
| 2 | 20.0 | 2.4 | 0.3 | - | - | - | - | 22.7 |
| 3 | 20.5 | 0.3 | 6.6 | 4.1 | 4.0 | 4.1 | 1.9 | 41.5 |
| 4 | 21.9 | 2.3 | 8.1 | 5.5 | 3.2 | 0.9 | - | 41.9 |
| 5 | 21.0 | 4.0 | 5.0 | 0.3 | - | - | - | 30.3 |
| 6 | 21.2 | 3.7 | 2.7 | 0.5 | - | - | - | 28.1 |
| 7 | 20.1 | 5.9 | 1.4 | - | - | - | - | 27.4 |
| 8 | 21.5 | 6.1 | 2.1 | 2.9 | 2.6 | 1.4 | - | 36.6 |
© 2020 by the authors. Licensee MDPI, Basel, Switzerland. This article is an open access article distributed under the terms and conditions of the Creative Commons Attribution (CC BY) license (http://creativecommons.org/licenses/by/4.0/).
Share and Cite
Ojumoola, O.; Ma, H.; Gu, Y. Gas Pressure Cycling (GPC) and Solvent-Assisted Gas Pressure Cycling (SA-GPC) Enhanced Oil Recovery Processes in a Thin Heavy Oil Reservoir. Energies 2020, 13, 5047. https://doi.org/10.3390/en13195047
Ojumoola O, Ma H, Gu Y. Gas Pressure Cycling (GPC) and Solvent-Assisted Gas Pressure Cycling (SA-GPC) Enhanced Oil Recovery Processes in a Thin Heavy Oil Reservoir. Energies. 2020; 13(19):5047. https://doi.org/10.3390/en13195047
Chicago/Turabian StyleOjumoola, Olusegun, Hongze Ma, and Yongan Gu. 2020. "Gas Pressure Cycling (GPC) and Solvent-Assisted Gas Pressure Cycling (SA-GPC) Enhanced Oil Recovery Processes in a Thin Heavy Oil Reservoir" Energies 13, no. 19: 5047. https://doi.org/10.3390/en13195047
APA StyleOjumoola, O., Ma, H., & Gu, Y. (2020). Gas Pressure Cycling (GPC) and Solvent-Assisted Gas Pressure Cycling (SA-GPC) Enhanced Oil Recovery Processes in a Thin Heavy Oil Reservoir. Energies, 13(19), 5047. https://doi.org/10.3390/en13195047