Article

CO2 Foam and CO2 Polymer Enhanced Foam for Heavy Oil Recovery and CO2 Storage

by
Ali Telmadarreie
1,2 and
Japan J Trivedi
3,*
1
Office of the Vice-President (Research), University of Calgary, Calgary, AB T2N 1N4, Canada
2
Cnergreen Corporation, Life Sciences Innovation Hub (LSIH) 3655 36 St NW, Calgary, AB T2L 1Y8, Canada
3
Department of Civil and Environmental Engineering, School of Mining and Petroleum, University of Alberta, Edmonton, AB T6G 2R3, Canada
*
Author to whom correspondence should be addressed.
Energies 2020, 13(21), 5735; https://doi.org/10.3390/en13215735
Submission received: 13 August 2020 / Revised: 7 October 2020 / Accepted: 2 November 2020 / Published: 2 November 2020
(This article belongs to the Special Issue CO2 EOR and Sequestration: Conventional and Unconventional Reservoirs)

Abstract

:
Enhanced oil recovery (EOR) from heavy oil reservoirs is challenging. High oil viscosity, high mobility ratio, inadequate sweep, and reservoir heterogeneity adds more challenges and severe difficulties during any EOR method. Foam injection showed potential as an EOR method for challenging and heterogeneous reservoirs containing light oil. However, the foams and especially polymer enhanced foams (PEF) for heavy oil recovery have been less studied. This study aims to evaluate the performance of CO2 foam and CO2 PEF for heavy oil recovery and CO2 storage by analyzing flow through porous media pressure profile, oil recovery, and CO2 gas production. Foam bulk stability tests showed higher stability of PEF compared to that of surfactant-based foam both in the absence and presence of heavy crude oil. The addition of polymer to surfactant-based foam significantly improved its dynamic stability during foam flow experiments. CO2 PEF propagated faster with higher apparent viscosity and resulted in more oil recovery compared to that of CO2 foam injection. The visual observation of glass column demonstrated stable frontal displacement and higher sweep efficiency of PEF compared to that of conventional foam. In the fractured rock sample, additional heavy oil recovery was obtained by liquid diversion into the matrix area rather than gas diversion. Aside from oil production, the higher stability of PEF resulted in more gas storage compared to conventional foam. This study shows that CO2 PEF could significantly improve heavy oil recovery and CO2 storage.

1. Introduction

With growing concerns about climate change and CO2 emissions, the storage of CO2 in EOR operations has been recognized as one of the most practical means of reducing CO2 emissions. In this process, CO2 is injected into an oil reservoir to recover oil and replaced the pore space, resulting in CO2 storage. CO2 EOR and storage lower the cost of geological CO2 storage by recovering incremental oil, which is more attractive in mature oilfields. CO2 EOR and storage has also been studied for fractured reservoirs in the form of immiscible or miscible gas injections [1,2,3,4,5,6]. The Western Canadian Sedimentary Basin (WCSB), where many oil pools are near depletion, can be one of the favorable CO2 storage targets where most of the required infrastructure is already in place [7,8,9]. It is worth mentioning that due to several technical and economic reasons, not all oil reservoirs are suitable for CO2 EOR and storage. Aside from screening for EOR suitability, oil recovery, and CO2 storage capacity, other economic criteria should be considered for a successful CO2 EOR and storage project [9]. According to the per basin and regional-scale suitability study performed by Bachu and Steward, WCSB is generally suitable for geological sequestration of CO2 including EOR [10]. However, determining the oil recovery and capacity for CO2 storage should be performed individually for each reservoir. Since the 1990s, CO2 sequestration has been performed on a large scale in Norway and more than 35 million tons of CO2 has been injected into the hydrocarbon reservoirs during the CO2 EOR process [8]. The Weyburn CO2 project (located in Saskatchewan, Canada) is also one of the successful projects in both CO2 EOR and sequestration [11].
Although CO2 EOR has proven to be an effective method for some reservoirs, the low viscosity and therefore high mobility of the injected CO2 leads the poor sweep efficiency, especially in heterogeneous and/or heavy oil reservoirs. Due to higher viscosity than gas, foam injection can improve sweep efficiency compared to conventional gas injection [12]. The foam EOR application is particularly suited for heterogeneous reservoirs as foam selectively reduces the mobility of high permeable zones more effectively [12,13,14,15], and it is a field-scale proven technique at immiscible and miscible conditions [16,17,18,19].
Haugen et al. (2012) studied foam flow in fractured limestone rock samples for EOR. They found that the in situ generation of foam in such a fractured rock sample was not feasible. On the other hand, the pre-generated foam could increase the oil recovery significantly, but only after the significant amount of injection. Farajzadeh et al. (2010) studied a foam model in a fractured reservoir to increase matrix oil recovery [20]. They found that very strong foam is required to create enough pressure drop, which can result in oil recovery from the matrix. Haugen et al. (2014) investigated the foam performance on mobility control and EOR in fractured oil-wet carbonate rocks [21]. As per their experimental results, the miscible injection of CO2 foam significantly increased the oil sweep efficiency more than that of the immiscible injection of N2 foam. Additionally, with the help of computerized tomography (CT) scans, they observed that a limited amount of gas could invade into the matrix during immiscible foam injection, and matrix oil mainly displaced by the invasion of the surfactant. More recently, Chaturvedi et al. studied the use of silica nanofluids for enhancing CO2 adsorption in polymer solutions [22,23].
Several studies have been performed to investigate the potential of foam [15,20,21,24,25,26,27,28,29,30] and microbubbles [31,32] for EOR. Although the CO2 EOR and storage process has been studied before [11,33,34], study on the potential of CO2 foam and especially CO2 polymer enhanced foam (PEF) for both EOR and CO2 sequestration is limited. Therefore, this work presents the experimental results on the potential of CO2 foam and CO2 PEF for relatively viscous oil recovery from unconsolidated and consolidate porous media, focusing on the effect of heterogeneity and polymer addition.

2. Experimental

This experimental study followed three main goals: (1) compare the flow performance of foam and PEF in an unconsolidated porous medium (a column packed with silica sand) in the presence and absence of heavy oil; (2) compare the flow and oil recovery performance of foam and PEF in rock samples (homogenous and fractured); and (3) analyze the effect of polymer addition and heterogeneity on the performance of the foam.

2.1. Fluid Properties

A relatively viscous oil, sampled from a Canadian oil reservoir, with the viscosity of 670 centipoises (at 22 °C) was used for the coreflooding experiments. For flow experiments in unconsolidated media, a similar heavy oil with viscosity of about 1300 centipoise (cp) was used. The surfactant and polymer used in this study were sodium dodecylbenzene sulfonate (Na-DDBS, Sigma-Aldrich, St. Louis, Missouri, US) and Flopaam 3330S (partially hydrolyzed polyacrylamides, molecular weight of 106 g/mol, provided by SNF), respectively. For flow experiments in a rock sample, the foaming solution was prepared with 1000 ppm NaCl brine solution. To generate polymer enhanced foam (PEF), the polymer is added to the surfactant solution before foam generation. More information on the chemicals and the stability of foam generated with the surfactant and the polymer used in this study can be found in previous studies [29,35].

2.2. Flow in Sandpack (Unconsolidated Porous Medium)

Silica sand with a size of 40 to 70 meshes (210 to 400 microns) was used to pack a visual glass cell (30 cm in length and 2.5 cm in diameter) for foam flow study. In experiments performed on the sandpack, gas and foaming solution were alternatively injected, and foam/PEF was generated in situ without using any foam generator. The details of the experimental procedure are written elsewhere [36].
After vacuum saturation of the sandpack with tap water, the heavy oil with a viscosity of about 1300 cp was injected to reach initial oil saturation. In the sandpack test, the foam was generated in situ with the help of surfactant alternating gas (SAG) injection. During all the experiments, both liquid and gas rates were kept equal (20 feet/day, ft/d). Since the permeability of the sandpack was high (37 ± 0.5% Darcy, D) the high flow rate was used to achieve a shear rate comparable to the reservoir condition and assure in situ foam generation. Moreover, no back pressure was used in the sandpack test. The details of the sandpack setup are explained elsewhere [36].

2.3. Flow in Rock Samples

Rock samples: Sandstone and carbonate outcrop rock samples were sampled from the same block to avoid any significant change in rock properties (i.e., porosity and permeability). Both sandstone rock (Buffed Berea sandstone formation) and carbonate rock (Indiana limestone formation) were 15 cm (centimeter) and 5 cm in length and diameter, respectively. The fractured rock sample was prepared by cutting the rock samples with a 3 mm saw blade. Figure 1 shows the images of homogenous and fractured rock samples. The matrix of carbonate rock is heterogeneous compared to that of the sandstone sample, as seen in Figure 1.
A foam generator was designed and used for foam injection in rock samples. The foam generator was made of glass beads with 40–70 mesh sizes (210–400 microns) packed inside a metal tube (10 cm and 0.95 cm in length and diameter, respectively). Both sides of the tube were sealed with 120 mesh size (125 microns) screens. The schematic of the foam generator is shown in Figure 2. The foaming solution was first injected into the foam generator to minimize chemical absorption. Thereafter, the foam/PEF solution and CO2 gas were co-injected, and generated foam/PEF was visualized after the foam generator to inspect the quality of the foam before entering the rock samples.
The dried rock samples were vacuumed overnight, and porosity was determined by brine saturation and material balance calculation. Matrix permeability of the rock samples was also calculated by Darcy’s law during the injection of brine at constant flow rates (at least five different flow rates). Thereafter, heavy oil was injected into the rock overnight to reach residual brine saturation condition (at least five pore volumes of heavy oil was injected in each experiment). Next, water flooding (1000 ppm brine solution) was performed for about 2.5 pore volumes (PVs) corresponding to a water cut of 98%. CO2 foam/PEF (80% quality) was injected after waterflood as a tertiary EOR method for heavy oil recovery. The injection flow rates can be seen in Table 1. A mass flow controller was used for accurate CO2 gas injection in the experimental condition. Pre-generated foam/PEF was injected into the rock with the help of a foam generator, as explained above. The quality of generated foam/PEF was kept constant during all experiments (80%). Each experiment was also followed with 1–1.5 PVs of chase waterflood to observe any further liquid/gas production.
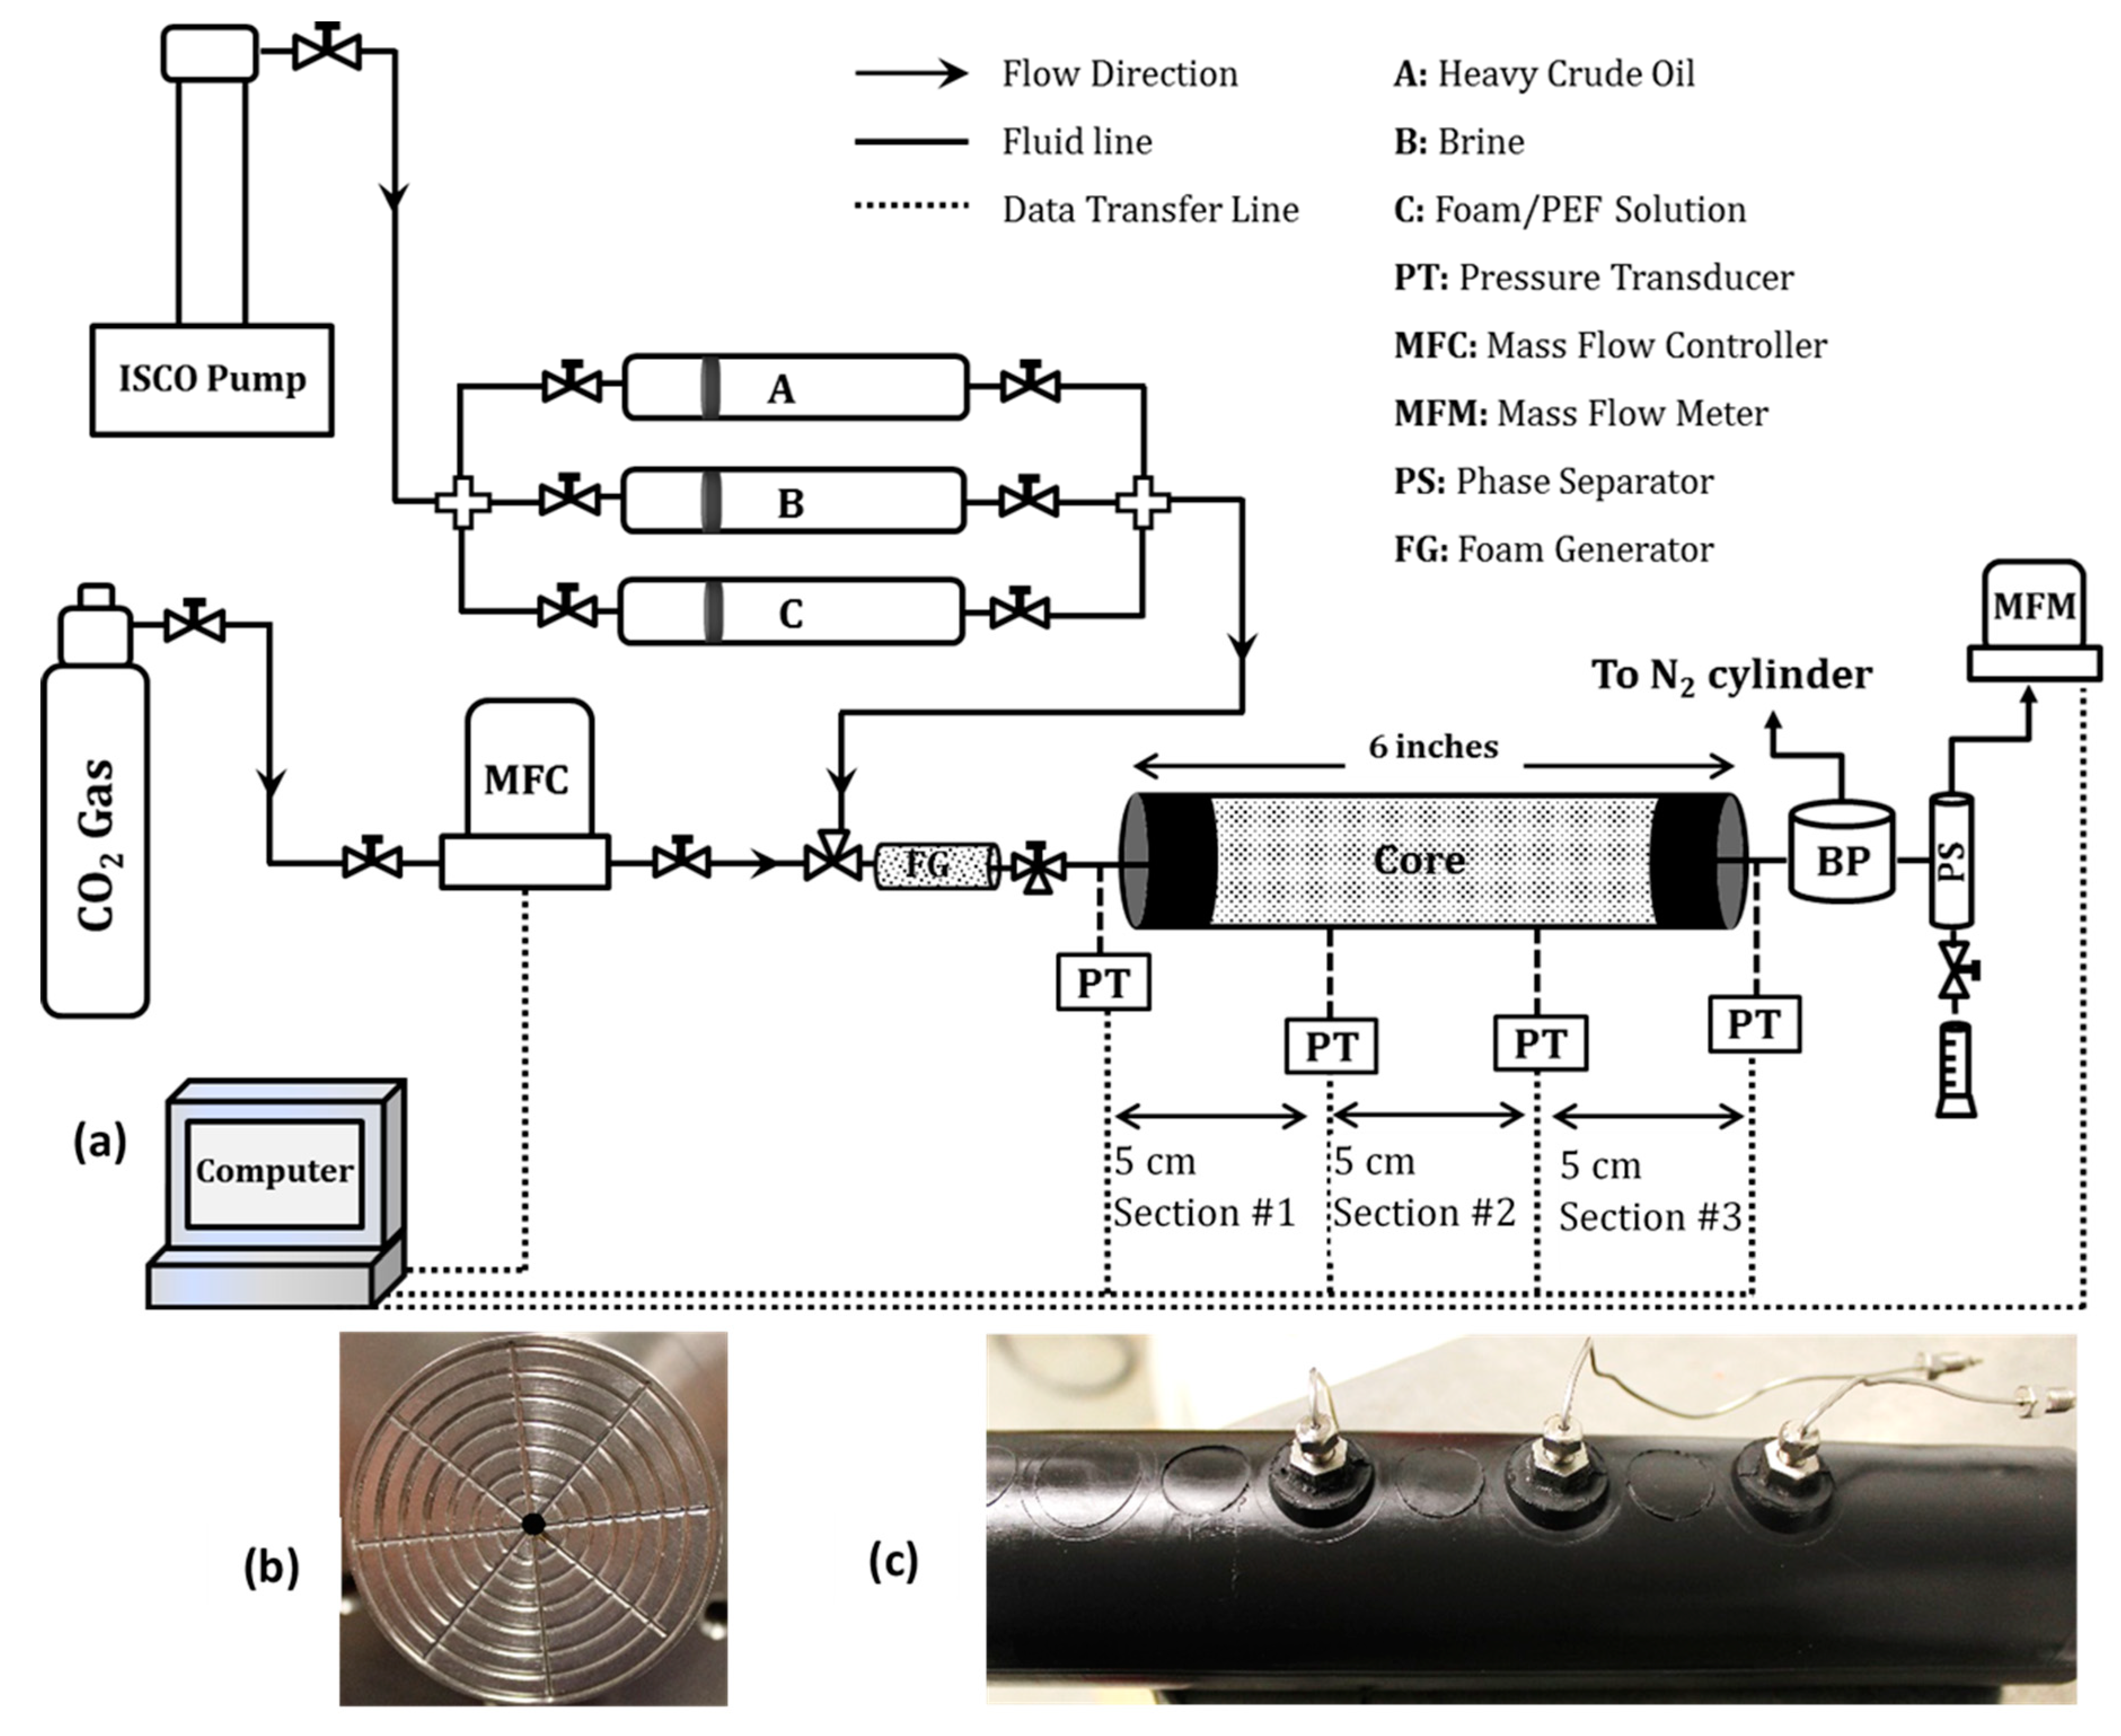
Figure 3 shows a detailed schematic of the coreflood system used in this study. A custom-designed glass phase separator was used to separate the produced liquids from CO2 gas. CO2 gas, water, and oil samples were measured continuously at effluent samples for further analysis. Produced CO2 gas was measured continuously with the help of mass flow meter connected to the data acquisition system. The pressure was also measured at different sections of the rock as seen in Figure 3 (5 cm intervals). The inlet/outlet sections of the core holder have networks of flow paths (Figure 3a) for the effective injection of fluid into the rock sample, which is important in the case of the fractured rock to ensure the injected fluid is in contact with both the matrix and the fracture. All coreflood tests were performed at a pressure of 150 psig (psi: pound-force per square inch). Additionally, confining pressure was always 150 psig above the injection pressure and all tests were performed at room temperature (22 ± 1 °C). Five coreflood experiments (three fractured and two homogenous rock samples) were performed and the experimental parameters are shown in Table 1.

3. Results

3.1. Static Performance of Foam and PEF in the Presence/Absence of Heavy Oil

To study the bulk stability, foam/PEF was generated with the help of a homogenizer at high speed (4000 round per minute, rpm). Bulk foam stability was performed to evaluate the effect of polymer addition and heavy crude oil on the stability of the foam. Figure 4 shows the foamability and foam stability of foam and PEF in the presence and absence of heavy oil. Foamability is a measure of initial foam height and foam stability is defined as a time required for half of the liquid to drain from the foam structure. Air was used as the gas phase in the static study. Although the addition of polymer decreased the foamability, it significantly increased the foam stability in both the presence and absence of crude oil. It should be mentioned that, although the physics of foam in bulk and porous media are rather different, the results from the static analysis are helpful in predicting the performance of foaming solutions for heavy oil recovery.

3.2. Dynamic Performance of Foam and PEF in Unconsolidated Porous Medium

Foam/PEF performance for heavy oil recovery was investigated in tertiary mode (i.e., after waterflood). The pressure history of injected foam/PEF was used to understand the flow behavior in the presence and absence of heavy oil. Figure 5 shows the flow performance of CO2 foam and CO2 polymer enhanced foam in unconsolidated porous media saturated with water and/or heavy oil. CO2 PEF showed a slightly higher pressure drop compared to that of foam in water-saturated sandpack (Figure 5a). As seen in Figure 5a, the onset of foam generation, an abrupt increase in pressure profile, was faster in the case of PEF than that of foam. Foam generated after about 0.7 pore volume (PV), but PEF generated faster (after about 0.5 PV). Additionally, the larger local pressure fluctuations during foam propagation demonstrated lower stability of the foam compared to that of PEF [34].
In the presence of bypassed heavy oil (after waterflood), CO2 PEF showed significant resistance to flow compared to that of CO2 foam (Figure 5b) inferred from higher injection pressure. The first peak in the pressure profile (Figure 5b was around 1 PV) was due to oil bank creation and movement, as shown by the oil cut profiles. After oil bank production, CO2 PEF propagated much faster compared to that of foam and reached a steady state at around 6 PVs. The CO2 foam propagation was slower and never reached the steady-state pressure, even after the injection of 10 pore volumes.
PEF generated and propagated much faster than foam in the presence of oil, as inferred from the higher injection pressure in Figure 5b. Such behavior resulted in faster and higher oil production of PEF than that of foam, as seen in Figure 5c.

3.3. Dynamic Performance of Foam and PEF in Consolidated Porous Medium

Pressure along the length of the rock sample, liquid production, and CO2 gas production were recorded to investigate the potential of CO2 foam for heavy oil recovery and CO2 storage, which will be analyzed in the discussion section. It should be mentioned that all experiments were performed in the following sequence: (1) waterflood, (2) CO2 foam/PEF flood, and (3) extended water flood (EWF).

3.3.1. Waterflood

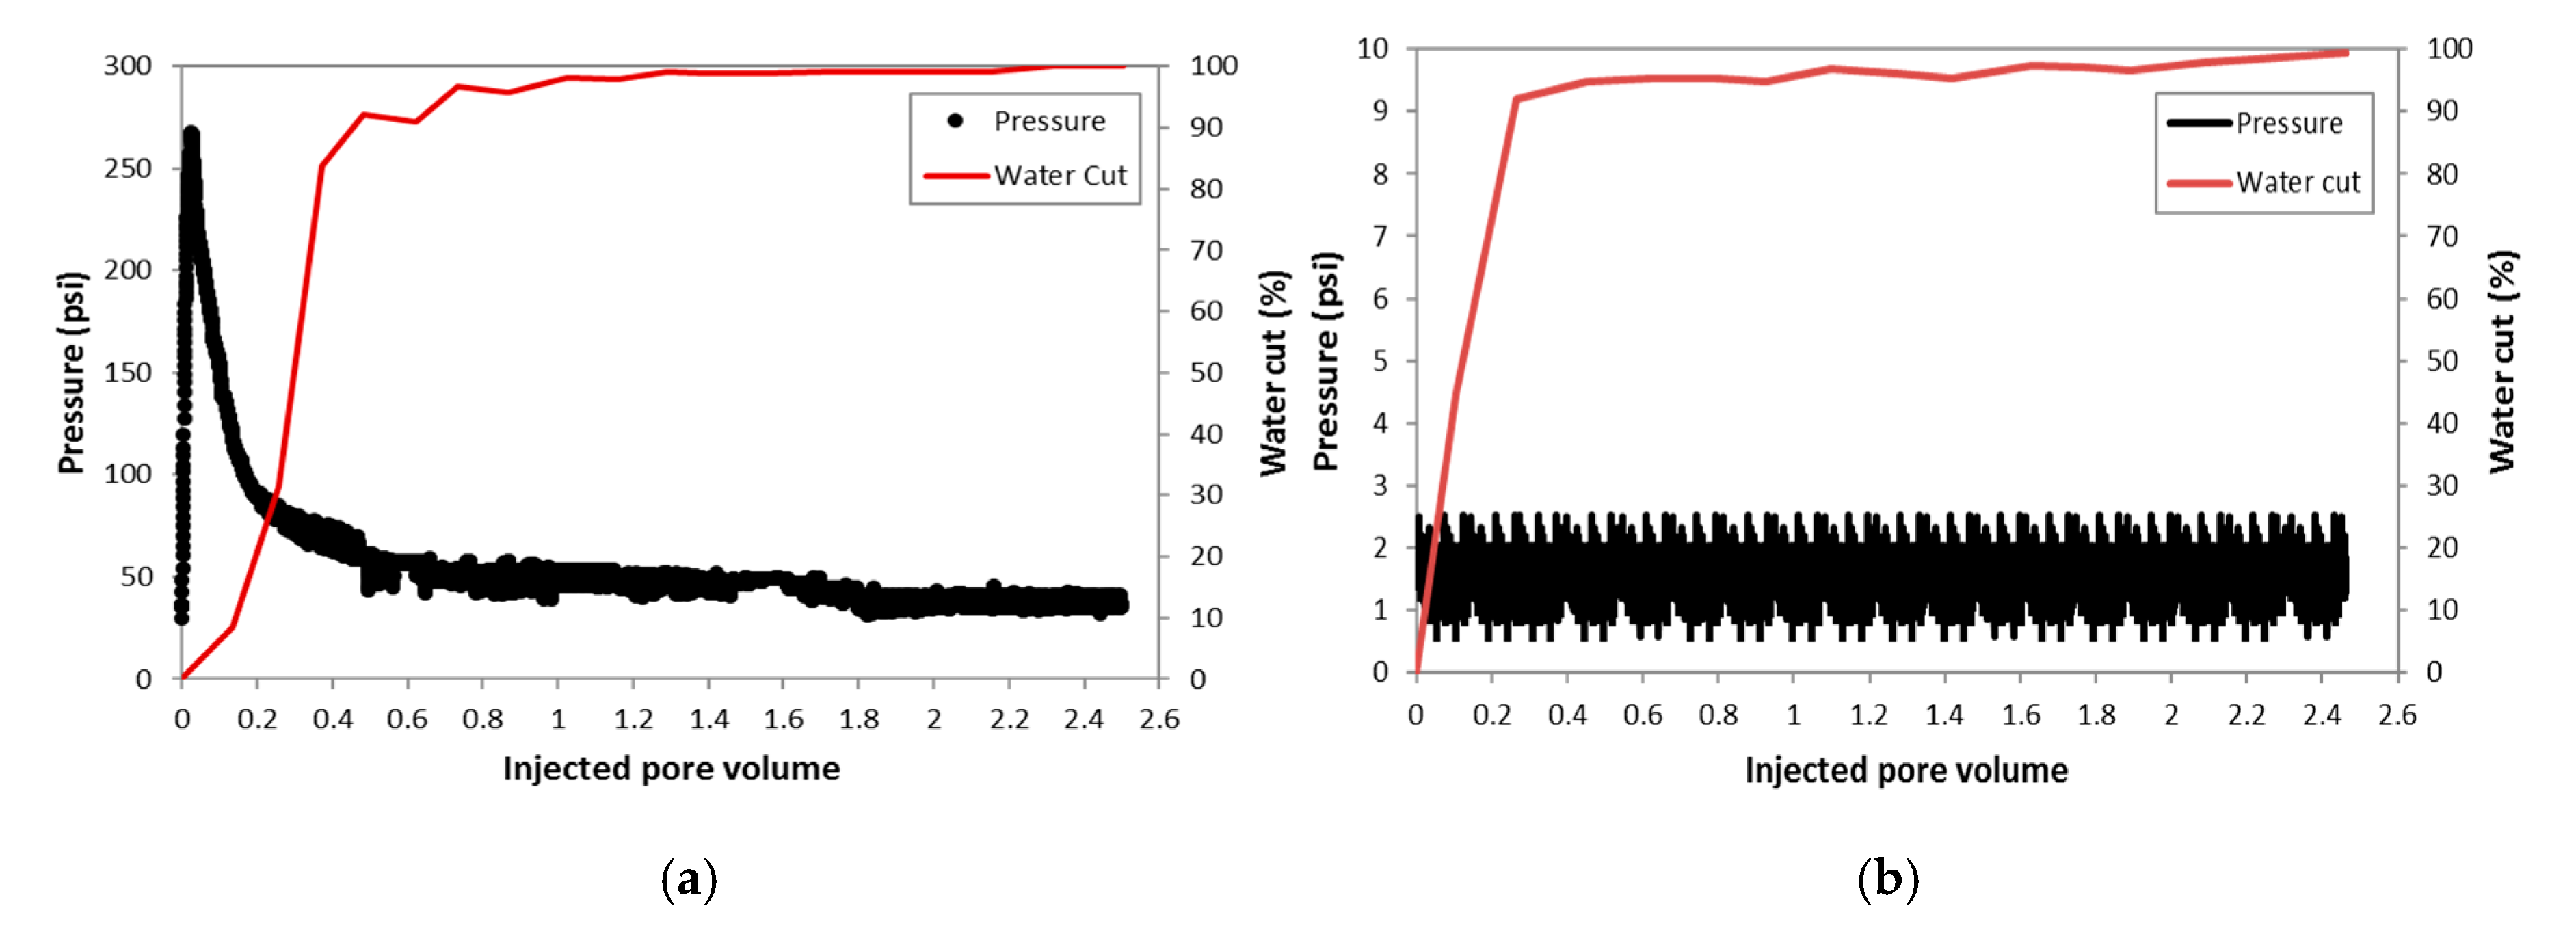
Two tests were performed on homogeneous sandstone rock samples. Typical pressure and water cut profiles during water flooding in homogenous rock samples are shown in Figure 6a. During water flooding, at first, pressure increased to push the heavy oil in the pores toward the production. After oil production, the pressure started to drop drastically, and the water breakthrough occurred. In this case, the breakthrough happened around 0.2 pore volume (PV). When the pressure reaches a plateau (in this case after about 0.8–1 PV), the water cut will be at its maximum value and there will be no significant oil production afterward. A relatively constant pressure after about 0.8–1 PV of water injection showed the effect of channels created by water injection, resulting in a path of least resistance for injected water.
There was no increase in the overall pressure drop in the fractured rock sample during water flooding (Figure 6b) as water mainly flowed through the fracture. As per the water cut profile, the injected water pushed and produced the oil in the fracture up to about 0.3 PV. After that, the water cut was always more than 95% and no significant oil recovery was observed.

3.3.2. CO2 Foam/PEF Flood

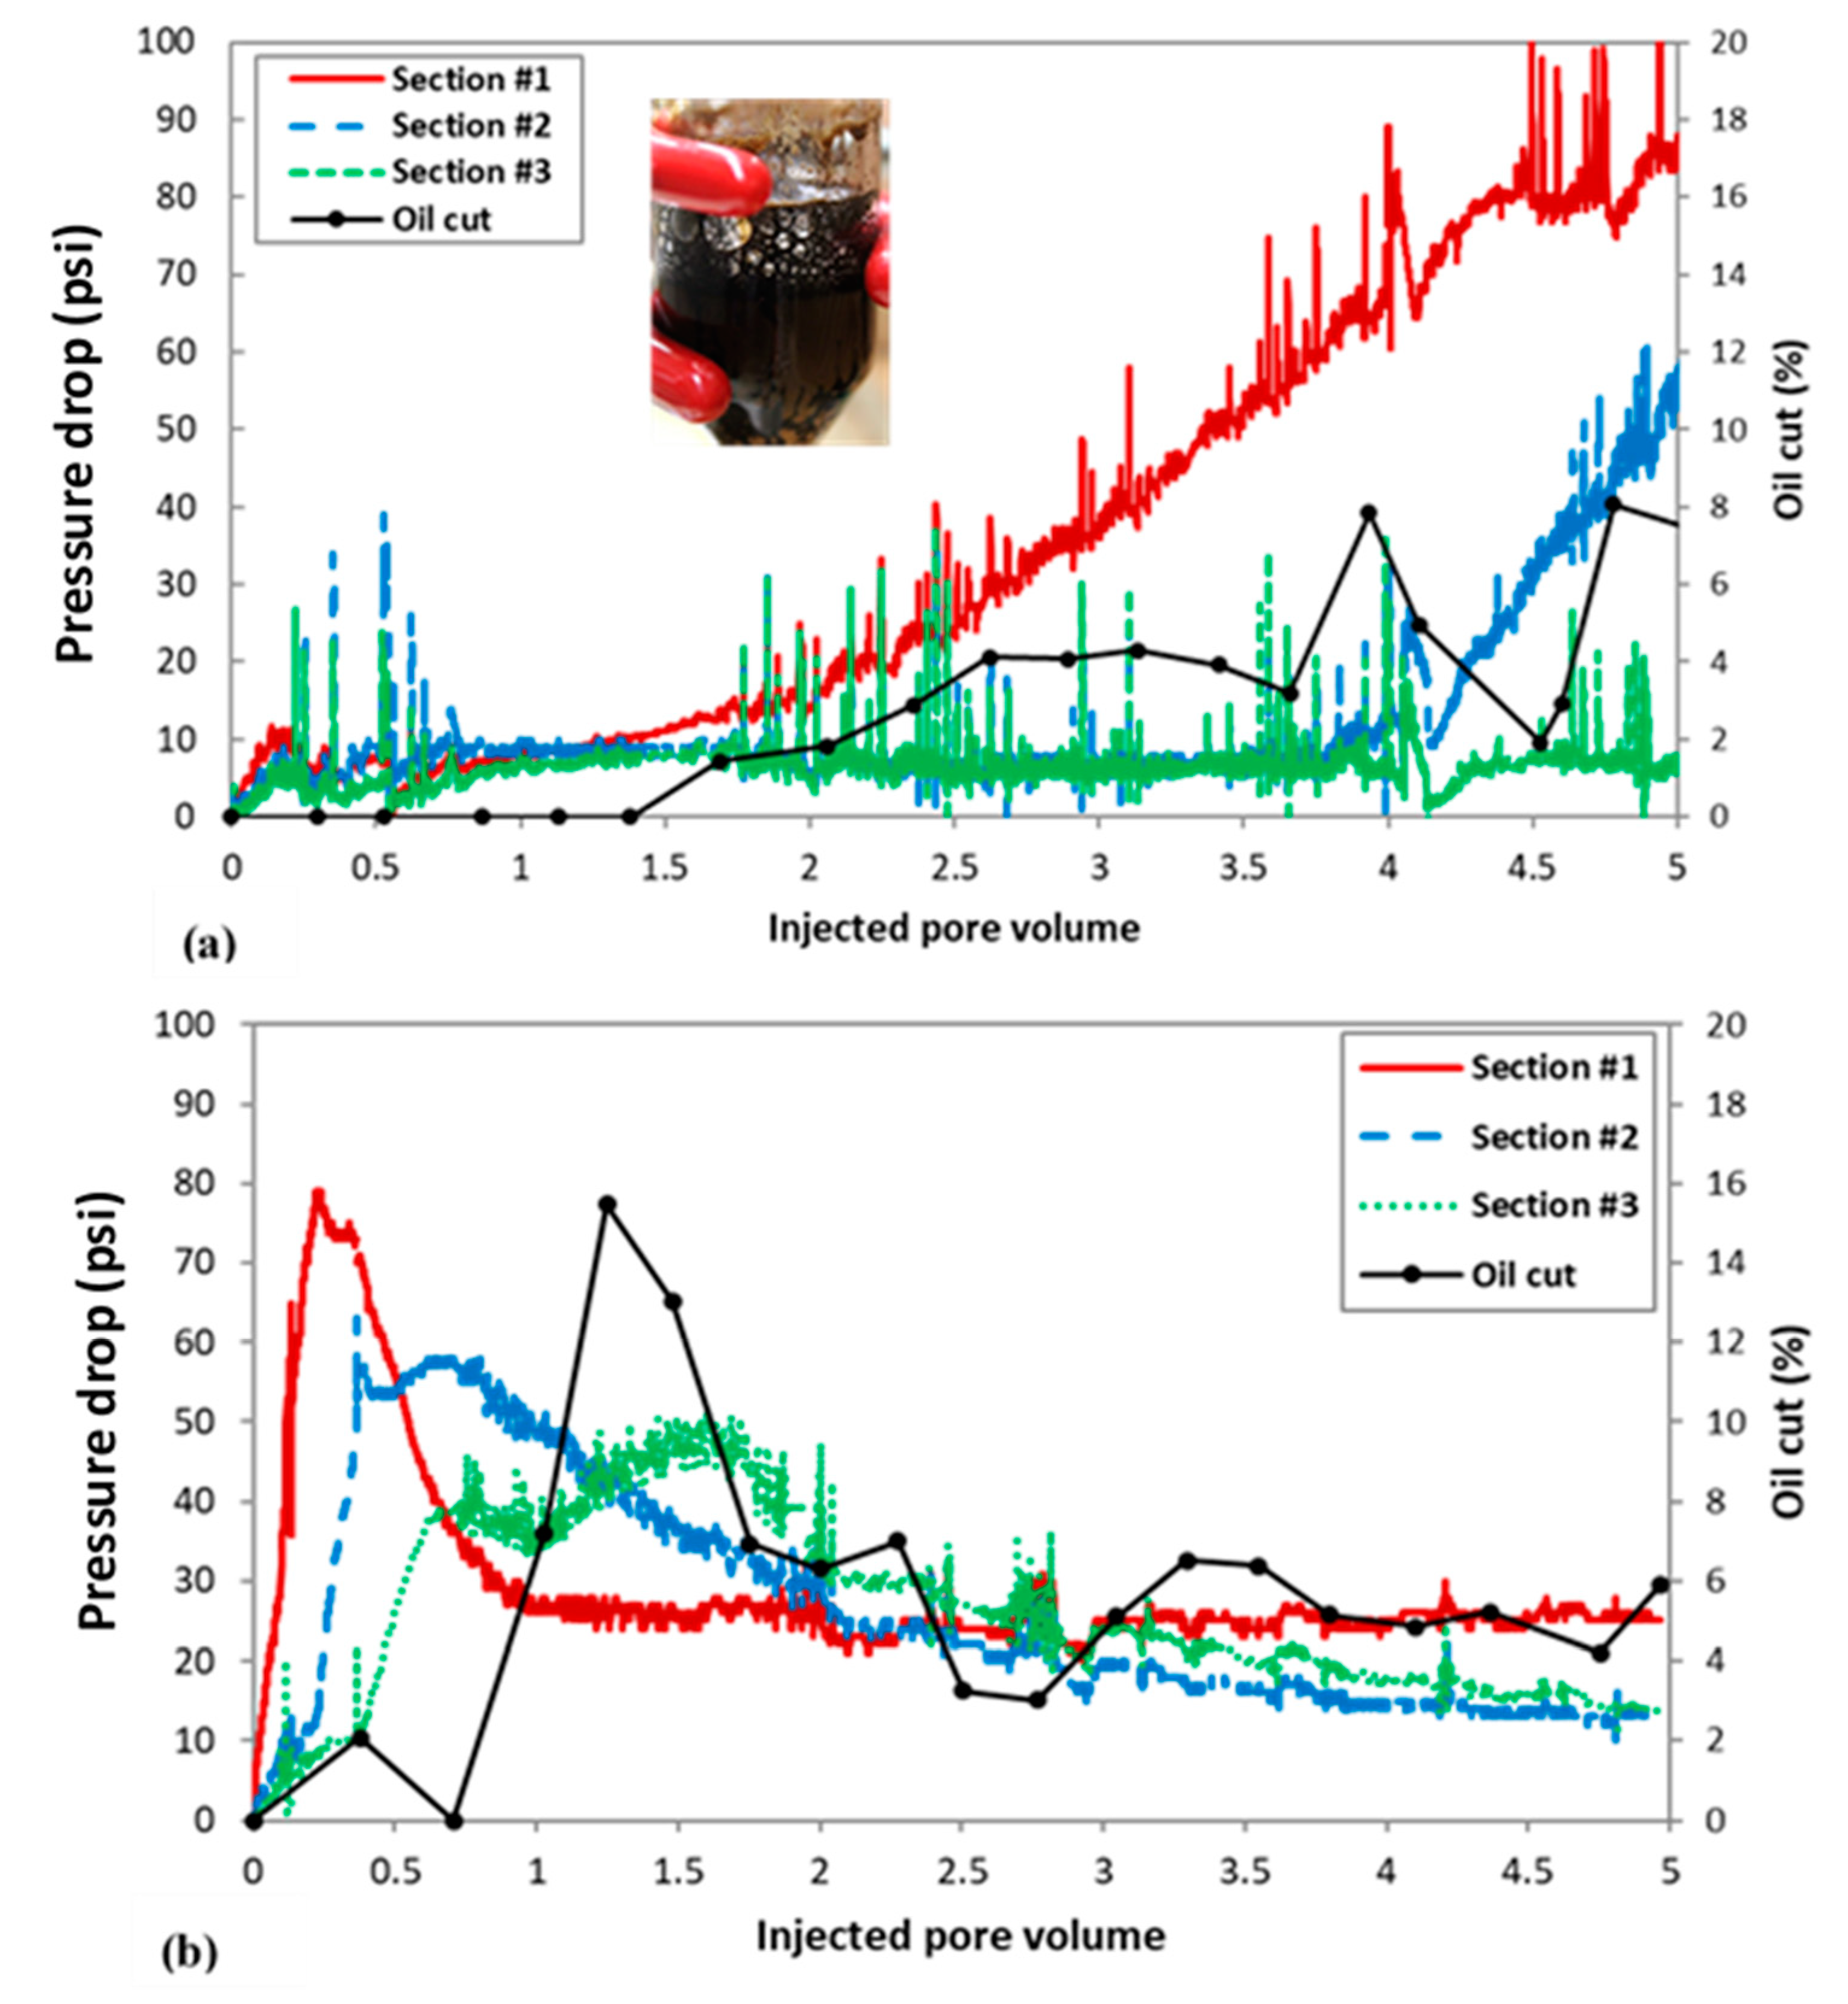
CO2 foam and CO2 PEF were injected into the homogeneous sandstone rock saturated with heavy oil as a tertiary recovery method (after waterflood). However, their performances were quite different in terms of pressure profile, as shown in Figure 7. Let us first consider the foam injection (Figure 7a). During foam injection, the pressure at section #1 slightly and gradually increased between 1–4 PV intervals. This interval is the foam propagation stage where the foam is moving within the porous media (Telmadarreie and Trivedi, 2015). The slope of the pressure curve represents how fast foam can propagate and foam propagation can be hindered due to the negative effect of the oil on foam stability. After about 4 PVs, the foam propagated at a slower rate since the pressure at section #1 started to level out and the foam filled the first section. Oil started to produce after about 1.4 PVs of foam injection (early time of foam propagation), resulting in pushing some residual oil (remained after waterflooding) to move toward the outlet. At about 4 PVs, the pressure at the second section of the rock started to increase, showing that the foam front reached this section. As foam injection continued, the oil cut increased, but the foam front could not reach the end section of the rock up to 5 PVs of injection, as inferred from the lower pressure drop in section #3. However, the foam was produced at the outlet along with oil, as shown in Figure 7a.
The pressure drop trend was different from foam when injecting CO2 PEF (Figure 7b). The pressure drop in the first section rapidly increased up to a 0.2 pore volume and then it started to decrease slightly and reached a plateau after about 1 pore volume. This behavior is due to the oil bank generation and movement inferred from the oil cut. Moreover, the foam front moved much faster in the case of PEF at it reached the second section of the rock after about 0.5 PV of injection, as shown by an increase in pressure of section #2. PEF is more stable than conventional foam in the presence of heavy oil [33], therefore, it is more efficient in sweeping oil. Moreover, per visual observation of effluents, the amount and stability of PEF bubbles produced at the outlet were higher than that of foam, showing the higher stability of PEF in the presence of oil. In the case of foam, most of the gas was produced as a free gas rather than bubbles. In the next section, we will discuss how foam stability has a positive effect on oil recovery and gas storage.
The performance of both waterflood and CO2 foam/PEF flood was quite different in the fractured rock samples compared to that of the homogeneous samples. The pressure remained low in both CO2 foam and PEF injections in a fractured rock sample, as shown in Figure 8. However, foam/PEF injection resulted in additional oil recovery after waterflood. The additional oil recovery can be due to the fluid diversion into the matrix, which will be discussed later in this paper. It should be mentioned that CO2 foam and PEF performance in fractured carbonate rock was similar to that of fractured sandstone rock (Figure 8), and the results are not presented here.

4. Discussions

The performance of CO2 foam and CO2 PEF in both unconsolidated and consolidated porous media in terms of (1) heavy oil recovery and (2) CO2 storage are discussed in this section. The effect of polymer addition and heterogeneity (fracture) are also discussed.

4.1. Foam Flow in Unconsolidated Porous Media

Foam apparent viscosity is one of the key factors for foam EOR as a mobility control agent. The apparent viscosity is calculated from the Darcy equation to show the effectiveness of foam in porous media, where the higher apparent viscosity means more stable foam and a higher chance of increasing oil recovery. As seen in Figure 9a, CO2 PEF had a higher apparent viscosity than foam both in the water-saturated and heavy oil saturated sandpack. In water-saturated media, CO2 PEF apparent viscosity (100 cp) was almost double than that of CO2 foam after one pore volume of injection. Unlike CO2 foam, CO2 PEF apparent viscosity was very similar both in the water-saturated and oil-saturated media, showing that PEF is resistant to heavy oil. This behavior can be seen in the sweep efficiency of foam and PEF (Figure 9b). Visual images of the sandpack showed most of the oil was displaced after about 4 PVs with piston-like displacement during CO2 PEF injection. However, in the case of CO2 foam, most of the oil was left behind with poor sweep efficiency.

4.2. Foam Flow in Consolidated Porous Media: Oil Recovery and CO2 Storage

After waterflooding, a path of least resistance (i.e., channels) was created by water. CO2 foam/PEF can be used to block those channels and increase oil recovery and gas storage.
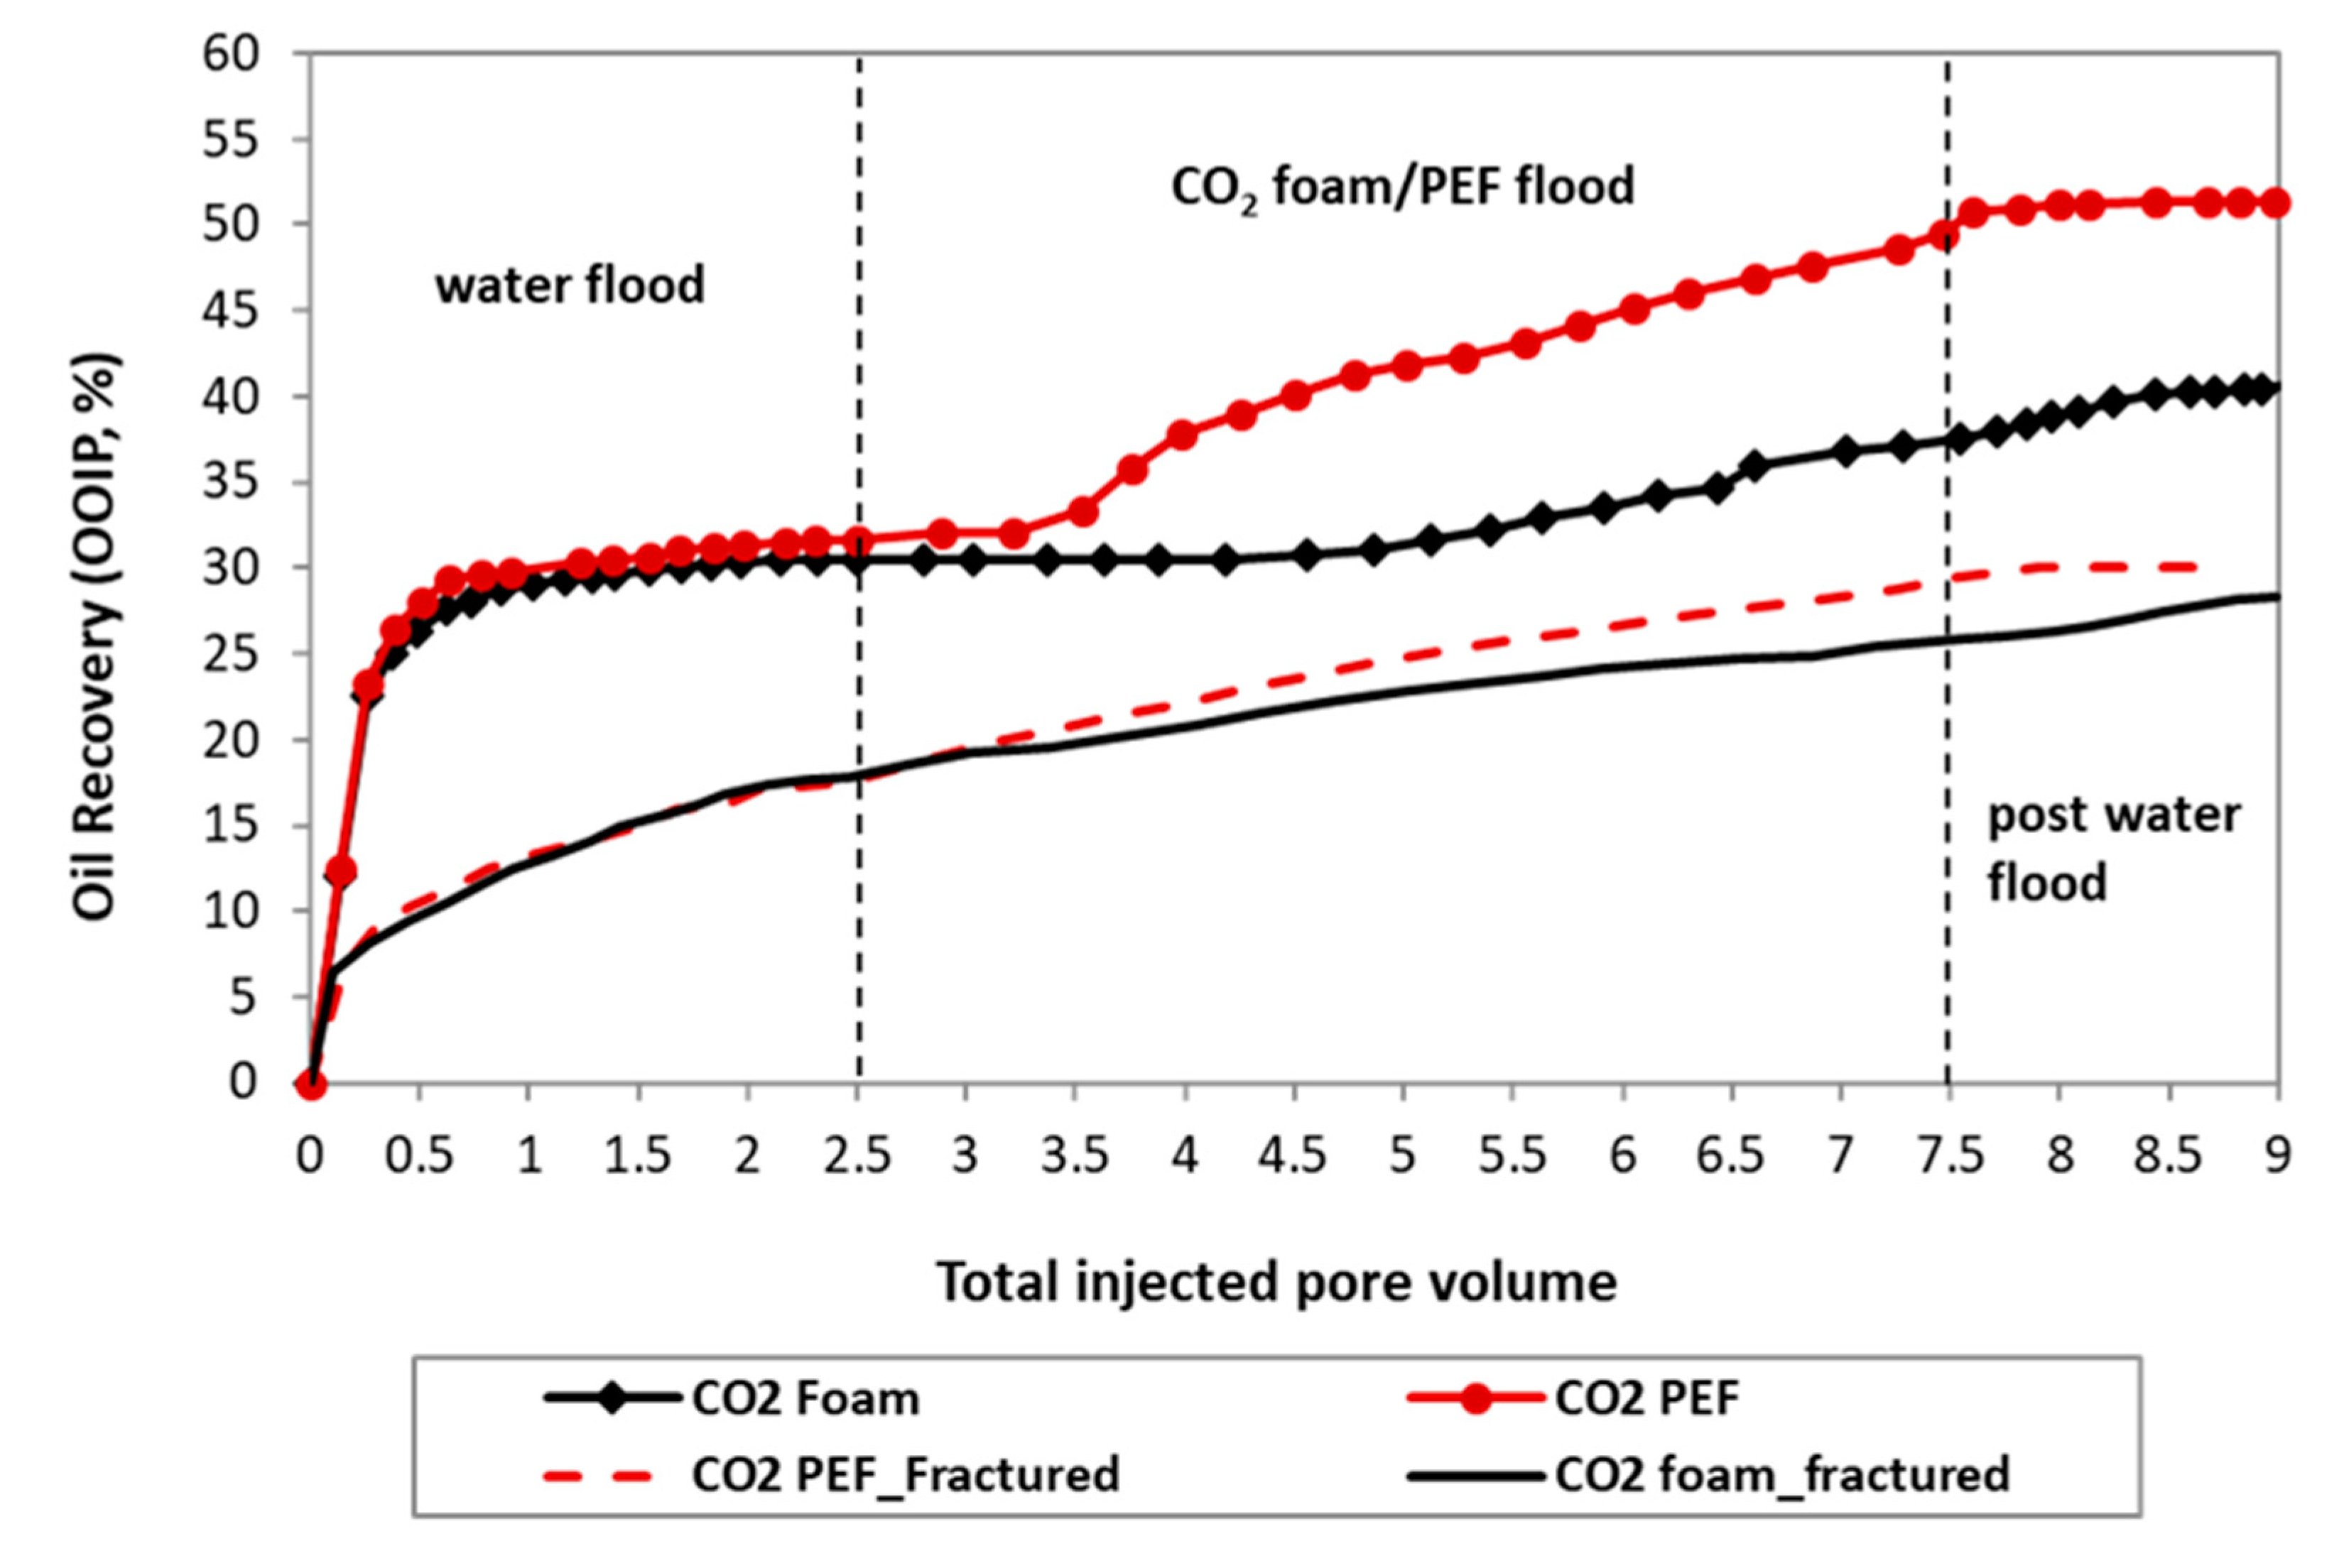
In the foam flooding of fractured rock, the oil production started at about 1 PV of foam injection (Figure 10). At this time, the foam has already occupied the fracture and diverted the injected fluid into the matrix and produced oil. The injected surfactant diverted into the matrix more easily as foam creates a resistance to flow in the fracture and improves the oil recovery from the matrix. However, the foam itself did not invade the matrix, and therefore the pressure did not increase, as seen in Figure 8. In the homogeneous rock, at first, foam blocked the least resistance path created by water. Then, the resistance to flow (due to high viscosity of foam) diverted the injected fluid toward the untouched part of the rock and eventually pushed the oil toward the production line at around 1 PV of foam injection (3.5 total PVs in Figure 10).
CO2 foam flood resulted in a similar amount of oil production in both the homogeneous and fractured rock samples (about 8% in Figure 11a), but CO2 PEF produced more oil from the homogenous rock than that of the fractured one. As shown before, the addition of polymer to the conventional foam increased its stability in the presence and absence of oil. When the oil is viscous, the polymer addition plays an important role in oil recovery by stabilizing the foam in the presence of oil and reducing the mobility of the injected fluid. The addition of polymer to the foam significantly improved the heavy oil recovery and increased the total oil recovery to around 50% of the original oil in place (Figure 10, at 7.5 PV PEF produced 17.8% additional oil after waterflood). This value was only about 35% in the case of conventional foam injection. PEF also propagated much faster than the foam, as seen in Figure 7, inferred from the response of pressure at different sections of the rock. The rate of foam propagation is a battle between stability/regeneration of foam bubbles and foam collapse due to the oil effect. Faster propagation (which can be due to the higher stability of PEF in the presence of oil) also resulted in faster oil production.
In the fractured rock sample, unlike the homogeneous one, PEF slightly increased the oil recovery after the injection of five pore volumes (PVs). Similar behavior in fractured porous media was also observed by Haugen et al. (2014) [21]. They also observed that in some fractured rock samples, there was no significant increase in the pressure drop, even after 40 PVs of foam injection. The additional oil recovery can be explained by liquid diversion toward the matrix. Foam bubbles reduced the fluid mobility in the fracture zone and diverted the liquid into the matrix, resulting in further oil recovery. This process was slightly more efficient in the case of PEF. It should be mentioned that there was no significant gas invasion into the matrix, as inferred from Figure 11b.
PEF had better performance in both homogeneous and heterogeneous rock samples compared to that of foam injection. According to Figure 11a, the heavy oil recovery (OOIP) by CO2 PEF was 17.8% and 11.7% for the homogenous and fractured rock samples, respectively. This value was 8% and 7.9% for CO2 foam flooding. Moreover, extended waterflood after foam/PEF injection produced more oil, showing that foam bubbles are relatively effective in fluid diversion in the porous media, and injected water could reach untouched parts of the rock.
The amount of produced CO2 gas was continuously monitored and recorded during all experiments to calculate the amount of remaining CO2 gas in the rock by simple material balance. The discussion in this section was only based on material balance and the objective was to see how the dynamic stability of foam in the presence of oil will affect the amount of CO2 stored in the rock sample, even after the extended waterflood process, as shown in Figure 11b. The amount of CO2 gas inside the rock was greater in the homogeneous rock samples than the fractured one. Extended waterflood (EWF) also produced some of the gas inside the rock, however, some CO2 gas remained in the rock even after EWF. In the case of the fractured rock, the amount of CO2 storage was not significant, showing that most of the gas remained in the fractured area and CO2 gas could not invade into the matrix zone. This shows that the pressure inside the fracture was not high enough to trigger the gas diversion (by overcoming the capillary pressure), which was also observed in another study [21].
Figure 11b shows how the enhanced dynamic stability and foam collapse rate in porous media will contribute to the CO2 gas production rate and thus CO2 storage potential. More than 40% of pore spaces in the homogeneous rock were occupied by the CO2 gas at the end of PEF flooding. This value was about 27% for foam flooding, showing that the addition of polymer can enhance the dynamic stability of foam bubbles and thus reduce the amount of produced CO2 gas. After the EWF process, more CO2 gas was produced from the rock, but a significant amount of gas remained in the porous media (more than 15% and 25% in the case of CO2 foam and CO2 PEF, respectively). In the fractured porous media, foam or PEF could not divert the gas into the matrix area and CO2 gas only remained inside the fracture and the trapping process was insignificant.

5. Conclusions

The addition of polymer could increase the stability of conventional foam, and this study aimed to analyze and compare the performance of CO2 foam and CO2 PEF for heavy oil recovery and CO2 storage as a tertiary EOR method (i.e., after waterflooding). According to this study, being stable in the presence of crude oil is one of the main factors for the successful application of CO2 foam in CO2 EOR and storage. The main conclusions of this study are summarized as follows:
  • CO2 PEF showed better dynamic performance than that of CO2 foam in both unconsolidated porous media in terms of higher apparent viscosity, better oil tolerance, and consolidate porous media in terms of faster oil production, and a higher saturation of CO2 gas trapped in the porous media.
  • In a homogenous rock sample, CO2 foam injection improved waterflood residual heavy oil recovery by 8% of OOIP.
  • The addition of polymer to conventional CO2 foam (CO2 PEF) could significantly improve its performance for heavy oil recovery, especially in the homogeneous rock sample. CO2 PEF recovered about 26% and 11% of residual oil in the rock after the waterflooding process from the homogeneous and fractured rock, respectively.
  • CO2 PEF showed a faster propagation rate than foam in the homogeneous porous media, demonstrating the higher dynamic stability of PEF. This also resulted in faster oil production and higher ultimate oil recovery after CO2 PEF injection.
  • Injection pressure and amount of remained gas at the end of CO2 foam/PEF in the fractured core samples showed that there was no significant gas diversion into the matrix and most of the gas remained in the fractured area. Additional oil recovery from the fractured core was due to the liquid (surfactant/polymer) diversion into the matrix.
  • Aside from improving heavy oil recovery, the addition of polymer increased the dynamic stability of foam bubbles in the presence of oil, reducing the CO2 gas production. At the end of CO2 PEF injection, CO2 gas occupied about 40% of pore volume, showing great potential for CO2 storage.

Author Contributions

Conceptualization, A.T. and J.J.T.; Methodology, A.T.; Formal Analysis, A.T.; Investigation, A.T. and J.J.T.; Resources, J.J.T.; Writing-Original Draft Preparation, A.T.; Supervision, J.J.T. All authors have read and agreed to the published version of the manuscript.

Funding

The financial support for this study provided by the Natural Sciences and Engineering Research Council of Canada (NSERC), Alberta Innovates—Technology Futures, Carbon Management Canada (CMC), and the University of Alberta. As part of the University of Alberta’s Future Energy Systems research initiative, this research was made possible in part thanks to funding from the Canada First Research Excellence Fund.

Conflicts of Interest

The authors declare no conflict of interest.

References

  1. Trivedi, J.J.; Babadagli, T. Efficiency of diffusion controlled miscible displacement in fractured porous media. Transp. Porous Media 2007, 71, 379–394. [Google Scholar] [CrossRef]
  2. Trivedi, J.; Babadagli, T. Scaling miscible displacement in fractured porous media using dimensionless groups. J. Pet. Sci. Eng. 2008, 61, 58–66. [Google Scholar] [CrossRef]
  3. Trivedi, J.; Babadagli, T. Efficiency Analysis of Greenhouse Gas Sequestration during Miscible CO2Injection in Fractured Oil Reservoirs. Environ. Sci. Technol. 2008, 42, 5473–5479. [Google Scholar] [CrossRef] [PubMed]
  4. Trivedi, J.; Babadagli, T. Experimental and numerical modeling of the mass transfer between rock matrix and fracture. Chem. Eng. J. 2009, 146, 194–204. [Google Scholar] [CrossRef]
  5. Trivedi, J.J.; Babadagli, T. Oil Recovery and Sequestration Potential of Naturally Fractured Reservoirs During CO2 Injection. Energy Fuels 2009, 23, 4025–4036. [Google Scholar] [CrossRef]
  6. Trivedi, J.; Babadagli, T. Experimental Investigations on the Flow Dynamics and Abandonment Pressure for CO2 Sequestration and Oil Recovery in Artificially Fractured Cores. J. Can. Pet. Technol. 2010, 49, 22–27. [Google Scholar] [CrossRef]
  7. Moritis, G. Worldwide EOR Survey. Oil Gas. J. 2000, 98, 39–61. [Google Scholar]
  8. Moritis, G. Enhanced Oil Recovery. Oil Gas. J. 2002, 100, 43–47. [Google Scholar]
  9. Shaw, J.; Bachu, S. Screening, Evaluation, and Ranking of Oil Reservoirs Suitable for CO2-Flood EOR and Carbon Dioxide Sequestration. J. Can. Pet. Technol. 2002, 41. [Google Scholar] [CrossRef]
  10. Bachu, S.; Stewart, S. Geological Sequestration of Anthropogenic Carbon Dioxide in the Western Canada Sedimentary Basin: Suitability Analysis. J. Can. Pet. Technol. 2002, 41, 32–40. [Google Scholar] [CrossRef]
  11. Malik, Q.M.; Islam, M.R. CO2 Injection in the Weyburn Field of Canada: Optimization of Enhanced Oil Recovery and Greenhouse Gas Storage with Horizontal Wells. In SPE/DOE Improved Oil Recovery Symposium; Society of Petroleum Engineers: Tulsa, OK, USA, 2000. [Google Scholar]
  12. Rossen, W.R. Foams in Enhanced Oil Recovery. In Foams; Informa UK Limited: New York, NY, USA, 2017; pp. 413–464. [Google Scholar]
  13. Pope, G.; Lake, L.; Schechter, R. Annex 2: Reservoir Characterization and Enhanced Oil Recovery Research; Office of Scientific and Technical Information (OSTI): Austin, TX, USA, 1989. [Google Scholar]
  14. Alkan, H.; Goktekin, A.; Satman, A. A Laboratory Study of CO2-Foam Process for Bati Raman Field, Turkey; Society of Petroleum Engineers: San Antonio, TX, USA, 1991. [Google Scholar]
  15. Haugen, Å.; Fernø, M.A.; Graue, A.; Bertin, H.J. Experimental Study of Foam Flow in Fractured Oil-Wet Limestone for Enhanced Oil Recovery. SPE Reserv. Eval. Eng. 2012, 15, 218–228. [Google Scholar] [CrossRef]
  16. Henry, R.L.; Fisher, D.R.; Pennell, S.P.; Honnert, M.A. Field test of foam to reduce CO2 cycling. In SPE/DOE Improved Oil Recovery Symposium; Society of Petroleum Engineers: Tulsa, OK, USA, 1996. [Google Scholar]
  17. Holm, L.; Garrison, W.H. CO2 Diversion With Foam in an Immiscible CO2 Field Project. SPE Reserv. Eng. 1988, 3, 112–118. [Google Scholar] [CrossRef]
  18. Stevens, J.E.; Harpole, K.J.; Zornes, D.R.; Martin, F.D. CO2 Foam Field Verification Pilot Test at EVGSAU: Phase II—Foam Injection Design and Operating Plan. In SPE Annual Technical Conference and Exhibition; Society of Petroleum Engineers: Washington, DC, USA, 1992. [Google Scholar]
  19. Sanders, A.W.; Jones, R.M.; Rabie, A.; Putra, E.; Linroth, M.A.; Nguyen, Q.P. Implementation of a CO2 Foam Pilot Study in the SACROC Field: Performance Evaluation. In Proceedings of the SPE Annual Technical Conference and Exhibition, Society of Petroleum Engineers (SPE), San Antonio, TX, USA, 8–10 October 2012. [Google Scholar]
  20. Farajzadeh, R.; Andrianov, A.; Zitha, P.L.J. Investigation of Immiscible and Miscible Foam for Enhancing Oil Recovery. Ind. Eng. Chem. Res. 2010, 49, 1910–1919. [Google Scholar] [CrossRef]
  21. Haugen, Å.; Mani, N.; Svenningsen, S.; Brattekås, B.; Graue, A.; Ersland, G.; Fernø, M.A. Miscible and Immiscible Foam Injection for Mobility Control and EOR in Fractured Oil-Wet Carbonate Rocks. Transp. Porous Media 2014, 104, 109–131. [Google Scholar] [CrossRef]
  22. Chaturvedi, K.R.; Kumar, R.; Trivedi, J.J.; Sheng, J.J.; Sharma, T. Stable Silica Nanofluids of an Oilfield Polymer for Enhanced CO2 Absorption for Oilfield Applications. Energy Fuels 2018, 32, 12730–12741. [Google Scholar] [CrossRef]
  23. Chaturvedi, K.R.; Trivedi, J.; Sharma, T. Single-step silica nanofluid for improved carbon dioxide flow and reduced formation damage in porous media for carbon utilization. Energy 2020, 197, 117276. [Google Scholar] [CrossRef]
  24. Nikolov, A.D.; Wasan, D.T.; Huang, D.W.; Edwards, D.A. The Effect of Oil on Foam Stability: Mechanisms and Implications for Oil Displacement by Foam in Porous Media. In SPE Annual Technical Conference and Exhibition; Society of Petroleum Engineers: New Orleans, LA, USA, 1986. [Google Scholar]
  25. Li, R.F.; Yan, W.; Liu, S.; Hirasaki, G.; Miller, C.A. Foam Mobility Control for Surfactant Enhanced Oil Recovery. SPE J. 2010, 15, 928–942. [Google Scholar] [CrossRef] [Green Version]
  26. Simjoo, M.; Dong, Y.; Andrianov, A.; Talanana, M.; Zitha, P.L. A CT Scan Study of Immiscible Foam Flow in Porous Media for EOR. In Proceedings of the SPE EOR Conference at Oil and Gas West Asia, Society of Petroleum Engineers (SPE), Muscat, Oman, 16–18 April 2012. [Google Scholar]
  27. Ashoori, E.; Marchesin, D.; Rossen, W.R. Multiple Foam States and Long-Distance Foam Propagation in EOR Displacements. SPE J. 2012, 17, 1–231. [Google Scholar] [CrossRef]
  28. Telmadarreie, A.; Trivedi, J. Post-Surfactant CO2 Foam/Polymer-Enhanced Foam Flooding for Heavy Oil Recovery: Pore-Scale Visualization in Fractured Micromodel. Transp. Porous Media 2016, 113, 717–733. [Google Scholar] [CrossRef]
  29. Telmadarreie, A.; Trivedi, J.J. New Insight on Carbonate-Heavy-Oil Recovery: Pore-Scale Mechanisms of Post-Solvent Carbon Dioxide Foam/Polymer-Enhanced-Foam Flooding. SPE J. 2016, 21, 1655–1668. [Google Scholar] [CrossRef]
  30. Telmadarreie, A.; Trivedi, J. Evaluation of foam generated with the hydrocarbon solvent for extra-heavy oil recovery from fractured porous media: Pore-scale visualization. J. Pet. Sci. Eng. 2017, 157, 1170–1178. [Google Scholar] [CrossRef]
  31. Samuel, S.R.; Kuru, E.; Trivedi, J.J. Design and Development of Aqueous Colloidal Gas Aphrons for Enhanced Oil Recovery Applications. In SPE Symposium on Improved Oil Recovery; Society of Petroleum Engineers: Tulsa, OK, USA, 2012. [Google Scholar]
  32. Telmadarreie, A.; Doda, A.; Trivedi, J.J.; Kuru, E.; Choi, P. CO2 Microbubbles -A Potential Fluid for Enhanced Oil Recovery: Bulk and Porous Media Studies. J. Pet. Sci. Eng. 2016, 138, 160–173. [Google Scholar] [CrossRef]
  33. Dai, Z.; Middleton, R.; Viswanathan, H.S.; Fessenden-Rahn, J.; Bauman, J.; Pawar, R.; Lee, S.-Y.; McPherson, B. An Integrated Framework for Optimizing CO2 Sequestration and Enhanced Oil Recovery. Environ. Sci. Technol. Lett. 2013, 1, 49–54. [Google Scholar] [CrossRef]
  34. Ghomian, Y.; Pope, G.; Sepehrnoori, K. Hysteresis and Field-Scale Optimization of WAG Injection for Coupled CO2-EOR and Sequestration. In SPE Symposium on Improved Oil Recovery; Society of Petroleum Engineers: Tulsa, OK, USA, 2008. [Google Scholar]
  35. Telmadarreie, A.; Trivedi, J.J. Insight on Foam/Polymer Enhanced Foam Flooding for Improving Heavy Oil Sweep Efficiency; World Heavy Oil Congress: Edmonton, AB, Canada, 2015. [Google Scholar]
  36. Telmadarreie, A.; Trivedi, J. Static and Dynamic Performance of Wet Foam and Polymer-Enhanced Foam in the Presence of Heavy Oil. Colloids Interfaces 2018, 2, 38. [Google Scholar] [CrossRef] [Green Version]
Figure 1. Images of rock samples used in this study. (a) Left: sandstone rock sample having a relatively homogeneous matrix. (b) Right: carbonate rock sample with heterogeneous matrix and vuggy porosity.
Energies 13 05735 g001
Figure 2. Schematic of the foam generator used for pre-generated foam/PEF (polymer enhanced foam) injection.
Energies 13 05735 g002
Figure 3. (a) Schematic of coreflood system used in this study, (b) image of the injection port, and (c) rubber sleeves with pressure taps for pressure measurement along the rock length.
Energies 13 05735 g003
Figure 4. Bulk foamability and stability (half-life) of foam and polymer enhanced foam (PEF) in the presence and the absence of heavy crude oil.
Energies 13 05735 g004
Figure 5. CO2 PEF showed higher injection pressure and higher/faster oil recovery compared to CO2 foam injection. (a) Pressure profile in the water-saturated porous medium, (b) pressure profile and oil cut in oil-saturated medium (after waterflood), and (c) oil recovery profile of CO2 foam and CO2 PEF. Oil cut is defined as the percentage of oil produced relative to total fluid produced at a given time. The vertical line shows the start of foam/PEF injection.
Energies 13 05735 g005
Figure 6. Pressure drop and water cut during water flooding in homogeneous (a) and fractured (b) rock samples.
Energies 13 05735 g006
Figure 7. Higher oil cut and higher pressure at different sections of rock sample showed the better performance of PEF compared to that of foam. (a) CO2 foam and (b) CO2 PEF. The length of sections #1, #2 and #3 are 5 cm (see Figure 3a).
Energies 13 05735 g007
Figure 8. Overall pressure drop and oil cut profile during CO2 foam and CO2 PEF injection in the fractured sandstone rock sample. No significant pressure (i.e., apparent viscosity) was observed in the fractured rock.
Energies 13 05735 g008
Figure 9. Higher apparent viscosity and better sweep efficiency of PEF than that of foam. (a) CO2 foam/PEF apparent viscosity profiles in water-saturated and oil-saturated sandpack, and (b) images of sandpack during CO2 foam/PEF injection showing sweep efficiency. The black color shows the oil-saturated area and the white zone shows the swept area by foam/PEF.
Energies 13 05735 g009
Figure 10. Oil recovery profile during waterflood, CO2 foam/PEF flood in homogenous, and fractured rock samples. The dashed line marks the start of each fluid injection.
Energies 13 05735 g010
Figure 11. CO2 PEF resulted in more oil recovery and more CO2 storage than that of CO2 foam (a). Ultimate oil recovery values for all experiments after waterflooding, foam/PEF injection, and extended water flood (EWF), and (b) amount of CO2 gas (% of PV) remaining inside the porous media at the end of CO2 foam/PEF injection and extended waterflood process. Some experiments were repeated, and the data agreed with 5% error. SST: sandstone, Carb.: carbonate.
Energies 13 05735 g011
Table 1. Summary of rock properties and injection parameters.
EOR MethodRock TypeFracturedMatrix Ø (%)Matrix K (D)Flow Rates (cc/min)µoil (cp)Soi **
qlqg
CO2 FoamSandstoneNo24.30.270.25167082.7
CO2 PEFSandstoneNo23.60.220.25167082.2
CO2 FoamSandstoneYes24.40.25 *0.25167076.7
CO2 PEFSandstoneYes24.10.25 *0.25167070.8
CO2 PEFCarbonateYes200.2 *0.25167070
* average matrix permeability. Ø: Porosity, K: permeability (D: Darcy). ** Soi: initial oil saturation. cc/min: cubic centimeter per minute.
Publisher’s Note: MDPI stays neutral with regard to jurisdictional claims in published maps and institutional affiliations.