Article

Assessment of the Damage from Hydrogen Pipeline Explosions on People and Buildings

1
Department of Chemical Engineering, Materials and Environment, Sapienza University of Rome, via Eudossiana 18, 00184 Rome, Italy
2
Department of Structures for Engineering and Architecture, University of Naples Federico II, via Claudio 21, 80125 Naples, Italy
*
Author to whom correspondence should be addressed.
Energies 2020, 13(19), 5051; https://doi.org/10.3390/en13195051
Submission received: 2 August 2020 / Revised: 3 September 2020 / Accepted: 12 September 2020 / Published: 25 September 2020
(This article belongs to the Section A5: Hydrogen Energy)

Abstract

:
Failure of a pipeline carrying gaseous hydrogen can have several effects, some of which can pose a significant threat of harm to people and damage to buildings in its immediate proximity. This paper presents a probabilistic risk assessment procedure for the estimation of damage to people and buildings endangered by high-pressure hydrogen pipeline explosions. Such a procedure provides an evaluation of annual probability of damage to people and buildings under an extreme event using a combination of the conditional probability of damage triggered by an explosion and the probability that the explosion occurs as a consequence of the pipeline failure. The release of hydrogen is simulated using the LimitState:SLAB model and the size of the hydrogen-air cloud in the flammability range is evaluated, then overpressure and impulse generated by the blast are evaluated through the Netherland Organization for Applied Scientific Research (TNO) model, while explosion effects on people and buildings are estimated through Probit equations and pressure–impulse diagrams. As for people, both direct and indirect effects of overpressure events are taken into account. For buildings, a comparison of the damage to different types of buildings (i.e., buildings made of reinforced concrete and buildings of tuff stone masonry) is also made. The probabilistic procedure presented may be used for designing a new hydrogen pipeline network and will be an advantageous tool for safe management of H2 gas pipelines.

1. Introduction

The growing demand for energy and the depletion of traditional energy sources, added to the need for increasing sustainable development in order to reduce environmental pollution, have made hydrogen a possible protagonist in today’s society. Hydrogen represents an inexhaustible source as an energy carrier, since it can stem from a variety of sources, both traditional and alternative ones. In addition, hydrogen plays a key role for sustainable development due to the fact that its combustion does not produce any pollution agents, especially greenhouse gases that lead to an increase in global temperature.
Regarding hydrogen and its production, the production plant distribution in the world is shown in Table 1 [1]. Medium and large plants are distributed in several countries, with a maximum capacity of 290,000 Nm3/h in a Californian plant, and serve various type of industries (i.e., chemical, petrochemical, food, oil refining). Data reported in Table 1 refer to the existing and operating facilities (updated in January 2016), but more recently, investments in this alternative energy source have been spreading. Recently, Linde’s Global Hydrogen Business announced that they will construct a USD 250 million world-scale hydrogen plant in Louisiana, with a production capacity of over 190,000 Nm3/h, that is due to come on stream in 2021. The new plant will be part of Praxair’s hydrogen system in Louisiana [2]. Consistent investments have been made also in Europe over the last few years with an increase in the total production capacity from 17.799 million Nm3 in 2010 to 80.000 million Nm3 in 2017 [3]. In this framework, the rise of hydrogen production and its distribution network is expected to progressively extend the level of diffusion of this gas.
Large quantities of hydrogen from its production areas to its utilization areas are transported via dedicated pipelines. Worldwide, H2 pipelines reach a total length of 4542 km, most of which (2608 km) are located in the USA and (1598 km) in Europe, and only a small portion (337 km) in the rest of the world (data updated to 2016) [4]. Currently, H2 pipelines are mainly adjoined to industrial areas, so their breakage may cause significant risk to the surrounding environment and the people who will likely be nearby [5]. Therefore, the risks associated with a possible breakage of a pipeline carrying gaseous hydrogen must be taken into careful consideration. Dry hydrogen, acetylene, and occasionally other gases often ignite when they are discharged into air in normal weather. Apparently, the electric field that develops by ejection of these charged gases can develop enough of a potential gradient to cause ignition by corona discharge; it has to be noted that the minimum ignition energy of hydrogen is only about 0.02 mJ. Consequences of gaseous hydrogen pipeline accidents can cause rather serious damage to people and buildings located in proximity of the pipeline involved in the hazard.
Following an accidental release of gas, a flammable cloud of gas is formed that mixes with air and can be immediately ignited giving a jet flame, or later generating either a flash fire or an explosion. In a fire, the worst hazard for people and buildings is the direct contact with flames and thermal radiation, while in the case of an explosion it is the impact of the blast wave [6,7]. From the analysis of the pre-existing literature, the most likely consequence of a pipeline failure is an explosion [8].
In previous works [9,10], a procedure was proposed to assess the potential direct damage to building structures caused by gas explosions released by high-pressure pipelines. This procedure has been applied to both natural gas and hydrogen pipelines. The probability of occurrence of an explosion event as a result of a pipeline breakage has been estimated, and the consequences of the explosion (overpressure and impulse) have been evaluated. To characterize the hydrogen release, a one-dimensional integral model, SLAB [11], was used. SLAB is a computer program to simulate the atmospheric dispersion model of gas releases, taking several external factors into account, including temperature, humidity, atmospheric stability, wind velocity, and surface roughness. A release rate model was combined with this dispersion model, and then the characteristics of the resulting hydrogen cloud explosion (i.e., peak overpressure and impulse) are calculated by means of the multi-energy method developed by TNO (Netherlands Organization for Applied Scientific Research) [12]. Explosion damage to building structures has been assessed using pressure-impulse diagrams that describe the ability of structural components to withstand various types of explosion loads, defined as blast capacity.
In this work, the same procedure is applied to estimate harm to people as well as the direct structural damage associated with high-pressure hydrogen pipeline explosions. Specifically, the analysis refers to transmission and gathering pipelines located in industrial and rural areas. For people, both direct and indirect effects of blasts are considered in order to evaluate the annual probability of damage [7]. As a main direct effect, the damage to pressure-sensitive organs, such as lungs and ears, due to the sudden increase in pressure is considered. Among indirect effects, both the impact to the head and the whole body due to whole-body displacement are observed. During the whole-body displacement, in fact, the overpressure and impulse of the explosion interact with the body in such a way as to essentially pick it up and translate it. In contrast, the damage due to flying fragments hitting someone’s body and those owing to the impact caused by a collapsed structure onto people inside buildings is not evaluated. With regard to building structures, direct damage from an explosion can be of various kinds, such as deflection of structural steel frames, collapse of roofs, leveling of walls, shattering of panels, and broken windows. Specifically, direct damage to both reinforced concrete (RC) columns and walls of load-bearing masonry buildings are examined. What is finally evaluated is a minimum safety distance between hydrogen pipelines and people. The presented procedure can be applied for the design and risk assessment of new pipeline networks in industrial or rural areas and for existing building assets.

2. Methodology

2.1. Blast Hazard

The methodology used in the present work, and reported in detail elsewhere [9,10], consists of the following steps:
  • simulation of the jet release of hydrogen and estimation of the size of flammable H2–air clouds using the SLAB model integrated with a model for release rate;
  • calculation of the explosion energy and of the consequent explosion characteristics (i.e., peak overpressure and impulse) using the TNO multi-energy method [12]; and
  • estimation of the blast hazard function, Pr[E|R], defined as the probability of an explosion E occurring in the case of a rupture R of the pipeline.
A C++ program was developed and integrated with the one-dimensional SLAB model. The C++ code integrates a model for jet release rate (see Equations (1) and (2)) with pipeline operation properties, source release properties, and site. The release rate was estimated by assuming sonic flow through a high-pressure pipeline nozzle and steady state conditions, as follows:
Q = π d 2 α 4 γ ρ 0 P 0 ( 2 γ + 1 ) γ + 1 γ 1 1 + ( 4 2 f F L d ) ( 2 γ + 1 ) 2 γ 1
where α is the ratio of the effective area of the hole to the area of the pipe section, d is the pipeline diameter, ρ0 is the density at stagnant conditions and P0 is the gas pressure at operating conditions, γ is the specific heat ratio of gas, fF is the Fanning friction factor, and L is the length of the pipeline from the compression station to the rupture point.
To take into account that hydrogen is at high pressure, the Abel–Noble equation of state (Equation (2)) for real gas was considered in Equation (1):
z = 1 + b ρ 0 R H 2 T
where z is the compressibility factor, b is the co-volume (7.69 × 10⁻³ m3/kg), RH2 is the ratio of R the universal gas constant to the hydrogen molecular mass (4124.24 J/kg/K), and T is the temperature.
The spread of a gas cloud in the atmosphere is strongly influenced by wind conditions, which change with altitude. Vertical wind profiles can be determined as a function of the so-called stability categories depending on the temperature conditions. As an example, Pasquill suggested the categories A, B, and C for unstable, D for neutral, and E and F for stable conditions [13]. While under stable conditions, vertical exchange is small and leads to a long-lasting downwind gas cloud, under unstable conditions, and a temperature gradient with altitude higher than the adiabatic one (−0.98 K/100 m), rapid exchange and effective turbulent diffusion occurs. This is especially true for hydrogen, which under stable conditions behaves as if it were unstable. A large cloud of hydrogen gas with minimal internal turbulence, on a cold and wet day with high wind speed (i.e., 2 m/s) and strong atmospheric stability (i.e., class F) would be the worst-case scenario.
The calculated release rate is then used as the input to SLAB. SLAB is a computer model that describes gas dispersion in the atmosphere following a release [11]. The model assumes that the concentration profile of the released gas has a Gaussian shape in the crosswind direction. The variations in the average concentrations in the downwind direction of the crosswind then determined using the conservation equations of mass, momentum, energy, and species only in the downwind direction. The main simulation output is the time-averaged concentration, expressed as a volume fraction, in the downwind direction. SLAB takes into account the atmospheric conditions and the turbulence generated by mixing the gas with the air. Unfortunately, it cannot simulate the flow of gas around obstacles or over complex terrain. As an advantage, compared to a CFD model, this model requires much less computational cost.
The C++ program determines the size of the gas cloud corresponding to various pipeline operation properties, source release properties, and site characteristics.
The program then estimates for each gas cloud the peak overpressure and impulse caused by its explosion according to the TNO multi-energy method [12]. The equations corresponding to blast plots are integrated in the model in order to evaluate the peak overpressure Ps and the duration of positive phase tp from a family of equations (curves) that correlate a dimensionless overpressure to the scaled distance on the combustion energy. The 10 equations (corresponding to 10 curves of the TNO multi-energy graph) relate the overpressure and the time duration of the explosion with the distance from the explosion center. The positive impulse I is then calculated by integrating the overpressure variation over the positive phase duration. Here, the peak overpressure Ps and the positive impulse I at a given distance r from the center of the explosion are calculated for two explosive classes: 6 and 9.
The simulations were performed assuming various pipeline geometric characteristics and operating parameters (diameter, temperature, and pressure), various properties of the release source (e.g., hole diameter, distance from the compression station, and distance from the explosion center), different atmospheric conditions (e.g., wind speed and Pasquill–Gifford atmospheric stability class), and explosive class in the range of values shown in Table 2.
The blast probability was assessed using statistical data on the operating properties of pipelines for H2 transmission gathered from the available literature [14,15]. The information from Air Liquide [16] was used for the failure frequency of hydrogen pipelines per length of pipeline. The value was assumed to be 0.126/year per 1000 km. Finally, the data of the EGIG (European Gas Pipeline Incident Group) [17] were used to determine the frequency of the various dimensions of breaches. It was defined as follows: a small breach is one with a diameter of the hole (dhole) smaller than or equal to 0.02 m; a medium breach is one with the diameter of the hole larger than 0.02 m and smaller or equal to the diameter of the pipe; and rupture is when the diameter of the hole is larger than the pipe diameter. Referring to data shown in Table 2, one might assign small, medium, and rupture breaches with relative probabilities of 48%, 39%, and 13%, respectively.
In the simulations, a horizontal jet release was assumed as the worst-case scenario. The source material was at temperature of 200 K, evaluated by SLAB as a function of specific heat ratio, atmospheric pressure, operating pressure, and temperature, and at a height of 1 m, typical in industrial areas. A (extremely unstable), C (slightly stable), D (neutrally stable), and F (moderately stable) were considered as Pasquill atmospheric stability classes [13], and wind in parallel direction to the hydrogen jet with a speed of 2 and 5 m/s was assumed.
Two explosive classes (6 and 9) representing explosions with low and high ignition power, respectively, were considered according to [18]. In [18], experimental data available from large-scale experiments concerning hydrogen explosions were used to estimate the blast’s initial strength. In detail, for experiments without obstacles and with high ignition energy, the best fit with experimental points was obtained with the class 9, while for the experiments with obstacles and low ignition energies, the best fit was obtained with class 6.
The results of the simulations were classified into 17 classes for overpressure and 13 classes for impulse. Such explosion parameter values are utilized to estimate the harm to people (death and injuries) and to structural components of typical buildings: columns made of reinforced concrete and walls of tuff stone masonry.

2.2. Blast Damage to People

People involved in an explosion can suffer from harm due to the high level of overpressure. Several effects of overpressure and duration of the high-pressure (impulse) event on people must be taken into account. Direct and indirect effects are generally distinguished. On the one hand, pressure-sensitive organs (e.g., lungs and ears) can be damaged by a change in pressure [19]. On the other hand, a person can be indirectly involved in the explosion and suffer from indirect damage, such as the impact from flying fragments generated by structure damage or collapse. In addition, people can be thrown away from the overpressure, with a possible subsequent impact [20]. All these effects must be viewed in order to establish the risk to which a person may be exposed. Generally, a harm criterion is used to transform the consequences of an accident into a probability of harm to people [21]. For people, both damage in terms of either injury or fatality are considered.
The generally applied method to estimate the level of harm to people as a consequence of an explosion uses the Probit (Probability unit) functions, which characterize the dose–effect relationship [20,22,23]. A Probit Function transforms a dose (V) to a probability of injury or fatality. The Probit variable Y is evaluated through Equation (3) [23]:
Y = k 1 + k 2 l n V
where k1, k2 are empirical constants that reflect the specific hazard and V is the causative factor that represents the dose. To convert Probits to percentage, which is the probability of a specific damage, Equation (4) is used:
P e r c e n t a g e = 50 [ 1 + Y 5 | Y 5 | e r f ( | Y 5 | 2 ) ]
where erf is the error function. Probit functions are particularly useful in quantitative risk assessment (QRA) since they can provide harm probabilities for the range of accidents included in risk assessment. Table 3 lists the Probit equations used in this work to calculate both death and injury to people.
In particular, for deaths from lung hemorrhage, the correlation uses as the causative variable a combination of overpressure, impulse, and dynamic pressure (Pef) and mass of person [20]. For deaths from lung hemorrhage, an overpressure threshold value of 82.7–103.4 kPa [24] and an impulse threshold value of 180 kPa ms [25] are reported in the literature. For damage due to the whole-body displacement, the available correlation provides a probability of harm as a function of both the peak overpressure and the impulse [20]. Overpressure threshold values of 55.16 and 75.84 kPa, respectively, for deaths from head impact and whole-body impact are reported in [26,27,28] when people are knocked down by pressure waves. Finally, for impulse a threshold value of 370 kPa ms [25] is considered to cause 1% serious injury from displacement.
With regards to reversible damage, which only induces injuries, the most sensitive organ to pressure changes is the ear and the damage to hearing is brought about by the ear-drum rupture. The overpressure threshold value for ear-drum rupture is 13.8 kPa [24]. Flying fragments can also cause injuries, which depend on the size and weight of fragments, the impact velocity, and the location of the impact on a human body [20]. However, the lack of properly validated models makes it difficult to fully evaluate the impact of flying fragments on people [19].
Once the probability of fatalities and injuries for the various direct and indirect effects of the explosion has been evaluated, the annual probability of damage to people under the explosion event is then calculated. It is a combination of the conditional probability of damage given by an explosion, Pr[D|E], and the probability of occurrence of the explosion as a consequence of pipeline failure, Pr[E|R], and it is calculated as follows:
P r [ D ] = P r [ D | E ] P r [ E | R ] λ R
where D is the damage to people (death or injury); E is the explosion event; R is the pipeline rupture; λR is annual rate of pipeline rupture occurrence/year per 1000 km.
A value of 0.126/year per 1000 km in Equation (5) was used [16]. In the case of fatality, Pr[D|E] constitutes the cumulative probability of deaths from lung hemorrhage, head impact, and whole-body displacement.

2.3. Blast Damage to Structural Components

Pressure–impulse diagrams can be considered as capability models that allow safety assessments of structural systems under blast loading. A number of failure modes, such as flexural, shear, and flexural-shear mixed, can be taken into account. Pressure–impulse diagrams define the overpressure (Ps) and impulse (I) that combined cause a prescribed severity of structural damage. The destructive effect of a blast can be measured by means of different parameters, each of them referred to as a damage measure (DM). The choice of the best DM depends on the construction features of the structural element and its expected behavior up to a collapse.
After a DM is chosen and valued to define the structural damage level tolerated by the decision-maker(s), the pressure–impulse curve establishes the boundary conditions between safety and failure, accounting for three alternative types of structural response to blast loading: quasi-static, dynamic, and impulsive behavior modes. The former type of structural response occurs if blast loading is characterized by a pressure–time history with very long duration compared to the natural period of vibration of the structural element. In those conditions, failure takes place if Ps attains a critical pressure that turns out to be the horizontal asymptote of the pressure–impulse diagram. In contrast, blast loading is assumed to have an impulsive nature in the case of a very short duration. In such conditions, failure occurs if I reaches a critical impulse, which is the vertical asymptote of the pressure–impulse diagram. Conditions in between quasi-static and impulsive define a dynamic loading that produces a structural response, possibly resulting in mixed shear-flexural failure. This latter is observed if Ps and I delineate a point of the pressure–impulse curve. Given a damage (and hence performance) level of the structural component, pressure–impulse combinations that fall between the coordinate axes and the P–I diagram define the safety region under blast loading.
In this paper, pressure–impulse diagrams were utilized to take the dynamic performance of two distinct classes of structural elements into account: reinforced concrete (RC) columns of framed building structures and tuff stone masonry (TSM) load-bearing walls of old building structures.

2.3.1. RC Columns

The pressure–impulse diagrams for RC columns were evaluated by Parisi [28] on the basis of Monte Carlo simulations, considering uncertainties, material properties, geometry, and capacity modelling. The selected pressure–impulse curves are characterized by a uniform probability of exceeding a prescribed damage level, namely, minor damage, moderate damage, and near collapse. In this study, the median pressure–impulse curves corresponding to a near collapse condition were considered.
The reinforced concrete columns selected in this work are representative of those detected in gravity-load designed buildings. Considering Italian RC buildings after 1971, the following properties are assumed: concrete strength class C20/25, that is, a structural concrete with cylinder and cube characteristic compressive strengths equal, respectively, to 20 MPa and 25 MPa; steel type FeB44k, which is similar to steel type B450C considered in current building codes. In addition, all columns are supposed to have a squared cross section (300 × 300 mm2 in size), concrete cover c = 30 mm, steel ribbed rebar, and nominal height H = 3.00 m. This latter geometric property can be recognized as the inter-story height of most of Italian residential buildings.

2.3.2. TSM Load-Bearing Walls

Tuff stone masonry walls were chosen because they are the primary elements of ancient building structures, not only in Euro-Mediterranean countries but also in other regions of the world. The motivation behind their selection for this study was that TSM walls have a completely different behavior and resistance under blast loading, compared to RC columns. This is mostly a consequence of the following differences between TSM walls and RC columns: (i) unreinforced masonry with both tensile and compressive strengths considerably lower than those of concrete; (ii) RC columns with steel reinforcement capable of withstanding high tensile stresses; (iii) sensitivity of structural behavior and failure mode to axial loading; and (iv) different boundary conditions. Thus, TSM walls subjected to blast loading generally experience flexural out-of-plane collapse.
Tuff stone masonry walls with height hw = 3.00 m, transverse slenderness ratio λ = 10 (i.e., the ratio between height and thickness, tw, hence resulting in 300 mm), and axial load ratio α = 25% (i.e., the ratio between the average axial pressure due to gravity loads, Pv, and compressive strength of masonry, fm) were assumed. The material properties of the case-study masonry walls were as follows: material density ρ = 1360 kg/m3; Young’s modulus E = 2159 MPa; Poisson’s ratio ν = 0.25; and peak compressive strength fm = 3.96 MPa.
In this study, selected pressure–impulse curves numerically obtained by means of nonlinear time history analysis of nonlinear finite element models were selected according to a previous study [29].

3. Results and Discussions

The first results of the analysis are the peak overpressure and impulse values and their probability of occurrence during the explosion, Pr[E|R]. From a probabilistic point of view, the maximum overpressure and impulse values were respectively 507 kPa and 60,000 kPa ms, corresponding to explosive class 9. These maximum values fell to 36 kPa and 4500 kPa ms in the case of explosive class 6. Noticeably, the results are slightly influenced (differences below 10%) by the atmospheric conditions chosen for the simulations. Specifically, the stability class F with wind velocity of 2 m/s can be considered the worst-case scenario at which the higher probability to achieve the maximum pressure and impulse correspond. This was expected because if the weather conditions are not known or not specified, the maximum concentration can be assessed by selecting the atmospheric stability class and wind speed, which results in the worst-case scenario, i.e., the smallest values of the dispersion coefficients and the wind speed. The former occurs with stability class F while for wind speed the most common choice is a wind speed of 2 m/s.
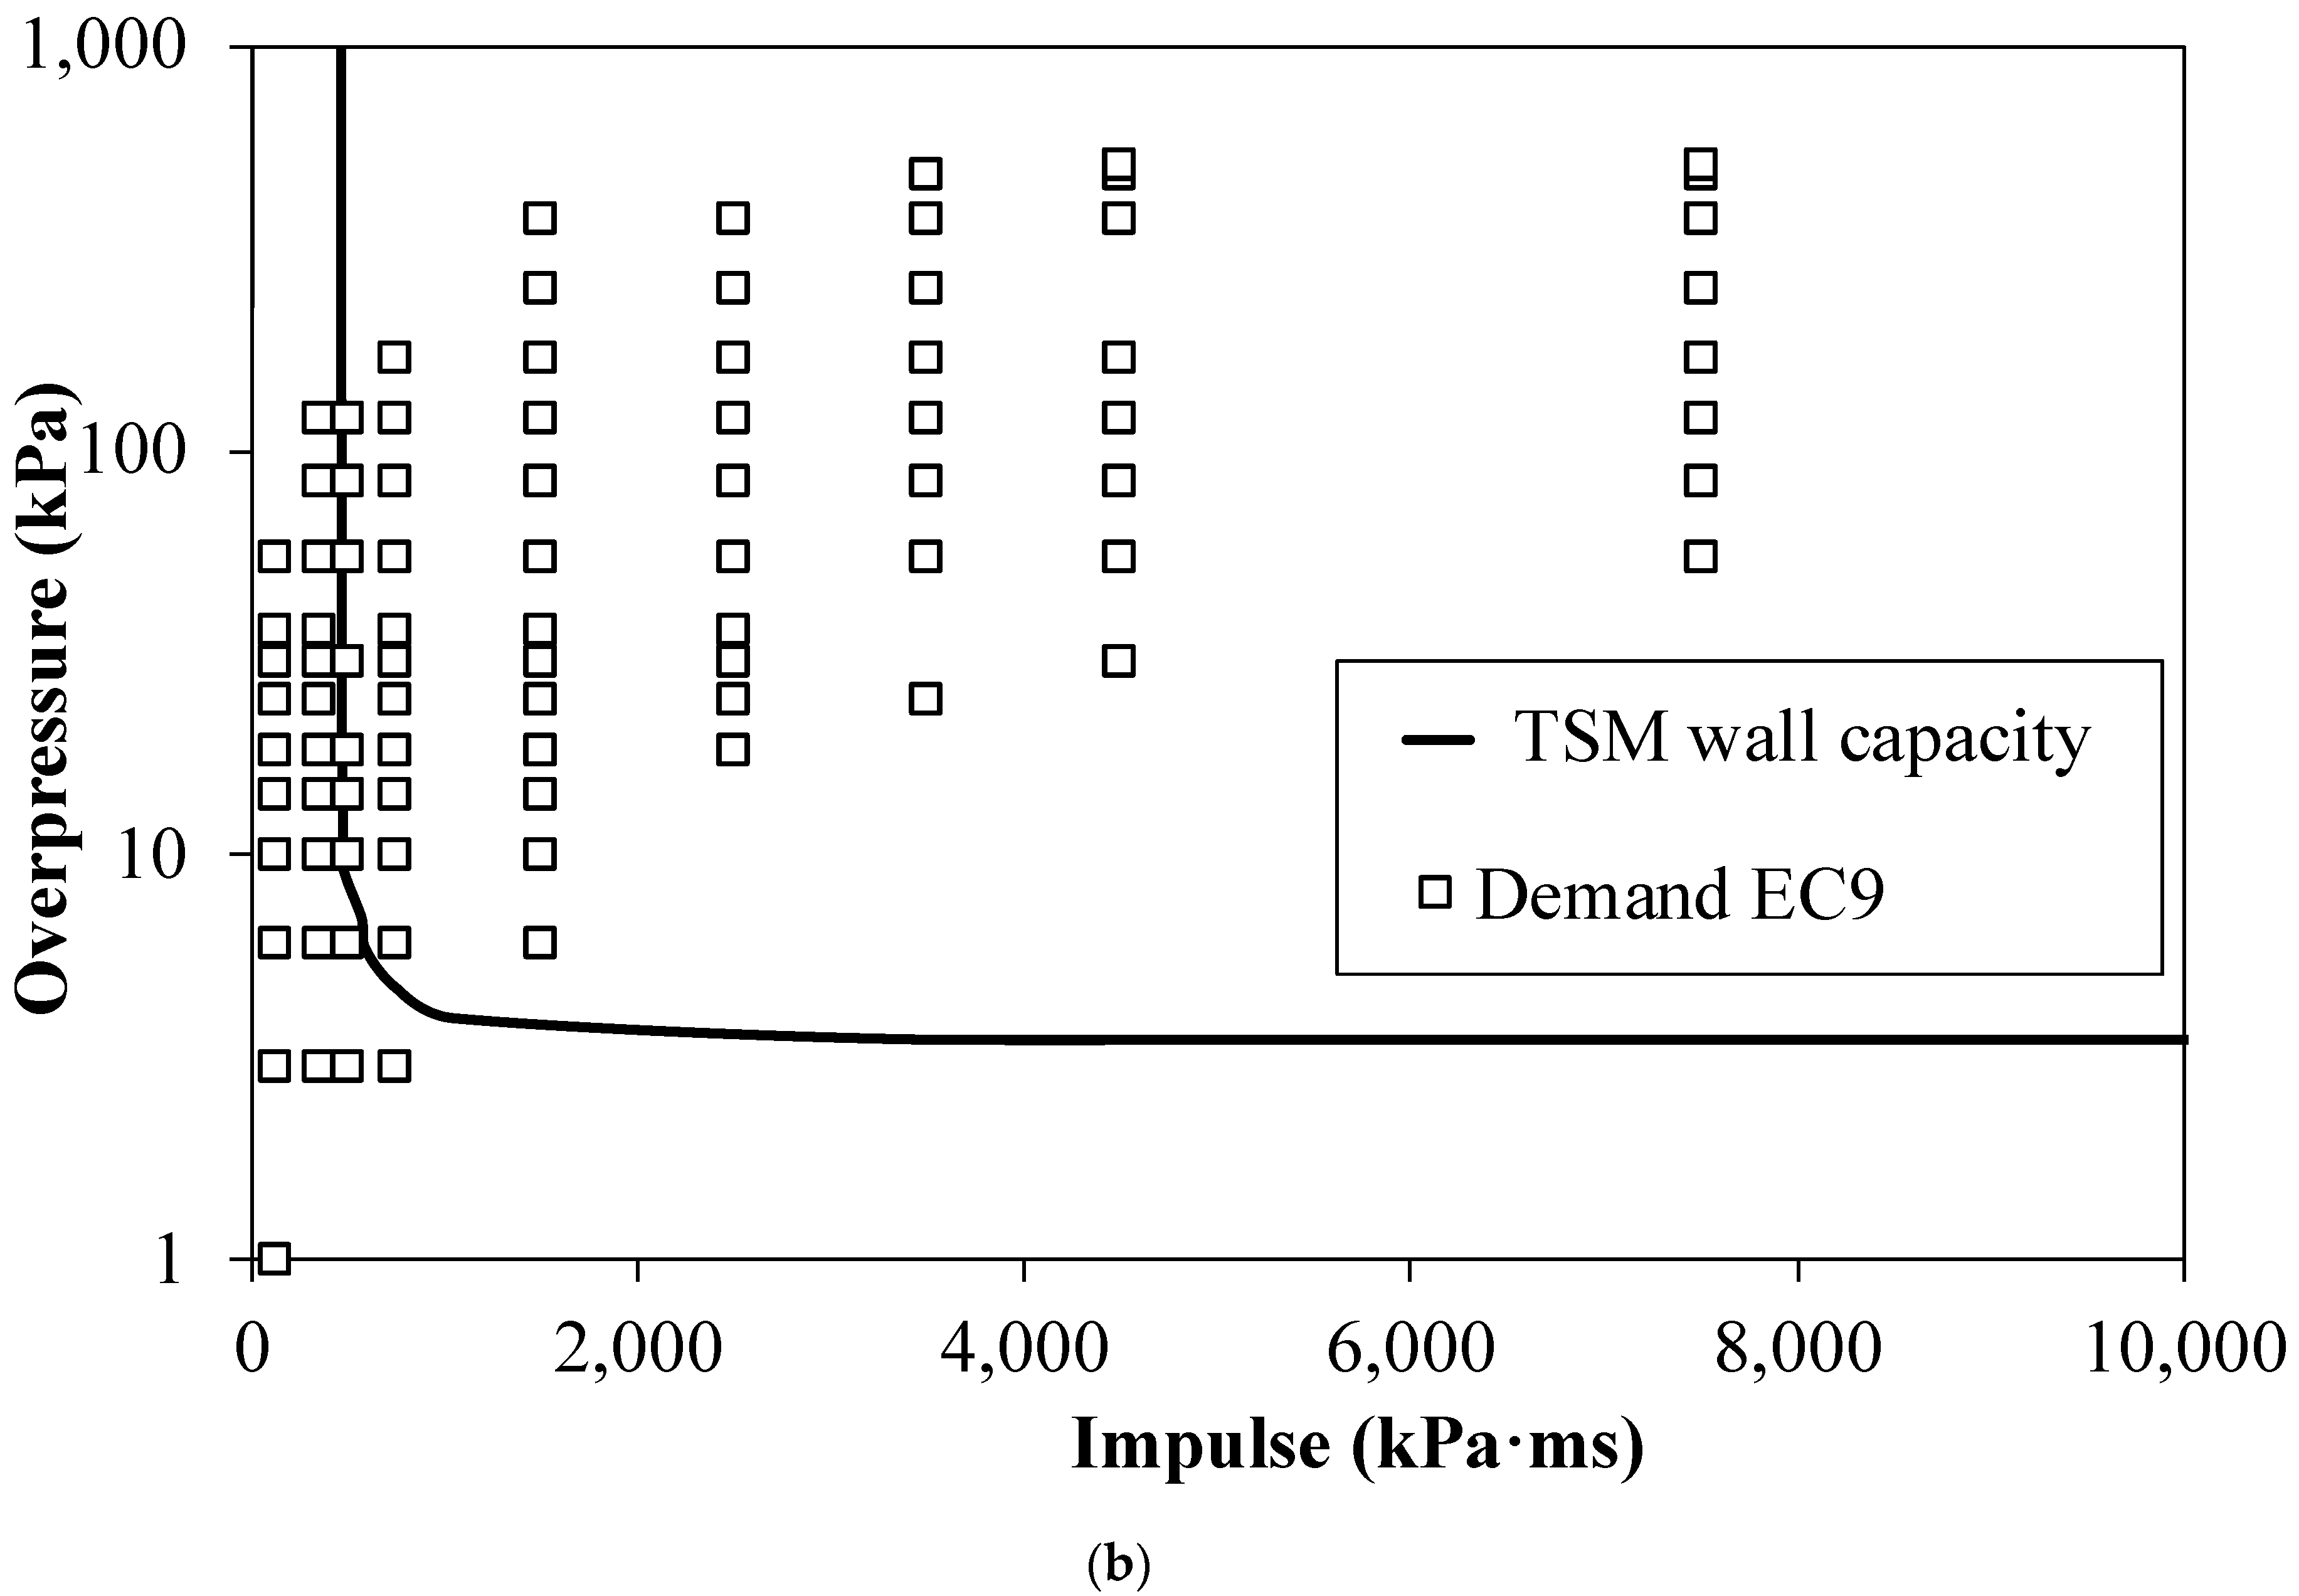
Therefore, in the following cases the results were reported just for this condition. Figure 1a,b show the pressure–impulse diagrams for the gravity-load RC columns and the TSM load-bearing walls, respectively. The individual points corresponding to the possible combination of pressure and impulse reached by an explosion are within. The designed reinforced concrete columns can be deemed safe against explosions of hydrogen for the worst-case scenario (explosive class 9 and atmospheric stability class F2) and hence for all the investigated explosive classes and atmospheric stability classes. On the contrary, TSM load-bearing walls show higher vulnerability to blast loading. Indeed, the asymptotic values of overpressure and impulse that define the blast capacity of those components are very low (i.e., 3.5 kPa and 455 kPa ms) [30].
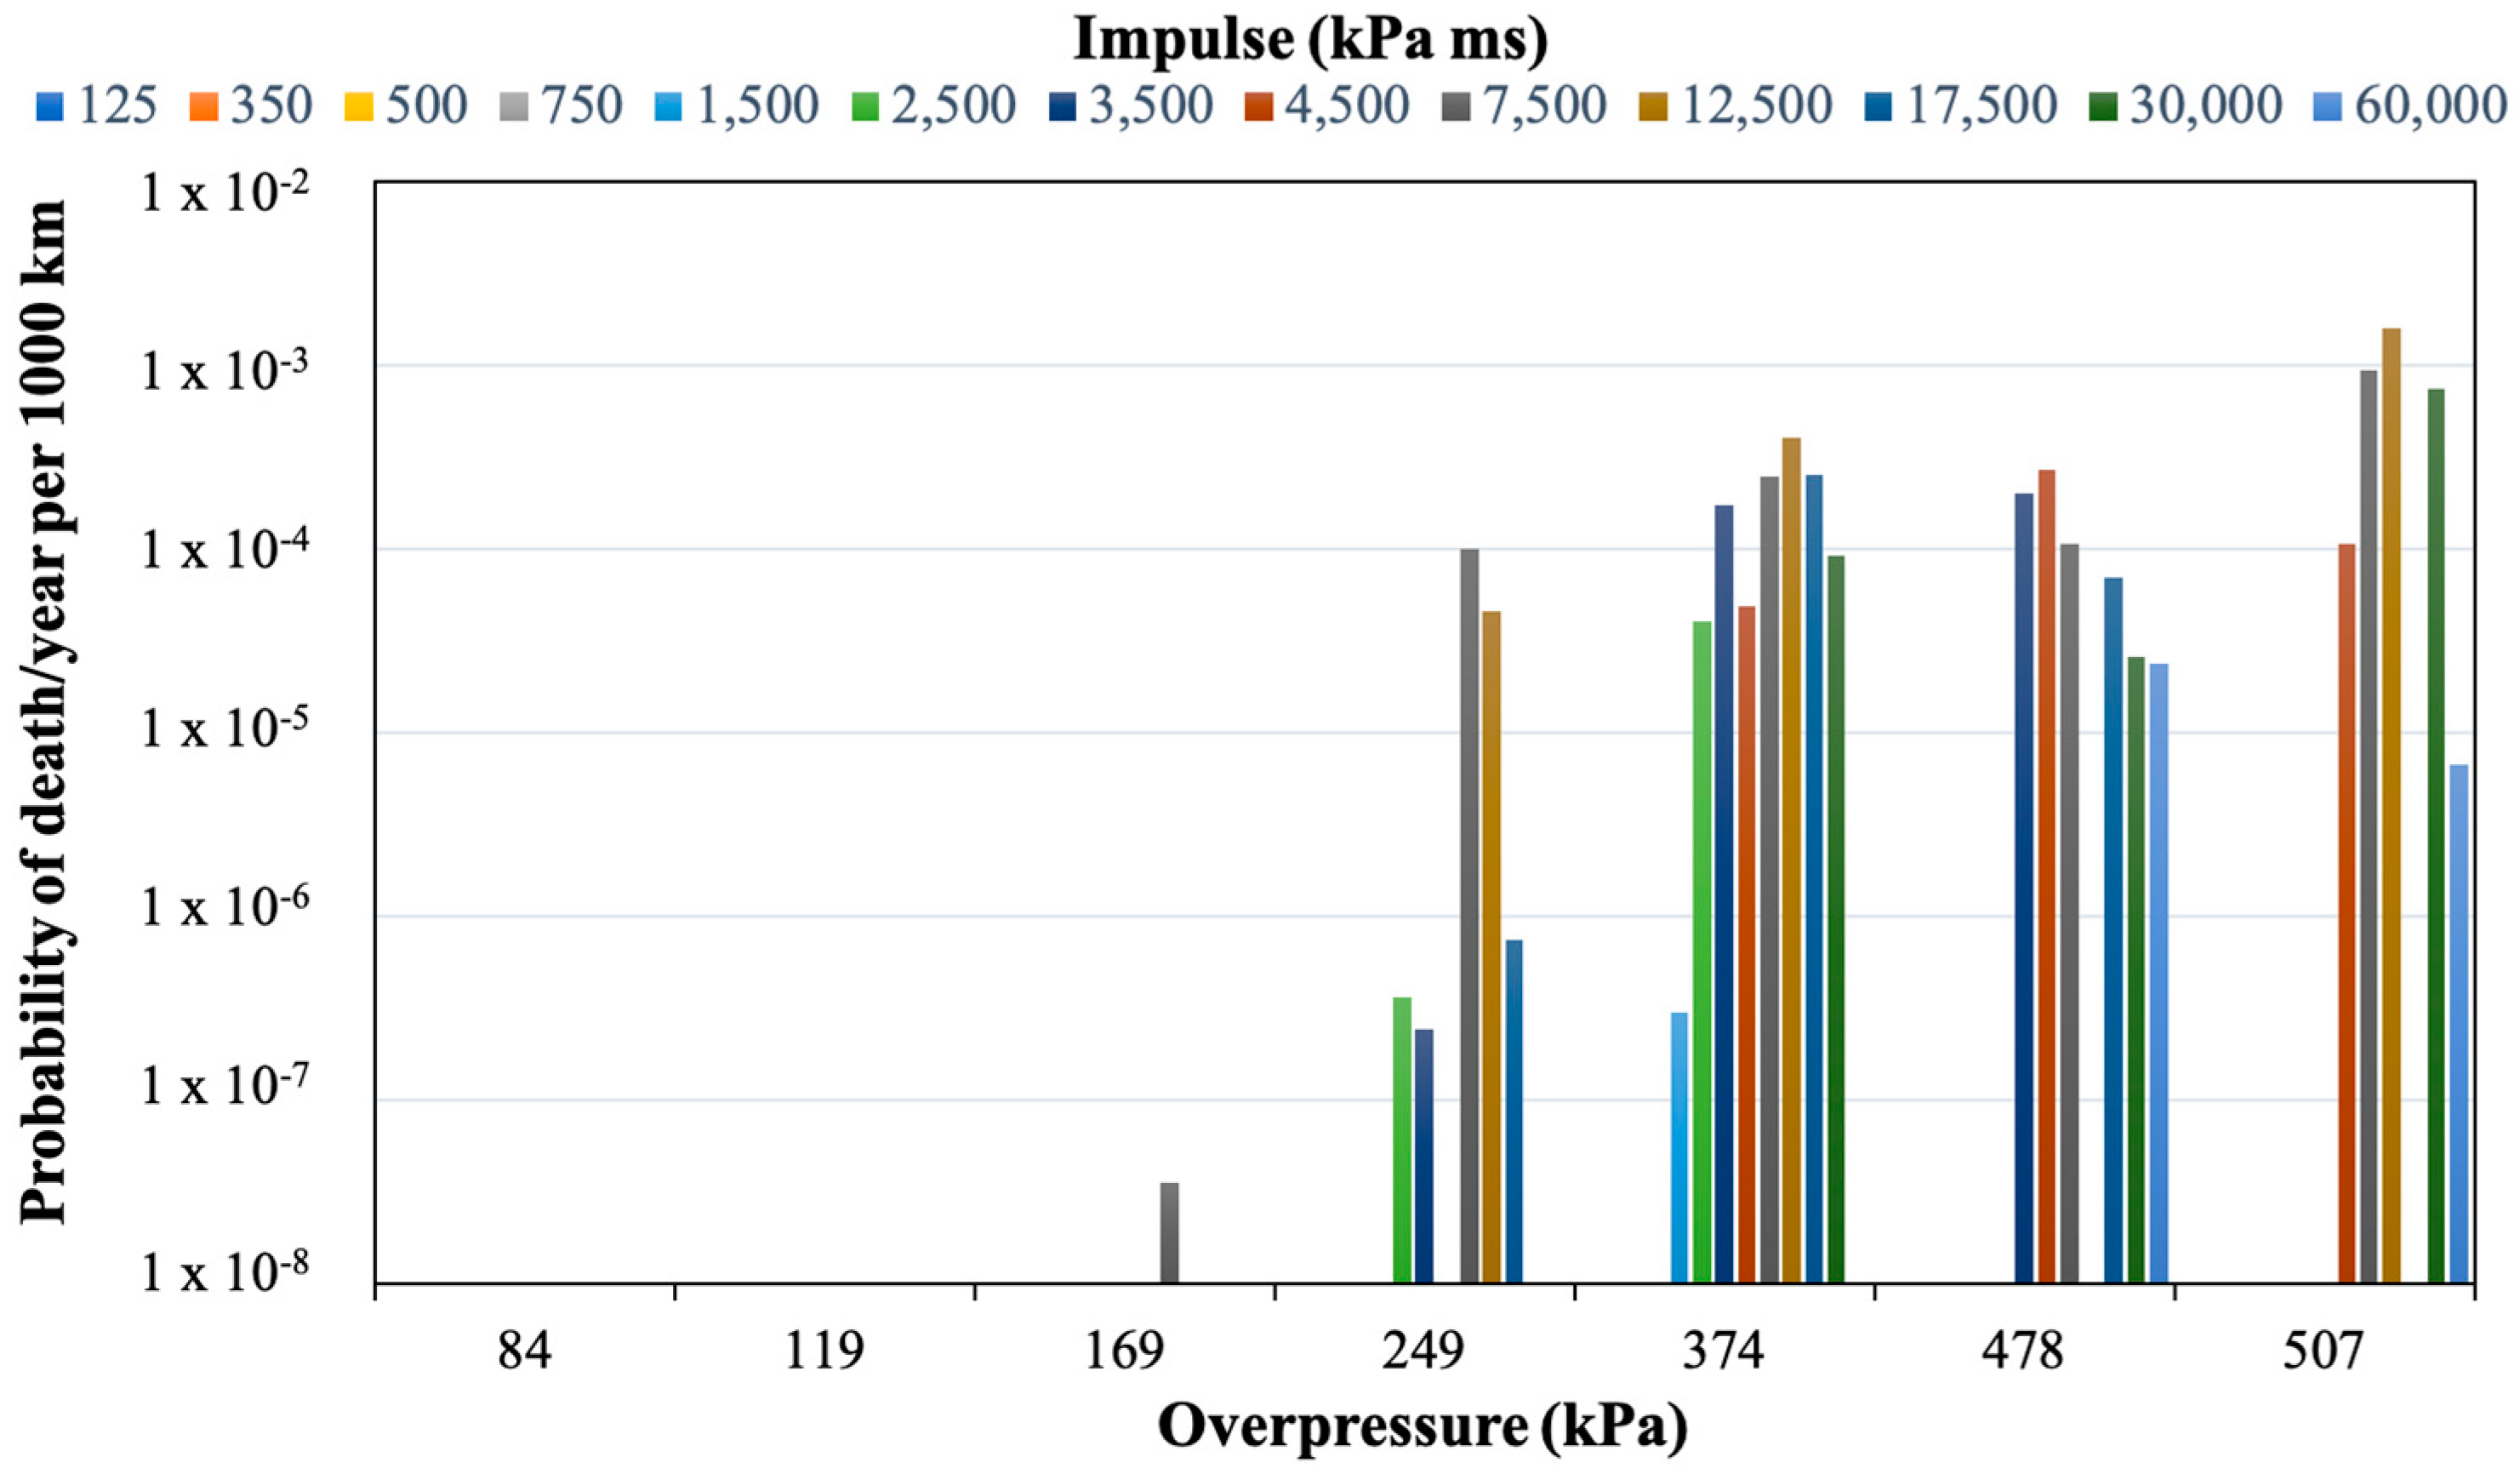
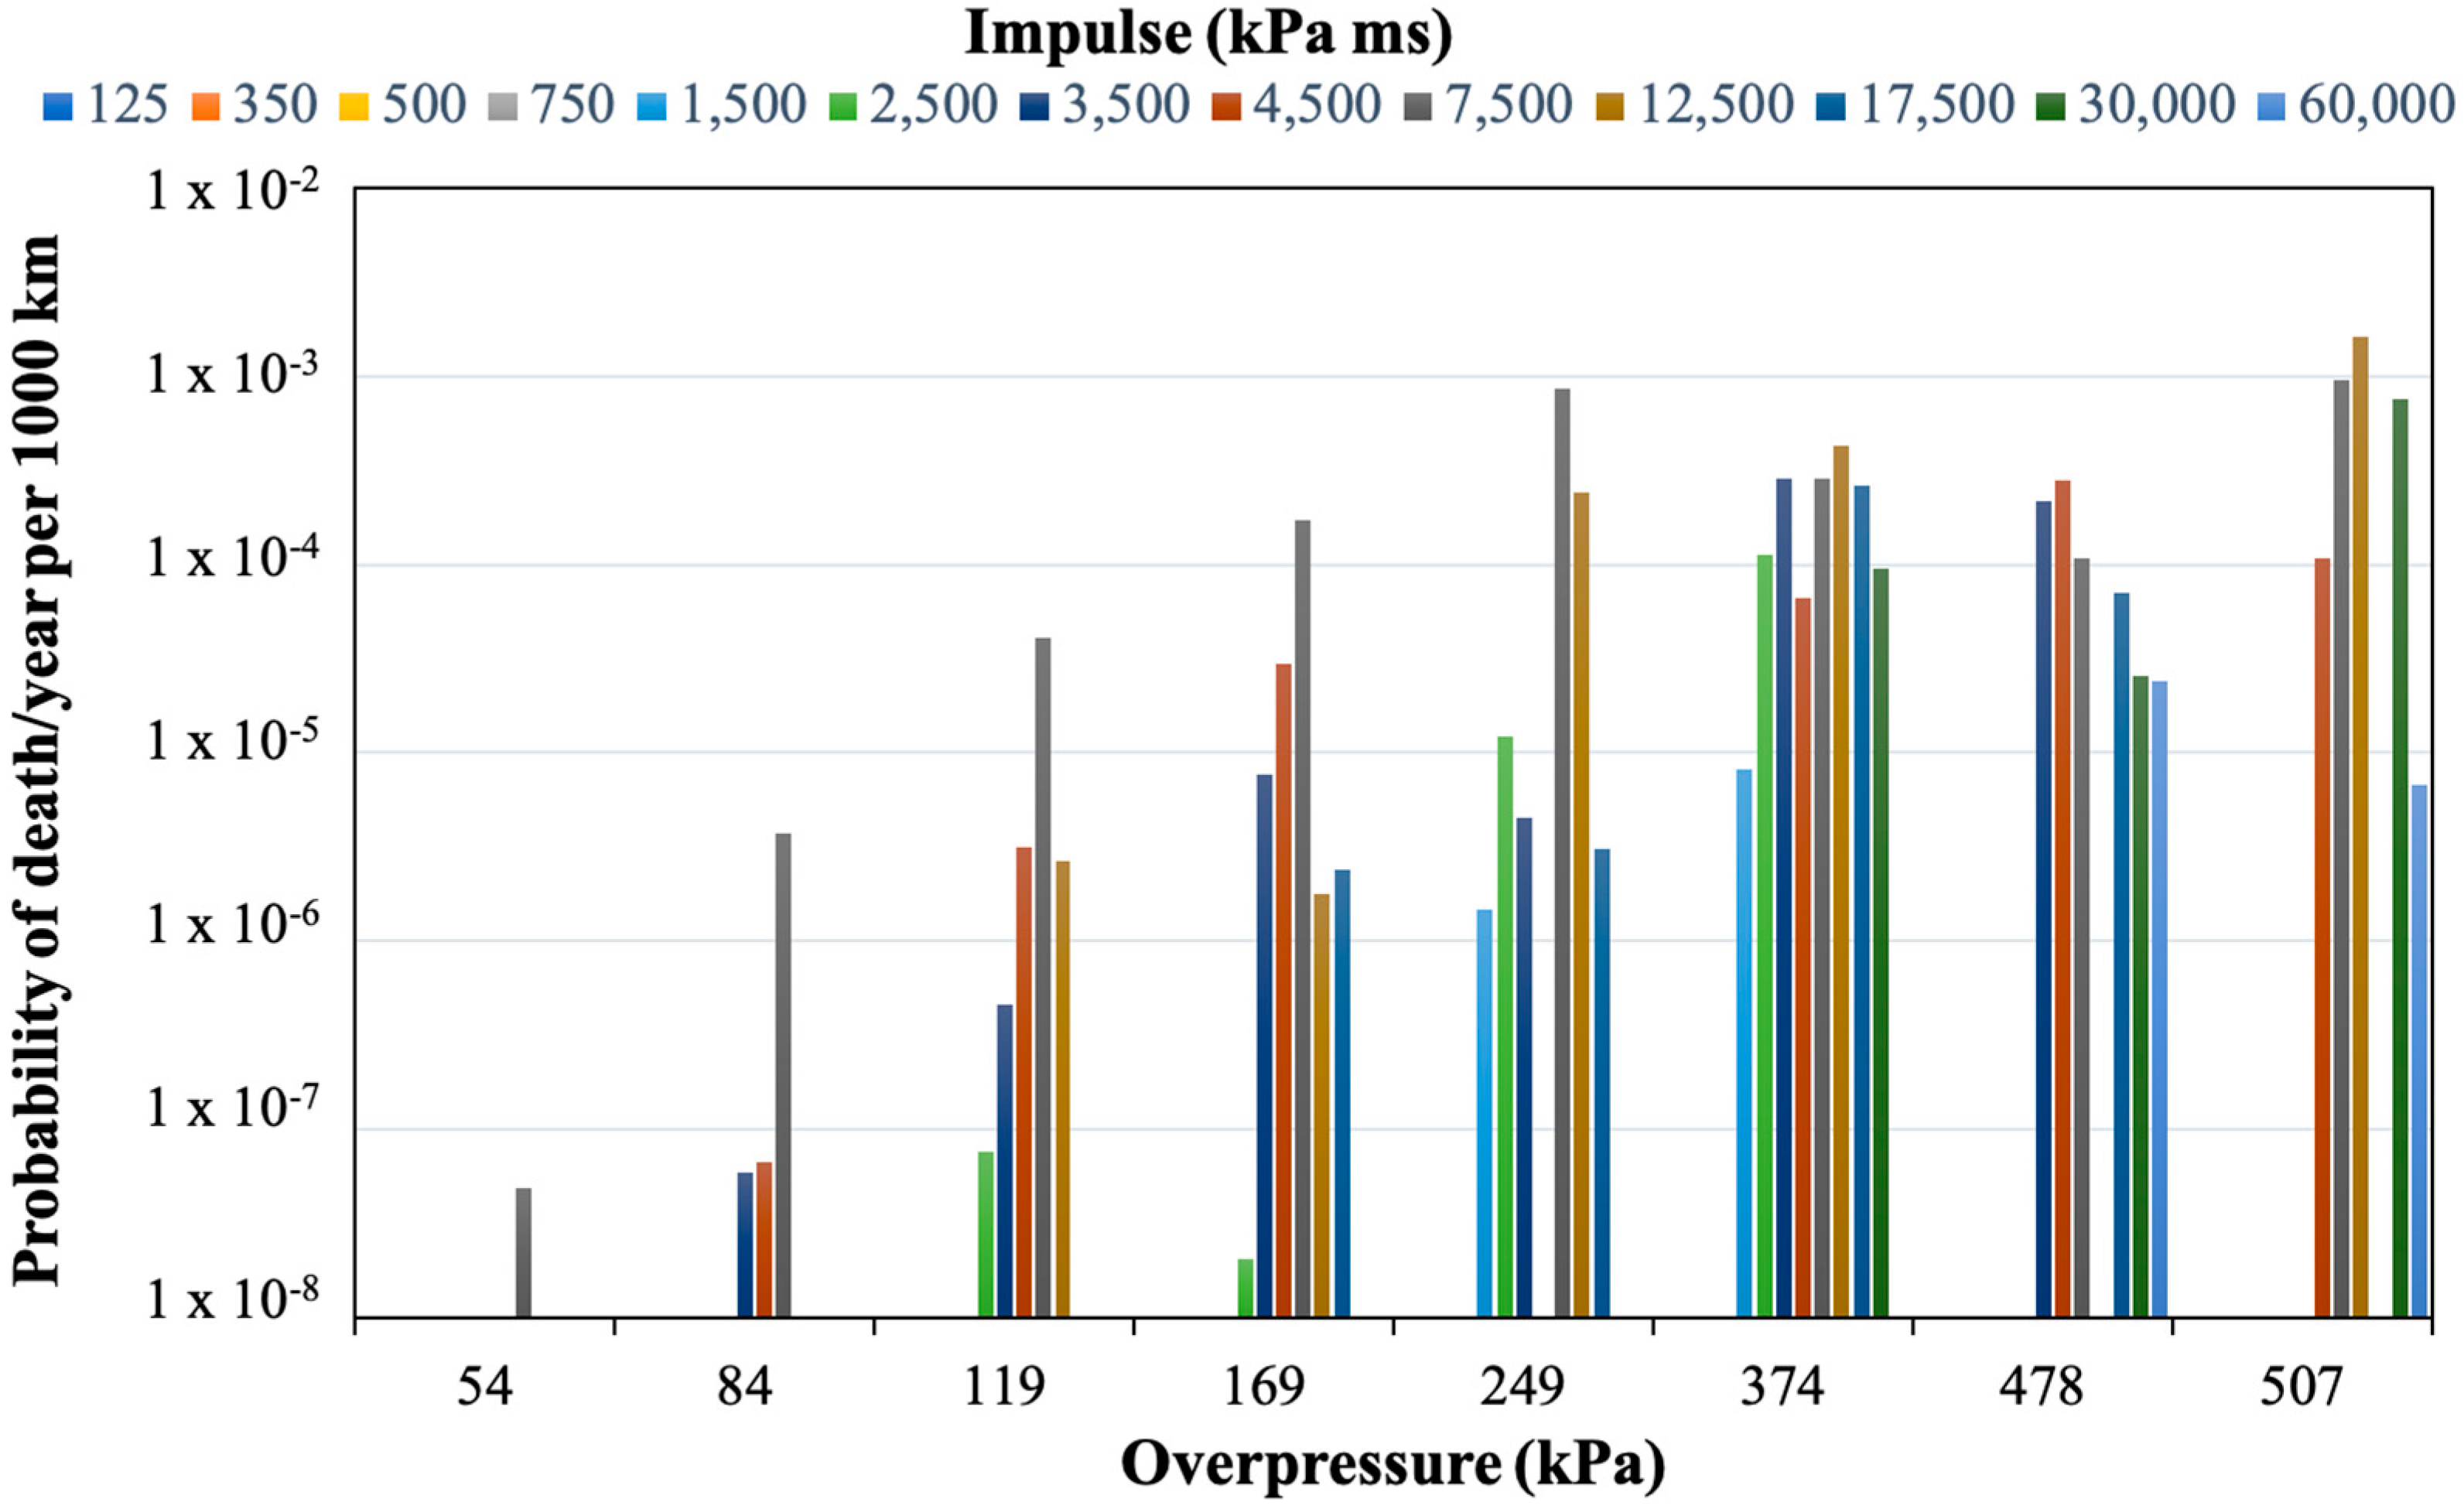
With regards to the harm to people, probability of fatality from lung hemorrhage, head impact, and whole-body impact for the different overpressure-impulse values are reported in Figure 2, Figure 3 and Figure 4, respectively. They refer to stability class F and wind velocity 2 m/s and to explosive class 9. Comparing Figure 2, Figure 3 and Figure 4 the higher probability of fatality occurs from indirect effects such as from head and whole-body impact against obstacles. Indeed, the overpressures required to throw a person against obstacles are significantly lower than the values required to cause fatal lung damage. A maximum value of 1.65∙10−3 death/year/1000 km is obtained in the case of head impact for an explosion overpressure of 507 kPa and impulse of 12,500 kPa ms.
Once the risk related to hazards is assessed the results are compared to the acceptance criteria. The risk is defined as acceptable when these results satisfy the previously mentioned criteria. On the contrary, if the results do not satisfy the criteria, mitigation measures need to be evaluated. The application of the acceptance criteria for hydrogen QRA (quantitative risk assessment) reflects general practice in QRA and is also adapted to company and authority regulations. For hydrogen, no adaptations to the acceptance criteria have been made to reflect the distinctive features of hydrogen technologies or the operation of hydrogen facilities.
The EIGA (European Industrial Gases Association) [31] defines harm criteria as being approximately a 1% chance of individual risk of serious injury or fatality and proposes the individual harm exposure threshold for determining safety distances of 3.5 × 10⁻⁵ per year. The HSE (Health and Safety Executive) has specified risk criteria as follows: for workers, maximum tolerable risk is 10−3 per year; for the public, 10−4 per year; broadly acceptable risk, 10−6 per year [32]. Risks falling into the region below 10−6 per year are generally regarded as insignificant and adequately controlled. In the Netherlands, the maximum acceptable individual risk is 10−6 per year [32]: This is a fixed limit for “vulnerable objects” (i.e., schools, hospitals, housing, etc.), and a target to be achieved as far as possible for “less vulnerable objects” (i.e., offices, shops, recreational facilities). This applies both to risks arising from fixed installations and to the transport of dangerous goods. It is calculated for an unprotected person (i.e., outdoors) present all year at specific locations. Therefore, in order to measure the risk levels for on-site personnel and general public that may be exposed to the accidents originating from the hydrogen facilities, the quantitative acceptance criteria considered here are 10−6 per year [32].
From comparison with the acceptance criteria, the fatality risk is not acceptable in the case of explosive class 9 and atmospheric stability class F2. On the contrary, in the case of explosive class 6 and F2 the probability of death (10−11 death/year/1000 km) is well below the risk acceptance criteria.
With regards to injuries (Figure 5), since the overpressures required to cause eardrum rupture are quite low, probability of injuries are higher than 10−5 /year/1000 km for overpressure higher than 10 kPa. Similar results were obtained for explosive class 6 and the same atmospheric class F2.
Moreover, the extent of the damage to buildings depends on both the level of overpressure and impulse and the type of construction of the structure. From the analysis carried out on RC columns and TSM walls, it is possible to conclude that there is no risk of harm in the case of RC columns of framed buildings because those structural components will not collapse. On the contrary, the higher vulnerability of TSM load-bearing walls to blast loading can cause indirect damage to the people inside the building.
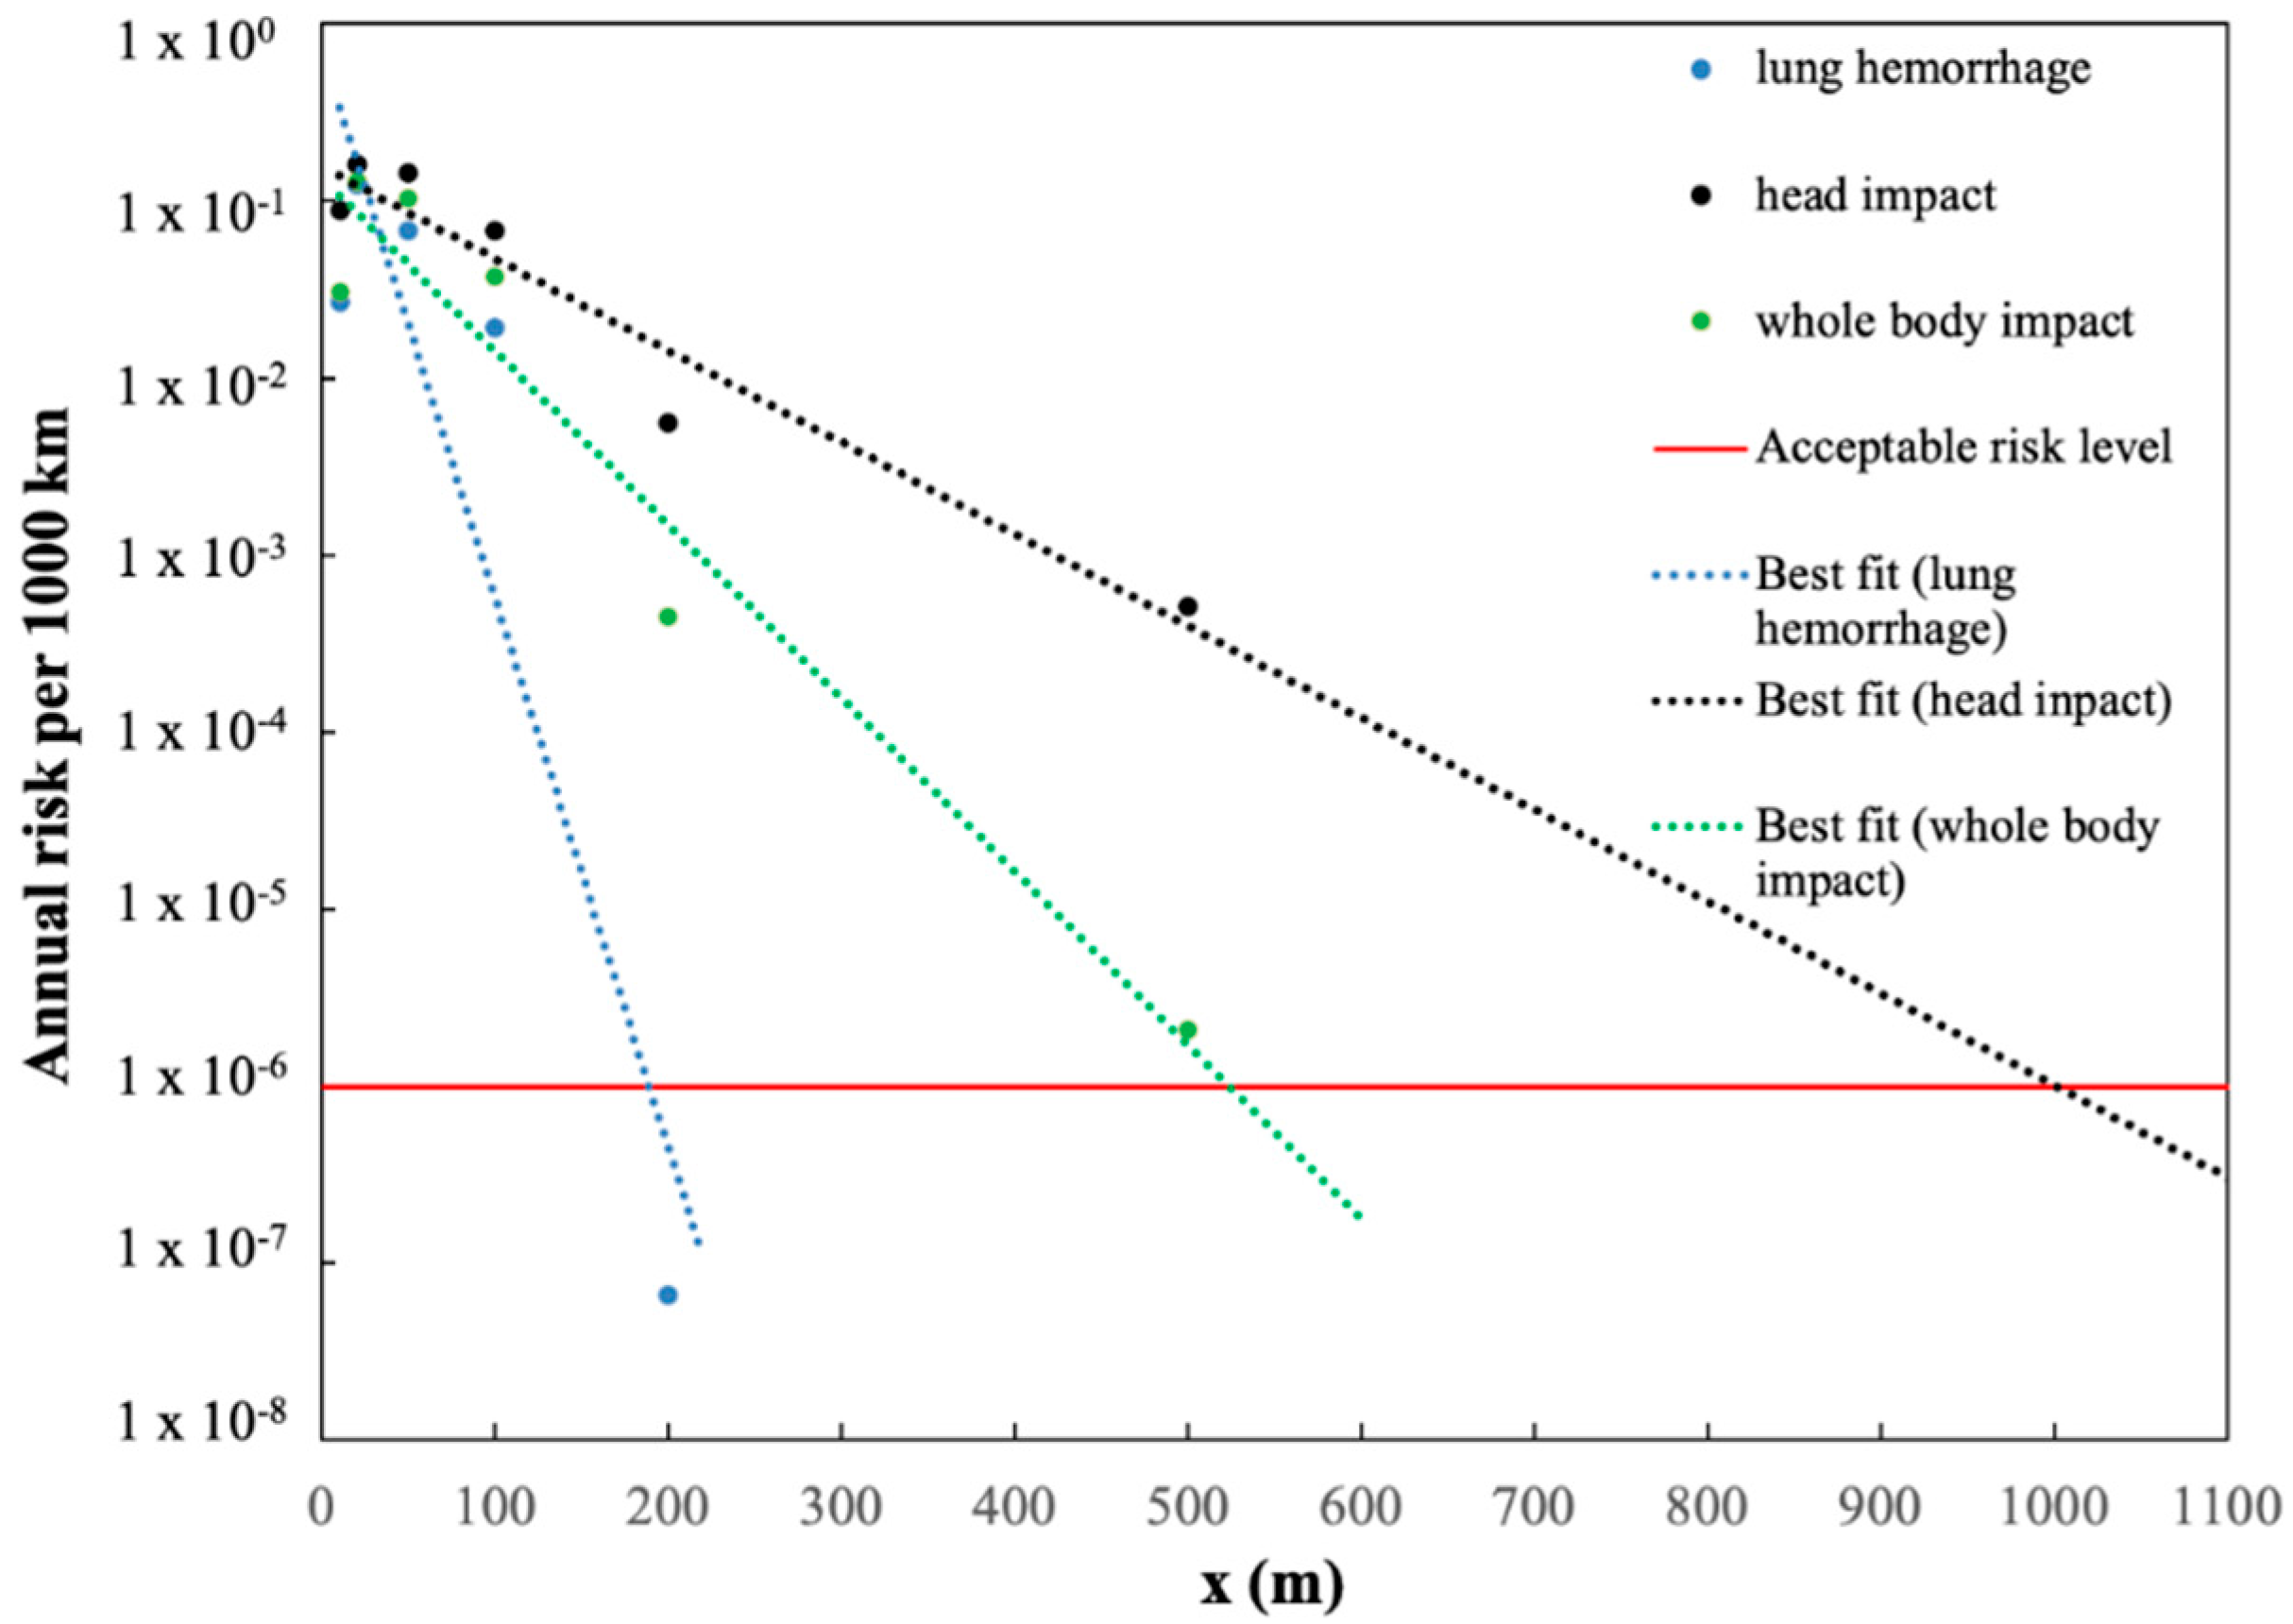
Finally, a minimum safety distance between pipelines and populated area is derived. The safety distance is here considered as the minimum separation between a hazard source and a person, which will mitigate the effect of a likely foreseeable incident. The individual harm exposure threshold for determining safety distances is equal to 10−6 per year. From comparison with the harm criteria, a safety distance of 1000 m is calculated, as shown in Figure 6.

4. Prevention and Mitigation Systems

In order to reduce or eliminate long-term risks resulting from accidental events, mitigation actions must be undertaken. The most rigorous risk-management procedures related to high-pressure hydrogen pipelines must be required.
The Hydrogen Tools Portal, developed by the Pacific Northwest National Laboratory with the support of the U.S. Department of Energy’s Office of Energy Efficiency and Renewable Energy (EERE), suggests a risk reduction plan to reduce or eliminate the most critical issues, subsequent to the individualization of the hazards and the classification of the risk.
Prevention measures are used to minimize to an acceptable level or remove the likelihood of occurrence and/or the severity of consequences.
The following steps for hazard control are proposed:
  • Remove the hazard, if it is possible
  • Use materials with the same features and functions, but that are less hazardous
  • Introduce engineering controls in order to isolate the hazard
  • Define administrative controls (procedures, indicators, and rules) for workers and any other people who may be involved in the hazard
  • Provide personal protective equipment
The EIGA (European Industrial Gases Association), after the identification of the hazards, suggests that, for each hazard, mitigation measures shall be determinate [30]. These measures consist of the following:
(i)
controlling of third party interference,
(ii)
thickening of the pipe,
(iii)
non-destructive testing on welds,
(iv)
inerting of the pipe,
(v)
marking of the pipe,
(vi)
installing valves that detect an increase of flux or decrease of pressure,
(vii)
mass balancing to individuate a leak,
(viii)
burying the pipeline,
(ix)
protecting the pipe with suitable coating,
(x)
operating procedures (i.e., inspections programs, corrosion control programs, emergency plan).

5. Conclusions

In this work, a probabilistic procedure to evaluate the damage to people and buildings involved in a gaseous hydrogen pipeline explosion was applied. Probit equations were used to assess and quantify the level and type of harm to people. Both indirect and direct damage were taken into account. The main human organs suffering from sudden changes in pressure are lungs and ear-drums and damage to these organs was examined. As a consequence of an explosion, people can also be thrown by the blast wave, suffering damage due to head impact or whole-body displacement.
The highest probability of fatality occurs from indirect effects such as from head and whole-body impact against obstacles. A maximum value of 1.65 × 10⁻³ death/year/1000 km was obtained in the case of an explosive class with high ignition power (class 9) and stable atmospheric conditions (F2). In addition, a person inside a structure would more likely be injured or killed by the facility collapse than from lung damage.
The assessment of structural damage showed very low levels of risk of damage to reinforced concrete columns of framed buildings, because those structural components do not collapse. On the contrary, the higher vulnerability of TSM load-bearing walls to blast loading can cause indirect damage to the people inside the building. A safe distance of 1000 m has been proposed in order to design a new pipeline network. However, to reduce the estimated safety distances, risk prevention and mitigation measures must be taken into account.

Author Contributions

Conceptualization, P.R.; Methodology, P.R. and F.P.; Software, A.D.M.; Supervision, P.R.; Validation, A.D.M. and F.P.; Visualization, A.D.M.; Writing—original draft, A.D.M.; Writing—review and editing, P.R. and F.P. All authors have read and agreed to the published version of the manuscript.

Funding

This research received no external funding.

Conflicts of Interest

The authors declare no conflict of interest.

References

  1. Merchdant Hydrogen Plant Capacities. Available online: https://h2tools.org/hyarc/hydrogen-production (accessed on 20 March 2019).
  2. Linde Engineering News. Available online: https://www.lindeengineering.com/en/news and media/press releases/news-20190228 (accessed on 20 March 2019).
  3. Eurostat Data of Statistics on the Production of Manufactured Goods. Available online: http://ec.europa.eu/eurostat/web/main (accessed on 20 March 2019).
  4. Hydrogen Pipelines. Available online: https://h2tools.org/hyarc/hydrogen-delivery (accessed on 20 March 2019).
  5. Zhang, X.; Xiao, L. Analysis of hazardous chemicals transportation accidents and transportation management. Chem. Eng. Trans. 2018, 67, 745–750. [Google Scholar]
  6. Rusin, A.; Stolecka, K. Hazards associated with hydrogen infrastructure. J. Power Technol. 2017, 97, 153–157. [Google Scholar]
  7. Crowl, D.A. Understanding Explosions; American Institute of Chemical Engineers: New York, NY, USA, 2003. [Google Scholar]
  8. Gerboni, R.; Salvador, E. Hydrogen transportation system: Elements of risk analysis. Energy J. 2009, 34, 2223–2229. [Google Scholar] [CrossRef]
  9. Russo, P.; De Marco, A.; Parisi, F. Failure of concrete and tuff stone masonry buildings as consequence of hydrogen pipeline explosions. Int. J. Hydrog. Energy 2019, 44, 21067–21079. [Google Scholar]
  10. Russo, P.; Parisi, F. Risk-targeted safety distance of reinforced concrete buildings from natural-gas transmission pipelines. Reliab. Eng. Syst. Saf. 2016, 148, 57–66. [Google Scholar] [CrossRef]
  11. Ermak, D.L. SLAB an atmospheric dispersion model for denser than air releases. In UCRL-MA-105607; Lawrence Livermore National Laboratory: Livermore, CA, USA, 1990. [Google Scholar]
  12. TNO. Methods for the calculation of physical effects due to releases of hazardous materials (liquid and gases). In Yellow Book; Van den Bosh, C.J.H., Weterings, R.A.P.M., Eds.; TNO: The Hague, The Netherlands, 2005. [Google Scholar]
  13. Pasquill, F. The estimation of the dispersion of windborne material. Meteorol. Mag. 1961, 90, 33–49. [Google Scholar]
  14. PHMSA. Gas Distribution, Gas Gathering, Gas Transmission, Hazardous Liquids, Liquefied Natural Gas (LNG) and Underground Natural Gas Storage (UNGS) Annual Report Data. Available online: https://www.phmsa.dot.gov/data-and-statistics/pipeline/gas-distribution-gas-gathering-gas-transmission-hazardous-liquids (accessed on 16 June 2018).
  15. Bedel, L.; Junker, M. Natural gas pipelines for hydrogen transportation. In Proceedings of the 16th World Hydrogen Energy Conference (WHEC 2006), Lyon, France, 13–16 June 2006; pp. 1006–1010, ISBN 9781622765409. [Google Scholar]
  16. Air Liquide. Questions and issues on hydrogen pipelines, pipeline transmission of hydrogen. In Proceedings of the Doe Hydrogen Pipeline Working Group Meeting, 31 August 2005; Available online: https://www.energy.gov/sites/prod/files/2014/03/f10/hpwgw_questissues_campbell.pdf (accessed on 20 March 2019).
  17. EGIG. 8th Report of the European Gas Pipeline Incident Data Group; European Gas Pipeline Incident Data Group: Groningen, The Netherlands, 2011. [Google Scholar]
  18. Melani, L.; Sochet, I.; Rocourt, X.; Jallais, S. Review of methods for estimating the overpressure and impulse resulting from a hydrogen explosion in a confined. In Proceedings of the ICH2009 International Conference on Hydrogen Safety, Ajaccio, France, 16–18 September 2009. [Google Scholar]
  19. HyResponse Grant agreement No: 325348. Lecture-Harm Criteria for People and Environment, Damage Criteria for Structures and Equipment; Tretsiakova-McNally, S., Ed.; Ulster University: London, UK, 2016. [Google Scholar]
  20. TNO. Methods for the determination of possible damage. In Green Book; CPR 16E; The Netherlands Organization of Applied Scientific Research: The Hague, The Netherlands, 1989. [Google Scholar]
  21. LaChance, J.; Tchouvelev, A.; Engebo, A. Development of uniform harm criteria for use in quantitative risk analysis of the hydrogen infrastructure. Int. J. Hydrog. Energy 2011, 36, 2381–2388. [Google Scholar]
  22. HSE. Methods of Approximation and Determination of Human Vulnerability for Offshore Major Accident Hazard Assessment; UK 2010 SPC/Tech/OSD/30; HSE: Buxton, UK, 2013. [Google Scholar]
  23. Crowl, D.A.; Louvar, J. Chemical Process Safety Fundamentals with Applications, 3rd ed.; Prentice Hall: Upper Saddle River, NJ, USA, 2011. [Google Scholar]
  24. Jeffries, R.M.; Gould, L.; Anastasiou, D.; Franks, A.P. Derivation of Fatality Probability Functions for Occupants of Buildings Subject to Blast Loads. In Probabilistic Safety Assessment and Management’96; Cacciabue, P.C., Papazoglou, I.A., Eds.; Springer: London, UK, 1996. [Google Scholar] [CrossRef]
  25. NFPA. Hydrogen Technologies Code; NFPA: Quincy, MA, USA, 2011. [Google Scholar]
  26. AIChE. Center for chemical process safety. In Guidance for Consequence Analysis of Chemical Releases; American Institute of Chemical Engineers: New York, NY, USA, 1999. [Google Scholar]
  27. CCPS. Guidelines for Evaluating the Characteristics of Vapour Cloud Explosions, Flash Fires and BLEVEs; American Institute of Chemical Engineering: New York, NY, USA, 1994. [Google Scholar]
  28. Federal Emergency Management Agency. Handbook of Chemical Hazard Analysis Procedures; Federal Emergency Management Agency: Washington, DC, USA, 1987. [Google Scholar]
  29. Parisi, F. Blast fragility and performance-based pressure- impulse diagrams of European reinforced concrete columns. Eng. Struct. 2015, 103, 285–297. [Google Scholar] [CrossRef]
  30. Parisi, F.; Balestrieri, C.; Asprone, D. Blast resistance of tuff stone masonry walls. Eng. Struct. 2016, 113, 233–244. [Google Scholar] [CrossRef]
  31. EIGA. Determination of Safety Distances; IGC Doc 75/07/E. Revision of Doc 75/01/rev; European Industrial Gases Association: Brussels, Belgium, 2007. [Google Scholar]
  32. DNV GL AS Maritime Advisory. Risk acceptance criteria and risk based damage stability. In Final Report, Part 1: Risk Acceptance Criteria: DNV GL; Report No.: 2015-0165, Rev 2; DNV GL AS Maritime Advisory: Hovik, Norway, 2015. [Google Scholar]
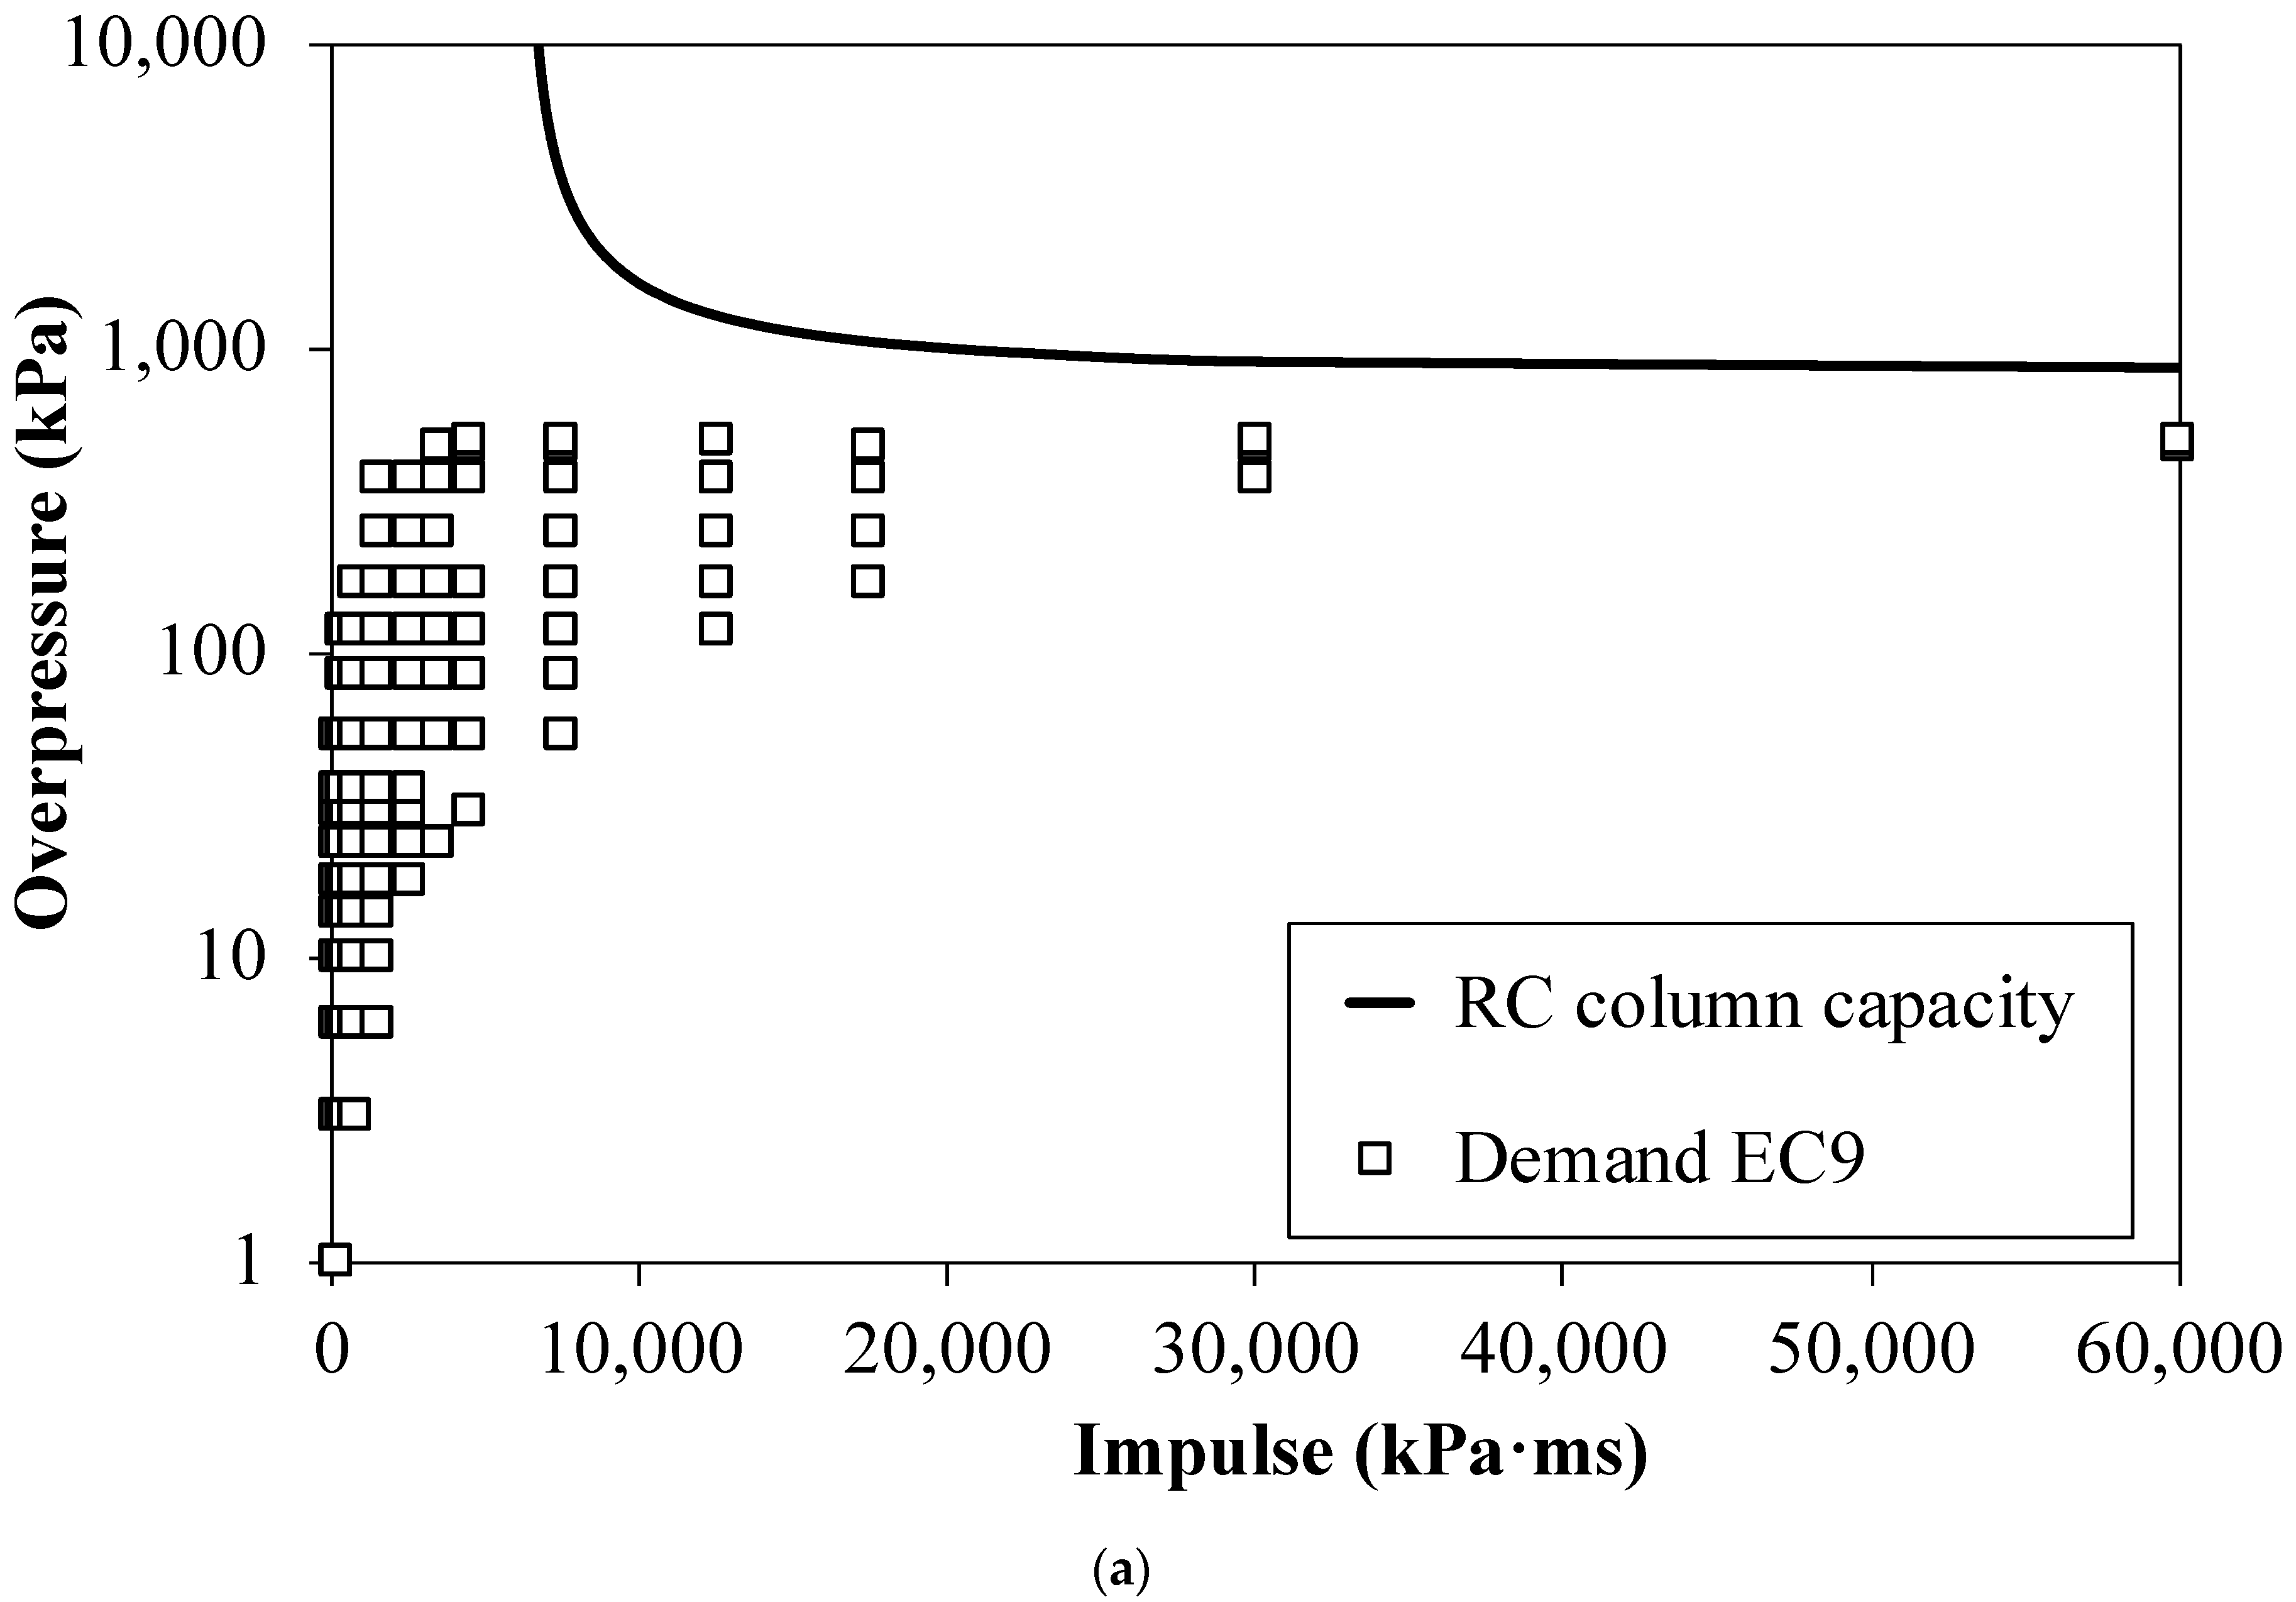
Figure 1. Blast demand and capacity of (a) reinforced concrete (RC) columns and (b) tuff stone masonry (TSM) walls for explosive class 9 and atmospheric stability class F2.
Energies 13 05051 g001aEnergies 13 05051 g001b
Figure 2. Probability of death from lung hemorrhage for explosive class 9 and atmospheric stability class F2.
Energies 13 05051 g002
Figure 3. Probability of death from head impact for explosive class 9 and atmospheric stability class F2.
Energies 13 05051 g003
Figure 4. Probability of death from whole body impact for explosive class 9 and atmospheric stability class F2.
Energies 13 05051 g004
Figure 5. Probability of injury from eardrum rupture for explosive class 9 and atmospheric stability class F2.
Energies 13 05051 g005
Figure 6. Annual risk per 1000 km of damage to people vs. safety distance (x (m)), in the case of blast strength 9 and atmospheric stability class F2.
Energies 13 05051 g006
Table 1. Hydrogen production plants [1].
CompanyCapacity (Nm3/h)
EuropeAsiaNorth AmericaRest of the world
Air Liquide770,505730,846830,32689,283
Air Products258,038419,6943,279,4945200
Linde657,129223,258542,218105,051
Praxair13,500197,3042,201,22513,396
Deokyang-111,000--
Hyundai-Wison---301,411
Others 58,86057,76149,672-
Total1,758,0311,739,8636,902,934514,341
Table 2. Simulation conditions.
ParameterAssumption
Source typeHorizontal jet release
Temperature of source material, K200
Duration of continuous source, s600
Height of source, m1
Time of concentration averaging, s30
Maximum downwind distance, m300
Height of surface roughness, m0.003
Wind speed, m/s2 and 5
Height of wind measurement, m10
Ambient temperature, K283
Relative humidity, %75
Pasquill atmospheric stability classA, C, D, F
Pipeline diameter (d), m0.1016–0.508
Operating pressure (Po), kPa649–12,800
Hole diameter (dhole), m0.02–d
Length of pipeline from the compression station to the release point (L), m50–10,000
Distance from explosion center (r), m10–2000
Explosive class6 and 9
Table 3. Probit functions for damage caused by explosion.
DamageProbit Equation
Deaths from lung hemorrhageY = Y = 5 − 5.74 ln (4.2 Pa/Pef + 1.3/Isc) a [20]
Deaths from head impactY = 5 − 8.49 ln (2430/Ps + 4 × 10⁸/Ps I) b [20]
Deaths from whole-body impactY = 5 − 2.44 ln (7380/Ps + 1.3 × 10⁹/Ps I) b [20]
Injuries from ear-drum ruptureY = −12.6+ 1.524 Ps c [23]
a: Pa = atmospheric pressure [Pa], Isc = I/(Po1/2 × m1/3), m = mass of person = 70 kg, Ps = peak overpressure [Pa], Pef = Ps + 5 × Ps2/(2 × Ps + 1.4 × 10⁶), b: Ps = peak overpressure [Pa], I = impulse of the shock wave [Pa × s], c: Ps = peak overpressure [Pa].