Abstract
The shell-and-tube type gas-to-gas membrane humidifier used with air supply to polymer electrolyte membrane fuel cell supplies heat and vapor through a membrane and does not require an additional power source. Packing porous metal foam in the flow path of the membrane humidifier can result in higher heat and mass transfer efficiencies due to heat conduction through metal. In this study, the influence of various operating conditions and types of porous metal foams on the transport characteristics of the membrane humidifier are evaluated by simulation. The main factor causing the improvement of heat and mass transfer is the high conductivity of the porous metal foam, which is significantly correlated with the type of material used, compression ratio, and pore diameter. Additionally, the heat and mass transfer changes significantly when the flow velocity and channel size change due to the effect of the metal foam becoming more pronounced.
1. Introduction
The fuel cell (FC) is a powerful source of electricity because of its high energy density per volume and weight. Of the types of FCs, the polymer electrolyte membrane fuel cell (PEMFC) has proven to be the best power source for electronic mobile devices because it is small, generates minimal heat, and can be quickly started [1]. The efficiency of the PEMFC could be reduced by a lack of humidity, which could lead to the decrease of ion conductivity, and by excessive humidity, which could increase resistance of migration of ions and oxygen [1]. It is, thus, necessary to use a proper humidifier for ideal relative humidity. Among the various humidifiers, the gas-to-gas membrane humidifier can simultaneously transfer heat and mass, requires no additional power source, and offers a simple operation. Therefore, it is considered suitable as a PEMFC humidifier for mobile applications. Although the membrane humidifier has advantages of easy fabrication and low cost of materials, there are several problems to overcome. The complex air flow channel to increase the efficiency of the humidifier increases the transport resistance of the air and the device size, weight, and cost. Various studies have been conducted on the heat and mass transfer characteristics related to the shape and configuration of the gas flow channel. The objective is to increase heat and mass transfer efficiency, while minimizing differential pressure. There are several ways to improve humidifier efficiency. For example, Sabharwal et al. [2] showed that a cross flow channel can in general increase humidifier efficiency. However, this is not a feasible option for PEMFC humidifier systems for the following reason: If the tube in a PEMFC humidifier is sufficiently long, it will theoretically have a heat exchange efficiency of 100%. However, a cross flow channel actually has a lower efficiency than other types of channels at the same tube length, which inhibits its usage in compact designs. The approach of Khazaee and Sabadbafan [3] is to increase the number of channels per volume. However, as the number of channels increases, the curvature of the channel also increases; thus, the differential pressure could be magnified, or an accumulation of contaminants may occur.
It is necessary to develop a new mechanism that has a simple channel configuration, is easily fabricated from inexpensive materials, and is lightweight. Maricle and Nagle [4] studied a flow channel filled with porous metal foam that can increase heat transfer by increasing the heat transfer area like fins. Compared to the existing complex gas flow path, the metal foam channel has a low differential pressure because of its high porosity and simple structure. The conventional flow path has high costs because of its complicated fabrication, but the metal foam flow channel is simple to manufacture and thus has a low cost. The porous metal foam is lightweight with high porosity, hardness, and thermal conductivity. This allows for the heat and mass transfer of the humidifier to be promoted by the unique characteristics of the metal foam. The fins of the flow channel accelerate the heat transfer by widening the surface of the heat transfer path. Compared to fin installation, adding metal foam exhibits greater heat transfer enhancement and lowers manufacturing cost.
Many experimental and simulated studies on the porous metal foam as flow paths in PEMFC have been recently conducted [5,6,7]. They show that the volume of gas diffusion layers could be reduced because the metal foam functions as a gas flow path, as well as a gas diffusion layer. In addition, the metal foam of the flow path could improve heat and mass transfer in the PEMFC stack due to its high effective heat conductivity. That being said, it is difficult to use the metal foam as the gas flow channel of the PEMFC because it has certain limitations. The metal foam flow path has low current conductivity and it is challenging to make the path due to complexity of structure of the stack.
On the other hand, it is not difficult to apply metal foam to the gas flow path of the humidifier for PEMFC due to two reasons. As the humidifier is not a power generator, unlike the PEMFC stack, there is no need to secure electrical conductivity. Furthermore, as the humidifier has no cooling component or electric flow in the gas flow path, the humidifier structure is simple. In addition, the differential pressure of the metal foam path is very small in the simple path as well as in the complicated path [8]. Therefore, we theorize that inserting the porous metal foam into the humidifier could be technically easier than applying it to the stack.
Although Afshari and Houreh [9] conducted a study on a numerical model of the membrane humidifier containing porous metal foam, overall, research in this field is lacking. The previous study was one of the first; thus, the model may have limitations in simulating an actual humidifier because of slightly excessive idealization. For example, previous models assumed that the viscosity effect is linear, even though it is nonlinear, because the flow channel is complex and flow velocity is high in the porous metal foam. In addition, they assumed that the flow velocity is not related to the permeability of the fluid in the flow channels of metal foam, whereas at high velocity, the permeability decreases with increased velocity. The details of this theory are explained after Equations (16)–(18) in Section 2.2.2. In this study, such nonlinearity of fluid behavior was considered and reliability of the model was verified by comparing it to experimental results. The fluid model of the metal foam channel and the heat transfer model of the humidifier have been used for the membrane humidifier with a metal foam model. In this process, we found various equations, which were previously studied and compared [10,11] to determine those that were suitable for this study. To develop the metal foam humidifier model, 10 kinds of porous metal foam were simulated. Different materials were selected for this study based on their heat and mass transfer characteristics. With this model, the effect of the material, porosity, pore diameter, and compressibility of the porous metal foam on heat and mass transfer characteristics were analyzed.
2. Methods
2.1. Model Description
The shell-and-tube type membrane humidifier model and metal foam flow model were developed using MATLAB and Simulink. First, the conventional membrane humidifier model was developed and verified with experimental data provided by an anonymous research partner. Next, the metal foam flow channel model was developed and verified with experimental data obtained from Wang and Wang’s study [12]. Finally, the membrane humidifier model and the metal foam flow channel model were combined to form the metal foam membrane humidifier model.
Figure 1 part A shows the concept used for the simulation of a shell-and-tube membrane humidifier, which is not filled with metal foam. The flow path inside the dry air side (tube side) was control volume 1, and the flow path inside the exhaust gas side (shell side) was set as control volume 2. Dry air supplied from the atmosphere flows into the dry air side, and exhaust gas, which is the high temperature and high humidity air of the PEMFC stack, flows toward the exhaust gas side. The flow direction of the simulation model was set to the same direction as the experimental conditions. The actual membrane humidifier has a complicated structure with a multi-tubular shape on the dry air side. In this study, we developed a model by idealizing it as a single pipe. In this case, even if the heat and mass transfer areas are set to the same value, the viscous condition is different because the tube diameter is different. In this regard, as the fluid pressure differential characteristics between the actual pipes and the modeled single pipe are different, the differential pressure calculation model was developed using experimental data. Heat and mass are transferred from the exhaust gas side to the dry air side toward the vertical direction of the fluid flow. The surface area of the heat and mass transfer is that of the outer tube (membrane face). The heat transfer is caused by the differential temperature from the hot exhaust gas side to the cool dry air side. Mass transfer is caused by osmotic phenomena in the membrane between the two fluids, from the exhaust gas side with high water concentration to the dry air side with low water concentration.
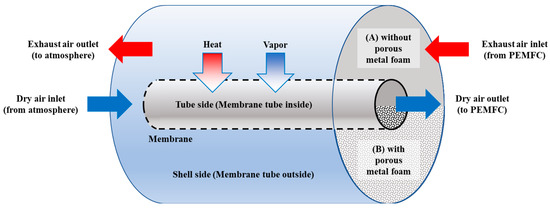
Figure 1.
Layout of the shell-and-tube membrane humidifier without porous metal foam (A) with porous metal foam (B).
Figure 1 part B shows the concept used for the simulation of the shell-and-tube membrane humidifier filled with metal foam. Although the mechanism of the fluid flow of the metal foam membrane humidifier is the same as that of the conventional shell-and-tube membrane humidifier, the heat transfer mechanisms are different.
As air has a small heat conduction coefficient, the main heat transfer phenomenon in humidifiers is convective heat transfer. Therefore, heat conduction in existing membrane humidifiers has little effect on total heat transfer. However, the heat transfer of the metal foam humidifier is caused not only by convective heat transfer between the membrane and air or the metal foam and air, but also by conduction heat transfer through the metallic part of the metal foam. This role of the metal foam is analogous to the effect of increasing the heat transfer area of the membrane humidifier.
Table 1 shows the details of the membrane humidifier and porous metal foam used in the model. The type of porous metal foam was based on alumina alloy with high effective thermal conductivity. The membrane humidifier model is based on an actual one—FC400-2500-15LP, manufactured by Perma Pure LLC. (Lakewood, NJ, USA). This is the membrane humidifier model used in the PEMFC system operation test provided by an anonymous research partner.

Table 1.
Parameters of a porous metal foam membrane humidifier.
In this study, we idealized the following factors that have little influence on the simulation result:
- Air is an ideal gas because its density and pressure are low, and temperature is high enough to use the ideal state equation.
- Only water transfer occurs in the membrane because it is difficult for air molecules to pass it, owing to its diminutive pores.
- Heat loss to the atmosphere is ignored by regarding it as a complete insulation condition.
- Changes in the specific heat of the fluid above the operating temperature range are ignored.
- No phase change occurs, and the fluid is gaseous.
- The control volume is constant, as the expansion and contraction effect of the membrane according to the water content and differential pressure is much smaller than the control volume.
2.2. Modeling Approach
This section presents the relationships used in the conventional membrane humidifier model and the metal foam membrane humidifier model. The conventional model is not analyzed, but was developed as a base model for the metal foam membrane humidifier model in this study. The relationships are divided into a thermodynamic equation and a heat and mass transfer equation. The conventional membrane humidifier model is described by relationships used in a study by Park et al. [13]. The heat transfer characteristics would have changed because of the heat transfer improvement by the metal foam, such as the heat transfer coefficient increase owing to heat conductivity of the metal. The differential pressure characteristics were also likely changed owing to the flow resistance among the metal and the air due to increasing viscosity. On the other hand, even if the mass transfer was expectantly changed, this could be shown not because of the direct effect of the metal foam but because of its indirect effect and immediate effect of the heat transfer. As the metal foam is indirectly involved in the diffusion phenomenon, which is correlated with factors including temperature, pressure, and the concentration of the fluid and the membrane, the mass transfer relationship of the metal foam membrane humidifier model is the same as that of the conventional membrane humidifier model.
2.2.1. Thermodynamic Equation
The energy conservation equation is divided into two control volumes—the dry air side and the exhaust gas side—as shown in Equations (1) and (2) [14].
These equations are the balance of the inlet and outlet mass flow energies of the fluid, and the heat transfer and mass transfer energies through the membrane. Equation (3) is used to change Equations (1) and (2) to the temperature equation:
Equations (4) and (5) are obtained by integrating Equations (1) and (2):
Using Equations (4) and (5), the outlet temperature of each flow path can be calculated. The mass conservation equations are as shown in Equations (6) and (7) for dry air and exhaust gas [14]:
2.2.2. Heat Transfer Equation
The heat transfer can be driven by conduction through metal parts and each fluid molecule and by convection between the fluid and metal. The relation of heat transfer is shown in Equation (8) [14]:
The total heat transfer coefficient, area, and average differential temperature should be determined to obtain the heat transfer rate in Equation (8). According to Incropera et al. [14], it is reasonable to use the logarithmic mean temperature difference, as the fluid temperature changes nonlinearly. This relationship is given by Equation (9):
The average differential temperature can be obtained by Equation (9) and heat transfer can be obtained by Equation (8).
The relation for the total heat transfer coefficient of Equations (8) and (9) is shown in Equation (10).
The relationship for the convective heat transfer coefficient of Equation (10) is shown in Equation (11):
The hydrodynamic diameter (D) in Equation (11) is the sum of the surface area of each tube. It is assumed to be like the surface area of the single tube in the conventional membrane humidifier. Meanwhile, in the metal foam membrane humidifier, it is the diameter of the tube and the metal diameter.
Thermal conduction occurs, not only in metal parts, but also in fluids. The total thermal conductivity coefficient of the fluid and the metal foam is called effective thermal conductivity. The relationship [15] for effective thermal conductivity of an aluminum porous metal foam with porosity of 0.8 or more is shown in Equation (12):
The relationship [16] for the Nusselt number of porous metal foam channels are as in Equation (13):
Equation (13) could be applied to all models considering local thermal diffusions in various aluminum porous metal foam channels, where the constant () value is 0.52. The Prandtl number in Equation (13) is given by Equation (14):
The Reynolds number of a conventional membrane humidifier is given by Equation (15):
On the other hand, the Reynolds number of the porous metal foam membrane humidifier is shown as Equation (16) [17]. The relationship for the surface area density is given by Equation (17) and the average diameter of the metal part is shown as Equation (18):
The surface area density (surface area per volume) is a factor depending only upon the structure of the metal foam; thus, it is an experimentally measurable factor [18,19,20]. Actually, the real permeability changes owing to the change in the factor of adhesion between the fluid and the metal depending on the flow speed. In this regard, using the equation of surface area density is more accurate than the other equations using permeability.
The model of differential pressure in the porous metal foam was developed using the corresponding model of Giani et al. [21]. The results of the developed equations were verified by comparing them with experimental values of Lacroix et al. [18]. The differential pressure of the dry air side is shown in Equation (19), and that of the exhaust gas side in Equation (20):
2.2.3. Mass Transfer Equation
The relationship of the mass transfer rate is shown in Equation (21) [19,20]:
The cause of the mass transfer is the differential concentration and the effective mass transfer coefficient. The other factor of Equation (21) is a fixed value, geometry, or fluid, so it does not affect the mass transfer rate. The relationship for effective mass transfer coefficient is given by Equation (22) [22]:
As the porosity of the membrane is also a fixed value, the effective mass transfer coefficient is influenced by the fluid temperature and pressure. is as follows [19]:
The effective mass transfer coefficient is affected by the water content of the membrane, and the water content is affected by water activity. The activity is affected by vapor pressure, so that the relative humidity of the fluid eventually affects the mass transfer rate. The correlation equation for the concentration of water in Equation (21) is as follows:
As the water concentration is affected by the water content, the relative humidity is a factor affecting the concentration. This indicates that the relative humidity difference between the exhaust gas and the dry air has a meaning similar to the density difference, and that the mass transfer rate also increases when the relative humidity difference increases.
2.3. Simulation Parameters
Table 2 lists the simulation parameters used in this study. Value 2 has been used only for the simulation of diameter effect in Section 3.3 and value 1 have been used for all the other simulations. Table 3 lists the properties of the various metal foams at a temperature of 296 K. Table 4 lists the input factors at different compression ratios (PPI: pores per inch).
Table 2.
Input parameters for simulation in this study.
Table 3.
Properties of the metallic and ceramic foam samples characterized experimentally [20].
Table 4.
Material properties of the porous metal foam samples for different pore per inch [21].
3. Results and Discussions
3.1. Model Validation
The model developed in this study was compared to experiments to be validated. Figure 2 shows the temperature variation of the outlet of exhaust air and dry air with respect to the dry air flow rate. The outlet temperature of these parameters changes as the heat and mass transfer changes due to variation in dry air flow rate. As shown in the graph, the simulation results are well fitted to the experimental results. Figure 3 shows the differential pressure per unit length (Pa/m) with respect to superficial velocity (m/s) between the experiments [12] and the simulation results. It is also shown that the simulation results are analogous to experimental results.
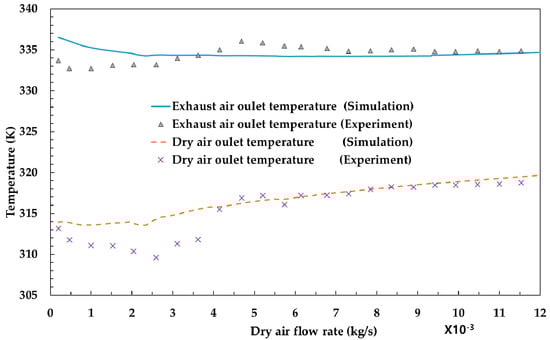
Figure 2.
Comparison of temperature (K) with respect to dry air flow (kg/s) between the experiments and the simulation results.
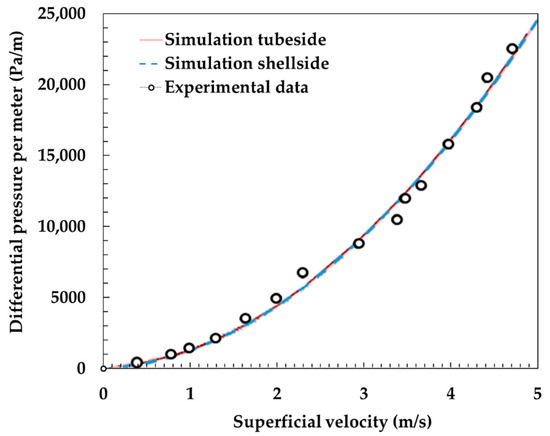
Figure 3.
Comparison of differential pressure per unit length (Pa/m) with respect to superficial velocity (m/s) between the experiments [12] and the simulation results.
3.2. Effects of Metal Foam Types on Humidifier Performance
In this section, heat and mass transfer phenomena are analyzed according to the characteristics of the porous metal foam. Figure 4 shows the results of the change in heat and mass transfer characteristics depending on the material of the porous metal foam. The heat and mass transfer rate of aluminum alloy was the highest. This is because effective thermal conductivity coefficient differs depending on the material, and heat transfer has a proportional correlation with the effective thermal conductivity coefficient. As the steel alloy has an effective thermal conductivity value of about 40% of the aluminum or ceramic alloys, the heat and mass transfer rates seem to decrease in proportion to this value. Therefore, even though the type and specification of the humidifier are different, the result is likely to be similar. In detail, as shown in Equation (12) in Section 2.2.2, the effective conductivity of the metal foam is augmented as the conductivity coefficient increases and porosity decreases. It is also shown that effective conductivity is not related to diameter of the pore of the metal foam. This is because the proportion of metal versus pore is increased as porosity is reduced. Thus, effective conductivity increases with reduction in porosity. That is why sample 4 has the highest effective conductivity with lowest porosity among the aluminum alloy samples.
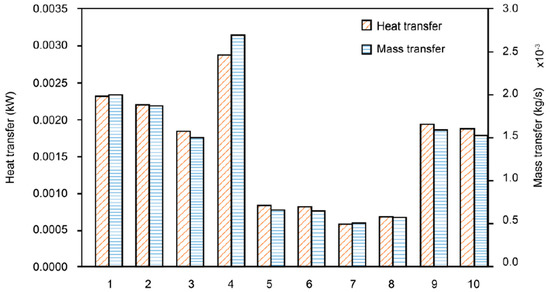
Figure 4.
Comparison of heat (heat transfer rate, ) and mass transfer (mass flow rate, ) among humidifiers with various types of porous metal foam (the number on the x-axis is the sample number from Table 3).
Steel alloys are low in price, but have low heat and mass transfer rates and are not suitable for use in membrane humidifiers. Aluminum alloy, which has the highest heat and mass transfer coefficient, is a material that has been widely used as a porous metal foam in the past, and is highly desirable to be applied to a humidifier because of its high technical performance. Mullite and zirconia, which have heat and mass transfer coefficients similar to that of aluminum alloy, have high thermal conductivity and excellent rigidity, toughness, and corrosion resistance. Further, the lightweight property of ceramic material can be a great advantage for the humidifier to be developed for mobile devices and is considered the most suitable material for the humidifier.
Figure 5A shows the heat and mass transfer characteristics according to porosity change. The heat transfer rate decreased slightly, while the porosity increased from 0.8 to 0.96. According to Equation (18), as the porosity increases, the metal diameter decreases when the pore diameter is constant. The reduction in metal diameter reduces conduction heat transfer through the metal. That is, as can be seen from Equation (12), the effective thermal conductivity coefficient decreases. This is a result of reducing the heat transfer rate. The metal diameter decreases logarithmically with porosity. On the other hand, as the porosity increases, the change in metal diameter gradually increases. For this reason, the heat transfer decreased sharply when the porosity increased by 0.96 or more.
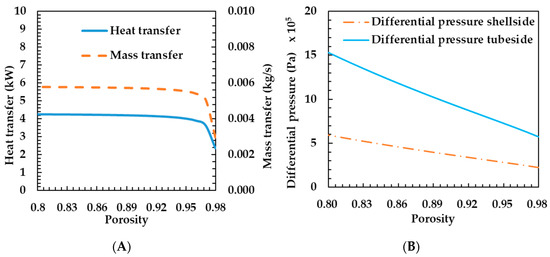
Figure 5.
Effects of porosity on heat and mass transfer rates of the porous metal foam humidifier (A) and differential pressure of the porous metal foam humidifier (B).
Mass transfer rate shows the same tendency as heat transfer rate. As can be seen from Equation (23), as the heat transfer decreases, the temperature of the membrane also decreases, so the mass transfer coefficient decreases. If the mass transfer coefficient decreases according to Equation (21), the mass transfer rate also decreases. In this case, the mass transfer coefficient in Equation (23) is proportional to 1.5 times the temperature, so that the mass transfer rate is larger than the heat transfer variation width. As can be seen in Figure 5A, the characteristics of the change in thermal mass transfer coefficient are the same, but the degree of change shows that the mass transfer rate is higher. As the porosity increases, the heat and mass transfer rates decrease. Therefore, it is preferable to use porous metal foam of appropriate porosity rather than a porous metal foam with excessively high porosity.
Figure 5B shows the differential pressure characteristics according to porosity change. The lower the porosity, the greater the differential pressure. Increasing the differential pressure increases the operating energy of the fluid supply, so the overall efficiency of the FC system can be lowered as the differential pressure increases. Therefore, the smaller the porosity, the worse the overall efficiency. Figure 5 shows that it is preferable to use porous metal foam with porosity of about 0.96 because there is almost no change in the heat transfer coefficient at porosity of less than 0.96.
Figure 6A shows the heat and mass transfer characteristics according to change in pore diameter. The heat transfer rate increases as the pore diameter varies up to 0.001 m. If the porosity is constant, the effective heat transfer coefficient is constant, as shown in Equation (12). Therefore, the heat and mass transfer rates are only affected by convection. If the porosity is constant and the pore diameter increases, the metal diameter increases according to Equation (18). Thus, the surface area density is decreased according to Equation (17) and the Reynolds number is increased according to Equation (16). Finally, the heat transfer rate increases.
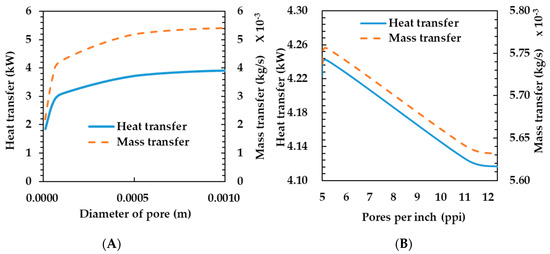
Figure 6.
Effects of pore diameter (A) and compressibility (B) on heat and mass transfer rates of the porous metal foam humidifier.
The mass transfer coefficient tends to be the same as the heat transfer coefficient because the increase in the heat transfer rate increases the temperature of the membrane and, thus, the mass transfer coefficient. In selecting the material to be applied to the humidifier, it may be appropriate to use a porous metal foam having a large pore diameter. However, as the strength of the material is more advantageous as the pore diameter is smaller, it is considered that a proper pore diameter should be selected considering the mutual relationship between the two.
Figure 6B shows the heat and mass transfer rate depending on the compressibility of the porous metal foam. As the compressibility increases, the heat transfer coefficient decreases. As shown in Table 4, as the PPI of the porous metal foam increases, the pore diameter becomes smaller and the porosity (ε) increases. As the reduction in heat and mass transfer rates are not large when a high compressibility material is used, it is considered that a high compression ratio may be advantageous in terms of the strength of the humidifier.
3.3. Effects of Operating Conditions on Humidifier Performance
This section explains how the heat and mass transfer characteristics of the humidifier are influenced by operating conditions, including flow rate, temperature, oxygen concentration, and relative humidity. Figure 7A shows the heat and mass transfer characteristics according to the exhaust gas supply flow rate of the humidifier. The heat and mass transfer rates increase sharply when the exhaust gas flow rate changes from 0 to 0.1 kg s−1. As the exhaust gas flow rate increases, the flow velocity increases because the area of the flow path and the density of the fluid are constant. As shown in Equation (16), when the fluid velocity on the exhaust gas side increases, the Reynolds number on the exhaust gas side increases. Therefore, the convective heat transfer coefficient and heat transfer rate increase.
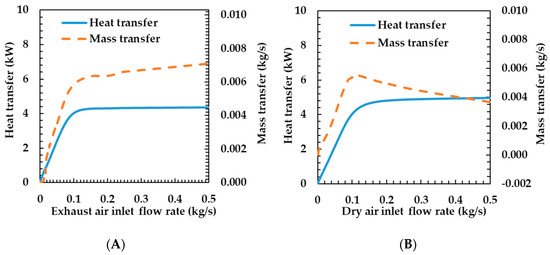
Figure 7.
Effects of exhaust air (A) and dry air (B) inlet flow rate on heat and mass transfer rates of the porous metal foam humidifier.
As the flow rate changes from 0.1 to 0.5 kg s−1, the variation in the heat transfer rate is very small. This is because, as shown in Equation (13), the Nusselt number increases logarithmically and the heat transfer rate also increases logarithmically according to the variation in the velocity. The variations in the mass and heat transfer rates tend to be the same because the increase in the membrane temperature due to the increase in heat transfer increases the mass transfer coefficient.
Figure 7B shows the heat and mass transfer characteristics according to the change in the dry air flow rate. The heat and mass transfer rates increased sharply, while the dry air flow rate varied from 0 to 0.1 kg s−1. This is because the velocity increases as the flow rate increases. The mass transfer rate also shows the same characteristics because of the increases in temperature and the mass transfer coefficient of the membrane according to the increase in the heat transfer coefficient. While the flow rate of the dry air changes from 0.1 to 0.5 kg s−1, the decrease in the heat resistance in the dry air side has a small effect on the total heat resistance, so the heat transfer rate increases by 10%, but the mass transfer rate decreases. This is because the mass transfer rates are affected by the temperature of the membrane. As the flow rate increases, the specific heat capacity of the fluid increases and the temperature change decreases because the heat transfer rate increases slightly, but the flow rate increases greatly. As such, the temperature of the membrane is also reduced and the mass transfer rate is decreased.
Figure 8A shows the heat and mass transfer characteristics according to the temperature change at the inlet side of the exhaust gas. As the temperature at the inlet of the exhaust gas increases, the heat and mass transfer rate increase. When the temperature on the exhaust gas side increases, the average temperature difference with the dry air side increases, and the heat transfer rate also increases. The mass transfer rate also has the same tendency as the heat transfer rate, which is due to the increase in the membrane temperature and the mass transfer coefficient as the heat transfer rate increases.
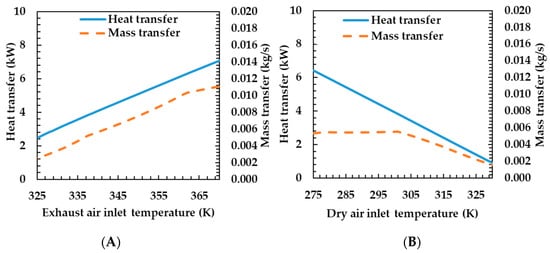
Figure 8.
Effects of exhaust air (A) and dry air (B) temperature on heat and mass transfer rates of the porous metal foam humidifier.
Figure 8B shows the heat and mass transfer characteristics according to the temperature change of the dry air side. As the dry air side temperature increases, the heat transfer rate decreases and the mass transfer rate remains almost unchanged when the temperature changes to 300 K, and thereafter decreases. The heat transfer rate decreases because the temperature difference between the two fluids decreases—the temperature on the exhaust gas side is constant when the temperature of the dry air side increases. As the temperature difference decreases, the heat transfer rate also decreases. Mass transfer rates were almost unchanged at the beginning and then decreased. This is due to the water content of the fluid and the mass transfer rate due to the temperature of the membrane. As the water content on the dry air side increases, the mass transfer rate decreases. Conversely, as the temperature of the membrane increases, the mass transfer rate increases. As the temperature of the drying air increases, the saturated water vapor pressure of the air increases. As relative humidity is calculated under a certain condition, the water content of the air increases. This is the reason for the reduced mass transfer rate. At the same time, the temperature of the membrane increases as the temperature of the drying air increases. This, in turn, is the cause of increased mass transfer rates. At this time, the water content according to the temperature changes exponentially and the mass transfer rate decreases exponentially. Further, the temperature of the membrane increases linearly, and the mass transfer rate thereof also increases linearly. As a result, the mass transfer rate remained almost unchanged as the effects of water content and temperature change on the mass transfer rate at the beginning of the temperature change are mutually canceled, and thereafter, the temperature change exponentially affects the mass transfer rate as the water content increases; the mass transfer rate is judged to be reduced.
Figure 9A shows the characteristics of heat and mass transfer according to changes in oxygen concentration of the exhaust air. The oxygen concentration did not affect the heat transfer coefficient. This is because specific heat capacity and molar mass between the oxygen and the air are almost the same. The heat transfer coefficient is proportional to specific heat capacity and the mass transfer coefficient is proportional to the molar mass. Therefore, the oxygen concentration can be neglected in the design of the humidifier.
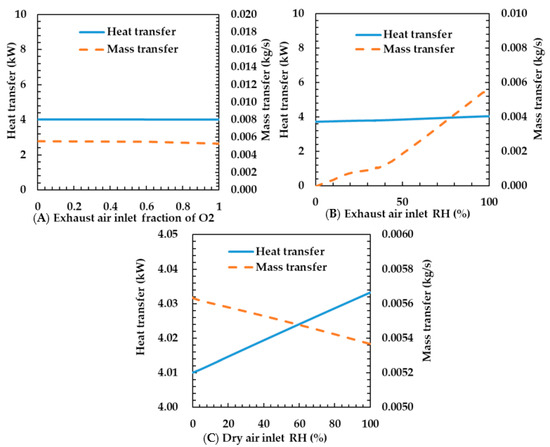
Figure 9.
Effects of exhaust air inlet fraction of oxygen (A), exhaust air inlet RH (B), and dry air inlet RH (C) on heat and mass transfer rates of the porous metal foam humidifier.
Figure 9B shows the heat and mass transfer characteristics according to the relative humidity change of the exhaust gas. As the relative humidity increases, the heat transfer rate increases slightly and the mass transfer rate increases sharply. This is because the mean of the specific heat capacity of the gas increases as the water concentration of the gas increases. The reason is that the specific heat capacity of water is higher than that of air. This makes the convection heat transfer coefficient increase; thus the heat transfer coefficient increases. However, even at a relative humidity of 100%, the heat transfer rate increases slightly because the amount of water slightly is increased. The reason for the increased mass transfer rate is that as the relative humidity of the exhaust gas increases, the water concentration of the exhaust gas increases and, thus, the difference in water concentration between the dry air and the exhaust gas increases. As the difference in the water concentration considerably increases according to the increase in the relative humidity, the mass transfer rate also significantly increases.
Figure 9C shows the heat and mass transfer characteristics according to the relative humidity change of dry air. As the relative humidity of the dry air increases, the heat transfer rate increases slightly and the mass transfer rate decreases. The reason is that the specific heat capacity increases. The change in water content exponentially changes with temperature. As the temperature of the dry air is low, the change in water content according to the temperature of the dry air is lower than that of the exhaust gas. Because of the trivial change in specific heat capacity, the change in heat transfer rate was also very small. The reason for the decrease in mass transfer rate is that the difference in water concentration between the dry air and the exhaust gas decreases as the relative humidity of the dry air increases and the water content of the dry air increases. As the temperature of the dry air is low, the water concentration slightly changes according to the relative humidity. Therefore, the mass transfer rate also slightly changes. In this regard, we assume that the relative humidity of the dry air is trivial in the design of the humidifier because the relative humidity barely affects the change of mass transfer rate according to the relative humidity of the dry air. In addition, although the relative humidity of the dry air made by heating atmospheric air is high, the variation of heat and mass transfer rates is small. In this regard, we think that a temperature controller is not required.
3.4. Effects of Geometric Parameters on Humidifier Performance
This section clarifies how the characteristics of heat and mass transfer are influenced by the geometric parameters, including membrane thickness, tube diameter, and shell diameter. Figure 10A shows the heat and mass transfer characteristics according to the thickness of the membrane. Membrane thickness did not affect the heat transfer rate. This is because the thickness of the membrane is very low; thus, thermal resistance is not large and even if the thickness is multiplied ten times, the effect on the total heat transfer coefficient is limited. As can be seen from Equation (21), as the mass transfer coefficient is inversely proportional to the membrane thickness, the mass transfer rate is decreased.
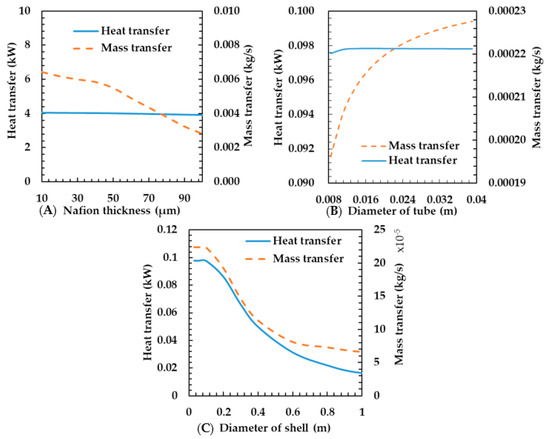
Figure 10.
Effects of membrane thickness (A), diameter of tube (B) and diameter of shell (C) on heat and mass transfer rates of the porous metal foam humidifier.
Figure 10B shows the heat and mass transfer characteristics for tube diameters ranging from 0.008 to 0.040 m. The calculation factors are shown in Table 2. According to Park et al. [13], the heat and mass transfer rates increase as the tube diameter increases. Although various results of their study are analogous to the present study, their specific results differ from ours. To be specific, this study shows that the mass transfer rate increases greatly in the porous metal foam humidifier, but the heat transfer increase is minimal. Increasing the tube diameter means that the heat transfer area is increased, thereby the heat and mass transfer rates increase. On the other hand, as the diameter increases, the gas velocity decreases and the convective heat transfer coefficient of the heat transfer rate decreases. In detail, as shown in Equations (16)–(18), as the diameter of metal foam increases, heat conduction via metal is augmented due to increment of the area of metal while heat convection between the fluid and the metal is reduced as Reynolds number () is decreased due to reduction of the area density of metal foam (); thus, the two effects are nullified by each other. As results from such offset, the variation of heat transfer could be trivial. As a result, the variation in heat transfer was very small owing to the offsetting effect of the increase in the heat transfer area and the decrease in gas velocity. The mass transfer rate was increased because it was affected only by the area. In the membrane humidifier, we assume that the heat and mass transfer rates increased because the effect of the increasing area is larger than that of the decreasing velocity.
However, in the metal foam humidifier, as the velocity decreases, the heat transfer through the metal and the membrane decreases. This is because the conduction heat transfer through the metal is very large. In this regard, it is greater in the metal foam humidifier—the reduction in velocity could affect the reduction in the heat transfer rate—than in the membrane humidifier. Therefore, it is considered advantageous to increase the diameter of the tube as much as possible in the design of the humidifier.
Figure 10C shows the heat and mass transfer characteristics according to shell diameter. The calculation factors are shown in Table 2. The heat and mass transfer rates decrease as the shell diameter increases. As the diameter of the shell increases, the flow velocity decreases because the flow rate is constant. Thus, the Reynolds number and Nusselt number decrease and, thus, the heat transfer coefficient decreases on the exhaust gas. Finally, the total heat transfer rate decreases as the total heat transfer coefficient decreases. The characteristics of mass transfer rate are analogous to that of the heat transfer rate. This is because an increase in the heat transfer rate makes the temperature of the membrane rise and, thus, the mass transfer coefficient increases. Therefore, we think that shortening the diameter of the shell is advantageous to developing the heat and mass transfer rate in the design of the humidifier.
4. Conclusions
This study investigates how heat and mass transfer characteristics of a shell-and-tube membrane humidifier are influenced by many different types of porous metal foams in the flow channel by simulations with MATLAB and Simulink (The MathWorks, Inc., Natick, MA, USA). In addition, we analyzed several operating conditions and different structures of the metal foam humidifier to find the proper mixture to improve humidifier efficiency.
Within the scope of this study, the influences of the following parameters on the performance of the modeled humidifier have been demonstrated:
- Effective heat conductivity—as the metal foam’s effective heat conductivity increased, the heat and mass transfer rates of the humidifier increased proportionally.
- Compression ratio—as the metal foam compression ratio increased, the pore diameter became smaller and the porosity increased. As the metal foam compression ratio increased, the heat and mass transfer rates decreased.
- Flow rate—as the exhaust gas flow rate increased, the heat and mass transfer rates increased logarithmically. As the dry air flow rate increased, the heat transfer rate increased logarithmically and the mass transfer rate increased and then decreased.
- Temperature—as the exhaust gas temperature increased, the heat and mass transfer rate increased. As the drying air temperature increased, the heat and mass transfer rates decreased.
- Relative humidity—as the exhaust gas relative humidity increased, the heat and mass transfer rates also increased. As the dry air relative humidity increased, the mass transfer rate decreased.
- Thickness—as the membrane thickness increased, the heat and mass transfer rates decreased.
- Diameter—as tube diameter increased, the heat and mass transfer rates increased. As shell diameter increased, the heat and mass transfer rates decreased.
Author Contributions
Conceptualization, H.J.; Data curation, H.J.; Formal analysis, S.-K.P.; Funding acquisition, S.-K.P. and Y.-S.K.; Investigation, S.-K.P. and B.C.C.; Methodology, H.J.; Resources, M.-H.K.; Software, H.J. and S.-K.P.; Supervision, S.-K.P.; Visualization, Y.-S.K. and B.C.C.; Writing—original draft, H.J.; Writing—review & editing, M.-H.K., Y.-S.K. and B.C.C. All authors have read and agreed to the published version of the manuscript.
Funding
This research did not receive any specific grant from funding agencies in the public, commercial, or not-for-profit sectors.
Conflicts of Interest
The authors declare no conflict of interest.
Nomenclature
| Alphabet: | ||
| A | Area | m2 |
| Ae | Area density | m2 m−3 |
| A | Activity | Pa Pa−1 |
| C | Specific heat | kJ kg−1 K−1 |
| Concentration | kmol m−3 | |
| Coefficient | (-) | |
| D | Hydraulic diameter | m |
| d | Diameter | m |
| e | Coefficient | (-) |
| h | Convection Coefficient | W m−2 K−1 |
| Enthalpy | kJ | |
| K | Hydraulic permeability | m2 |
| k | Conductivity Coefficient | W m−1 K−1 |
| M | Molar mass | kg kmol−1 |
| m | Mass | kg |
| Nu | Nusselt number | (-) |
| P | Pressure | Pa |
| Pr | Prandtl number | (-) |
| Q | Heat transfer | kJ |
| q | Heat transfer rate | kW |
| RH | Relative humidity | (-) |
| Re | Reynolds number | (-) |
| T | Temperature | K |
| t | Thickness | m |
| U | Overall heat transfer coefficient | W m−2 K−1 |
| u | Internal energy | kJ |
| Superscripts, subscripts: | ||
| A | Pore | |
| C | Cool | |
| D | Dry side | |
| E | Exhaust side | |
| Eff | Effective | |
| F | fluid | |
| H | High | |
| I | Inlet | |
| M | Mean, Membrane | |
| mem-dry | Membrane dried | |
| O | Outlet | |
| P | Constant pressure | |
| S | Solid, Superficial, Strut, Shape | |
| Sat | Saturation | |
| T | Empiricism | |
| Tr | Transfer | |
| V | Constant volume | |
| V | Vapor | |
| W | Membrane diffusion | |
| ˙ | Rate of change d/dt | |
| 0 | Standard condition | |
| Greek symbols: | ||
| α | Thermal diffusivity | m2 s−1 |
| ε | Porosity | (-) |
| μ | Viscosity | m2 s−1 |
| υ | Velocity | m s−1 |
| ν | Dynamic viscosity | m2 s−1 |
| △ | Differential | (-) |
| λ | Water content | kg kg−1 |
| ρ | Density | kg m−3 |
References
- Larminie, J.; Dicks, A. Fuel Cell Systems Explained, 2nd ed.; Wiley: Hoboken, NJ, USA, 2003. [Google Scholar]
- Sabharwal, M.; Duelk, C.; Bhatia, D. Two-dimensional modeling of a cross flow plate and frame membrane humidifier for fuel cell applications. J. Membr. Sci. 2012, 409, 285–301. [Google Scholar] [CrossRef]
- Khazaee, I.; Sabadbafan, H. Effect of humidity content and direction of the flow of reactant gases on water management in the 4-serpentine and 1-serpentine flow channel in a PEM (proton exchange membrane) fuel cell. Energy 2016, 10, 252–265. [Google Scholar] [CrossRef]
- Maricle, D.L.; Nagle, D.C. Carbon Foam Fuel Cell Components. U.S. Patent 4125676, 14 November 1978. [Google Scholar]
- Zhang, G.; Bao, Z.; Xie, B.; Wang, Y.; Jiao, K. Three-dimensional multi-phase simulation of PEM fuel cell considering the full morphology of metal foam flow field. Int. J. Hydrogen Energy 2020. [Google Scholar] [CrossRef]
- Afshari, E. Computational analysis of heat transfer in a PEM fuel cell with metal foam as a flow field. J. Therm. Anal. Calorim. 2020, 139, 2423–2434. [Google Scholar] [CrossRef]
- Kang, D.G.; Lee, D.K.; Choi, J.M.; Shin, D.K.; Kim, M.S. Study on the metal foam flow field with porosity gradient in the polymer electrolyte membrane fuel cell. Renew. Energy 2020, 156, 931–941. [Google Scholar] [CrossRef]
- Tsai, B.T.; Tseng, C.J.; Liu, Z.S.; Wang, C.H.; Lee, C.I.; Yang, C.C.; Lo, S.K. Effects of flow field design on the performance of a PEM fuel cell with metal foam as the flow distributor. Int. J. Hydrogen Energy 2012, 37, 13060–13066. [Google Scholar] [CrossRef]
- Afshari, E.; Houreh, N.B. Performance analysis of a membrane humidifier containing porous metal foam as flow distributor in a PEM fuel cell system. Energy Convers. Manag. 2014, 88, 612–621. [Google Scholar] [CrossRef]
- Zhao, C.Y.; Lu, T.J.; Hodson, H.P. Natural convection in metal foams with open cells. Int. J. Heat Mass Transf. 2005, 48, 2452–2463. [Google Scholar] [CrossRef]
- Hwang, J.J.; Hwang, G.J.; Yeh, R.H.; Chao, C.H. Measurement of interstitial convective heat transfer and frictional drag for flow across metal foams. J. Heat Transf. 2002, 124, 120–129. [Google Scholar] [CrossRef]
- Wang, Y.; Wang, C.Y. Simulation of flow and transport phenomena in a polymer electrolyte fuel cell under low-humidity operation. J. Power Sources 2005, 47, 148–161. [Google Scholar] [CrossRef]
- Park, S.K.; Choe, S.Y.; Choi, S.H. Dynamic modeling and analysis of a shell-and-tube type gas-to-gas membrane humidifier for PEM fuel cell applications. Int. J. Hydrogen Energy 2008, 33, 2273–2282. [Google Scholar] [CrossRef]
- Incropera, F.P.; Dewitt, D.P.; Bergman, T.L.; Lavine, A.S. Fundamentals of Heat and Mass Transfer, 6th ed; Wiley: Hoboken, NJ, USA, 2007. [Google Scholar]
- Zhao, C.Y. Review on thermal transport in high porosity cellular metal foams with open cells. J. Heat Mass Transf. 2012, 55, 3618–3632. [Google Scholar] [CrossRef]
- Calmidi, V.V.; Mahajan, R.L. Forced convection in high porosity metal foam. J. Heat Transf. 2000, 122, 557–565. [Google Scholar] [CrossRef]
- Dukhan, N.; Patel, P. Equivalent particle diameter and length scale for pressure drop in porous metals. Exp. Therm. Fluid Sci. 2008, 32, 1059–1067. [Google Scholar] [CrossRef]
- Lacroix, M.; Nguyen, P.; Schweich, D.; Huu, C.P.; Sabine, S.P.; Edouard, D. Pressure drop measurements and modeling on SiC foams. Chem. Eng. Sci. 2007, 62, 3259–3267. [Google Scholar] [CrossRef]
- Pukrushpan, J.T.; Peng, H.; Stefanopoulou, A.G. Simulation and analysis of transient fuel cell system performance based on a dynamic reactant flow model. ASME Int. Mech. Eng. Congr. Expo. 2002, 637–648. [Google Scholar] [CrossRef]
- Coquard, R.; Rochais, D.; Baillis, D. Experimental investigations of the coupled conductive and radiative heat transfer in metallic/ceramic foams. J. Heat Mass Transf. 2009, 52, 4907–4918. [Google Scholar] [CrossRef]
- Giani, L.; Groppi, G.; Tronconi, E. Mass-transfer characterization of metallic foams as supports for structured catalysts. Ind. Eng. Chem. Res. 2005, 44, 4993–5002. [Google Scholar] [CrossRef]
- Nguyen, T.V.; White, R.E. A water and heat management model for proton-exchange-membrane fuel cells. J. Electrochem. Soc. 1993, 140, 2178–2186. [Google Scholar] [CrossRef]


© 2020 by the authors. Licensee MDPI, Basel, Switzerland. This article is an open access article distributed under the terms and conditions of the Creative Commons Attribution (CC BY) license (http://creativecommons.org/licenses/by/4.0/).