Article

Influence of Lightning Current Model on Simulations of Overvoltages in High Voltage Overhead Transmission Systems

Power Electrical Engineering Division, AGH University of Science and Technology, 30-059 Kraków, al. Mickiewicza 30, Poland
Energies 2020, 13(2), 296; https://doi.org/10.3390/en13020296
Submission received: 13 November 2019 / Revised: 23 December 2019 / Accepted: 3 January 2020 / Published: 7 January 2020

Abstract

:
The analysis of lightning overvoltages generated in electrical power systems has a great meaning for the designers and exploitation engineers because it creates bases for the optimization of construction overhead transmission lines and high voltage substations, reducing costs and increasing reliability of the transmission and distribution of electrical energy. Lightning overvoltages generated in electrical power systems with overhead transmission lines are a result of complex, nonlinear, and surge phenomena occurring in the structure of line towers and electrical substation when the lightning current is flowing through them. Methods of overvoltage stress analysis are intensely developed, and one of the directions is working out models of high voltage electrical devices and phenomena in electrical networks, which influence the shape and values of overvoltage risks. The model of lightning current has a significant influence on the courses of overvoltages in high voltage transmission systems. The paper is focused on the analysis of the influence of the model of lightning current making use of simulations of the shape, and maximal values of overvoltages generated in high voltage transmission systems during a direct lightning strike to the overhead lines. Two models of lightning current used in simulations with the Electromagnetic Transients Program/Alternative Transient Program (EMTP/ATP) were analyzed, i.e., the Heidler model and CIGRE (Conseil International des Grands Réseaux Électriques) model. The EMTP/ATP computer program is very often used in simulations of overvoltages in electrical networks. Unfortunately, the users get no information on the criterion to be used when selecting the model of lightning current used in the simulations. The analysis presented in the paper gives practical knowledge about the effect of the use of a particular kind of lightning current model on the results of simulations of lightning overvoltage propagation in electrical networks, overvoltage protection, as well as on theoretical and practical aspects of the insulation coordination in high voltage transmission systems.

1. Introduction

Continuous efforts to increase the reliability of the electrical energy supply necessitate working out power systems, which should be designed, run, and maintained to minimize the probability of the system failures. One of the fundamental requirements for a highly reliable electrical energy supply is assuring the continuity of work of transmission systems, mainly composed of overhead high voltage lines.
A reliable operation of the transmission and distribution systems can be ensured by components with an insulation system designed for electrical strength, suitable for the expected stresses. On the other hand, there is a tendency to decrease insulation levels, mainly for economic reasons. These contradictory suggestions necessitate the optimization of a technical solution for insulation systems. This requires a detailed analysis of the stresses to which these systems are exposed. The main part of the transmission lines stresses, defining requirements for the electrical network’s insulation and crucial for its reliable operation are overvoltages. It is particularly overvoltages generated during lightning discharges, whose maximal values may be many times higher than the network voltage, which are responsible for the basic hazard of insulation breakdown [1,2,3,4,5,6,7].
Overvoltages generated by lightning discharges to shielding wires or phase conductors of transmission lines are a result of complex, nonlinear, and surge phenomena occurring in the structure of line conductor towers and electrical substations when the lightning current is flowing through them. Thorough knowledge of lightning current parameters is essential for appropriate risk analysis of insulation systems in overhead transmission lines and electrical devices of power substations during lightning discharges. Electrical networks are too complex for analytical solutions. Therefore, computer simulations are usually used for the determination of high-frequency lightning overvoltages. In the simulation programs, suitable models of electrical equipment and transient phenomena of the electric networks should be implemented. The model of lightning current has a very important influence on time courses and the maximal values of lightning overvoltages [8,9,10,11,12,13].
The influence of the mathematical model of lightning current on simulation of overvoltages generated in high voltage electrical network with overhead transmission lines was analyzed in the paper. Simulation results of lightning overvoltages performed with the electromagnetic transients program/alternative transients program (EMTP/ATP) were used as a basis for the analysis. Two models of lightning current implemented in EMTP/ATP were taken into account in the simulations. The analysis gives a practical knowledge regarding the consequences of the selection of lightning current model on the results of simulations of lightning overvoltage in electrical high voltage transmission systems, the overvoltage protection, as well as on theoretical and practical aspects of the insulation coordination in high voltage electrical networks.

2. Models of Lightning Current

The time course of lightning currents has been analyzed in many publications [4,10,14,15,16,17,18]. Two models of lightning current were very often used in technical practice. The models proposed by the CIGRE and Heidler’s model will be used in the following analysis. These models were implemented in EMTP/ATP. The EMTP/ATP program was very often used for the simulations of transient phenomena in exploitation conditions in high voltage electrical networks, and in addition lightning overvoltages.
Heidler’s model of lightning current (Figure 1a) [10,18] is expressed in the following form:
i p ( t ) = I m η ( t T ) n 1 + ( t T ) n e t τ
where: Im—maximal value of current, kA, η = 0.93, T = 19 μs, τ = 483 μs, n = 10 (for first negative and positive discharges), η = 0.993, T = 0.454 μs, τ = 143 μs, n = 10 (for the successive negative discharges) [5].
According to CIGRE, the lightning current time course has a triangle form (Figure 1b) [4,10,19]. Time T1 is calculated with the use of the following formula:
T 1 = I m S m
where: Im—maximal value of lightning current, kA, Sm—maximal steepness of lightning current (Sm = 24.3 kAµs−1—for the first stroke, Sm = 39.9 kA µs−1—for the successive strokes), T2—wave tail time to half value, µs (the median value of T2 is 77.5 µs, and the average of T2 is 91.5 µs).

3. Modeling of Electrical Networks for the Simulation of Lightning Overvoltages

A model of part of the high voltage electrical network with overhead transmission lines was prepared for modeling lightning overvoltages. Overhead lines, grounding systems, towers, insulators, back flashover phenomena in the insulators, and surge arresters were modeled.
The JMarti’s model of overhead lines, implemented in the electromagnetic transients program/alternative transients program EMTP-ATP—taking into account the frequency dependences of phase and shielding conductor parameters—was used to model transmission lines [10].
Towers were represented as short lines and modeled, taking into account their surge impedance and length [20,21,22]. The nonlinear resistance of the earthing system of the towers during flowing of the lightning current was approximated with the use of the formula:
R u ( i ) = R s t 1 + i I g
where:
I g = ρ e E g 2 π R 2 s t
Rst—static resistance of the grounding system, Ω. Eg—soil ionization electric field strength, V m−1 (Eg = 300–400 kV m−1). ρe—resistivity of soil, Ωm (ρe = 100–300 Ωm) [23].
The insulators were represented by capacitors of 80 pF connected between the respective phase conductors and the tower [23].
The back flashover mechanism on the insulators was represented by the leader development method. This method was partly based on experimental results, which in turn led to some analytical formulations. A set of differential equations leader development was solved, and then the volt-time breakdown characteristic was obtained in a numerical process that could be related to physical phenomena. In the numerical algorithm, the first leader velocity was empirically formulated as a function of applied voltage, leader length, gap length, gap geometry, and electric field intensity with two contributing factors, i.e., the leader core and corona cloud. The time to the breakdown tc can be expressed as [4,24,25,26]:
tc = ti + ts + tl
where: ti—corona inception time (assumed zero), s. ts—streamer propagation time, s. tl—leader propagation time, s.
For ts it is possible to write the following formula:
1 t s 0 t s   u ( t )   d t = a
where: a = 400 g + 50—for positive polarity voltage, kV, a = 450 g + 150—for negative polarity voltage, kV, u(t)—voltage on insulator, kV, g-gap length, m.
For tl:
d l i d t = k u ( t ) [ u ( t ) g l i E o ]
where: E0—minimum leader progression electric field strength, V m−1, ll—leader length, m, k—leader coefficient, m2 kV2 s−1 (Table 1).

4. Characteristic of Part of the 220 kV Electrical Network with Overhead Transmission Lines

Overvoltages generated during lightning strikes to the overhead transmission lines of 220 kV were simulated with the use of the Electromagnetic Transients Program-Alternative Transients Program (EMTP-ATP) [10] (Figure 2). Two different models of lightning current (Figure 1) were used in simulations.
Two overhead transmission lines of 220 kV supplied the power substation with an autotransformer of 160 MVA, 220/110 kV (Figure 2a). The cross-section of the phase conductors was 525 mm2 that of the shielding wires—70 mm2. The line insulators were 1270 mm long. The protection angle δ of the tower equaled to 22 grades (Figure 2b).
The maximum peak values Ip max of the lightning current, which can strike to the phase conductor of the line, despite the protection of the line with shielding wires, calculated with the formula
I p m a x = [ ( d F O 2 + ( h t y ) 2 + 2 y 1.34 ( h t 0.6 y 0.6 s i n   δ ) ] 1.35
where: ht—shielding wire height, m, y-average phase conductor height, m, δ—the protection angle of the tower, deg, dFO—horizontal displacement of phase conductor and shielding wire, m is equal to 14.08 kA [29,30,31].
Metal oxide surge arresters of type PEXLIM P 192 were connected to the phase conductors in the power substation and to the clamps of the autotransformer (Figure 2) [26,27,32].

5. Model of Part of the Electrical Network of 220 kV Prepared in EMTP-ATP

The influence of the lightning current model on lightning overvoltages in high voltage transmission lines was analyzed on the basis of results of simulation performed with the electromagnetic transients program/alternative transients program (EMTP/ATP). For this purpose, a model of part of the electrical network with overhead transmission lines 220 kV, presented in Figure 2, was prepared. Overvoltages generated at Points (1) and (2) (Figure 2) during lightning strikes to shielding wires and phase conductors at Point (1) were simulated.
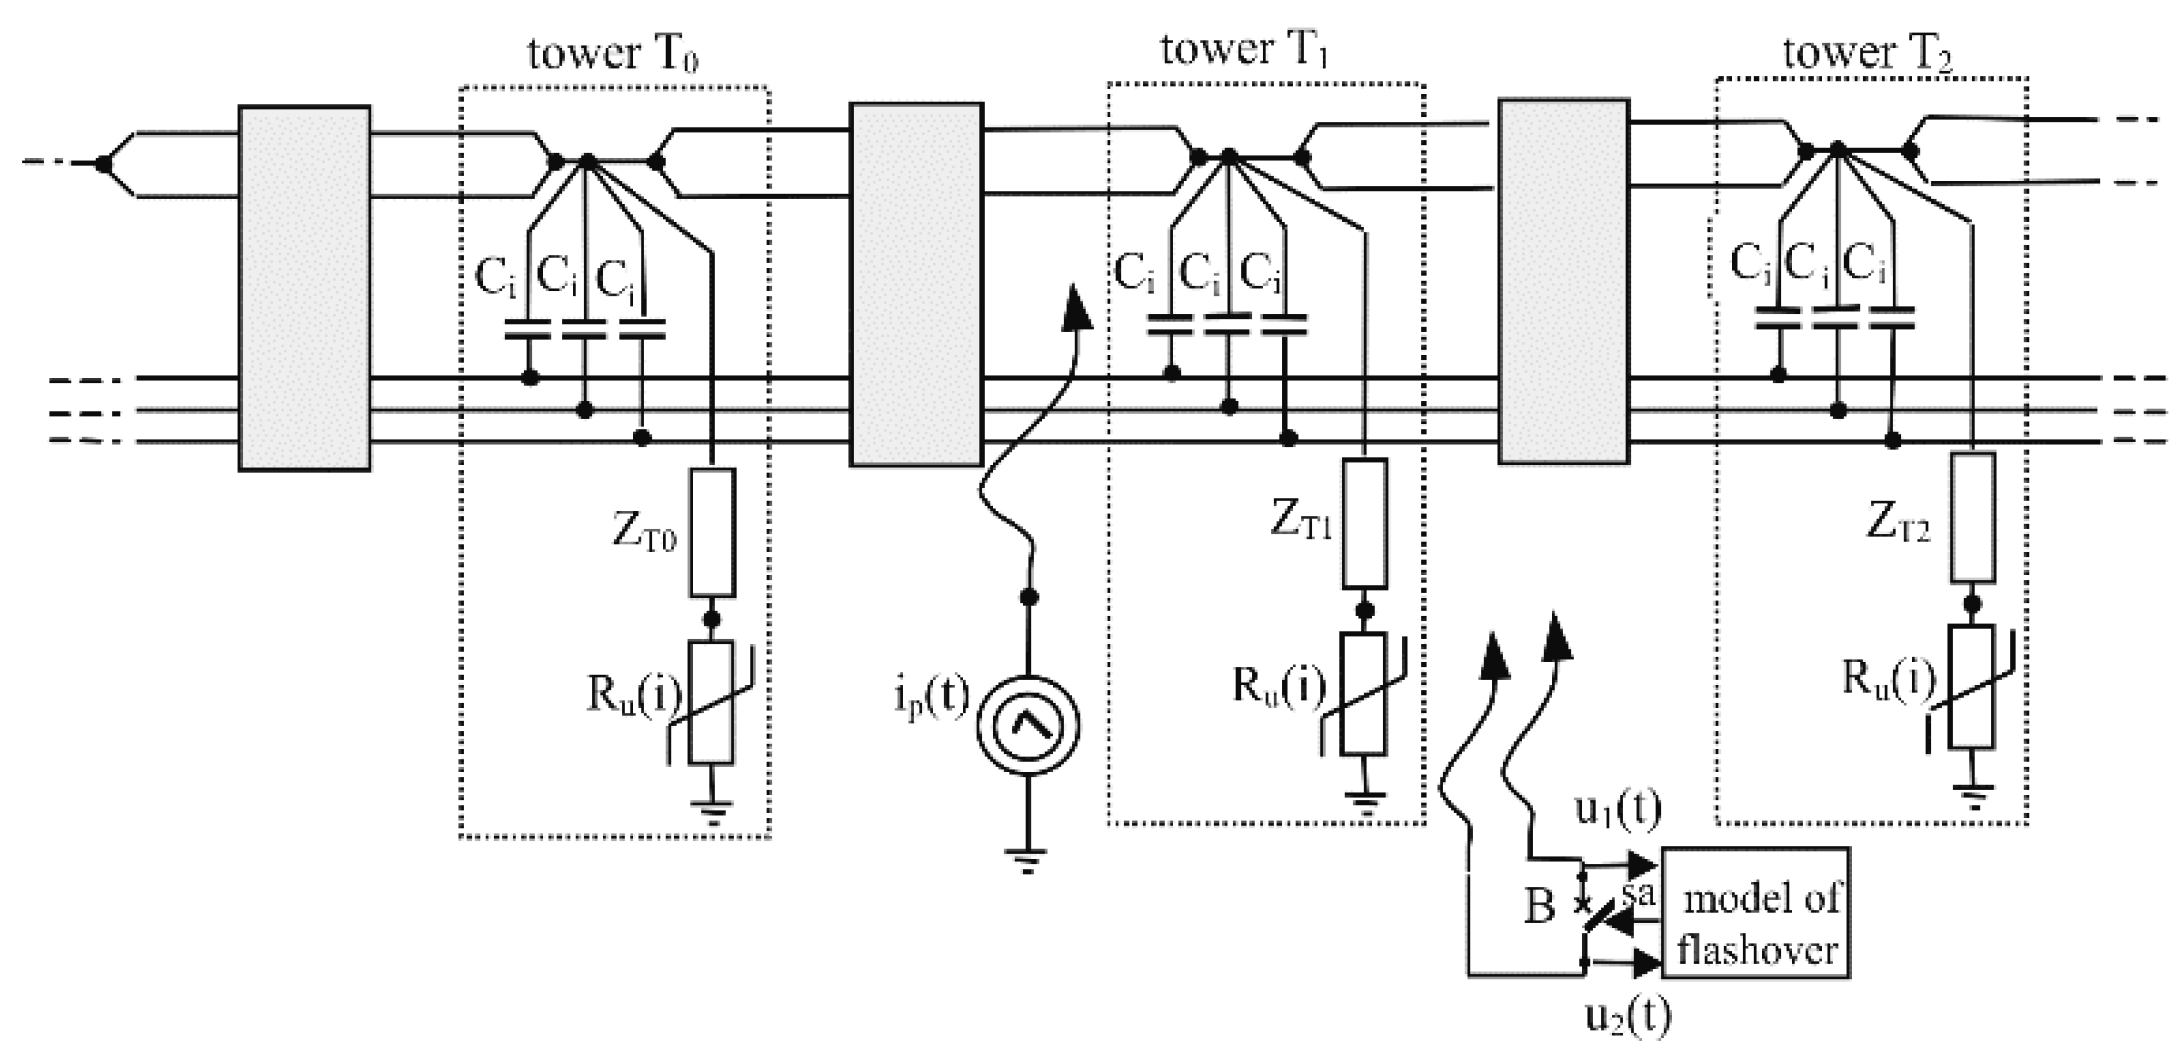
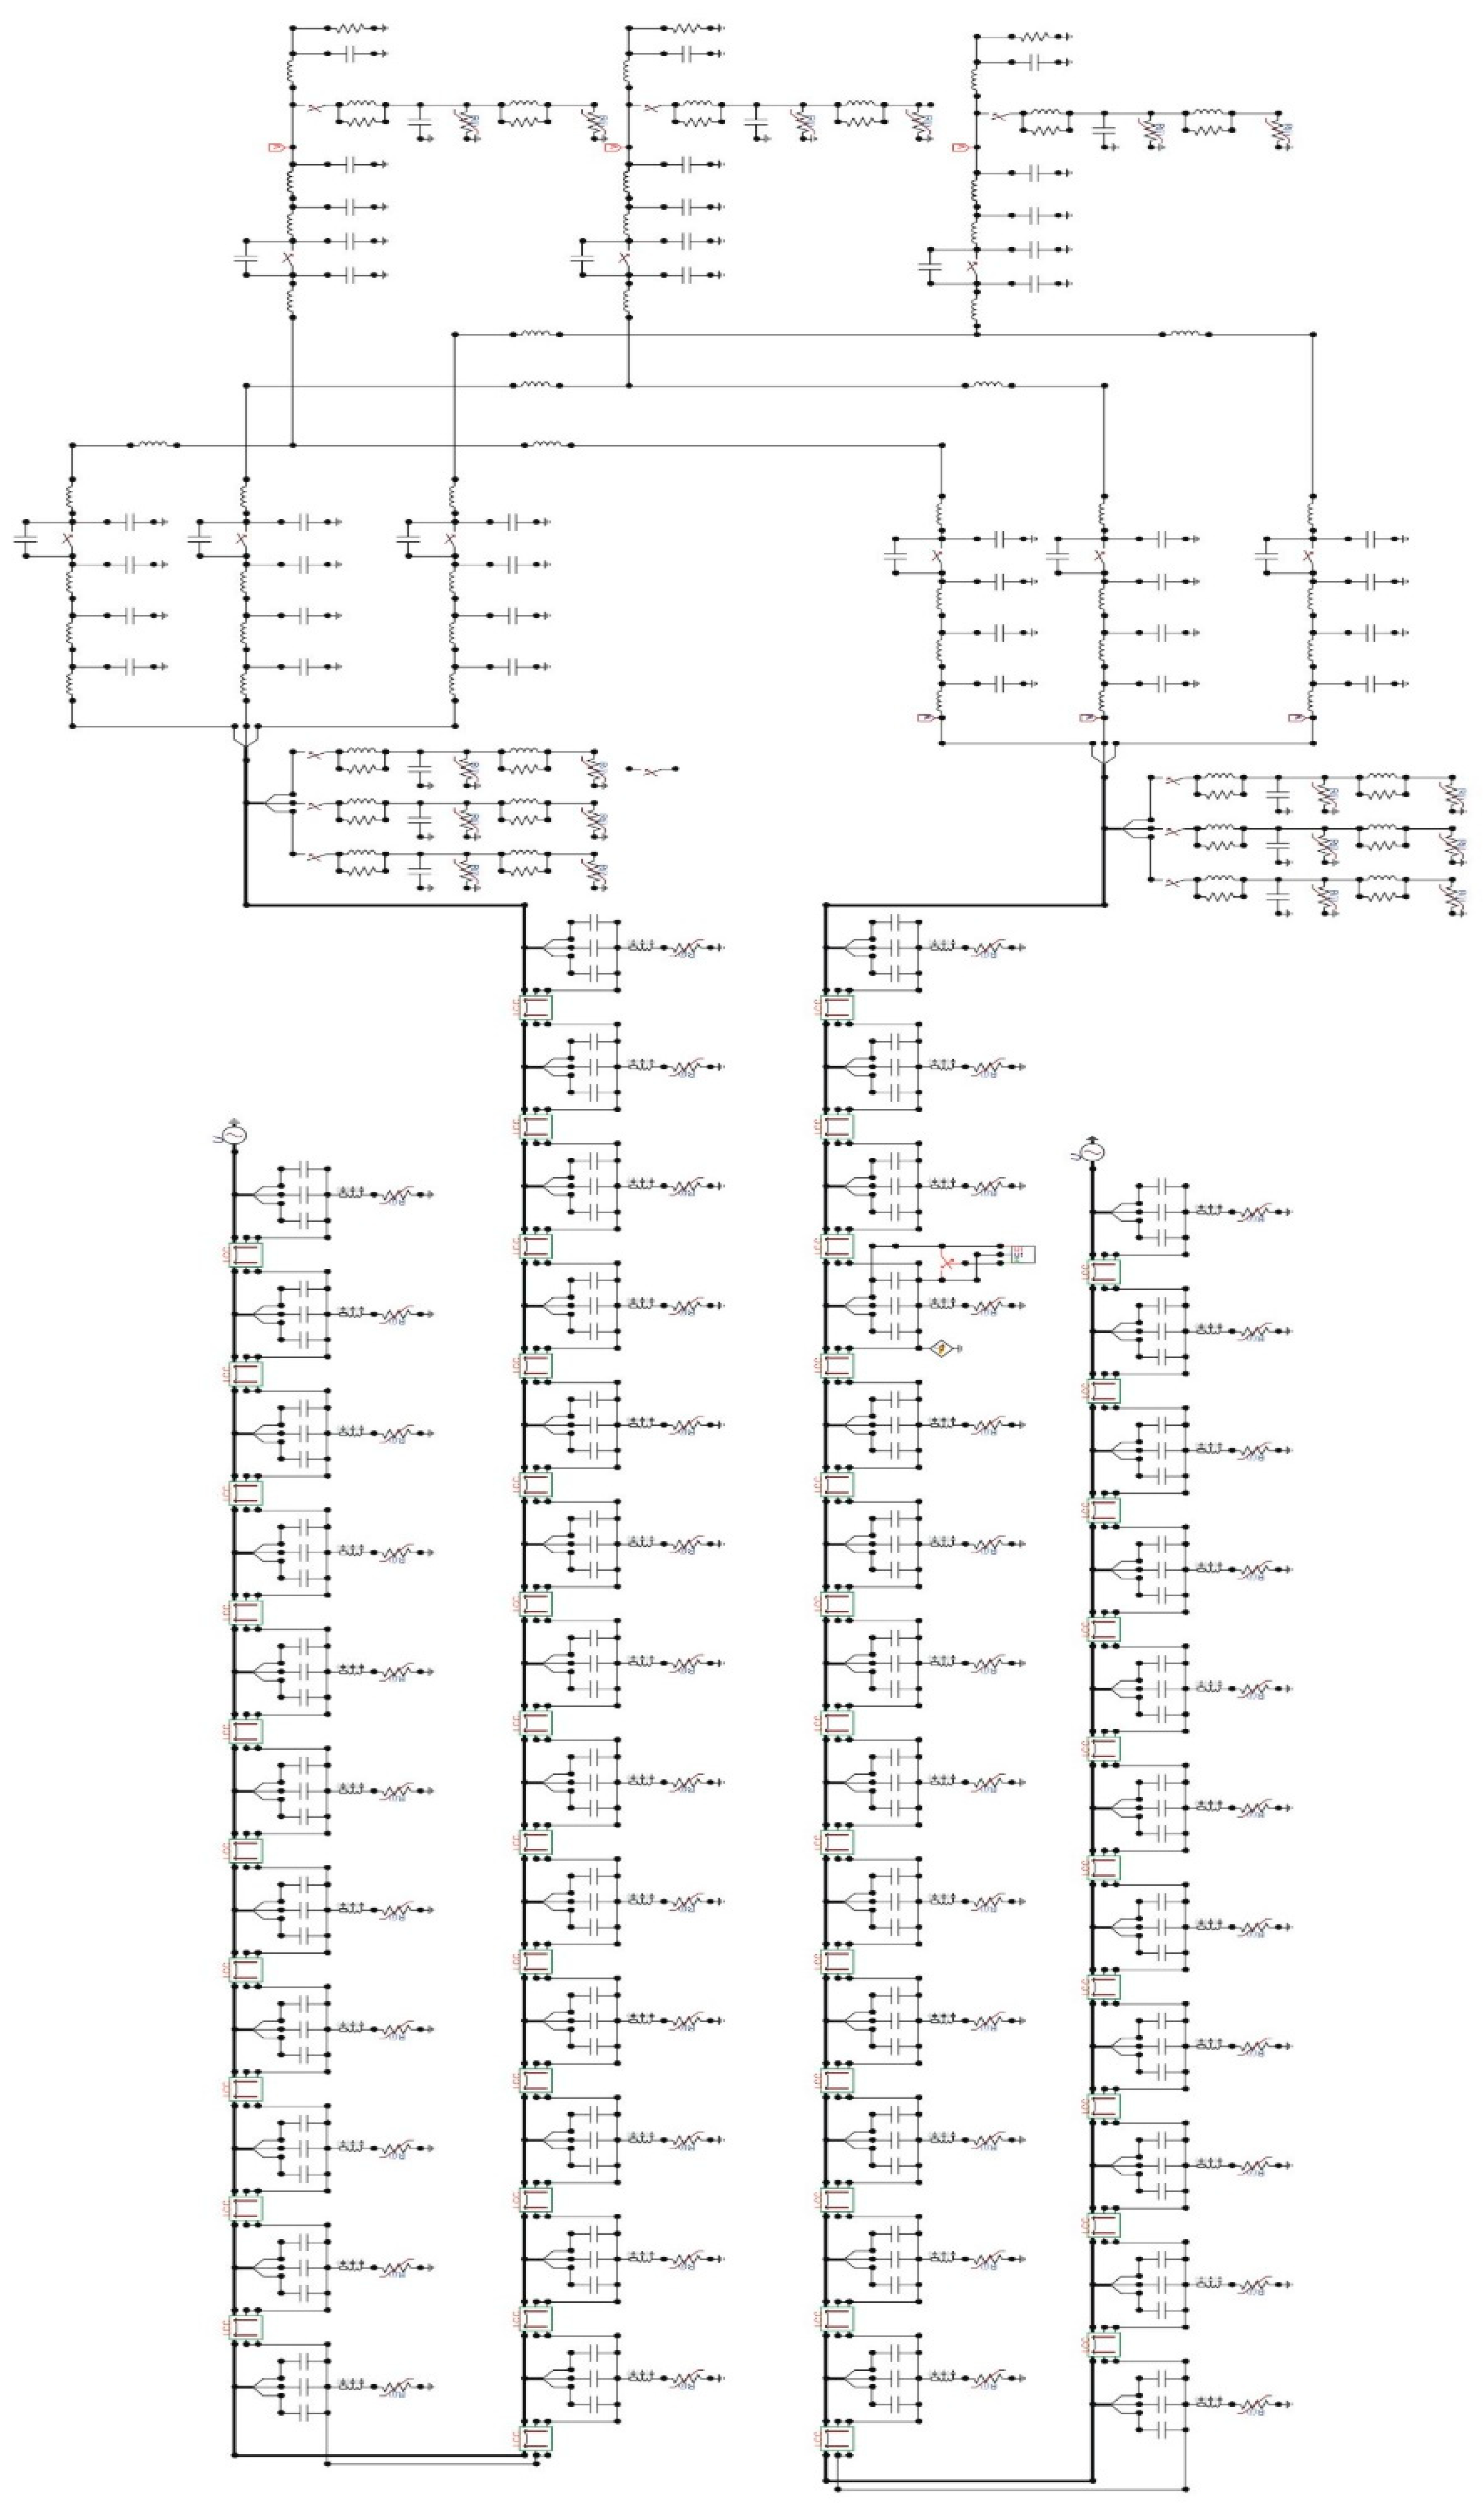
The overhead transmission lines were represented by JMarti’s model, considering the distributed nature and frequency-dependent line parameters. Every span was modeled as a selected part of the line. Towers were represented by their impedance [20,21,22]. The basic model of overhead lines together with the flashover model is presented in Figure 3 and the complete model of part of the electrical network prepared in EMTP/ATP is placed in Figure 4.
The model of a flashover on insulators took into account the leader development method and made use of Formulas (5)–(7) in the environment MODELS of the program EMTP/ATP [10]. The nonlinear voltage–current characteristic of the earthing the system of the tower was taken into account in the line model with Formula (3). Line insulators were substituted by the condensators with a capacitance of 80 pF.
The autotransformer was modeled with the use of a parallel-connected transformer capacitance of 4.5 nF and winding surge impedance of 5000 Ω [33]. The capacitance of the potential transformers was equal to 350 pF. The capacitance of the measurement transformers was 810 pF. Circuit breakers were modeled by taking into account the capacitances of insulators and capacitances between electrodes of an open breaker. The capacitance of the insulator was 50 pF, and capacitances between electrodes of the open breaker 5 pF [33]. The inductance of connections between devices in the substation was taken into account too. The unit inductance of phase conductors equaled to 1.34 μH m−1 [33].

6. Results of Simulations of Overvoltages Generated during Lightning Strokes to Overhead Transmission Lines

The analysis of overvoltages in high voltage electrical network generated during lightning strikes modeled by two different lightning current models was based on computer simulations of overvoltages in the part of the real electrical network presented in Figure 2. Simulations were done on the assumption that a lightning strike occurred to the overhead line of 220 kV (Point 1, Figure 2). The distance between the lightning strike and the power substation was 900 m. The overvoltages were calculated for a lightning strike to shielding wires and to the phase conductor. Simulations were done for the lightning strikes with a maximum value of 33.3 kA to the shielding wire (the median maximum value of lightning strokes) [4,6,19], as well as with the maximum value of 14.08 kA to the phase conductor (Equation (8)).
The simulation results have a form of time courses of overvoltages on the tower of the overhead line of 220 kV (Point 1, Figure 2a) and on the terminals of the transformer windings (Point 2, Figure 2a) in the power substation (Figure 5 and Figure 6). The maximal values of overvoltages are shown in Table 2.
The beginning part of the overvoltages courses on the towers was the result of lightning current distribution between the tower and the shielding wires (Figure 5). It can be seen that the course and the maximum value of overvoltage on the tower depended on the shape of the lightning current, especially on the steepness of the current surge, represented by different models of lightning current used in simulations. The largest overvoltages were generated during action lightning current modeled with the CIGRE model (Figure 1) (Table 2). Smaller values of overvoltages can be observed when Heidler’s model for the successive discharges was used (Figure 1b). Simulated overvoltages mostly have smaller values when the lightning current was modeled with Heidler’s model for the first lightning discharge.
The analysis of the simulation results of lightning overvoltages in overhead transmission lines revealed that metal oxide surge arresters limited the maximal values of overvoltages generated at phase conductors in an electrical power substation. We can also see that during lightning strike of 33.3 kA to the shielding wire at a distance of 0.9 km from the substation (Point 1, Figure 2a), the maximum value of overvoltages on the line terminals of the transformer (Point 2) with metal oxide surge arresters was equal to 400 kV (when CIGRE model was used). Whereas for the transformer without surge arrester overvoltages, it was 2500 kV. When Heidler’s model of lightning current for the first stroke was used in simulations, the maximal values of overvoltages were 200 kV and 220 kV, respectively. When Heidler’s model for the successive strokes was applied, the respective values equaled to 320 kV and 280 kV.
The presented computer simulations of overvoltages generated during a lightning strike to the overhead transmission lines showed that the selected lightning current model implemented in the electromagnetic transients program/alternative transients program (EMTP/ATP) and used in simulations of overvoltages in the electrical network had a great influence on the simulation results. The simulated overvoltages with the highest maximal values were observed when the lightning current was modeled with the CIGRE model.

7. Conclusions

Overvoltages generated with the lightning discharges to shielding wires, or phase conductors of overhead transmission lines are a result of complex, nonlinear, and surge phenomena occurring in the structure of the line conductors, towers, and electrical substation when the lightning current was flowing through them. Nowadays, such analyses are usually based on computer simulations of overvoltage phenomena. The influence of a mathematical model of lightning current, implemented in the electromagnetic transients program/alternative transients program (EMTP/ATP), used for simulating overvoltages generated in high voltage electrical networks with overhead transmission lines was analyzed. The analysis of the simulation results revealed that the model of lightning current used in the simulations had an influence on courses and maximal values of simulated overvoltages. Simulations presented in the paper show that overvoltages in overhead transmission lines have the highest maximal values when the CIGRE model of lightning current was used. For example, maximal values of overvoltages at line towers during lightning strikes to the shielding wires modeled by the use of the CIGRE model are three times greater than overvoltages simulated using Heidler’s model for successive strokes, and 12 times greater when Heidler’s model for the first stroke was used.

Funding

This research received no external funding.

Conflicts of Interest

The author declares no conflict of interest.

References

  1. Moraes, L.; Lopes, G.; Violin, A.; Piatini, A.; Ferraz, G.; Campos, J.; Salustiano, R.; Capelini, R.; Wanderley Neto, E. Assessment of the electromagnetic coupling between lines of different voltages sharing the same structures. CIGRE Open Access Proc. J. 2017, 1, 531–534. [Google Scholar] [CrossRef] [Green Version]
  2. Kakada, K.; Sugimoto, H.; Yokoyama, S. Experimental facility for investigation of lightning performance of distribution lines. IEEE Trans. Power Deliv. 2003, 18, 253–257. [Google Scholar]
  3. IEEE W Group. Estimating lightning performance of transmission lines, II—Updates to analytical models. IEEE Trans. Power Deliv. 1993, 8, 1254–1265. [Google Scholar] [CrossRef]
  4. Armstrong, H.R.; Whitehead, E.R. Field and analytical studies of transmission line shielding. IEEE Trans. PAS 1986, 87, 270–281. [Google Scholar] [CrossRef]
  5. CIGRE WG 33-01 of Study Committee 33. Overvoltages and Insulation Coordination: Guide to Procedure for Estimating the Lightning Performance of Transmission Lines; Publ. No 63; CIGRE: Paris, France, 1991. [Google Scholar]
  6. Horvath, T. Computation of Lightning Protection; John Wiley & Sons Inc.: New York, NY, USA; Singapore, 1991. [Google Scholar]
  7. IEEE Working Group on Lightning Performance of Transmission Lines. A simplified method for estimating lightning performance of transmission lines. IEEE Trans. PAS 1985, 104, 919–932. [Google Scholar]
  8. Borghetti, A.; Napolitano, F.; Nucci, C.A.; Tossani, F. Influence of the return stroke current waveform on the lightning performance of distribution lines. IEEE Trans. Power Deliv. 2017, 32, 1800–1808. [Google Scholar] [CrossRef]
  9. Rioual, M. Short and Long Air Gaps. Insulator Strings and Spark Gaps. Modeling Studies with the EMTP Program; EPRI: Palo Alto, CA, USA, 1998. [Google Scholar]
  10. Alternative Transients Program. Rule Book; Canadian/American EMTP User Group: West Linn, OR, USA, 1999.
  11. Martinez, J.A.; Gustavsen, B.; Durbak, D. Parameter determination for modeling system transients, Part-1: Overhead lines. IEEE Trans. Power Deliv. 2005, 20, 2038–2044. [Google Scholar] [CrossRef]
  12. Masaru, I.; Tatsuo, K.; Teruya, K.; Eich, O.; Kazuyuki, S.; Kaneyoshi, M.; Takemitsu, H. Multistory transmission tower model for lightning surge analysis. IEEE Trans. Power Deliv. 1991, 6, 1327–1335. [Google Scholar]
  13. Eriksson, A.J. An improved electrogeometric model for transmission line shielding analysis. IEEE Trans. Power Deliv. 1997, 2, 871–876. [Google Scholar] [CrossRef]
  14. Chowdhuri, P. Parameters of lightning strokes and their effects on power systems. In Proceedings of the IEEE/PES Transmission and Distribution Conference and Exposition. Developing New Perspectives, Atlanta, GA, USA, 28 October–2 November 2001; p. 1. [Google Scholar]
  15. Martinez, J.A.; Ferley, C.A. Parametric analysis of the lightning performance of overhead transmission lines using an Electromagnetic Transients Program. In Proceedings of the IPST-International Conference on Power Systems Transients, New Orleans, LA, USA, 28 September–2 October 2003; pp. 1–8. [Google Scholar]
  16. Motoyama, H. Experimental study and analysis of breakdown characteristics of long air gaps with short tail lightning impulse. IEEE Trans. Power Deliv. 1996, 11, 972–979. [Google Scholar] [CrossRef]
  17. Udo, T. Estimation of lightning current wave front duration by the lightning performance of japanese EHV transmission lines. IEEE Trans. Power Deliv. 1993, 8, 660–670. [Google Scholar] [CrossRef]
  18. IEC 62305-1 Protection against Lightning, Part 1: General Principles; International Electrotechnical Commission: Geneva, Switzerland, 2013.
  19. Narita, T.; Yamada, T.; Mochizuki, A.; Zaima, E. Observation of current waveshapes of lightning strokes on transmission towers. IEEE Trans. Power Deliv. 2000, 15, 429–435. [Google Scholar] [CrossRef]
  20. Michael, A.; Darveniza, M. Tower surge impedance. IEEE Trans. Power Appar. Syst. 1979, 88, 680–687. [Google Scholar]
  21. Soares, J.; Shoreder, M.A.O.; Viscaro, S. Application of an elecromagnetic model for calculation of transient voltages in transmission towers. In Proceedings of the 26th International Conference on Lighting Protection, Cracow, Poland, 2–6 September 2002. [Google Scholar]
  22. Yoshihiro, B.; Masaru, I. Numerical electromagnetic field analysis on measuring methods of tower surge impedance. IEEE Trans. Power Deliv. 1999, 14, 630–635. [Google Scholar]
  23. Imece, A.; Durbak, D.; Elahi, H.; Kolluri, S.; Lux, A.; Doug, M.; McDermott, E.; Mousa, A.; Natarajan, R.; Rugeles, L.; et al. Modeling guidelines for fast front transient. IEEE Trans. Power Deliv. 1996, 11, 493–503. [Google Scholar]
  24. Gallagher, T.; Dudurych, I.; Corbett, J.; Val Escudero, M. Towards the improvement of the lightning performance of 110 kV unshielded overhead lines. In Proceedings of the 26th International Conference on Lighting Protection, Cracow, Poland, 2–6 September 2002; pp. 2–16. [Google Scholar]
  25. Kizilacy, M.; Neumann, C. Backflashover analysis for 110 kV lines at multi-circuit overhead line towers. In Proceedings of the International Conference on Power Systems Transients (IPST07), Lyon, France, 4–7 June 2007. [Google Scholar]
  26. Surge Arresters—Part 5: Selection and Application Recommendations; EN-60099; European Committee for Electrotechnical Standarization: Brussels, Belgium, 2013.
  27. IEEE Working Group 3.4.11. Modelling of metal oxide surge arresters. Trans. Power Deliv. 1992, 7, 302–307. [Google Scholar] [CrossRef]
  28. Collective Study. Electrical Engineer’s Guide; WNT: Warsaw, Poland, 1998. [Google Scholar]
  29. Shelemy, S.J.; Swatek, D.R. Monte Carlo Simulation of Lightning Strikes to the Nelson River HVDV Transmission Lines. 2001. Available online: www.semanticscholar.org (accessed on 15 November 2019).
  30. Shindo, M.; Suzuki, T.A. New calculation method of breakdown voltage-time characteristics of long air gaps. IEEE Trans. PAS 1989, 98, 1909–1915. [Google Scholar]
  31. Tarchini, J.A. Improvement of lightning performance of transmissions lines by of line surge arresters. In Proceedings of the 26th International Conference on Lighting Protection, Cracow, Poland, 2–6 September 2002. [Google Scholar]
  32. Insulation Co-Ordination. Part 1—Definition, Principle and Rules; EN 60071-1; European Committee for Electrotechnical Standarization: Brussels, Belgium, 2006.
  33. Greenwood, A. Electrical Transients in Power Systems; John Wiley & Sons Inc.: New York, NY, USA, 1998. [Google Scholar]
Figure 1. Models of lightning current: (a) Model of lightning current proposed by CIGRE [4,10,19], Heidler’s model of lightning current: T1 = 10 μs, T2 = 350 μs (for first negative and positive discharges), (b) T1 = 0.1 μs, T2 = 25 μs (for the successive negative discharges) [10,18].
Energies 13 00296 g001
Figure 2. (a) Substitute scheme of the part of the overhead transmission lines and power substation of 220 kV, (b) basic dimensions of the tower of 220 kV overhead transmission lines [28]: 1—Point of lightning strokes; 2, 3—the points for simulations of overvoltages.
Energies 13 00296 g002
Figure 3. Model of overhead transmission lines with two shielding wires for simulation of the lightning overvoltages: Ip —lightning current, ZTi(i=0,1,2…)—impedance of towers, Rui(i=0,1,2…)—nonlinear resistance of earthing systems, Ci —capacity of line insulators.
Energies 13 00296 g003
Figure 4. Model prepared in electromagnetic transients program/alternative transients program (EMTP/ATP) of the part of the electrical network presented in Figure 2 used in simulations of lightning overvoltages.
Energies 13 00296 g004
Figure 5. Overvoltages at the part of the electrical network with overhead transmission lines of 220 kV (Figure 2) simulated during the lightning stroke to the shielding wire (33.3 kA) in Point 1 of line: (a,b) Power substation without surge arresters, (c,d) power substation with surge arresters: (a,c) Overvoltages at the tower (Point 1), (b,d) overvoltages between phase conductor and earth (Point 2): 1-CIGRE model for the lightning current, (2,3) Heidler’s model ((2) first stroke, (3) successive strokes).
Energies 13 00296 g005
Figure 6. Overvoltages at the part of the electrical power system with overhead transmission lines of 220 kV (Figure 2) simulated during the lightning strike to the phase conductor (14.08 kA) in Point 1 of the line: (a,b) Power system without surge arresters, (c,d) power system with surge arresters: (a,c) Overvoltages at the tower (Point 1), (b,d) overvoltages between phase conductor and earth (Point 2): 1–CIGRE model for the lightning current, (2,3) Heidler’s model ((2) first stroke, (3) successive strokes).
Energies 13 00296 g006
Table 1. Values of k and Eo for practical configuration [23].
ConfigurationPolarityk
m2 kV2 s−1
Eo
kV m−1
air gaps post insulatorspositive0.8600
negative1.0670
cap and pin insulatorspositive1.2520
negative1.3600
Using the differential Equation (7), the leader length was solved as a function of time. Surge arresters were represented by a high-frequency model of IEEE Working Group 3.4.11 [27].
Table 2. Maximal values of overvoltages generated in selected points in the part of the electrical network with overhead transmission lines of 220 kV (Figure 2) determined on the basis of the results of simulation of transient voltage presented in Figure 5 and Figure 6.
The Point of Electrical Network (Figure 2)Substation
with Surge Arresters
Substation
without Surge Arresters
Model of CIGREHeidler’s Model (for First Stroke)Heidler’s Model (for Successive Strokes)Model of CIGREHeidler’s Model (for First Stroke)Heidler’s Model (for Successive Strokes)
u
kV
33.3 kA (lightning strike to the shielding wire)
Point 16000500200060005002000
Point 24402002802500220320
14.08 kA (lightning strike to the phase conductor)
Point 14209028050090300
Point 2240240240550490560