Abstract
The combination of coal precise mining and information technology in the new century is one of the important directions for the future development of coal mining. Taking the fully mechanized top coal caving condition of a thick coal seam in the 90,101 working face of Baoshan Yujing Coal Mine in Shanyin City, Shanxi Province as an example, the intelligent identification method of section coal pillar stability was studied. The load transfer law of overlying strata in the upper part of coal pillar was analyzed, and the coal pillar values of each index were obtained by using an empirical formula, mean impact value-genetic algorithm-BP neural network (MIV-GA-BP) simulation experiment, and finite difference algorithm. The Delphi index evaluation system was used to calculate the optimal value of the coal pillar. The results showed that the non-contact cantilevered triangle on the two wings of the coal pillar in the goaf reduced the stress on the coal pillar; according to the width of the coal pillar at 10 m, 14 m, 16 m, and 20 m, combined with the relationship between the plastic zone and the core zone of coal pillar, and the relationship between the stress field and the ultimate strength of coal pillar, the numerical simulation value of the coal pillar was determined. The MIV (mean impact value) characteristics screened out the influencing factors of coal pillar width in the section near the horizontal fully mechanized top coal caving face order of importance; the relative error between the predicted value and the expected value of the MIV-GA-BP simulation experiment was less than 5%, which has good stability for the multi-factor nonlinear coupling prediction problem; and the optimal value of the coal pillar was 16.03 m by the intelligent identification method of the coal pillar. When the 16 m pillar was used, the surrounding rock deformation of the roadway was small, and the control effect was good. The research results provide a theoretical basis and reference for the parameter determination of similar projects.
1. Introduction
Combined with the development direction of accurate coal mining and information technology in the new century, the intelligent optimization method of coal pillars arises at a historic moment. If the coal pillar is too wide, it can bear the load stably and isolate water effectively, but will cause a great waste of resources. The coal pillar is too narrow to guarantee the safe production of the working face, and is even affected by many factors such as overlying rock structure, geological structure, and so on, which puts forward the difficult problem for coal mine water conservation mining and the prevention of rock burst. Therefore, it is reasonable to determine the width of the coal pillar, taking into account the safety of production and economic benefits, which is consistent with the advanced concepts of scientific mining, green mining, precision mining, and safe mining [1,2,3,4].
A series of studies on the reasonable width of a coal pillar in a fully mechanized caving face has been carried out by domestic scholars. Kong et al. [5], who addressed the problem of the reasonable retention of coal pillars in fully mechanized caving face sections with a large mining height, used theoretical calculation, field stress monitoring, numerical software, and other methods to obtain the mechanical characteristics of the roadway and coal pillars with different coal pillar widths. Zhang et al. [6] studied the reasonable width of a coal pillar in a fully mechanized caving face with high intensity mining, established the lateral basic roof fracture structure model, and proposed the asymmetric surrounding rock control technology. Liu et al. [7] determined the size of the coal pillar by means of micro seismic monitoring, dynamic stress monitoring, and theoretical calculation in the fully mechanized caving face section of an extra-thick coal seam in a deep well. Kong et al. [8] monitored the rock strata movement in a fully mechanized caving face of an extra-thick coal seam, and determined the reasonable width of a coal pillar in the section by combining numerical simulation and rock mechanics calculations. According to large-scale deformation of the roadway in “three soft coal seams” in Dananhu, Lai et al. [9] determined the reasonable width of a coal pillar in the section through theoretical calculation combined with the stress distribution and plastic zone of the original coal pillar. Xi et al. [10] analyzed the advantages and disadvantages of four methods to determine the width of the coal pillar such as the empirical method, theoretical calculation method, numerical simulation method, and field measurements where the method of combining field measurements and numerical simulation was proposed to determine the width of coal pillar. Xie et al. [11] analyzed the geological conditions and mining methods, combined with the computer numerical simulation and field measurement research, and revealed the influence of the change of the coal pillar width on the stress distribution and change rule of the surrounding rock in the fully mechanized top coal caving face. Wei et al. [12] discussed the change rule of protective coal pillar size with mining depth, mining height, and coal seam dip angle, and established the calculation formula of the coal pillar size. It was pointed out that in the same mining area, under the conditions of different mining depth, mining height, and coal seam inclination, the size of the protective coal pillar is not a simple linear relationship, but a complex nonlinear relationship. Huang et al. [13] used the three field coupling control method to reasonably arrange the dislocation distance of coal pillars, effectively avoid the vertical stress superposition caused by the upper and lower coal pillars, and reduce the occurrence of ground cracks and uneven settlement.
However, at present, the research on section coal pillars has mainly been focused on theoretical analysis, numerical simulation, and a small number of field measurements, but the research on data mining, coal pillar prediction, and intelligent identification is relatively few. In recent years, with the rapid development of artificial intelligence and statistical technology, many engineering problems have applied the theory and method of computational intelligence from different angles. Among them, most have been the application of an artificial neural network and genetic algorithm. This provides a new scientific method for the accurate retention of coal pillars in the section.
Therefore, this paper takes the 90,101 working face of the Baoshan Yujing Mine in Shanyin City, Shanxi Province as the engineering background, and adopts the scientific research means of an empirical formula, MIV-GA-BP simulation experiment, finite difference algorithm, and the Delphi method (DM) “four-way fusion”. The intelligent identification system of coal pillar stability in a fully mechanized top coal caving face section of thick coal seam was established, and finally verified in the field. Thus, it can provide a theoretical basis and reference for the determination of parameters in similar projects.
2. Technical Framework of Intelligent Identification System
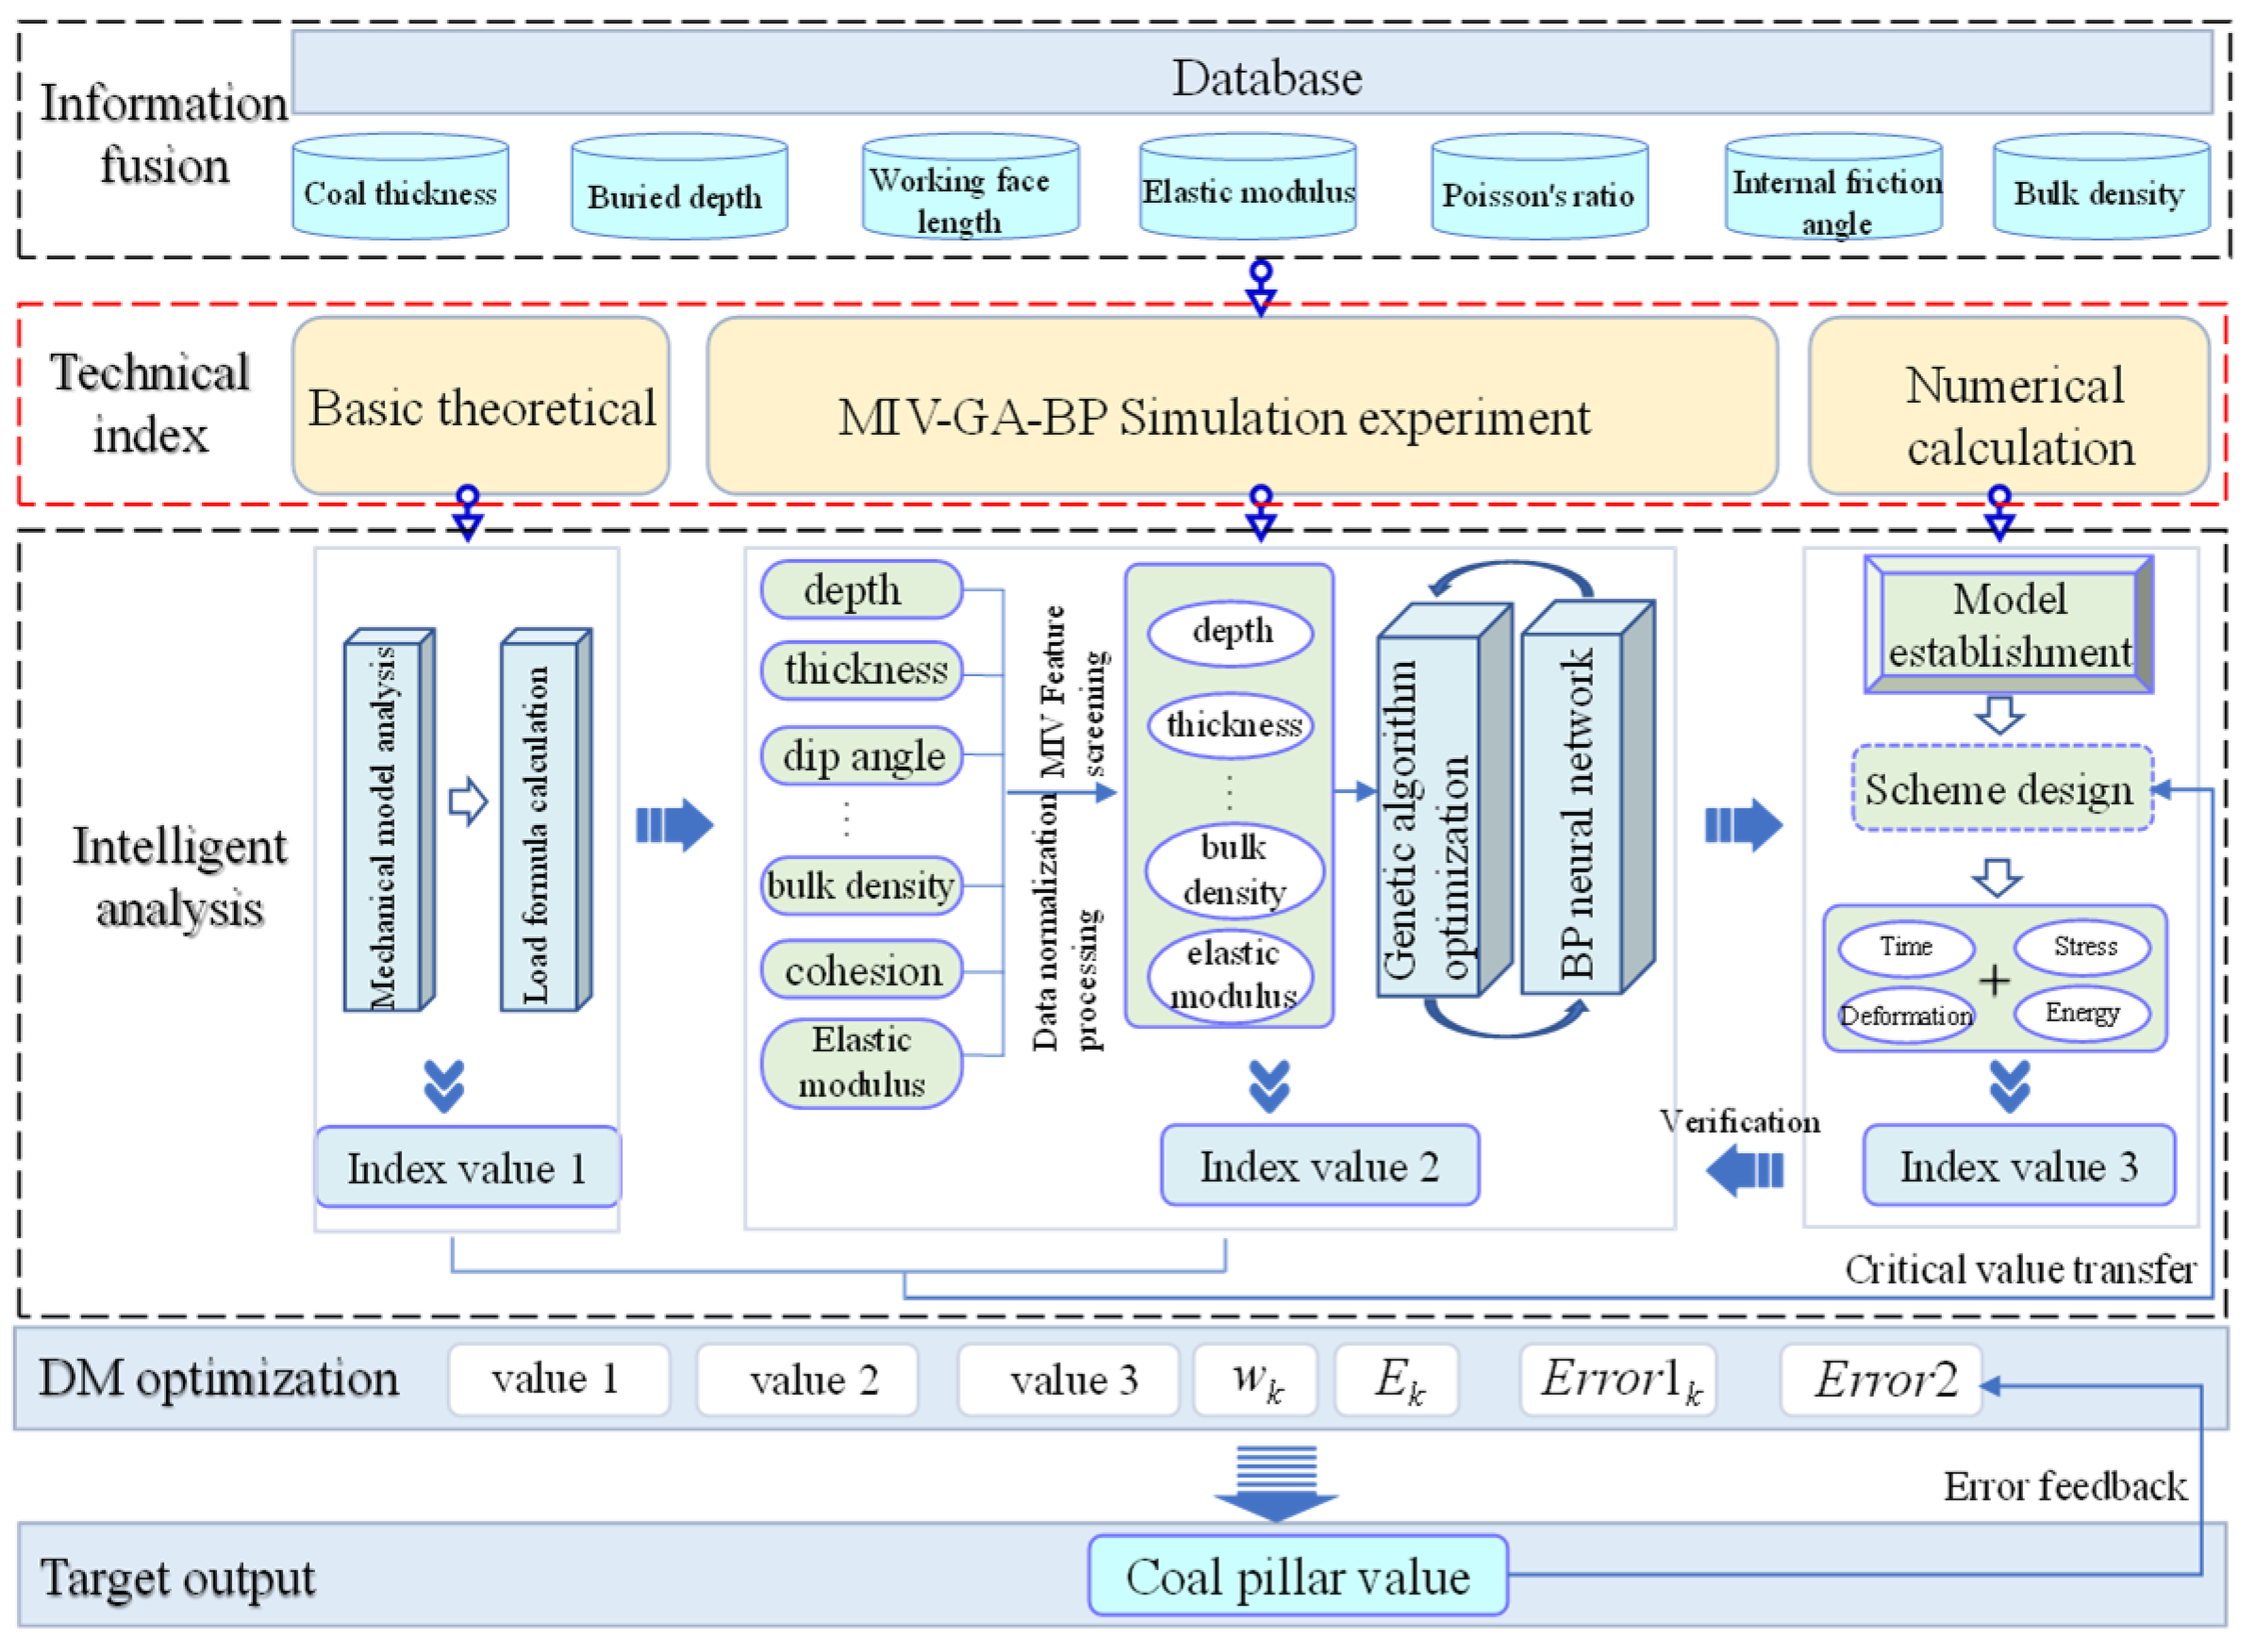
The technical framework of the identification system mainly describes the functional modules and the interactive data flow and information flow between the modules that must be provided to realize the stability analysis of coal pillars. It provides a general framework for coal pillar design from the function realization. The framework is divided into five levels: (1) the information fusion layer, (2) technical index layer, (3) intelligent analysis layer, (4) DM optimization layer, and (5) target output layer, and each level cooperates with each other to form the basic framework of an intelligent identification system for coal pillar stability, as shown in Figure 1.

Figure 1.
Technical framework of the coal pillar stability identification system.
The information fusion layer is the centralized management, effective organization, and efficient output of multi-source and heterogeneous big data in a mine geological survey space to provide accurate, comprehensive, and effective information resources for intelligent analysis layer. The technical index layer acts as a knowledge guide; the research means of integrated integration and collaborative development are formed, and the information data are transformed into knowledge and decision-making, so that the entropy of the identification system is reduced to form an orderly structure. The intelligent analysis layer is based on all kinds of professional domain intelligent computing technology; the scientific research means of basic theory, artificial intelligence, and numerical calculation are used to carry out in-depth mining and analysis of multi-source dynamic perceptual data and information as well as provide core knowledge support for coal pillar stability identification and intelligent evaluation. The DM optimization layer is based on the effective knowledge base and by using the Delphi optimization model, the coal pillar values of each index are optimized to realize intelligent decision and control and provide the best internal function support. Finally, the target output layer carries out the optimal coal pillar value of the optimization layer to realize the intelligent identification system of coal pillar stability with more intelligence, high efficiency, safety, reliability, and green environmental protection.
3. Mechanical Model Analysis and Width Calculation of Coal Pillar
3.1. Summary of Geological Conditions
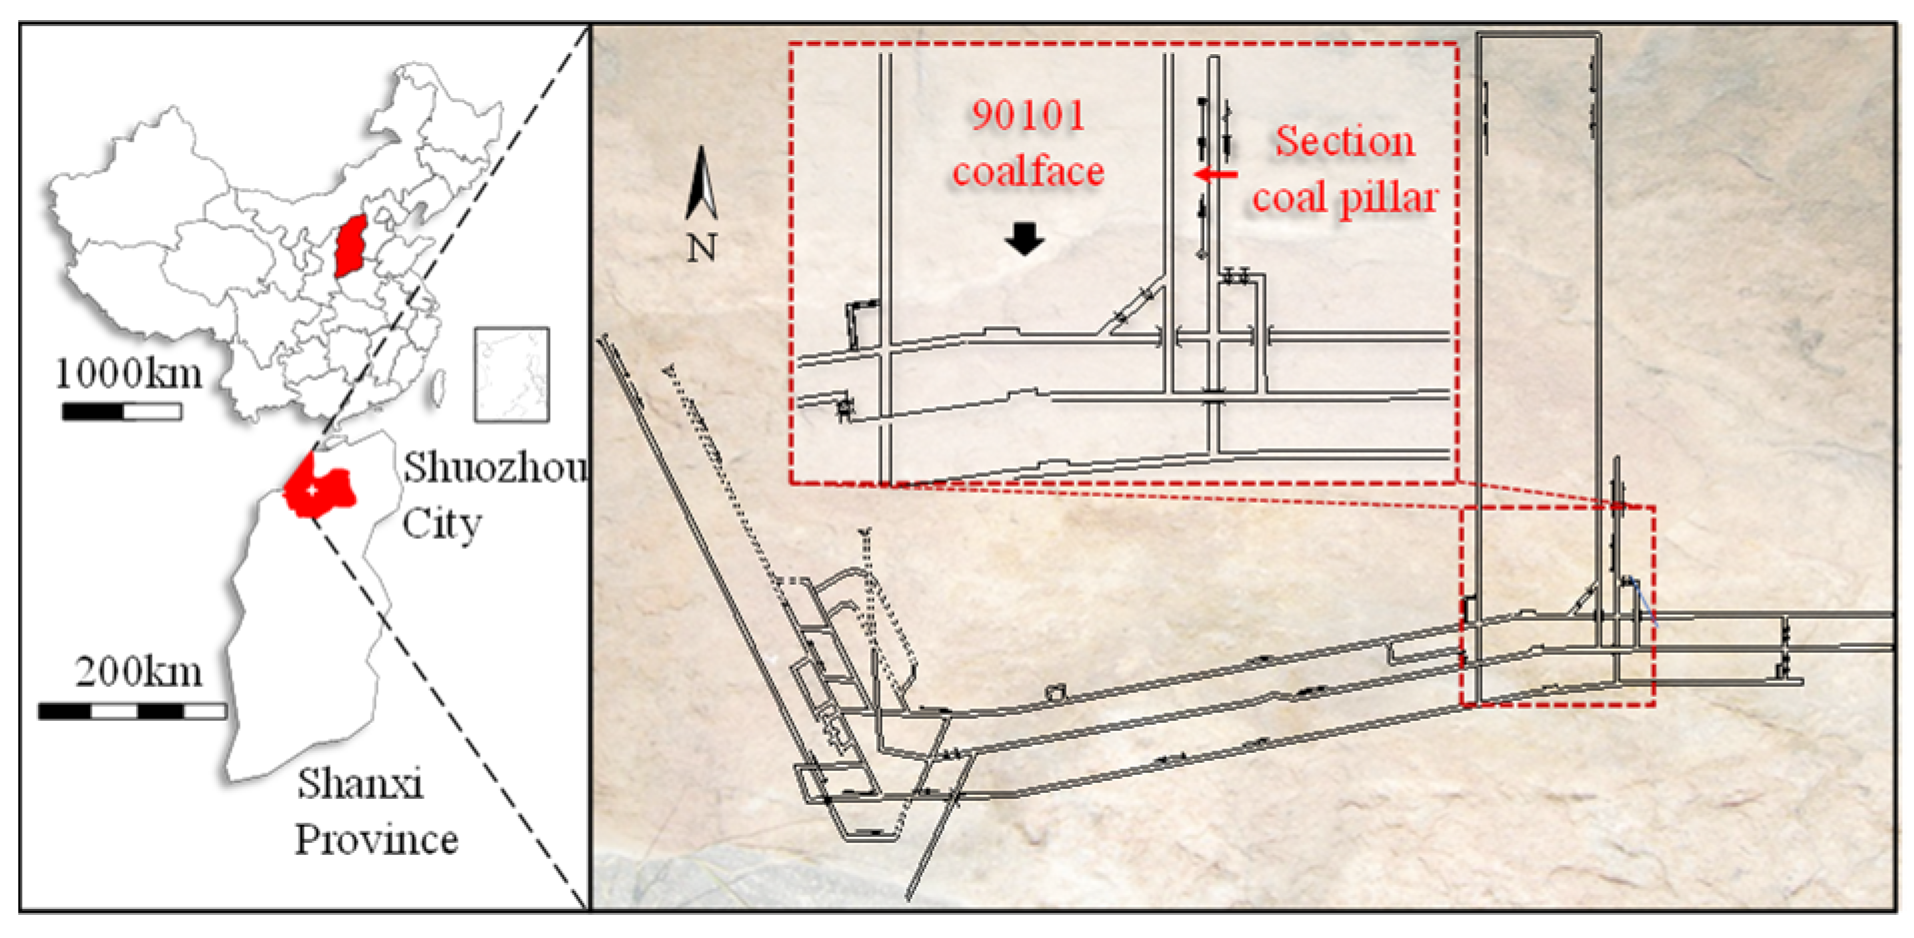
The average buried depth of the first mining area of Baoshan Yujing Coal Mine is 180 m, and the thickness of the mining coal seam is 9.64–10.38 m, with an average of 7.96 m, density 1.40 g/cm3, and average dip angle of 3°. The 90,101 fully mechanized caving face is the first mining face in a mining area with a length of 1000 m, a strike length of 150 m, a cutting height of 3 m, and a drawing height of 4.96 m, where the plan to layout of the 90,102 fully mechanized caving face is separated by section coal pillars. The location relationship of the research area is shown in Figure 2.

Figure 2.
Positional relationship of the 90,101 coalface.
3.2. Analysis of Mechanical Model of the Coal Pillar
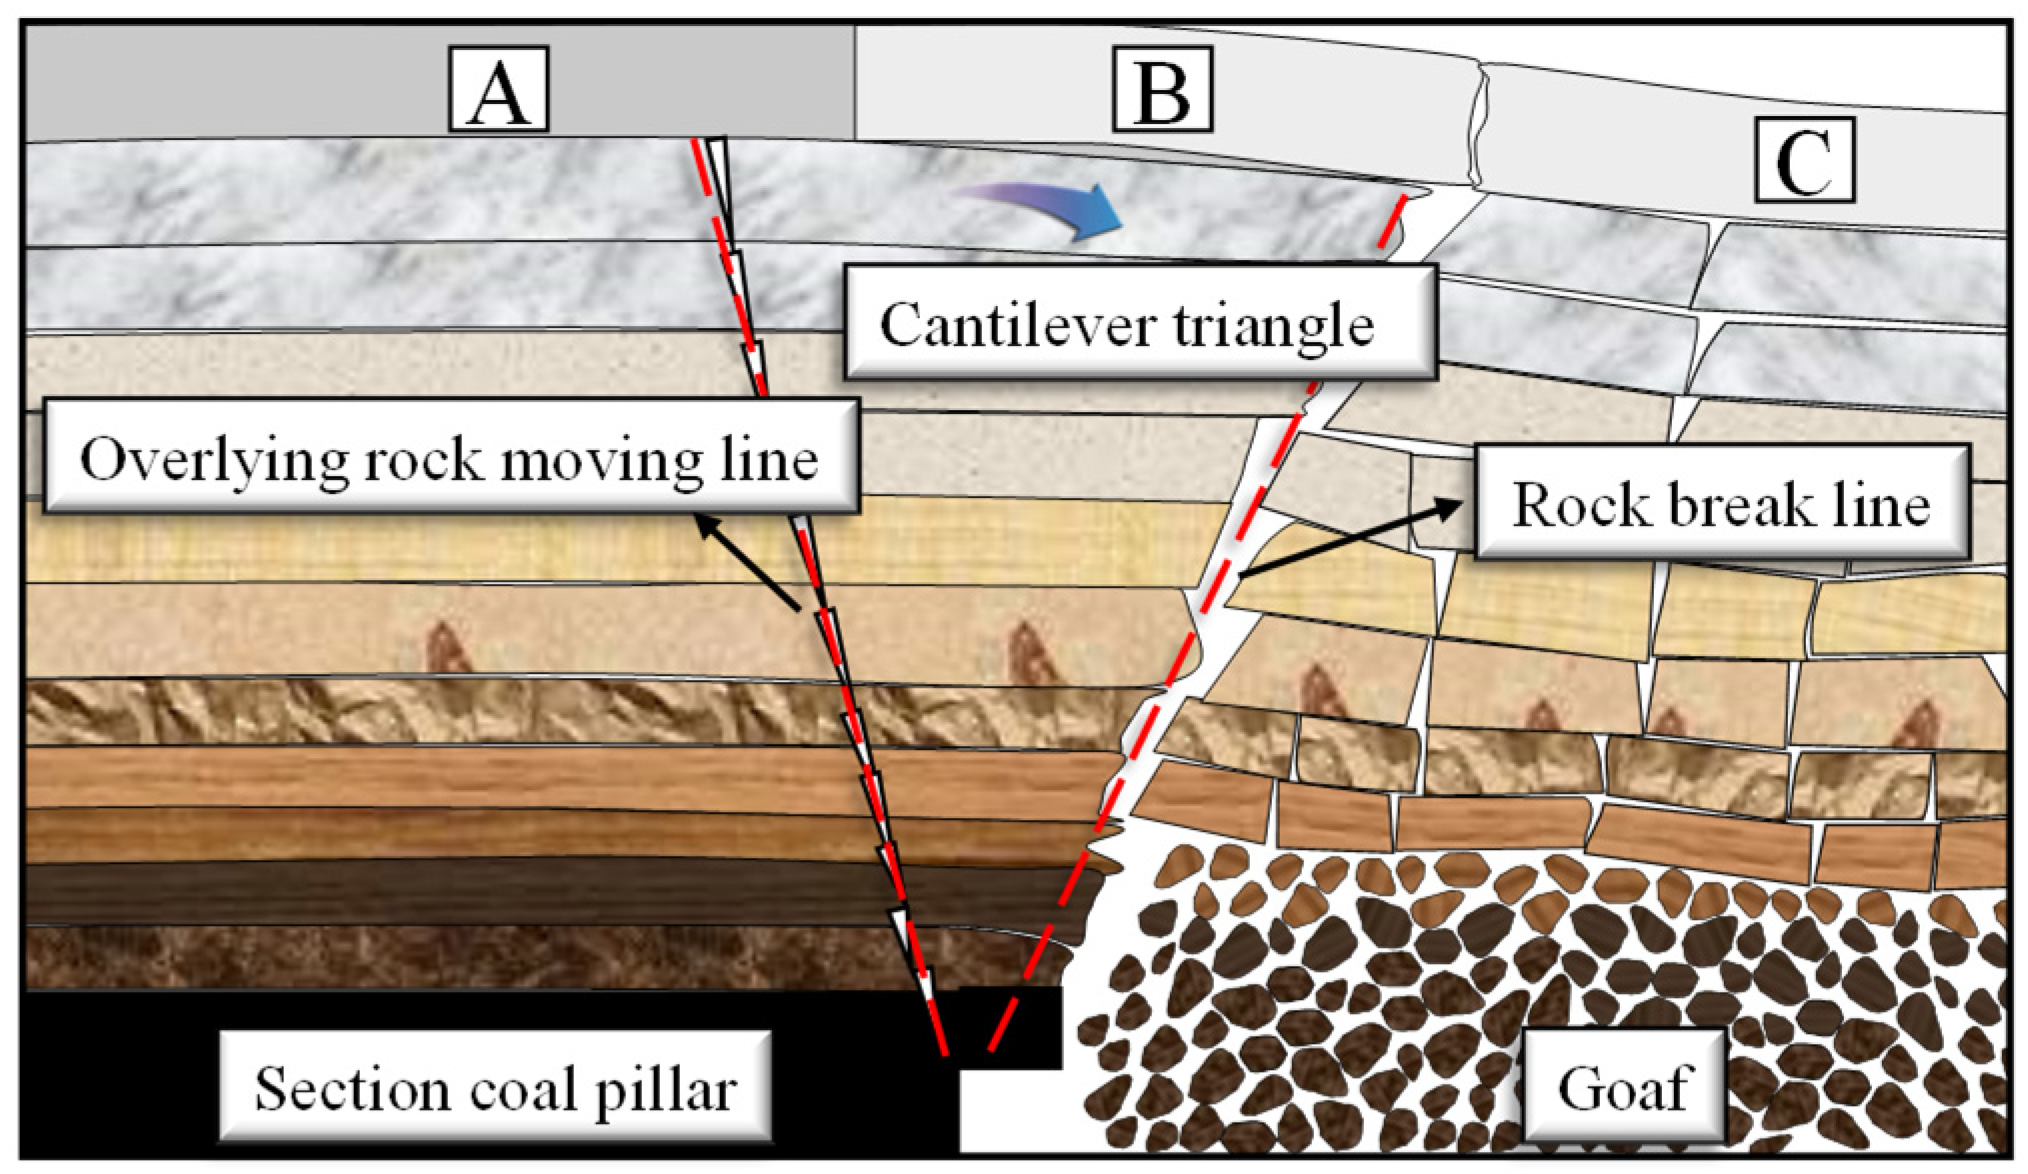
During the mining of a fully mechanized top coal caving face in a thick coal seam, the activity range of the overlying rock is large, the coal gangue cannot fill the goaf for a short time after top coal caving, and the overlying rock along the goaf is of a “non-contact cantilever triangle” structure [14]. As shown in Figure 3, the rotation deformation occurs with the overlying rock moving line as the starting point.

Figure 3.
Overburden structure of an extremely thick coal seam section coal pillar.
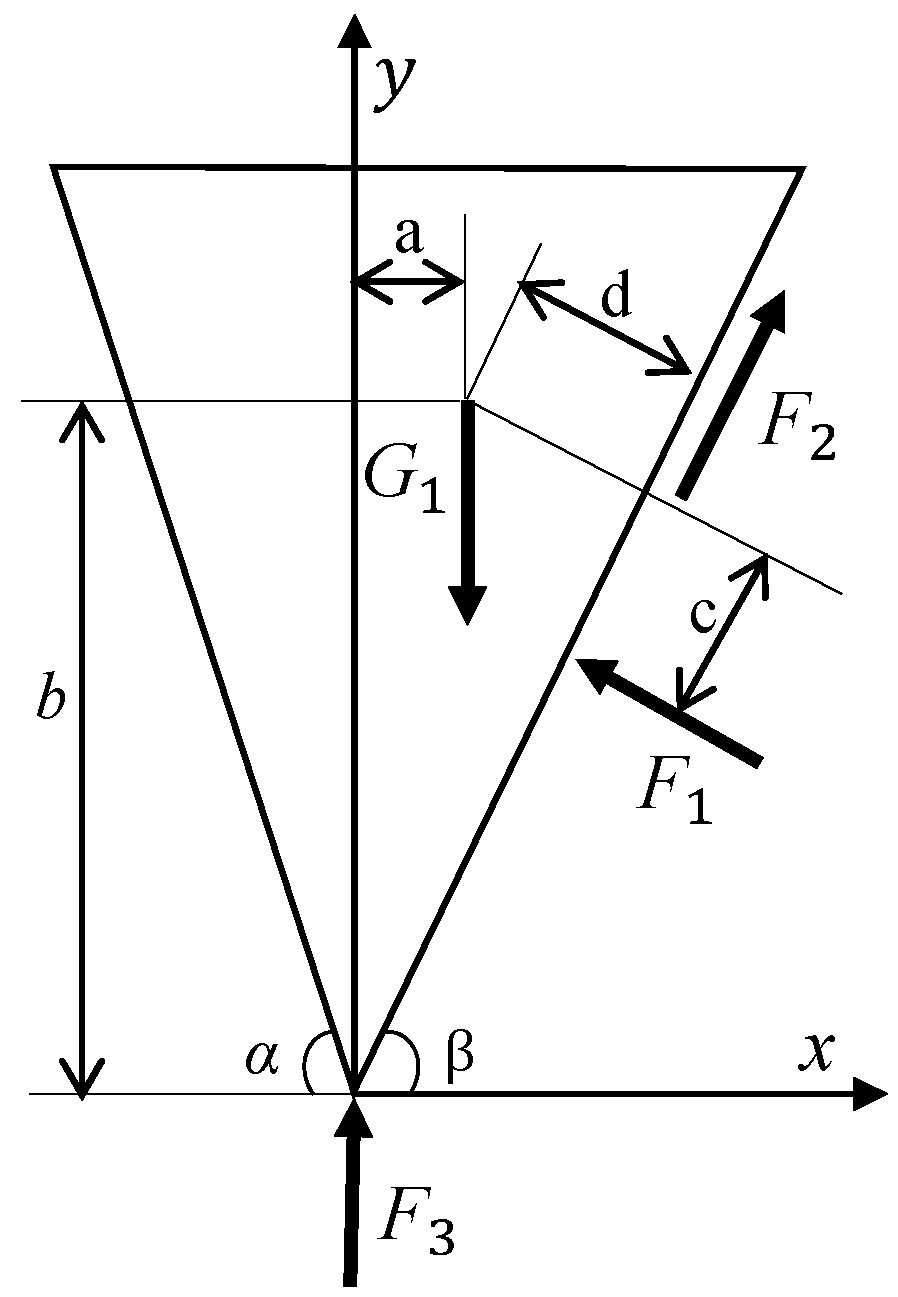
In Figure 4, for the overlying rock structure along the empty side of the working face, the following basic assumptions were made as follows: (1) the triangle is regarded as a rigid body in the process of motion, that is, the relative position does not change; (2) the self-weight of the triangle has components in both the normal and inclined directions on the oblique plane; (3) there is continuous and homogeneous isotropic object of the rock stratum; and (4) the force of coal pillar is proportional to the neutral face of coal pillar. The mechanical model can be regarded as a triangle, as shown in Figure 4.

Figure 4.
Mechanical model of a triangle broken block.
The equilibrium condition of triangle is analyzed. The vertical force balance is as follows:
and
Take the moment with G1, according to the moment balance condition:
obtained from Equations (1)–(3),
according to the geometric relationship in Figure 4,
make , , simplified:
where G1 is gravity; F1 is the supporting force of the goaf to the triangular area; F2 is the friction force; F3 is the supporting force of the lower rock mass to the broken rock; and α is the strata movement angle. β is the caving angle, b is the height of the center of gravity of the slider, a, c, and d are the distances from the center of gravity to F3, F1, and F2, and f is the friction coefficient between the slider and the contact surface of the lower rock mass.
From Equation (14), it is known that the load on the coal pillar decreases after the cantilever triangle is broken, because all the loads in the early stage of breaking need to be borne by the coal pillar in the section, and the vertical load after breaking is decomposed into the force facing the goaf and the coal and rock mass below. Only part of the load is transferred to the lower pillar. Therefore, in calculating the size of the coal pillar, the cantilever triangle should be used to calculate the size of the coal pillar.
3.3. Calculation of Coal Pillar Width
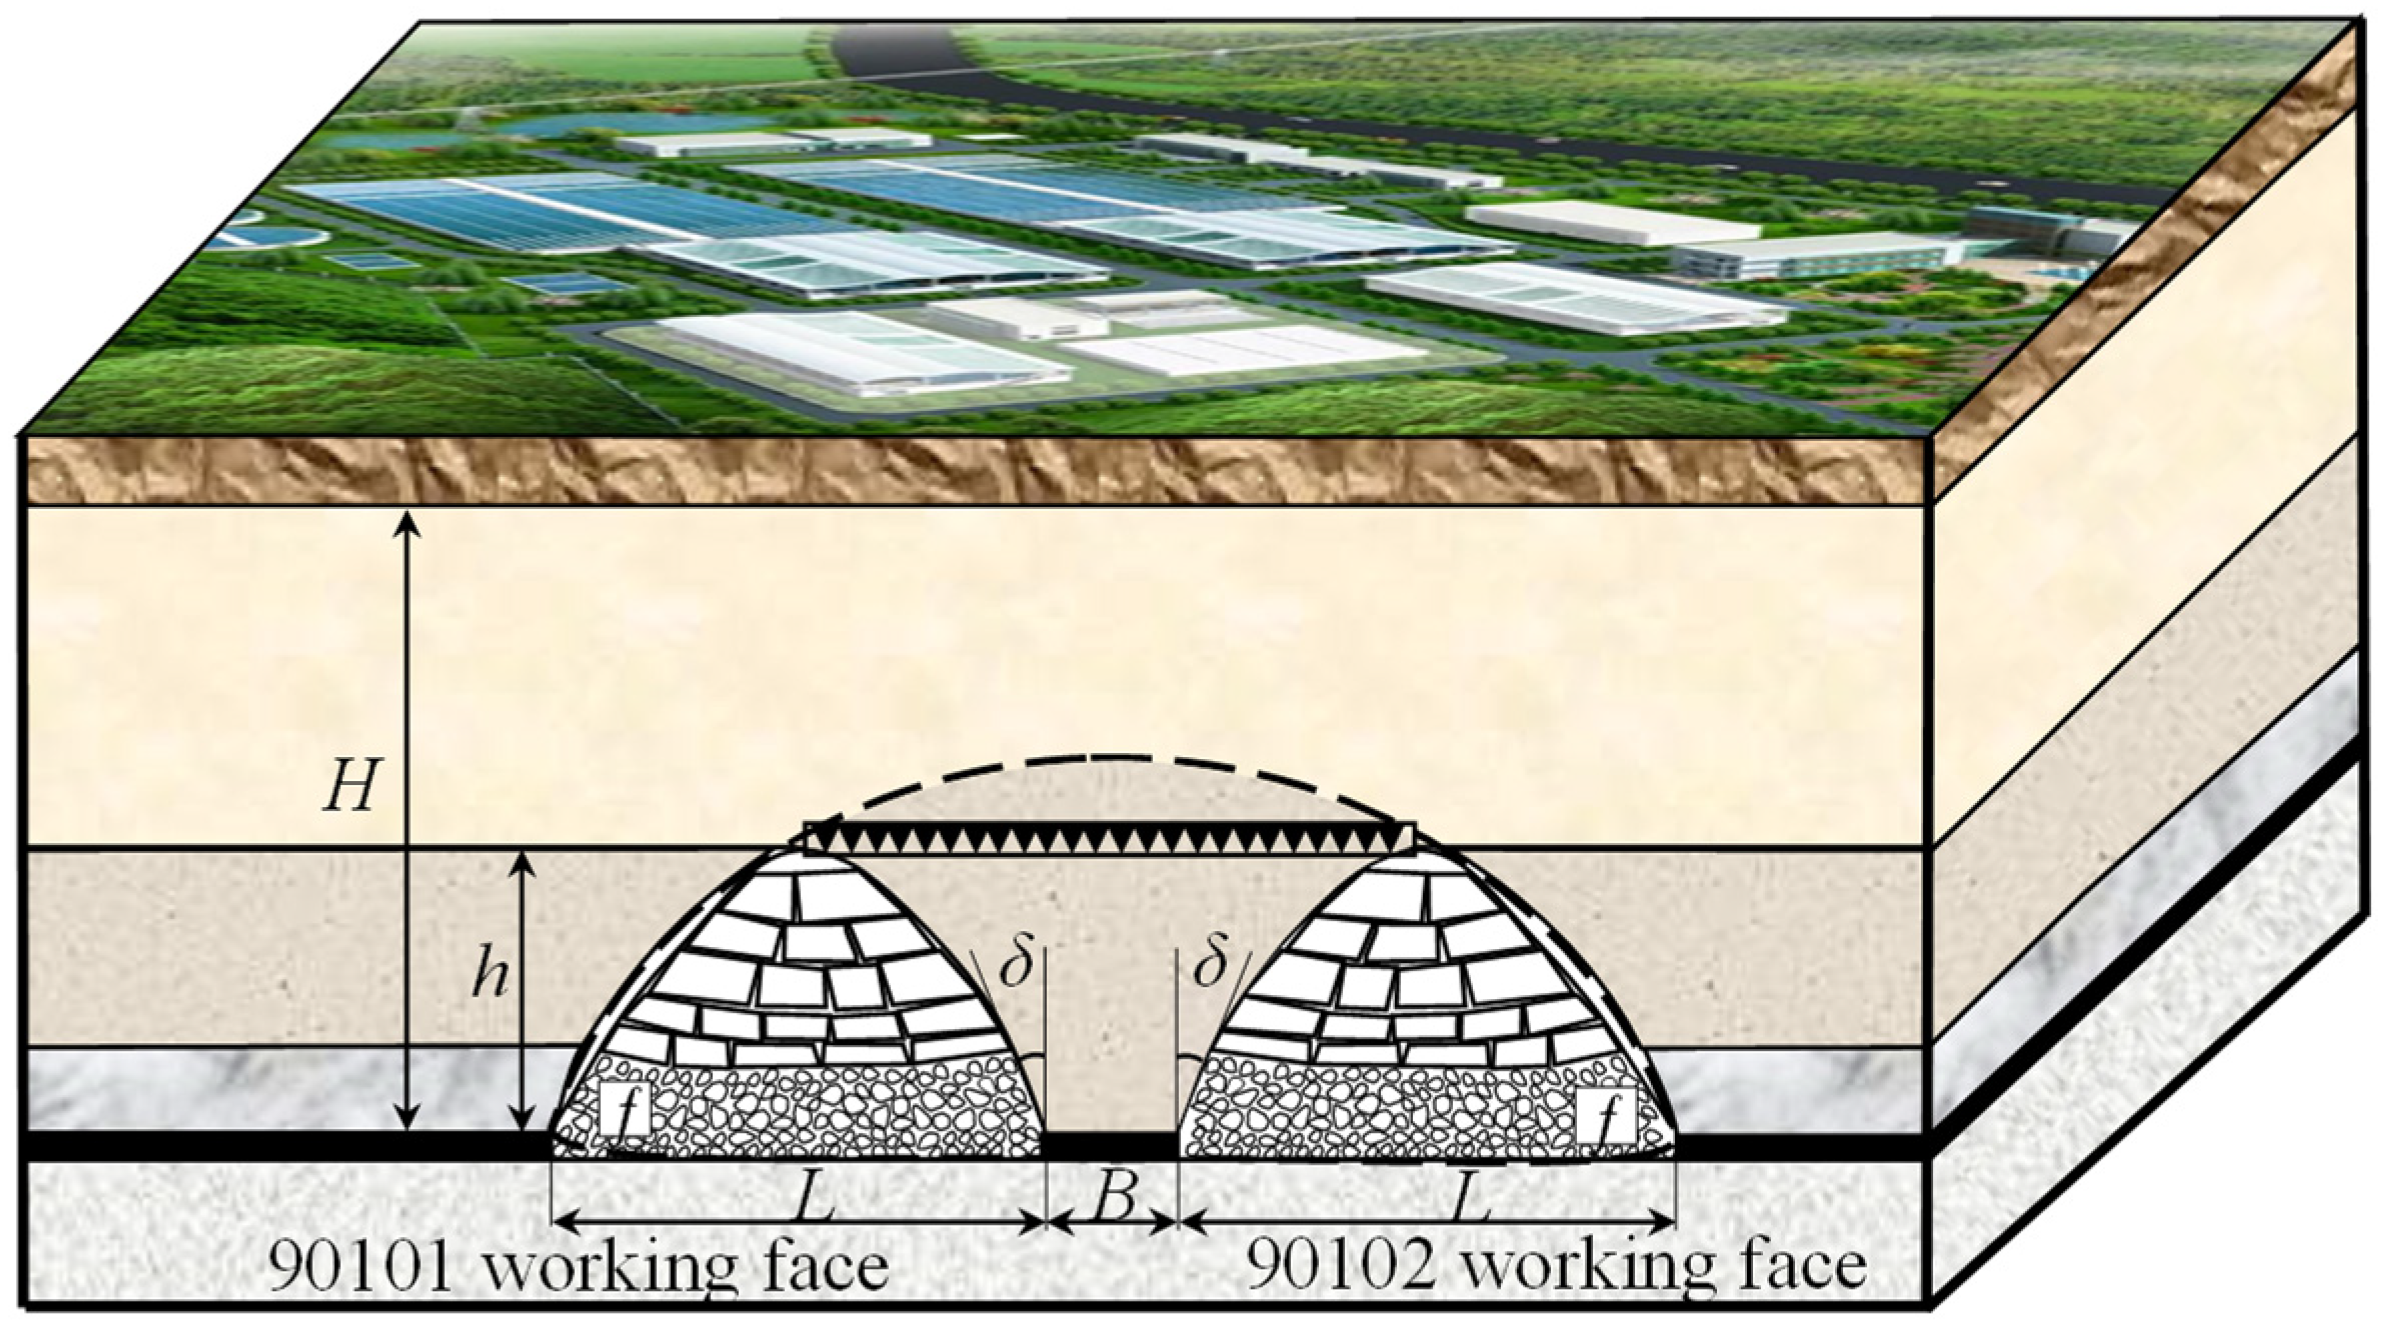
Based on the background of the 90,101 fully mechanized top coal caving face in the mine, the geological model was constructed. As shown in Figure 5, the strike length of the fully mechanized top coal caving face was 1000 m, the working face length was 151 m, the average buried depth was 180 m, and the coal mining thickness of the working face was 5.6–9.5 m, with an average of 8.1 m. The inclination angle was 0–4°. Through the analysis of the mechanical model of the coal pillar, it was considered that the load of the coal pillar is caused by the weight of the overlying rock above it and the weight transfer of part of the overlying rock in the goaf on one or both sides of the goaf. The ultimate load per unit area of the coal pillar is
where B is the width of coal pillar, m; L is the length of working face, m; H is the burial depth of coal seam, m; h is the height of fracture zone, m; δ is the caving complementary angle, °; γ is the average bulk density of overlying strata, kN/m3; and It is the friction coefficient of the interface between the coal seam and roof and floor.

Figure 5.
Geological model for calculating coal pillar load.
Combined with the Benievsky strength formula [15]:
where R is the strength of coal pillar, MPa; RC is the in situ critical dimensional strength of coal pillar, MPa. B is the width of coal pillar, m; and A is the height of coal pillar.
The reasonable width of a coal pillar should be satisfied: the ultimate strength of coal pillar is greater than the ultimate load of coal pillar. That is: Z > R. As a result, the value of the coal pillar was 16.25 m.
4. Simulation Experiment Calculation Based on MIV-GA-BP (Mean Impact Value-Genetic Algorithm-BP Neural Network)
4.1. Data Acquisition and Preprocessing
Ten influencing factors of coal pillar stability were selected such as tensile strength, cohesion, elastic modulus, internal friction angle, bulk density, Poisson’s ratio, buried depth, coal seam dip angle, coal thickness, and working face length [16]. After consulting the data, 36 fully mechanized top coal caving faces with similar mining and caving ratios were selected as analysis samples, as shown in Table 1, and the data were normalized (Equation (17)); moreover, the unit dimension of each variable was eliminated, making its value in the [0,1] [17], as shown in Table 2.
where Xmax, Xmin are the maximum and minimum values of the data sequence, respectively and Xij is the actual observations.

Table 1.
Sample data.

Table 2.
Normalized sample data.
4.2. Influence Factor Feature Screening
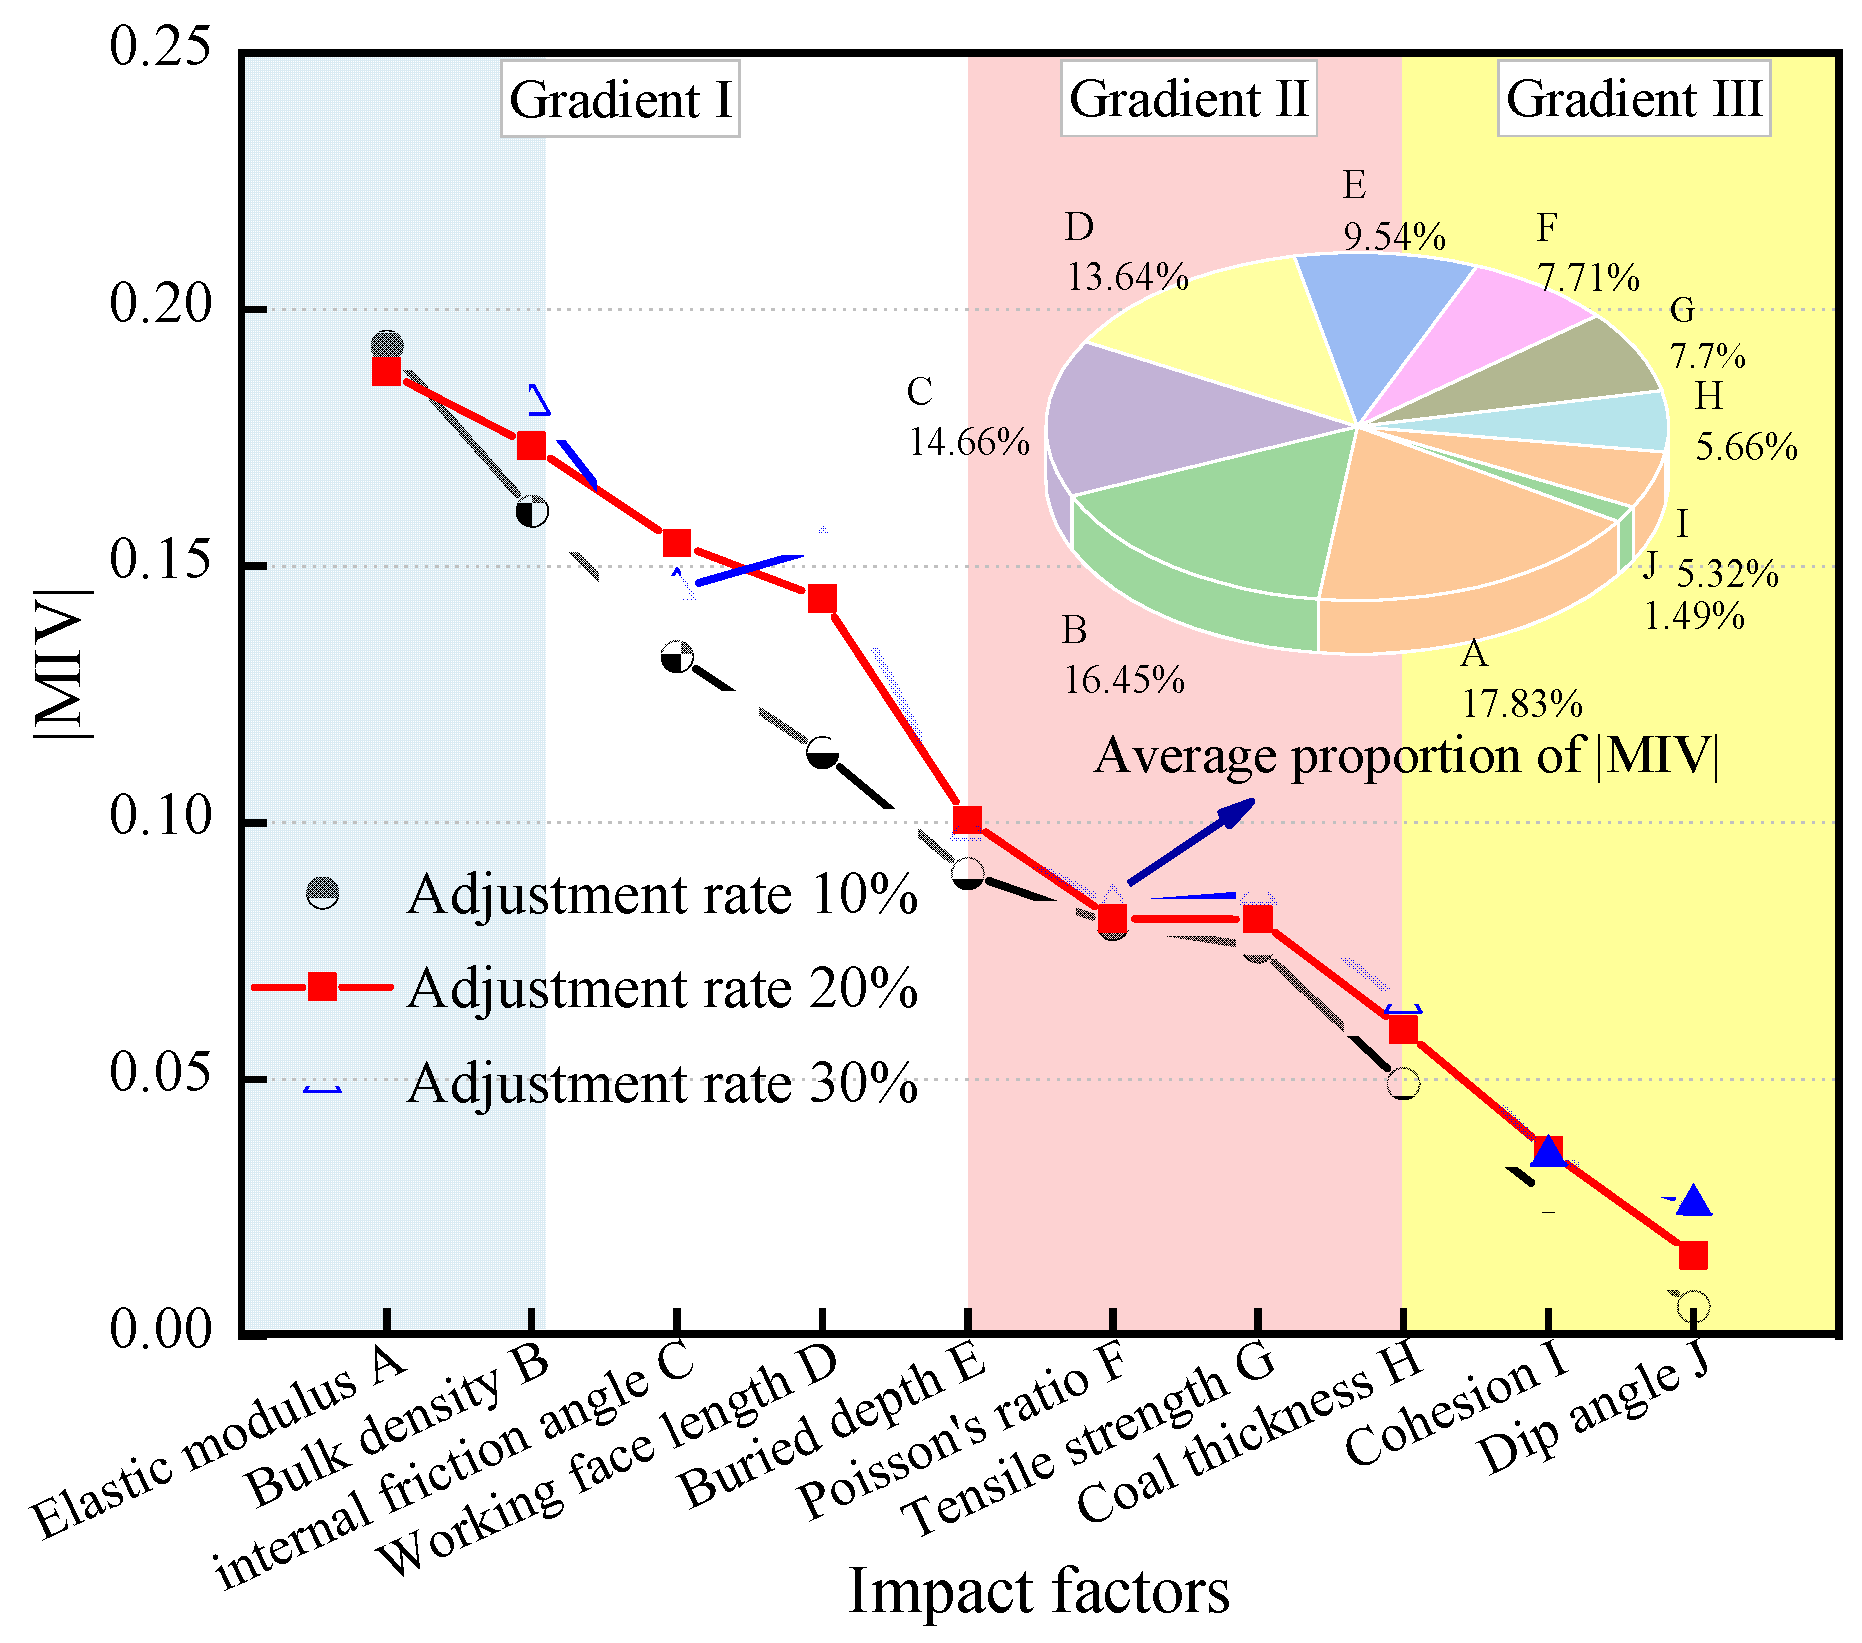
Taking 10 influence factors as the input and setting the adjustment rates of 10%, 20% and 30%, 50 MIV (mean impact value,) tests were carried out [18]. The MIV eigenvalues of various influencing factors were calculated, and there were positive and negative correlations between different input and output variables, showing that the MIV values were divided into positive and negative numbers. In order to compare the influence weights of different input variables, all MIV values were taken as absolute values. Draw the weight change curve of each influence factor under different |MIV| mediation rates, as shown in Figure 6.

Figure 6.
Results of MIV with different adjustment ratios.
From Figure 6, it can be concluded that the weight distribution of the influencing factors of coal pillar stability is basically the same under different mediation rates, therefore, it can be considered that the weight distribution of each influence factor is representative under any MIV mediation rate. Taking the MIV mediation rate of 20% as an example to analyze, as shown in the red curve of the Figure 6, according to the absolute value of MIV, the 10 influencing factors can be divided into three sensitive gradients. In this paper, the coal seam dip angle was eliminated according to the knockout rate of 10%. The other nine variables were included in the prediction model.
4.3. Prediction of Coal Pillar Width Based on MIV-GA-BP
4.3.1. Model Fitting Accuracy Evaluation
Training sets are usually used to evaluate the fitting accuracy of the model. The model training used the sample data of 86% (the first 30 groups in the sample) in Table 2, combined with the influence factors determined above, to construct the coal pillar width prediction model [19]. The MIV-GA-BP neural network adopted a three-layer topology, and the optimal number of hidden layer nodes was 14 after many experiments.
The genetic algorithm was optimized to obtain the optimal initial weight and threshold, which was assigned to the neural network. After training, the model finally met the requirements of fitting accuracy and convergence speed: the MIV-GA-BP neural network converged effectively after 14 iterations, and the mean square error was 2.0371 × 10⁻⁶, which achieved the preset goal of 1.0000 × 10⁻⁵. At this time, the correlation coefficient between the network output and the expected output of the training set was 0.89, which can highly fit the characteristics and rules of the sample.
4.3.2. Model Prediction Accuracy Evaluation
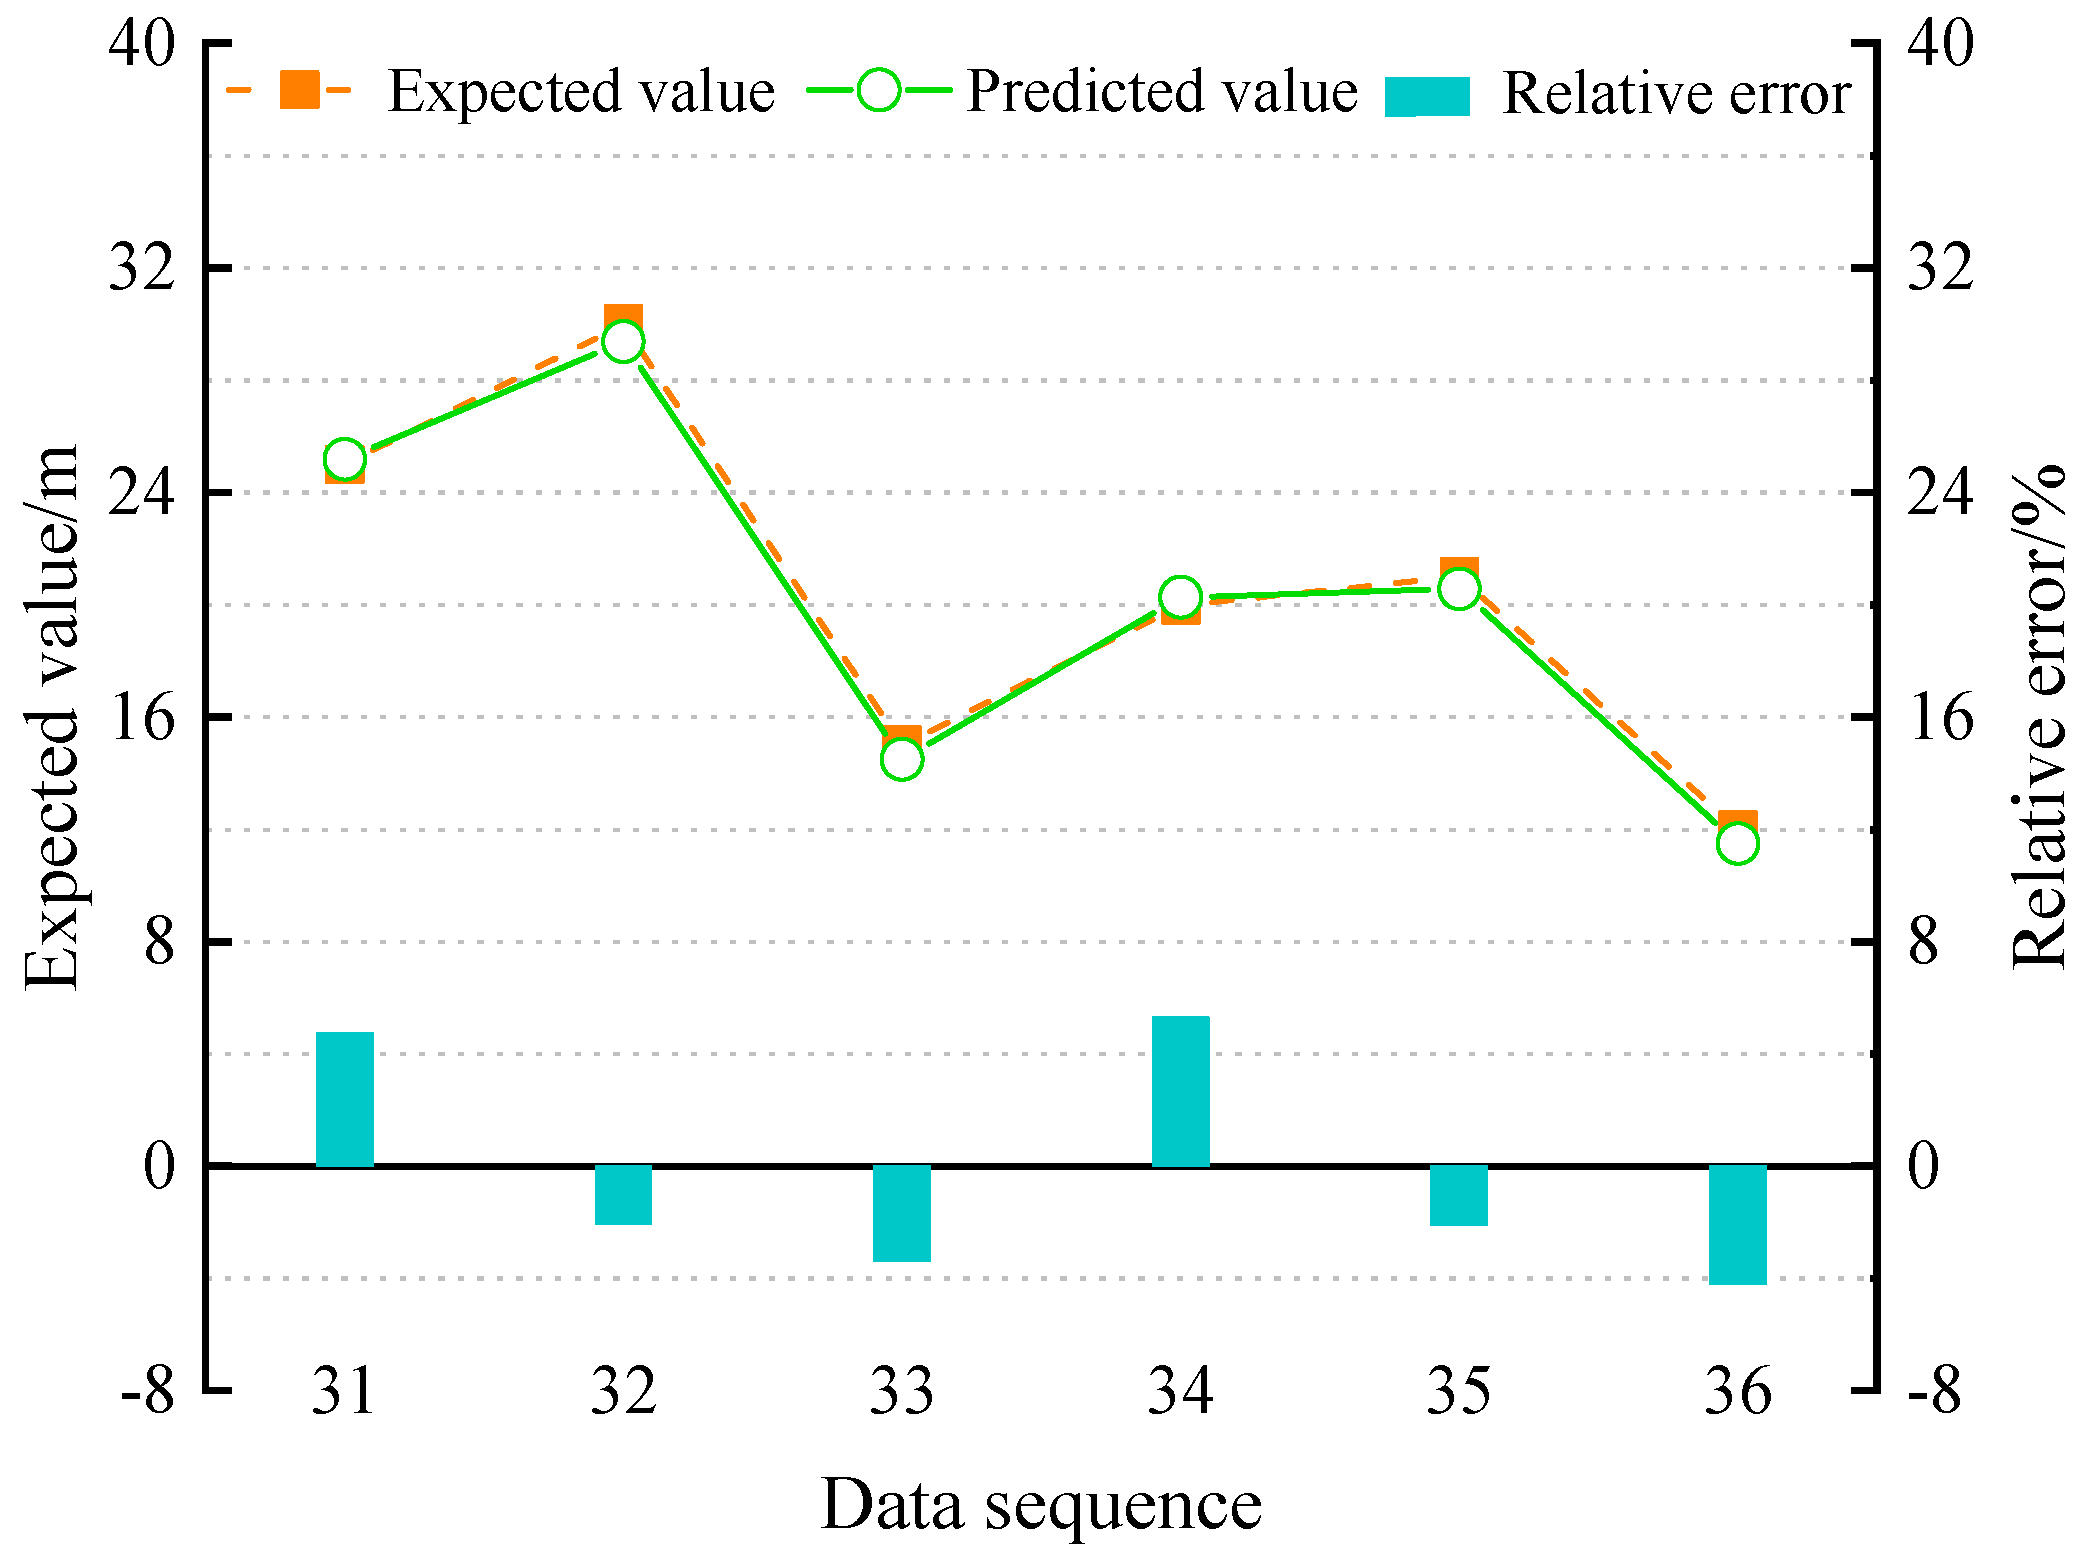
The test set used the sample data of 14% in Table 2 (the last six groups of the sample) to evaluate the prediction accuracy of the model.
As can be seen from Figure 7, the relative error between the predicted value and the expected value of the network prediction model was less than 5%, indicating that the prediction effect of the neural network model constructed by MIV variable screening and genetic algorithm optimization was more accurate, reasonable, and applicable.

Figure 7.
Network model prediction error diagram.
4.3.3. Engineering Prediction
Based on the above model, the section coal pillar width of the typical working face (90101) was predicted (Table 3).

Table 3.
Prediction results of the typical working face.
Table 3 shows the prediction results of the coal pillar width in this section of the mine. The inverse normalization of prediction data was the actual calculation data, and it can be seen that the coal pillar width predicted by MIV-GA-BP model was 16.4742 m.
5. Numerical Calculation
There are many factors affecting the stability of the coal pillar, so it is difficult to describe its size simply and accurately in practice, so the calculated value of the empirical formula was 16.25 m and the predicted value of the simulation experiment was 16.47 m. Four kinds of coal pillar retention schemes of 10 m, 14 m, 16 m, and 20 m were put forward, and the three-dimensional finite difference numerical simulation software (FLAC3D—Fast Lagrangian Analysis of Continua, ITASCA, USA) was used to determine the reasonable coal pillar width.
5.1. Establishment of Calculation Model
When modeling with FLAC3D, the strata composition within the calculation range was merged and simplified, and the rock strata with little difference in physical properties were combined as a single strata.
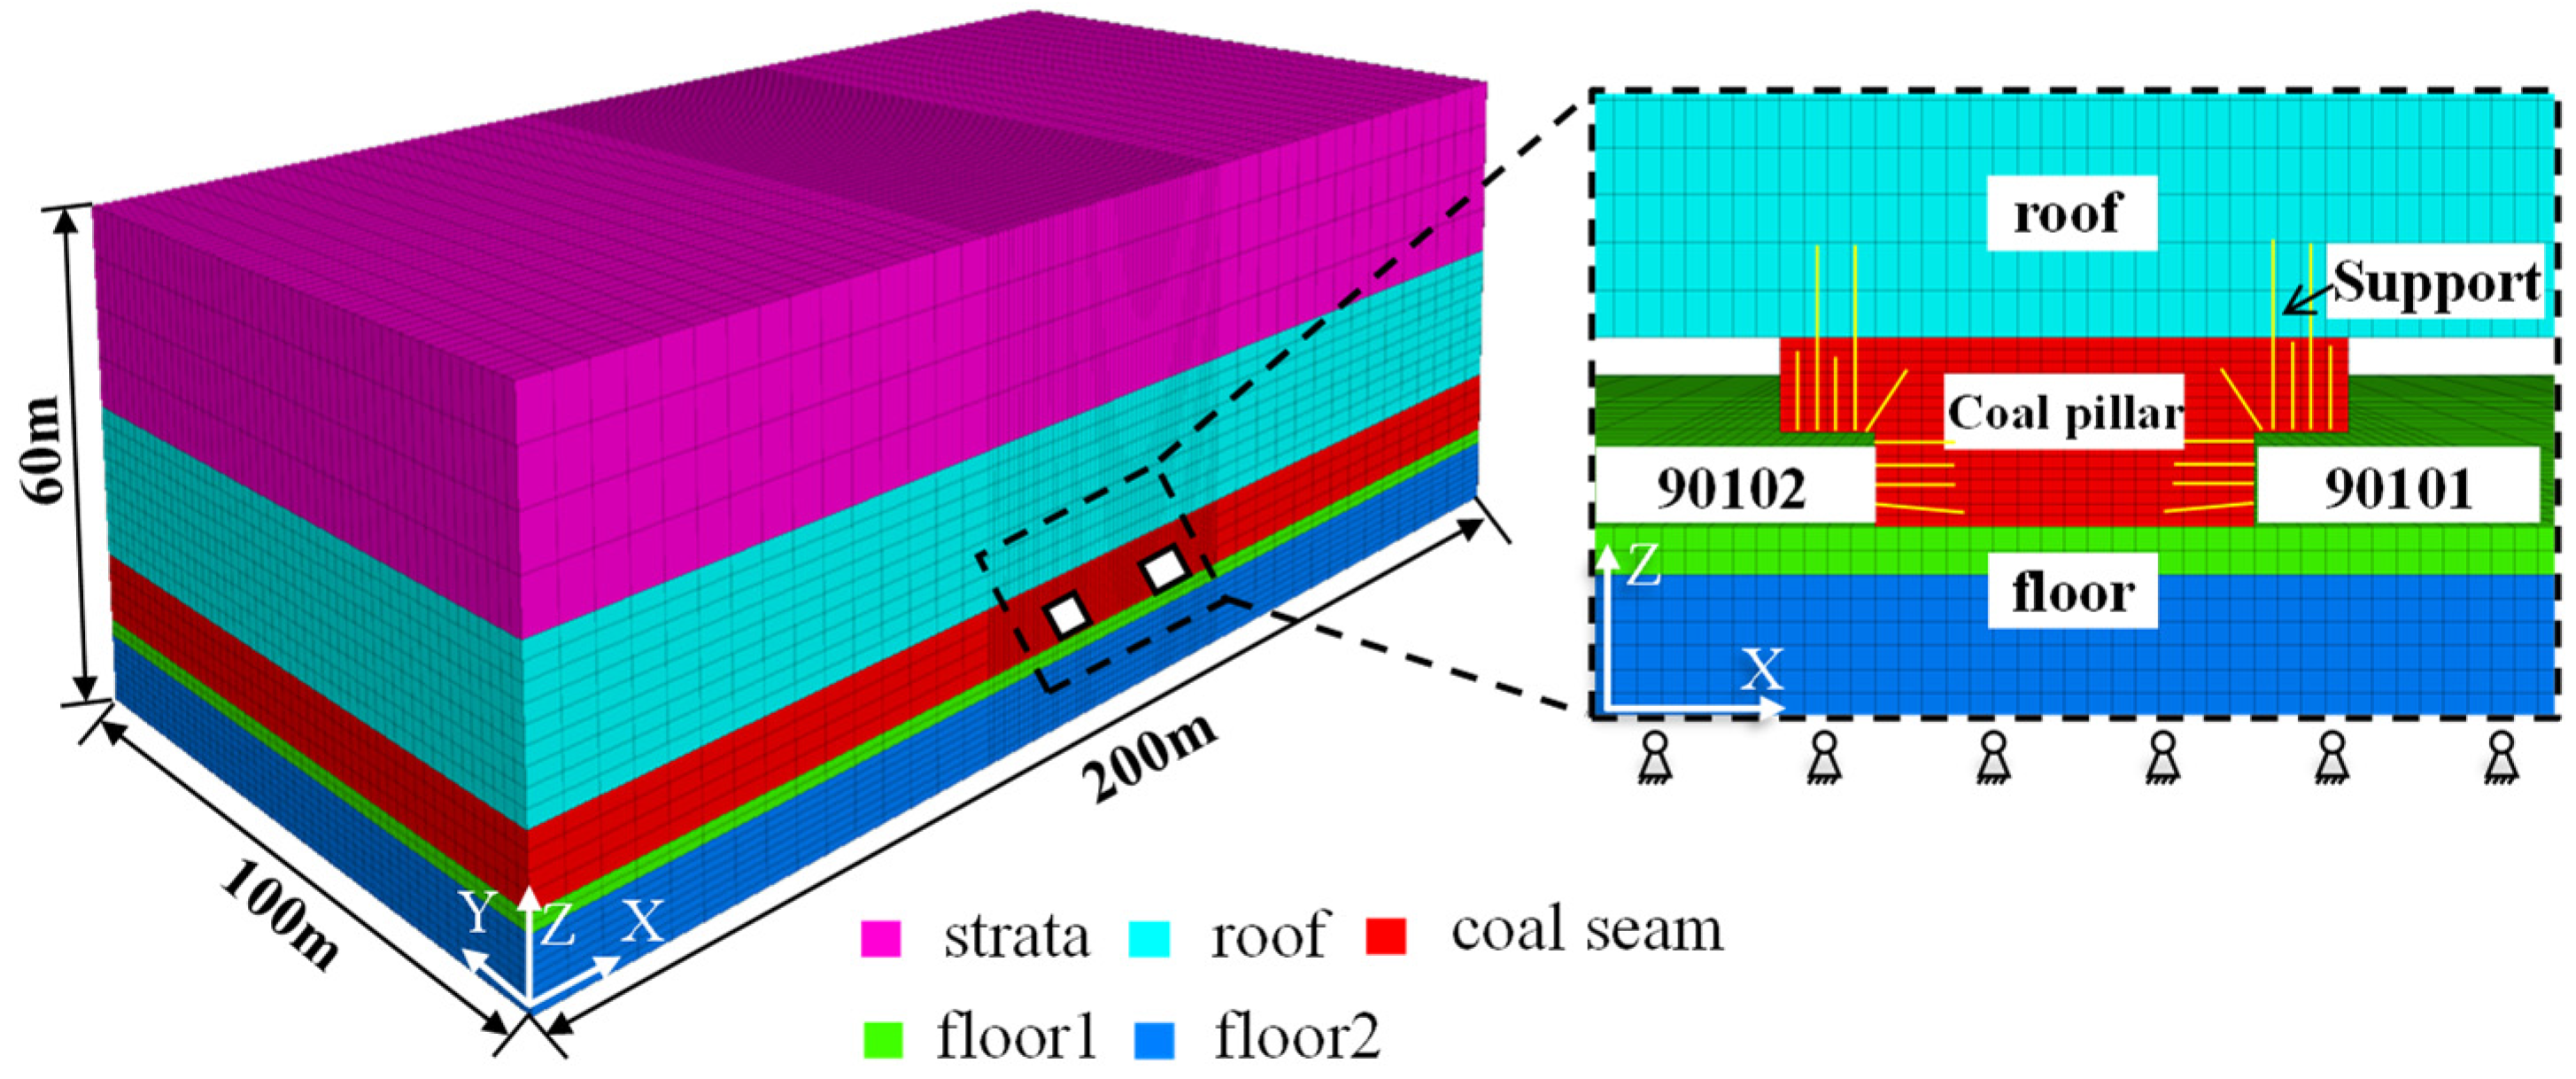
The numerical calculation model is shown in Figure 8. The length, width, and height (X, Y, Z) of the model were 200 m, 100 mm and 60 m, respectively. In the process of grid division, the research area was encrypted. There were 146,880 grid points and 138,000 zones in the model. The four sides and the bottom were constrained and fixed, the top free surface was fixed, and a 180 m equivalent uniformly distributed load was applied on the top of the model. The roadway was supported by a φ 18 × 2000 mm left thread steel bolt, 800 × 800 mm, φ 15.24 × 6300 mm anchor cable, and 1600 × 1600 mm supporting section.

Figure 8.
Model of the numerical calculation.
The Mohr–Coulomb model was used in this simulation, and the mechanical parameters of coal and rock mass were obtained according to the field investigation (Table 4). The simulation process can be divided into four steps: (1) calculation of original rock stress balance; (2) calculation of the mining influence of the 90,101 working face; (3) calculation of the roadway driving and bolt support along the goaf in the 90,102 working face; and (4) the calculation of the mining influence of the 90,102 working face.

Table 4.
Physical and mechanical parameters of the strata.
5.2. Simulation Result Analysis
5.2.1. Distribution Characteristics of Plastic Zone
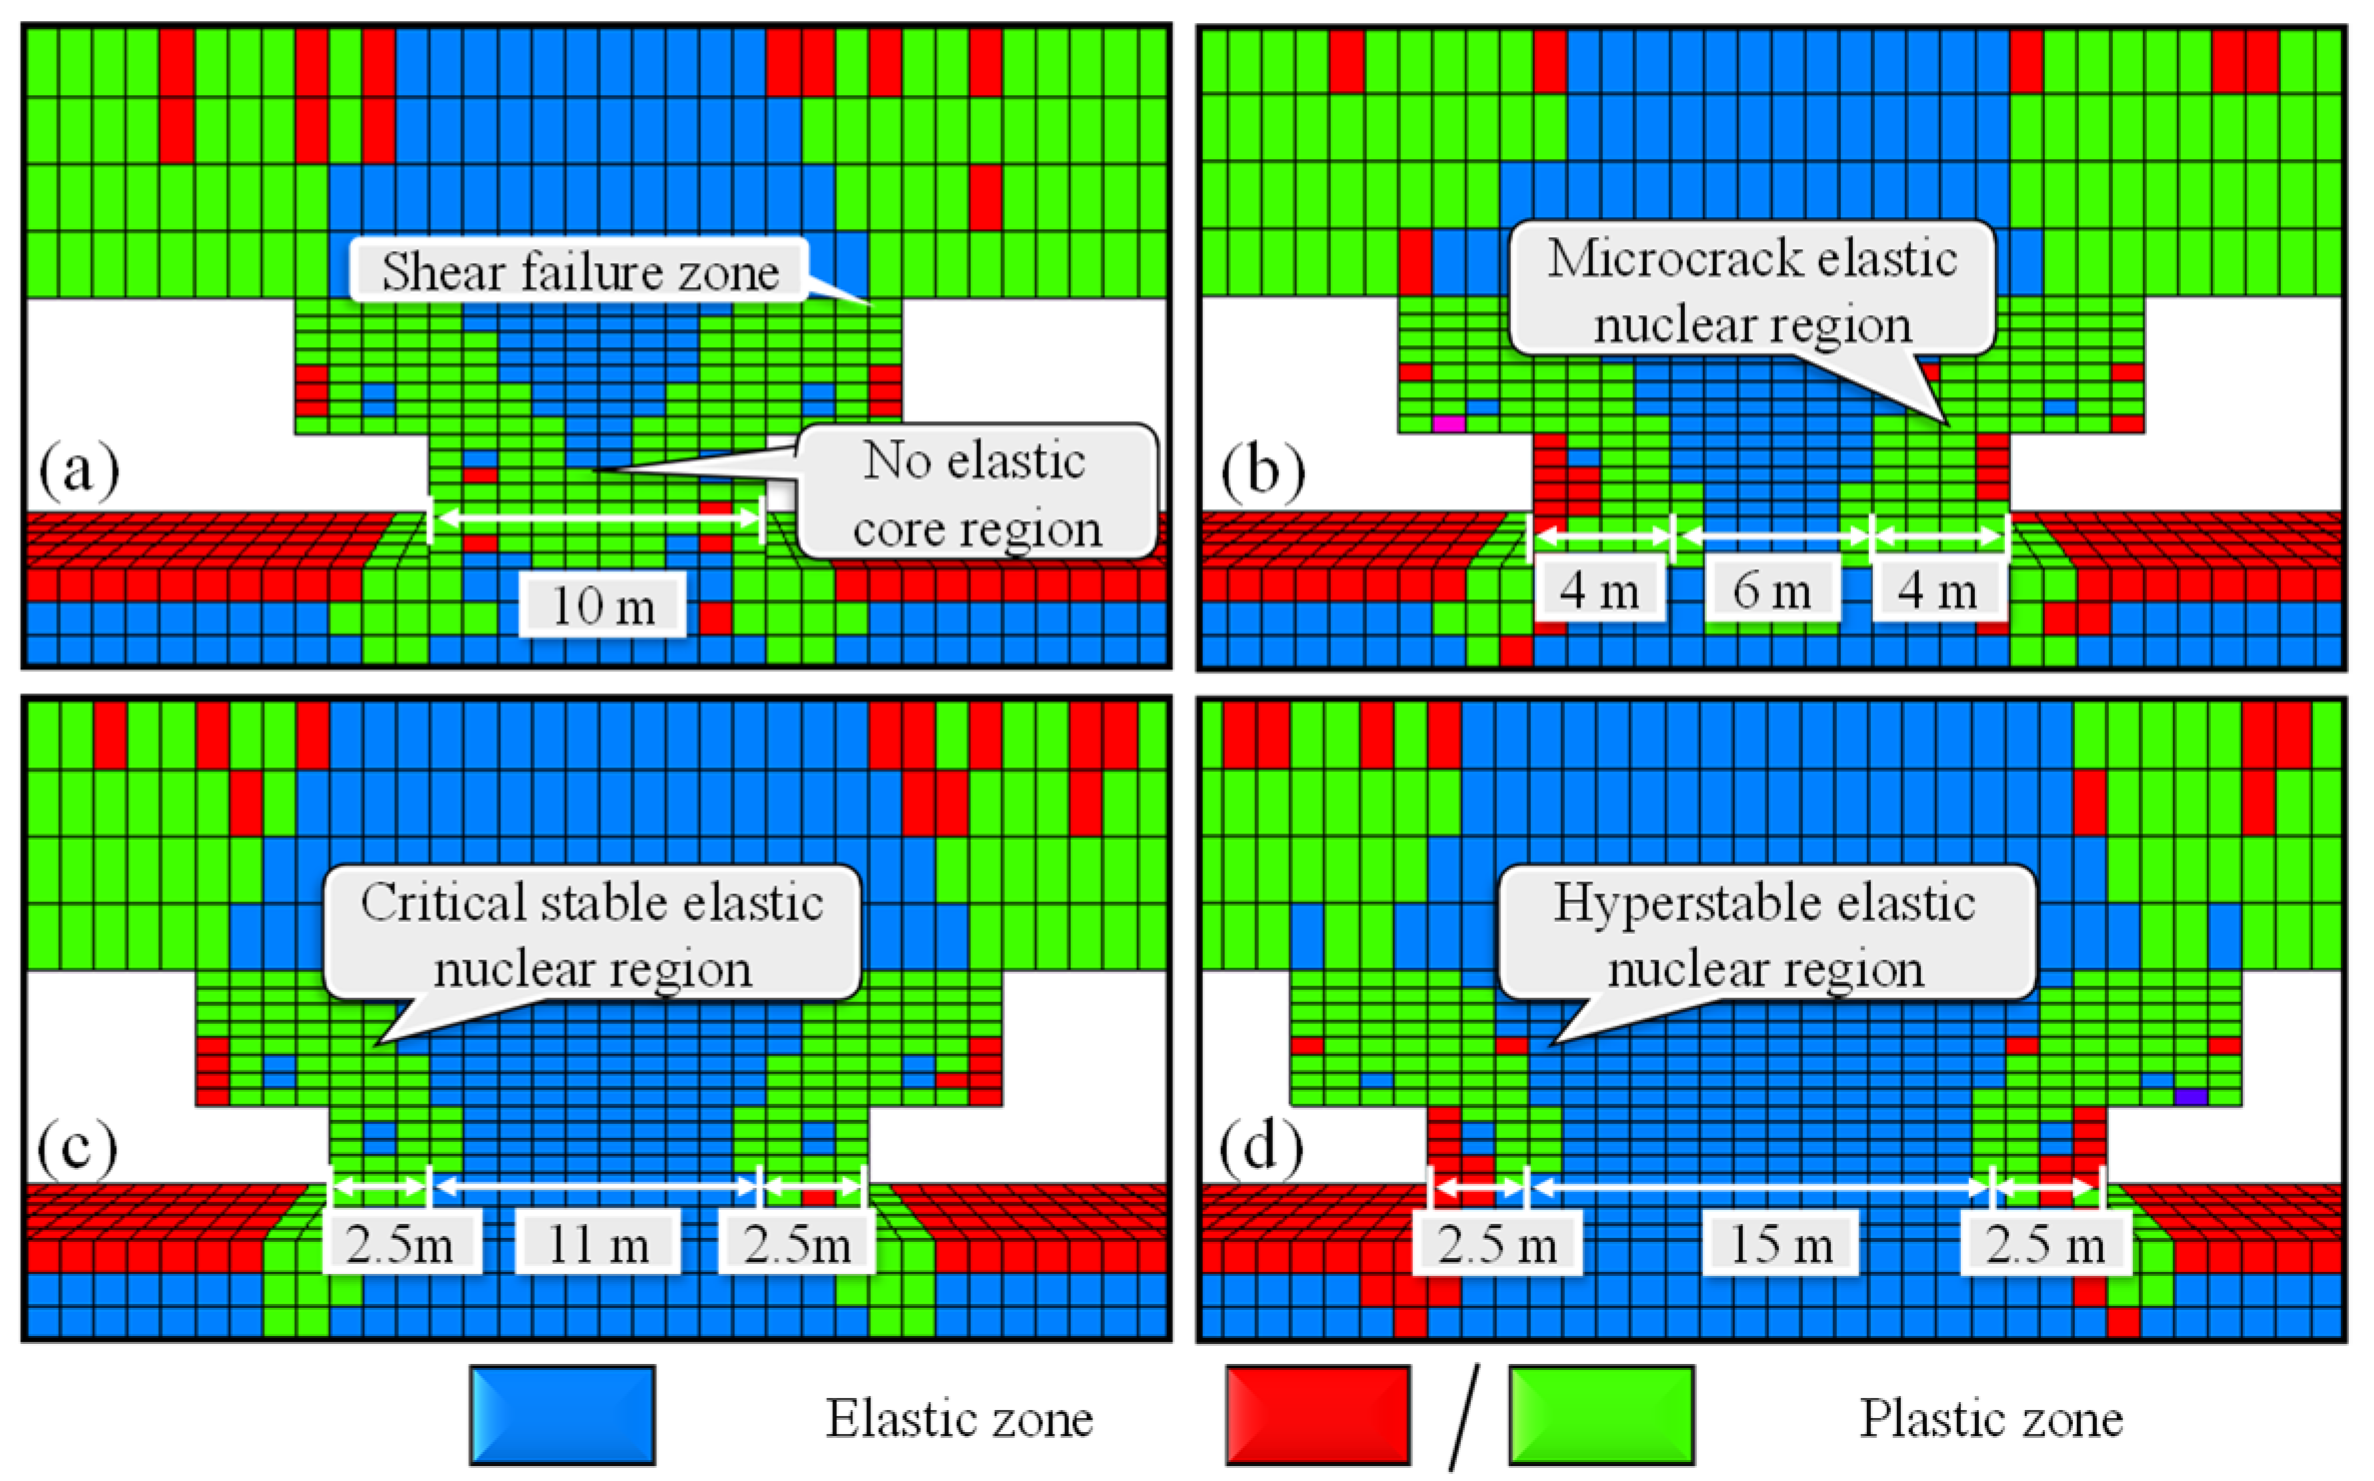
In the design of coal pillar size, plastic zone distribution is often used to determine whether the coal pillar is stable [20,21]. Figure 9a–d show the distribution characteristics of the yield failure units of the 10 m, 14 m, 16 m, and the 20 m coal pillars, respectively.

Figure 9.
Elastic–plastic failure of coal pillars with different widths: (a) 10 m coal pillar; (b) 14 m coal pillar; (c) 16 m coal pillar; (d) 20 m coal pillar.
As shown in Figure 9, from the distribution characteristics of the coal pillar plastic area, it can be concluded that the reasonable selection of section coal pillar width has a great impact on its plastic failure area. When the coal pillar was 10 m (Figure 9a), the internal plastic failure zone had completely penetrated, and the coal pillar did not have bearing capacity; when the coal pillar was 14 m wide (Figure 9b), the plastic failure range was about 8 m, and the internal elastic core zone of nearly 4 m was generated, and the smaller core zone did not guarantee the stability of the coal pillar. When the width of coal pillar was 16 m (Figure 9c), the plastic failure area was reduced to 5 m, and the elastic core area increased to 11 m. The theoretical and empirical analysis showed that it had stability. When the coal pillar was 20 m (Figure 9d), the plastic failure area had no obvious change, and the elastic core area increased to 15 m.
According to the characteristics of plastic zone width change, it experienced “steady increase—sudden decrease at the critical value of coal pillar width (due to the existence of nuclear zone)—stability”. From the characteristics of the elastic core zone width change, we can see that it experienced “no core, broken core, stable core and strong core”. Comprehensive analysis showed that the limit width of coal pillar stability was 14–16 m.
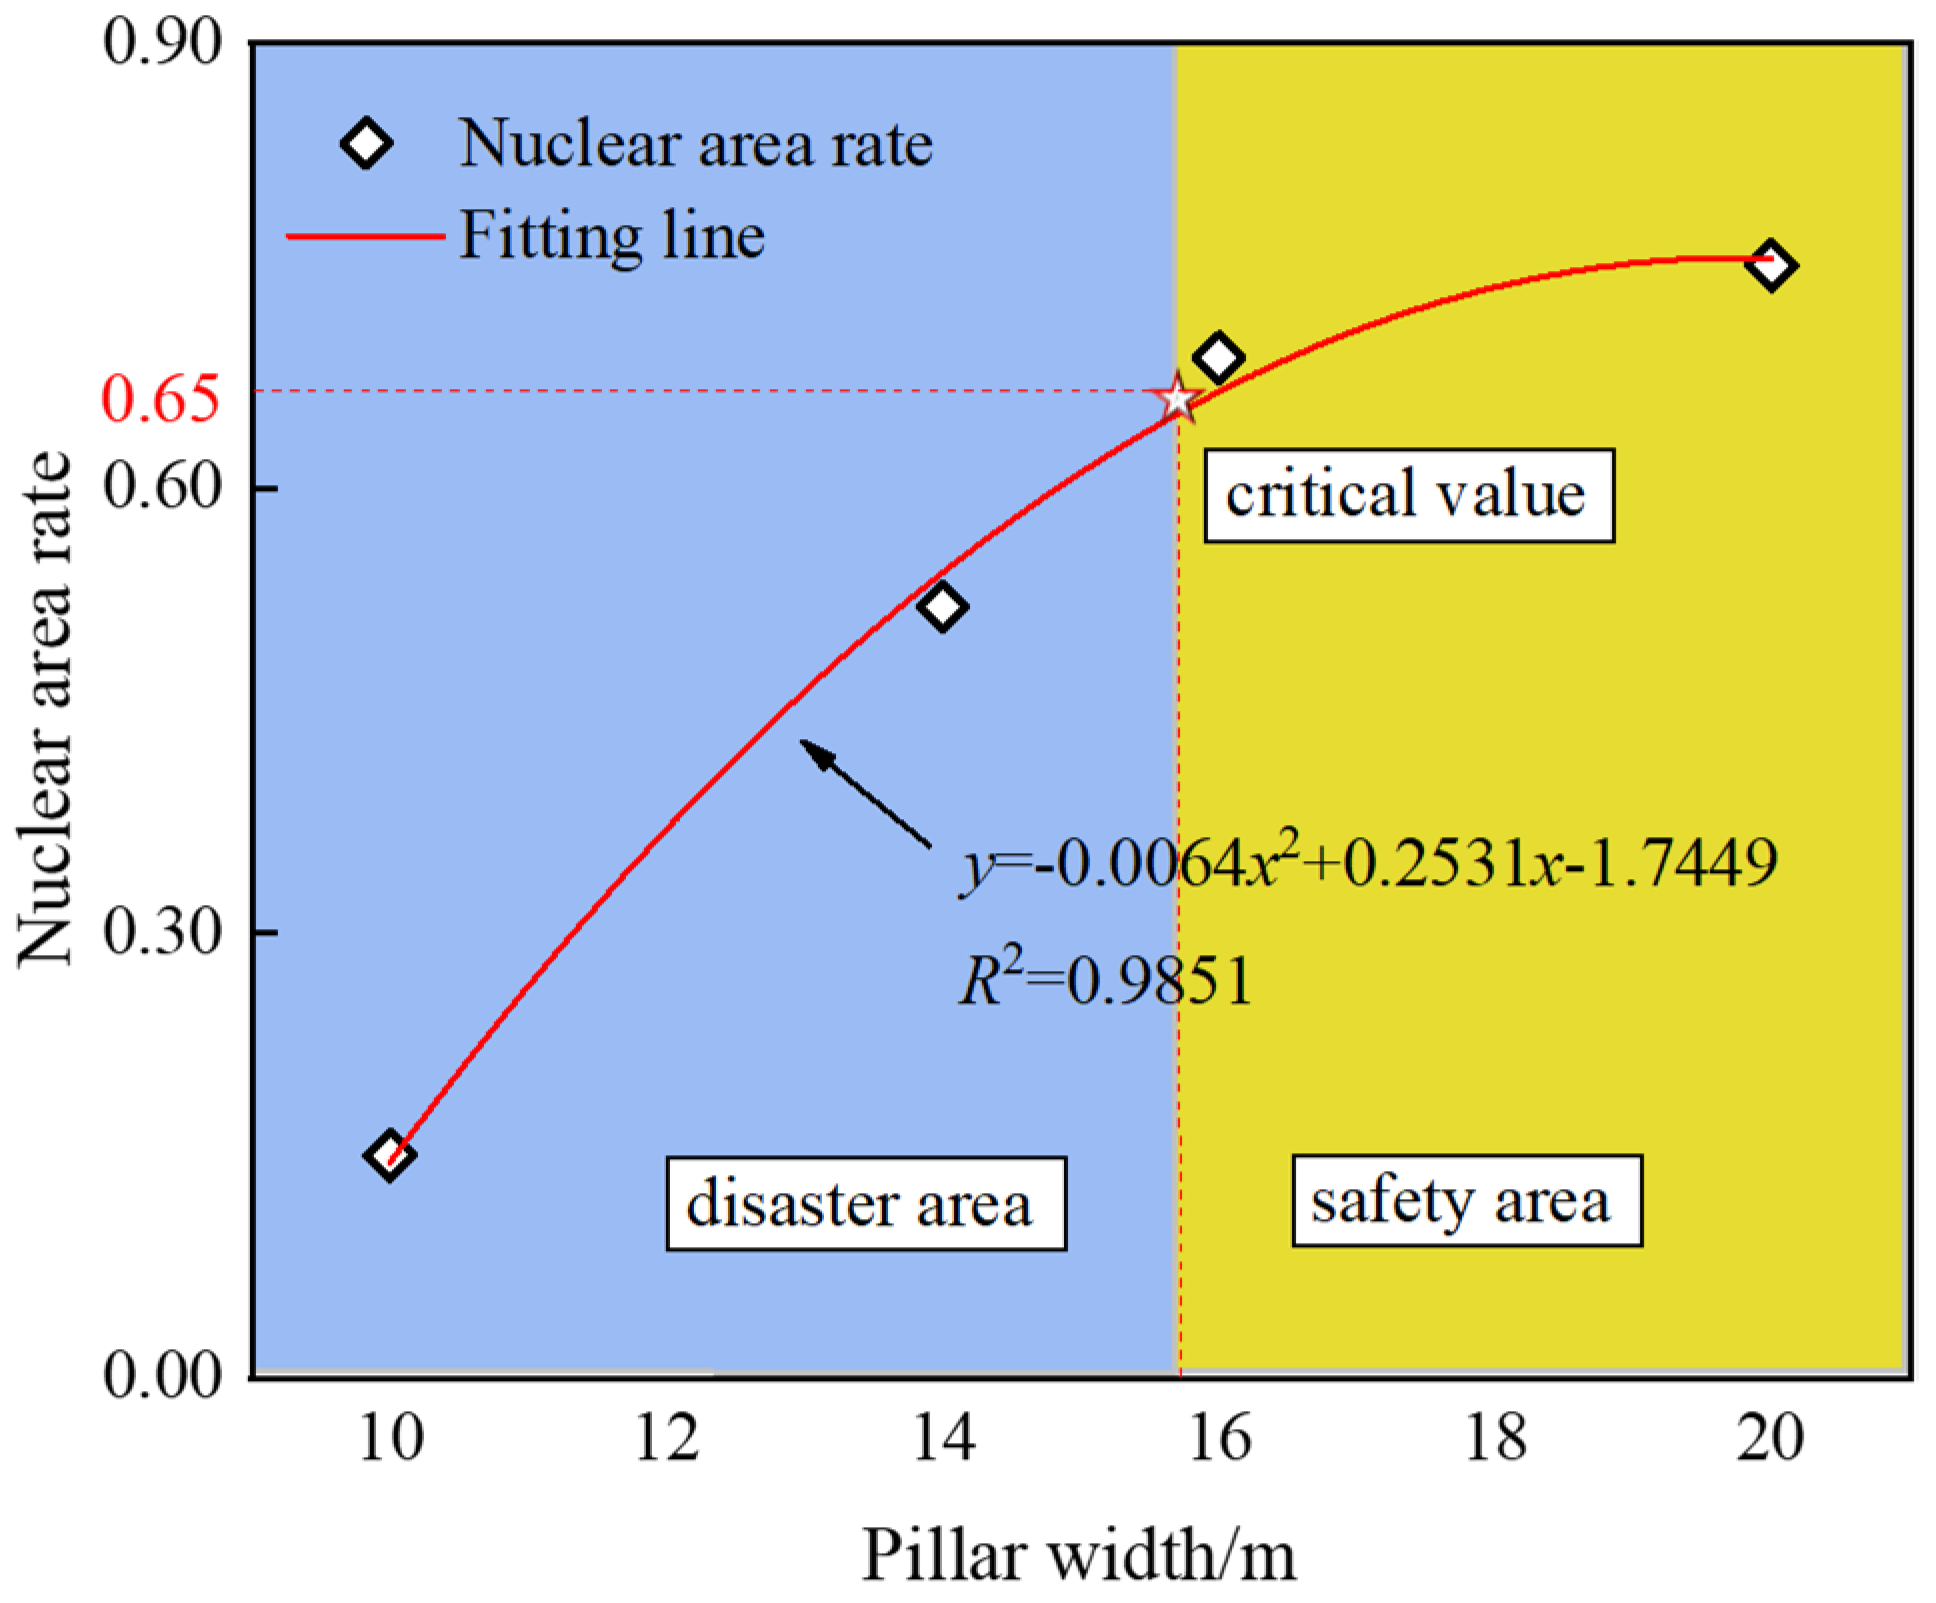
The coal pillar core rate is introduced to quantitatively describe the stability of the coal pillar [22]. The core area rate of the coal pillar is the ratio of the width of the elastic core of the coal pillar to the width of the retained coal pillar, that is . Among them, B is the width of the coal pillar; and x0 and x1 are the width of plastic zone in the upper and lower sections, respectively. Figure 10 shows the statistical chart of the nuclear rate of the coal pillar under different scheme conditions.

Figure 10.
Regression curve between the coal pillar width and coal pillar core area rate.
The stable core area refers to the elastic zone of the coal pillar with a certain geometric size and less coal seam deformation in the core area. A large number of field practices have shown that the nuclear area rate of a stable coal pillar is more than 0.65. Taking into account the stability of the coal pillar and the requirements for safe return, select as the basis to judge the stability of the coal pillar. According to the regression curve of the width of coal pillar and the core area ratio of the coal pillar in Figure 10, the threshold value of the stable coal pillar is about 15.5 m.
5.2.2. Stress Field Analysis
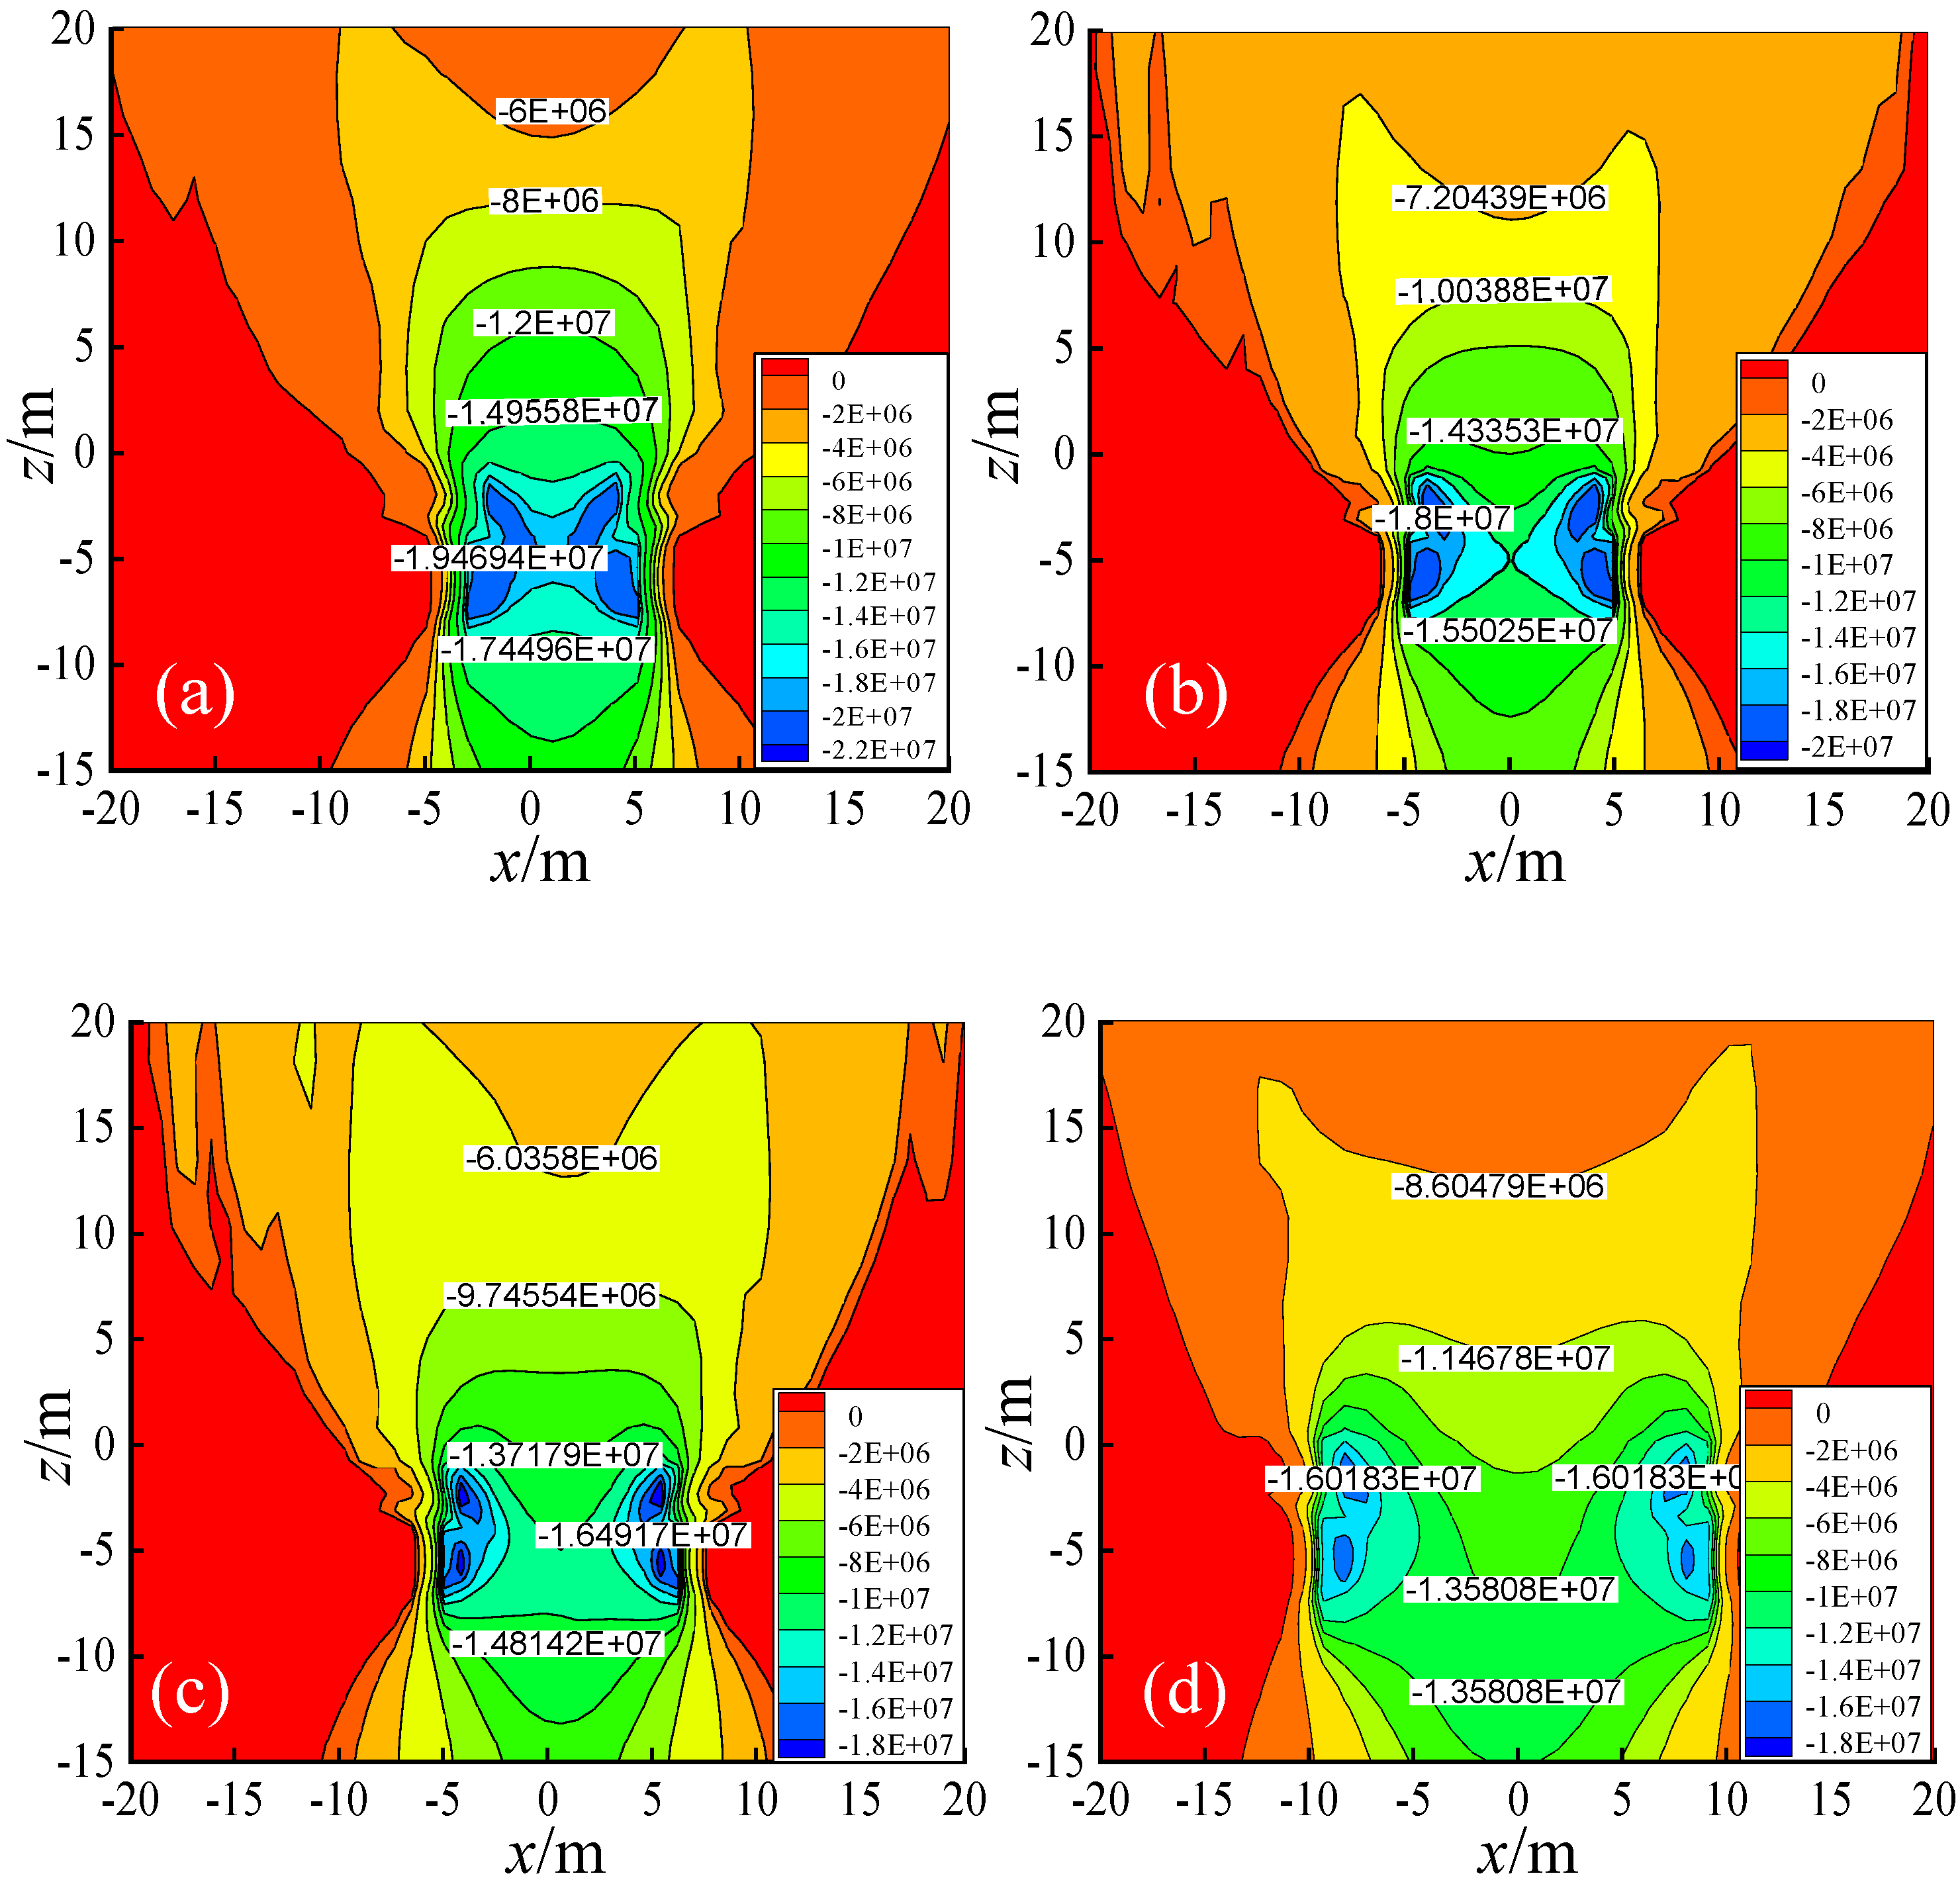
The vertical stresses of the 10 m, 14 m, 16 m, and 20 m coal pillars were obtained synchronously in the simulation process, as shown in Figure 11a–d. With the increase in the width of the coal pillar, the vertical stress in the coal pillar decreased, indicating that the bearing capacity of the coal pillar began to increase, which is beneficial to the maintenance of the roadway. The peak stress of the 10 m coal pillar reached 19 MPa; when the width of the coal pillar reached 14 m, the vertical stress in the coal was close to 18 MPa. When the width of the coal pillar reached 16 m, the peak stress was 16 MPa, the width of the coal pillar further increased, and the stress was further increased and the decreasing trend of the peak value slowed down. It can be seen that the 16 m coal pillar started to go into a stable state. From the shape characteristics, the vertical stress in the coal pillar was a butterfly-shaped distribution; with the increase in the width of the coal pillar, the butterfly wings stretch gradually, and an abrupt change in shape occurred at 16 m of the coal pillar. From the point of view of stress characteristics, the vertical stress on both sides of the coal pillar was symmetrically distributed, and the vertical stress toward the center of the coal pillar increased at first and then decreased. With the increase in the width of the coal pillar, the stress change in the middle superposition area tended to ease, and the stress value decreased gradually. From the position characteristics, with the increase in the coal pillar width, the position of peak stress moved to the boundary of the coal pillar, and the range of the superposition area increased gradually.

Figure 11.
Vertical stress distribution of different coal pillar widths: (a) 10 m coal pillar; (b) 14 m coal pillar; (c) 16 m coal pillar; (d) 20 m coal pillar.
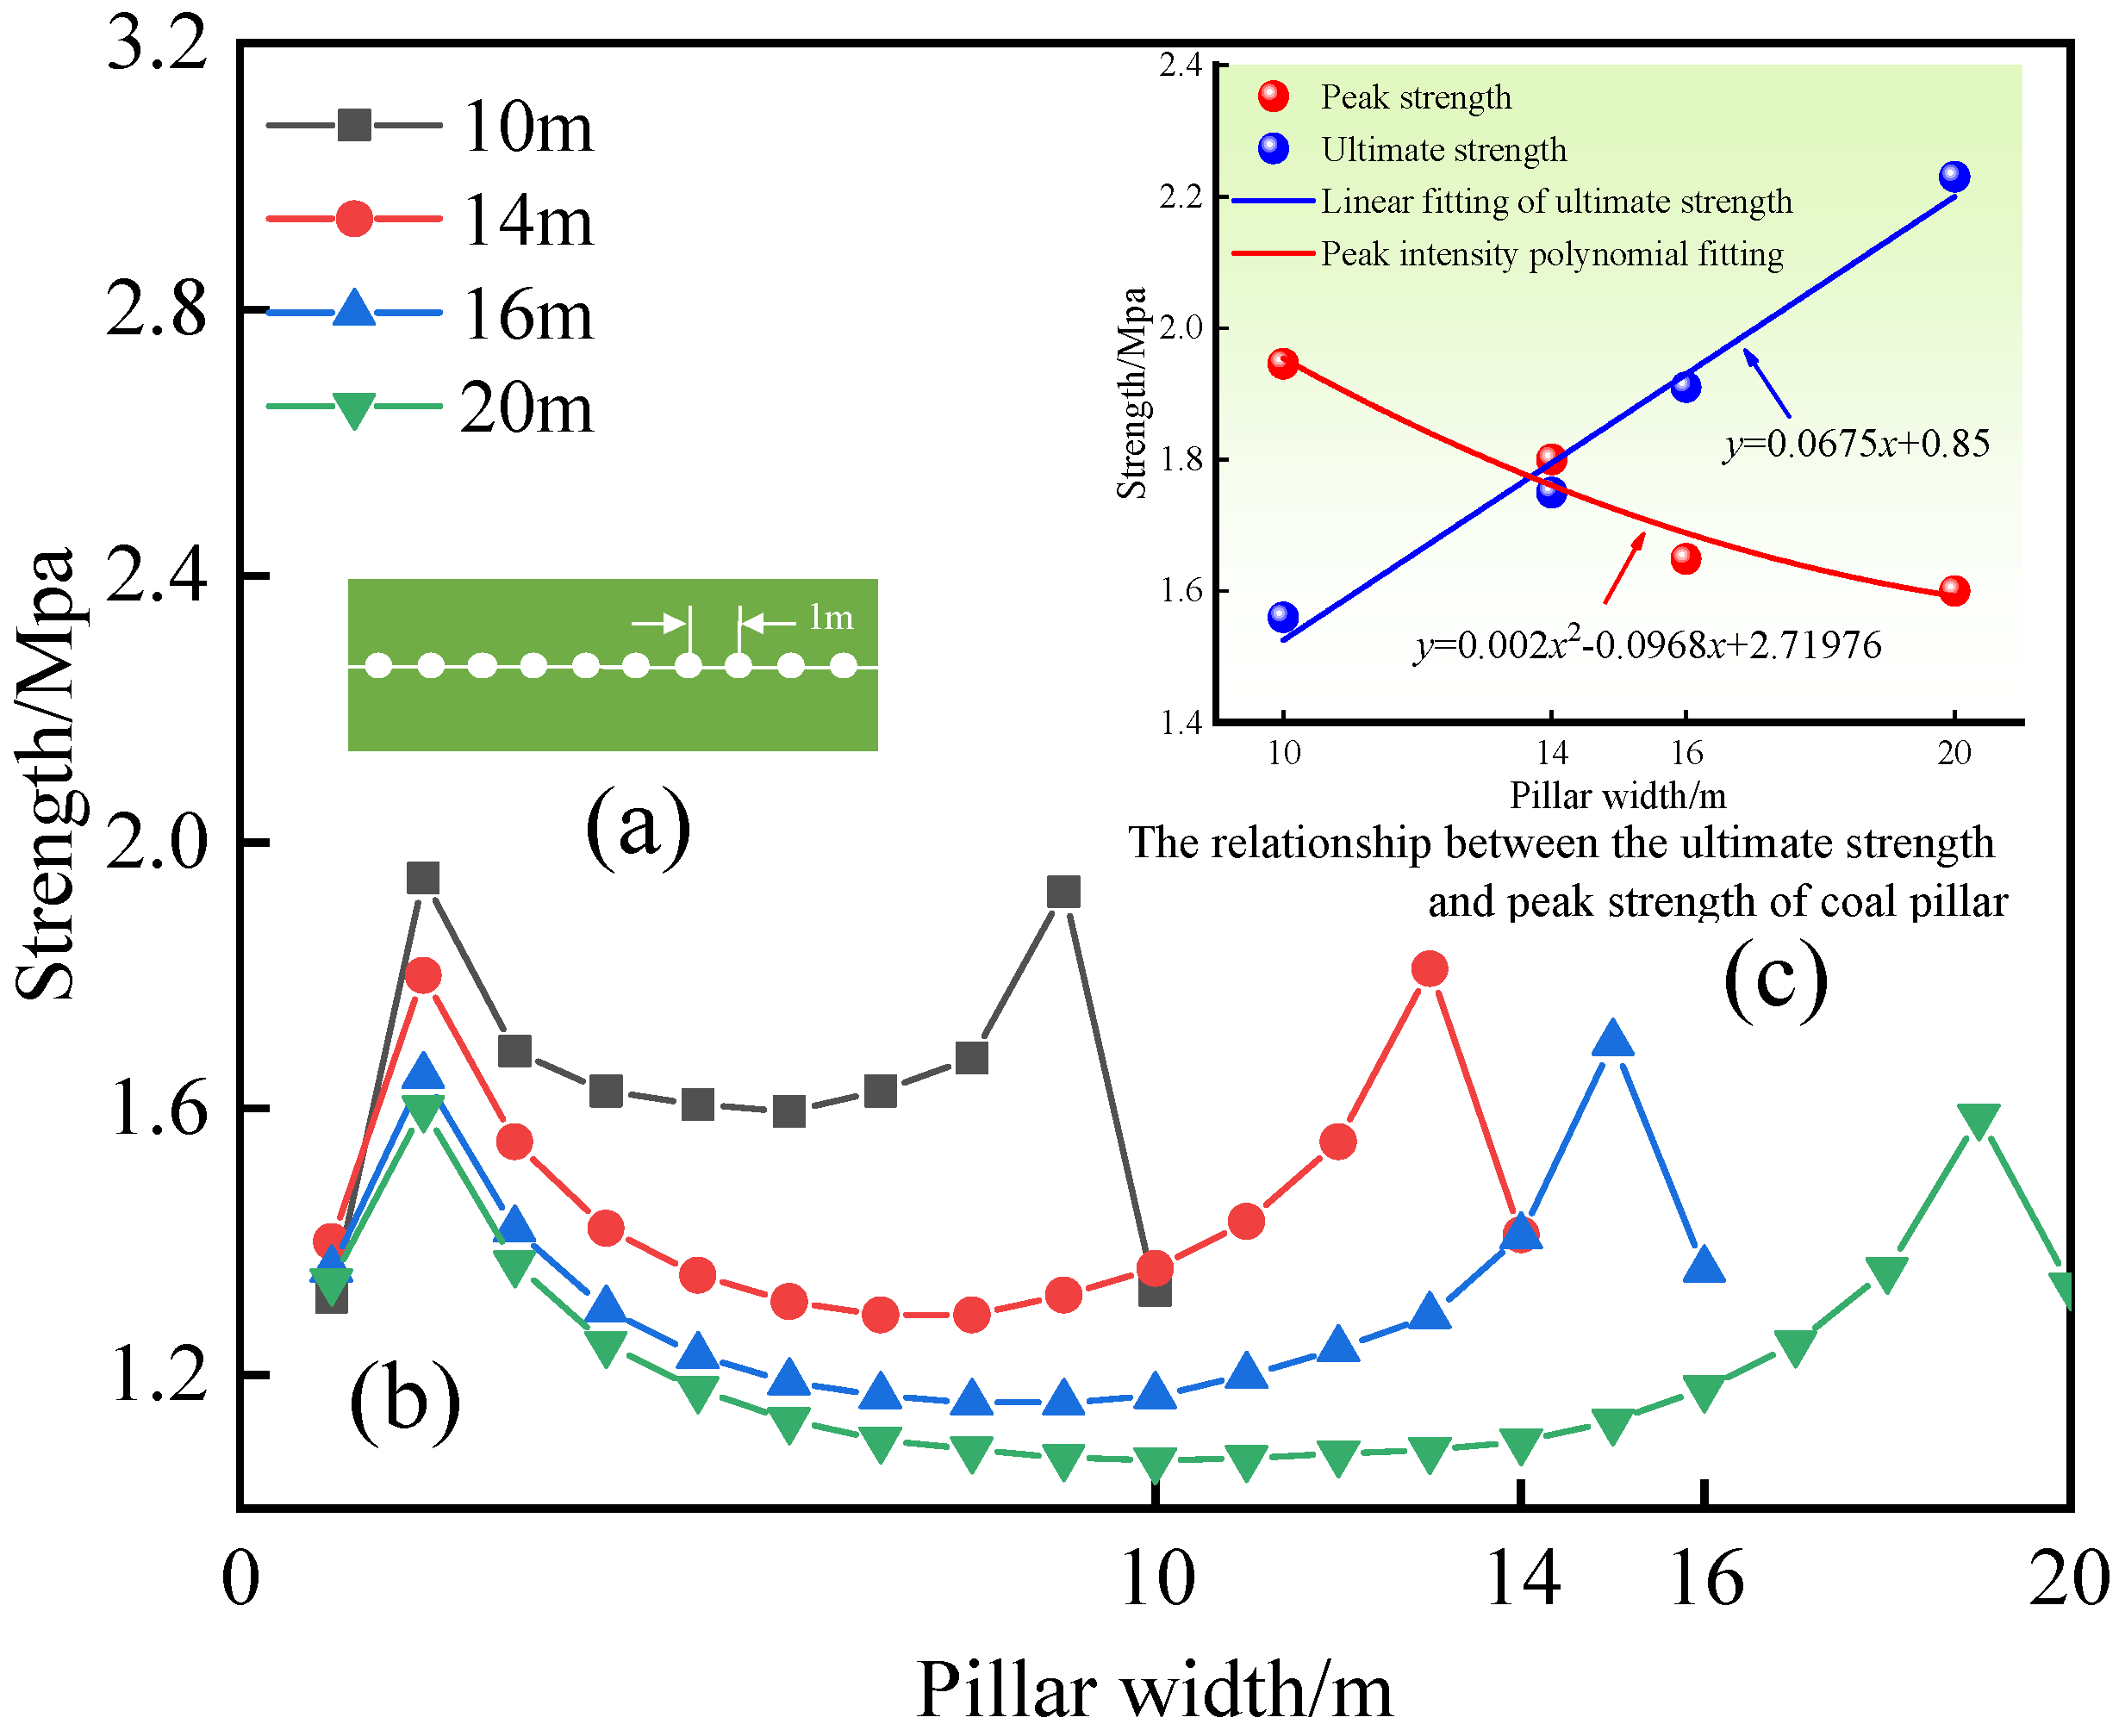
In order to quantitatively analyze the stress field and formulate a reasonable basis for determining the coal pillar, a stress monitoring line was arranged in the coal pillar, and the stress data of the coal pillar were extracted and combined with the ultimate strength (Equation (16)). The relationship curves of the coal pillar width, peak strength, and ultimate load are given, as shown in Figure 12.

Figure 12.
Relation curve of peak strength and ultimate load of coal pillars with different widths: (a) monitoring scheme diagram; (b) vertical stress distribution curve with different coal pillar width; (c) relation curve of peak strength and ultimate load of coal pillars.
Figure 12a shows the monitoring plan, Figure 12b shows the stress distribution curve on the coal pillar measuring line of different plans, and Figure 12c shows the relationship between the peak stress and ultimate strength of the coal pillar of different plans. It can be seen from Figure 12b that the vertical stress distribution on the coal pillar was in the shape of “saddle” as a whole. When the coal pillar was 16 m, the shape differentiation phenomenon occurred, and the middle of the curve presented a nearly 6 m flat bottom. With the increase in the width of the coal pillar, the peak stress decreased from 1.94 MPa to 1.60 MPa, and the downward trend is shown in Figure 12c as the red fitting line. After calculation, the inflection point was at 15.3 m, and the peak stress changed suddenly near 15.3 m. Further analysis of Figure 12c showed that the intersection points of the actual stress peak, the fitted stress peak line, and the coal pillar ultimate strength curve were 13.8 m and 14.5 m, respectively. According to the comprehensive analysis, the width of the coal pillar should be more than 15.3 m.
5.2.3. Result Discussion
According to the calculated values of each path, the threshold value of the coal pillar in the section was 13.8–15.5 m. Considering the actual production of the coal mine, it is necessary to ensure the anchoring effect of the bolt. According to the analysis of the characteristics of the plastic zone, when the coal pillar was 14 m, there was a broken zone of about 8 m at both ends, and the bolt failed, so the stability of the roadway cannot be guaranteed. Further comparison of the plastic zone and the stress field state of the coal pillar with the width of 15.5 m and 15.3 m showed no obvious difference, but considering the secondary disaster control and other factors of the coal mine, the stability was determined. The coal pillar threshold was 15.5 m. According to the error checking calculation, the error of finite difference algorithm of the empirical formula, and simulation experiment was 4.6% and 5.9%, respectively.
6. Identification System Results and Engineering Analysis
The Delphi method was used to analyze the index values of the three techniques [23,24]. Five experts were invited to participate in the survey including four university professors and one enterprise employee to rate each index according to the 0–10 scale method. The judgment matrix, the calculated mean value, the index weight, the final value, and the inverse error value given by the experts for each index were then sorted out. As shown in Table 5, the final value of the reasonable coal pillar was 16.03 m. In the field, at the 16 m coal pillar, the surrounding rock deformation of the roadway was small, and the control effect was good. From this, the relative error (Error 1) of three calculation indexes was deduced: empirical formula (1.61%) < simulation experiment (2.97%) < finite difference numerical calculation (3.12%). After the calculation of the DM evaluation system, the relative error (Error 2) was further reduced to 0.31%.

Table 5.
Index judgment matrix and calculating weight and final value.
7. Conclusions
(1) Based on the analysis of the interaction between the overlying rock and coal pillar, the structural model of a “non-contact cantilever triangle” was established, and the equations for calculating the critical time of triangle failure were derived.
(2) Thirty-six sets of datasets of the fully mechanized top coal caving face in a thick coal seam were collected and screened by MIV features. The order of importance of the factors affecting the width of coal pillar in section was as follows: elastic modulus > bulk density > internal friction angle > working face length > buried depth > Poisson’s ratio > tensile strength > coal thickness > cohesion > dip angle.
(3) The prediction model of the MIV-GA-BP coal pillar was established. Through the simulation experiment, the relative error between the predicted value and the expected value was less than 5%, which has good stability to the multi-factor nonlinear coupling prediction problem to provide a reference means for the retention of coal pillars in the field section of the project.
(4) According to the results of numerical simulation, the elastic core area of the 10, 14, 16, and 20 m coal pillars in turn presented four states: no core, broken core, stable core, and strong core. Combined with the relationship between the plastic zone and the core area rate of the coal pillars, the stress field and the ultimate strength of coal pillars, the width of coal pillars under the numerical calculation method was determined.
(5) Based on the basic theory, artificial intelligence, numerical calculation, and intelligent decision research method, the intelligent identification system of coal pillar stability in a fully mechanized top coal caving face section of a thick coal seam was established.
Author Contributions
Conceived, designed, and analyzed the test results, P.S.; Performed the experiments and wrote the manuscript, J.D.; Supervised the research work, Q.Z. Both authors revised and proofread the manuscript. All authors have read and agreed to the published version of the manuscript.
Funding
Financial support for this work was provided by the National Natural Science Foundation of China (No. 51904227), the 973 Key National Basic Research Program of China (No. 2015CB251602), the Natural Science Foundation of Shaanxi Province (No. 2018JQ5194), the China Postdoctoral Science Foundation (No. 2017M623328XB), the Science and Technology Innovation Team Project of Shaanxi Province (No. 2018TD-038), the Hunan Province Engineering Research Center of Radioactive Control Technology in Uranium Mining and Metallurgy and Hunan Province Engineering Technology Research Center of Uranium Tailings Treatment Technology (No. 2018YKZX2001), and the Opening Project of Cooperative Innovation Center for Nuclear Fuel Cycle Technology and Equipment, University of South China (No. 2019KFY25). The support from these agencies is gratefully acknowledged.
Conflicts of Interest
The authors declare no conflicts of interest.
References
- Yuan, L. Scientific conception of precision coal mining. J. China Coal Soc. 2017, 42, 1–7. [Google Scholar]
- Yuan, L. Scientific problem and countermeasure for precision mining of coal and associated resources. J. China Coal Soc. 2019, 44, 1–9. [Google Scholar]
- Yuan, L. Framework and key technologies of Internet of things for precision coal mining. J. Ind. Mine Autom. 2017, 43, 1–7. [Google Scholar]
- Jia, B.; Tsau, J.S.; Barati, R. Investigation of Shale-Gas-Production Behavior: Evaluation of the Effects of Multiple Physics on the Matrix. SPE Reserv. Eval. Eng. 2019. [Google Scholar] [CrossRef]
- Kong, D.Z.; Wang, Z.H.; Li, X.M.; Wang, Y.L.; Wang, C. Study of reasonable width of full-mechanized top-coal caving with large mining height. J. Rock Soil Mech. 2014, 35, 460–466. [Google Scholar]
- Zhang, G.C.; He, F.L.; Lai, Y.H.; Song, J.W.; Xiao, P. Reasonable width and control technique of segment coal pillar with high-intensity fully-mechanized caving mining. J. China Coal Soc. 2016, 41, 2188–2194. [Google Scholar]
- Liu, J.H.; Jiang, F.X.; Wang, N.G.; Li, Z.S.; Zhang, Z.G. Research on reasonable width of segment pillar of fully mechanized caving face in extra-thick coal seam of deep shaft. J. Chin. J. Rock Mech. Eng. 2012, 31, 921–927. [Google Scholar]
- Kong, L.H.; Jiang, F.X.; Liu, J.; Ye, G.X.; Wang, C.W.; Song, G.D. High-precision micro seismic monitoring system to reasonable width of segment. J. China Coal Soc. 2009, 34, 871–874. [Google Scholar]
- Lai, X.P.; Cui, F.; Cao, J.T.; LU, Z.H.; Kang, Y.L. Analysis on characteristics of overlying rock caving and fissure conductive water in top-coal caving working face at three soft coal seam. J. China Coal Soc. 2017, 42, 148–154. [Google Scholar]
- Xi, J.M.; Mao, J.H.; Yang, G.S.; Wang, J.F. Method for Determining Rational Pillar Width in Mining Roadway Along Goaf. J. Min. Saf. Eng. 2008, 25, 400–403. [Google Scholar]
- Xie, G.X.; Yang, K.; Chang, J.C. Effect of coal pillar width on the stress distribution law of surrounding rocks in fully mechanized top-coal caving mining face. J. Univ. Sci. Technol. Beijing 2006, 28, 1005–1008. [Google Scholar]
- Wei, X.Y.; Chen, J.F.; Zou, Y.F. Influence factors and change law of protection coal pillars left. Coal Sci. Technol. 2006, 34, 85–87. [Google Scholar]
- Huang, Q.X.; Cao, J. Research on Coal Pillar Malposition Distance Based on Coupling Control of Three-Field in Shallow Buried Closely Spaced Multi-Seam Mining, China. Energies 2019, 12, 462. [Google Scholar] [CrossRef]
- He, T.; Huang, Z.Z.; Li, C.R.; Luo, F.; Wang, D.P. Temporal and spatial evolution characteristics of lateral coal stress in fully mechanized top coal caving mining working face inultra-thick coal seam. J. Min. Saf. Eng. 2018, 35, 100–105. [Google Scholar]
- Qian, M.G.; Shi, P.W. Mine Pressure and Strata Control; China University of Mining and Technology Press: Xuzhou, China, 2003. [Google Scholar]
- Wang, Z.Y.; Lai, X.P.; Liu, X.M.; Cui, F. Construction and application of the GRNN model of coal section pillar width prediction in fully mechanized face. J. Xi’an Univ. Sci. Technol. 2019, 39, 209–216. [Google Scholar]
- Assareh, E.; Behrang, M.A.; Assari, M.R. Application of PSO (particle swarm optimization) and GA (genetic algorithm) techniques on demand estimation of oil in Iran. Energy 2012, 35, 5223–5229. [Google Scholar] [CrossRef]
- Wang, X.C. MATLAB Neural Network 43 Case Analysis; University of Aeronautics and Astronautics Press: Beijing, China, 2013. [Google Scholar]
- Sun, W.; Gao, Q. Exploration of energy saving potential in China power industry based on Adaboost back propagation neural network. J. Clean. Prod. 2019, 217, 257–266. [Google Scholar] [CrossRef]
- Ma, N.J.; Li, J.; Zhao, Z.Q. Distribution of the deviatoric stress field and plastic zone in circular roadway surrounding rock. J. China Univ. Min. Technol. 2015, 44, 206–213. [Google Scholar]
- Guo, X.F.; Ma, N.J.; Zhao, Z.Q. The general shapes and criterion for surrounding rock mass plastic zone of round roadway. J. China Coal Soc. 2016, 41, 1871–1877. [Google Scholar]
- Wang, W.Y. Study on Reasonable Width of Coal Pillar in Fully Mechanized Top Coal Caving Mining Section of Deep Well; Taiyuan University of Technology: Taiyuan, China, 2014. [Google Scholar]
- Han, S.F.; Zhu, R.F.; Cheng, J.L. Construction of an evaluation index system for the innovativeness of nursing papers using the Delphi method. Chin. Nurs. Res. 2017, 4, 151–154. [Google Scholar] [CrossRef]
- He, W.M.; Cheng, Y.M.; Li, Y. The research of index system of power supply service quality evaluation. J. Demand Side Manag. 2017, 19, 41–44. [Google Scholar]
© 2020 by the authors. Licensee MDPI, Basel, Switzerland. This article is an open access article distributed under the terms and conditions of the Creative Commons Attribution (CC BY) license (http://creativecommons.org/licenses/by/4.0/).

