Article

The Effect of Light Wavelength on CO2 Capture, Biomass Production and Nutrient Uptake by Green Microalgae: A Step Forward on Process Integration and Optimisation

by
Ana F. Esteves
1,
Olívia S. G. P. Soares
2,
Vítor J. P. Vilar
2,
José C. M. Pires
1 and
Ana L. Gonçalves
1,*
1
LEPABE—Laboratory for Process Engineering, Environment, Biotechnology and Energy, Faculty of Engineering, University of Porto, Rua Dr. Roberto Frias, 4200-465 Porto, Portugal
2
Laboratory of Separation and Reaction Engineering-Laboratory of Catalysis and Materials (LSRE-LCM), Faculty of Engineering, University of Porto, Rua Dr. Roberto Frias, 4200-465 Porto, Portugal
*
Author to whom correspondence should be addressed.
Energies 2020, 13(2), 333; https://doi.org/10.3390/en13020333
Submission received: 7 December 2019 / Revised: 23 December 2019 / Accepted: 7 January 2020 / Published: 9 January 2020
(This article belongs to the Special Issue Carbon Dioxide (CO2) Utilization)

Abstract

:
Microalgae have drawn the attention of several researchers as an alternative to the traditional physicochemical CO2 capture methods, since they can convert CO2 and water into organic matter and release oxygen into the atmosphere. Microalgal growth can be improved by changing light supply, such as light intensity, wavelength, and photoperiod. In this study, the effect of different light wavelengths on CO2 capture, nutrient removal from a synthetic effluent and biomass production of Chlorella vulgaris, Tetradesmus obliquus and Neochloris oleoabundans was studied. The experiments were conducted with light-emitting diodes (LEDs) with different wavelengths: 380–750 nm (white), 620–750 nm (red) and 450–495 nm (blue). The maximum specific growth rate was obtained by N. oleoabundans with white LEDs (0.264 ± 0.005 d−1), whereas the maximum biomass productivity (14 ± 4 mgdw L−1 d−1) and CO2 fixation rate (11.4 mgCO2 L−1 d−1) were obtained by C. vulgaris (also with white LEDs). Nitrogen and phosphorus removal efficiencies obtained under white light conditions were also the highest for the three studied microalgae.

1. Introduction

Since the pre-industrial period, the emissions of carbon dioxide (CO2) have been rapidly increasing due to anthropogenic activities, mainly the combustion of fossil fuels [1]. The increase of the atmospheric CO2 concentration can lead to ocean acidification and the intensification of the greenhouse effect, resulting in various negative impacts, such as [2,3,4]: (i) the increase of the global average temperature; (ii) the melting of polar ice; and (iii) the rise of sea levels. To address this environmental problem, the scientific community has been exploring diverse options to effectively capture CO2 from the atmosphere or directly from emission sources.
Currently, the most used CO2 capture technologies include physical adsorption, chemical absorption, membrane separation and cryogenic fractionation [5]. Physical adsorption uses a solid adsorbent to separate and capture CO2 from flue gases. The main limitations of this technology are: (i) the necessity of a pre-treatment for the flue gas; (ii) the low adsorption capacity of the adsorbents; and (iii) the high pressure and temperature required for the regeneration of the adsorbent [5]. Chemical absorption involves mainly the use of amine solvents to capture CO2 from flue gases and is one of the most applied techniques. However, this method requires high energy for the regeneration of the applied amine solvent [6]. Besides, the amine solvents often react with SO2, which results in their degeneration; they also react with oxygen, generating corrosive products that lead to the corrosion of mechanical parts [5]. It is also possible to use a membrane to separate CO2 from other gases. The main downsides of this technique are the high cost of the membranes and their low CO2 selectivity [6]. Another method used for CO2 capture is cryogenic fractionation, which is a process that uses condensation to separate gaseous components. The main disadvantage of this technique is that high energy is required to ensure an acceptable refrigeration level for the process [5]. After capture, CO2 can be stored in deep geological formations, in the ocean or in the form of mineral carbonates. In geological storage, leakage of CO2 to the atmosphere can occur, posing several negative consequences for human and animal health. In the case of ocean storage, the increase of CO2 levels in the ocean can contribute to its acidification, affecting marine lifeforms. Regarding mineralisation, its use as storage technique has limited applicability, due to the high costs associated with this process [7].
Due to sustainability issues, the use of photosynthetic microorganisms (e.g., microalgae) has attracted the interest of many researchers worldwide as an alternative to the above-mentioned CO2 capture methods. When growing autotrophically, microalgae can convert CO2 and water into organic matter and release oxygen into the atmosphere [8]. The capacity of microalgae to capture CO2 is 10 to 50 times greater than that of terrestrial plants, with approximately 1.83 kg of CO2 being captured per kilogram of microalgal biomass produced [9,10]. Considering that worldwide microalgal cultivation can reach an average of 5000 tonnes of dry algal biomass per year, it is possible to estimate that microalgae can fix 9.15 kt of CO2 per year [11]. Another advantage of cultivating microalgae is that arable land is not needed to cultivate these microorganisms, so food supplies, arable land and forests are not compromised [12]. As photosynthetic organisms, microalgae need nutrients (such as nitrogen and phosphorus) to grow and, since these nutrients are typically found in wastewater, microalgae can grow and remove them from different effluents containing the referred nutrients [13]. Microalgae can accumulate large amounts of lipids that can be extracted and converted into biofuels [12]. When the produced biomass is used as a feedstock for biofuels, a sustainable carbon cycle can be achieved: a near-zero balance of carbon emissions is possible because the CO2 emitted from the burning of fuels is captured by microalgae for their growth and the consequent production of more biomass, which can be further used as a source for biofuel production [5]. After extraction of the compounds of interest, the residual biomass can be used for biomethane (biogas) production and also for application as bio-fertiliser [13,14]. When cultivated in controlled conditions, microalgal biomass can have several other applications, as it is very rich in proteins and carbohydrates, being a valuable resource for application as animal feed and human food [15]. Furthermore, these microorganisms can accumulate a great diversity of compounds, such as pigments, antioxidants, vitamins, among others, which give them a great commercial appeal [12].
Despite the aforementioned advantages, microalgal production for CO2 capture still presents some challenges, especially concerning the achievement of high biomass productivities at reduced costs. Therefore, culture parameters should be optimised to improve biomass productivity. Microalgal growth is influenced by a variety of factors, such as light, nutrients availability, pH, temperature, salinity and dissolved oxygen concentration. Since microalgae are photosynthetic microorganisms, they require CO2 and light energy to perform these reactions. CO2 assimilation by microalgae depends on microalgal species, which have different tolerances to CO2 concentration, applied cultivation system types, operating conditions and environmental factors. Since these microorganisms need light for their metabolic activity, the growth of microalgae is strongly influenced by this culture parameter, both in terms of quantity (light intensity and light period) and quality (wavelength, the light source used, among others). Different artificial light sources can be used for microalgal cultivation, such as halogen lamps, incandescent bulbs, fluorescent lamps and light-emitting diodes (LEDs). These light sources differ from each other in the spectrum, wavelength distribution, energy consumption and cost. Based on these characteristics, the most commonly used light sources for microalgal production are fluorescent lamps and LEDs. The use of LEDs as light source allows better control of light (when compared with fluorescent lamps) and the use of different wavelengths, which can be favourable for biomass production [16]. The light wavelength used in microalgal growth can induce different effects. Red light can promote higher growth rates with smaller cells and low nutrient uptake; blue light affects gene expression and some metabolic pathways of microalgae, triggering a high nutrient uptake, but inducing lower growth rates with larger cells. Green microalgae cannot use yellow and green light effectively due to the lack of phycobilins [17]. Taking into account the important role of light source on microalgal biomass production, this study aimed to evaluate the effect of different light wavelengths (white, 380–750 nm; red, 620–750 nm; and blue, 450–495 nm) on the growth, biomass productivity, and therefore CO2 capture, of three green microalgae: Chlorella vulgaris, Tetradesmus obliquus and Neochloris oleoabundans. Considering the ability of microalgae to remove nutrients, nitrogen and phosphorus removal efficiencies were also evaluated in the studied conditions, to assess the possibility of process integration (microalgal biomass production with CO2 and nutrients uptake) and, consequently, production cost reduction.

2. Materials and Methods

2.1. Microorganisms and Culture Medium

The microalgae C. vulgaris CCAP 211/11B and T. obliquus CCAP 276/34 were obtained from the Culture Collection of Algae and Protozoa (CCAP, Scotland, UK) and N. oleoabundans UTEX 1185 was obtained from the University of Texas Culture Collection of Algae (UTEX, Texas, USA). The microalgae were inoculated in modified OECD (Organization for Economic Co-operation and Development) test medium, with the same composition as the one reported by Gonçalves, et al. [18]. Microalgal stock solutions were prepared in 100-mL Erlenmeyer flasks (50 mL working volume) using the above-referred culture medium under aseptic conditions. Erlenmeyer flasks were maintained at a constant temperature of 25 °C under continuous light supply with an intensity of approximately 6.50 µmol m−2 s−1 and agitation was promoted by an orbital shaker (Unimax 1010, Heidolph, Germany) set at 100 rpm (rotations per minute).

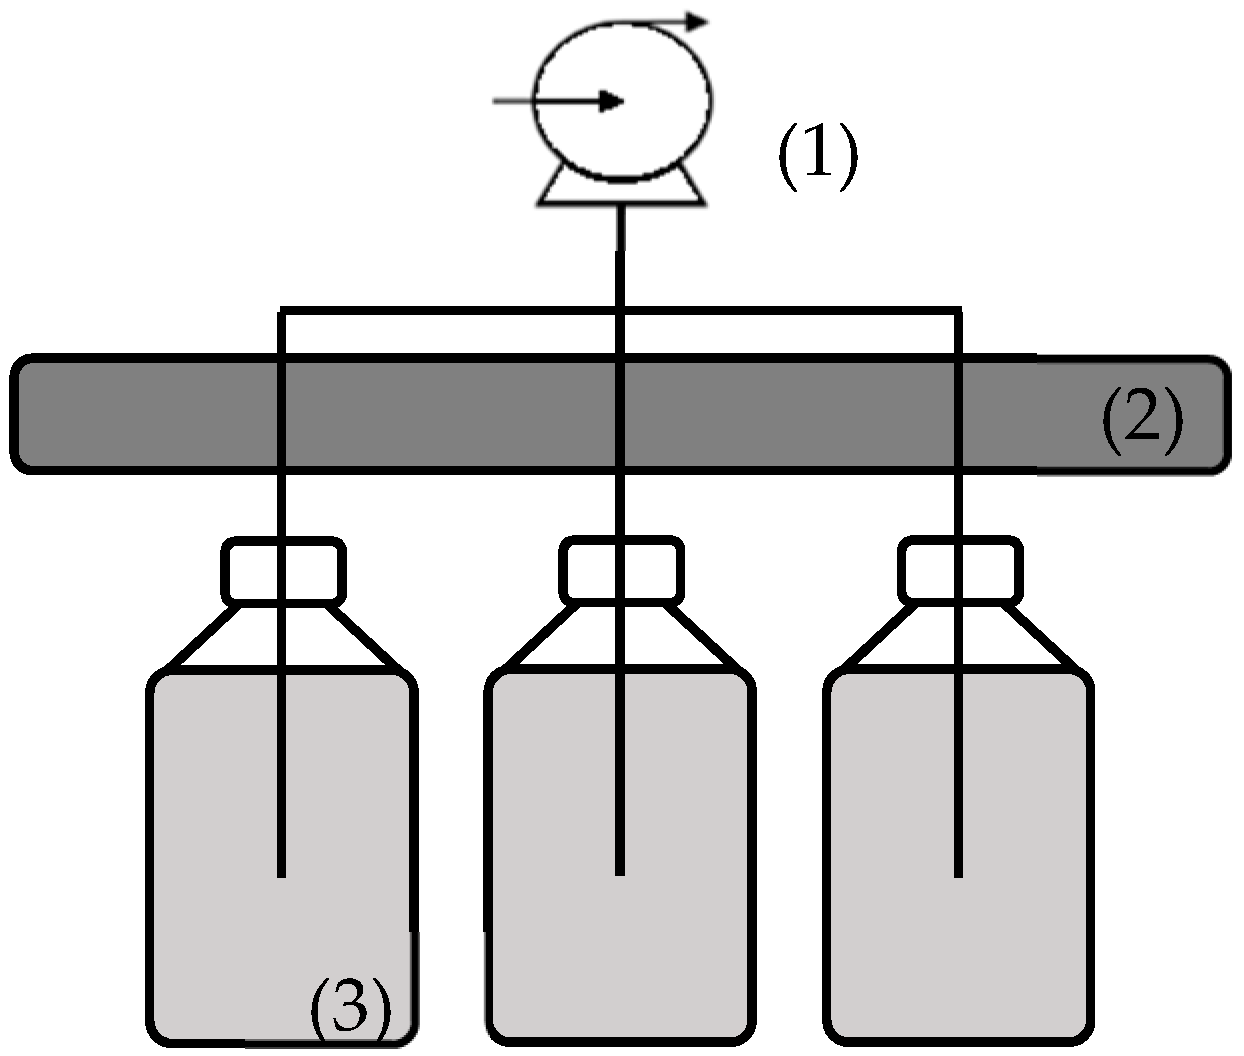
2.2. Experimental Setup and Cultivation Conditions

Batch experiments using the above-referred culture medium were performed for 12 days in 1000-mL flasks with a working volume of 900 mL. The average temperature during the experiences was 21 ± 2 °C. Agitation of the cultures was promoted by the injection of atmospheric air (previously filtered through 0.22-μm cellulose acetate membrane filters). Light was continuously supplied (24:0 light:dark ratio) with a light intensity of 8 ± 1 μmol m−2 s−1. The experiments were carried out in an installation with LEDs (see Figure 1) set at different light wavelengths: (i) white (W, 380–750 nm); (ii) red (R, 620–750 nm); and (iii) blue (B, 450–495 nm). These wavelengths were selected because red light is related to increased biomass growth and blue light is commonly associated with higher nutrient consumption [16]. The surface where the cultures were located was at a distance of 49.0 cm from the light source. The initial biomass concentrations were: (i) 55 ± 3 mgdw L−1 for C. vulgaris; (ii) 33 ± 1 mgdw L−1 for T. obliquus; and (iii) 19 ± 1 mgdw L−1 for N. oleoabundans. The experiments were performed in duplicates.

2.3. Growth Monitoring and Kinetic Growth Parameters

Samples were collected daily to evaluate microalgal growth by optical density at 680 nm (OD680) measurements using a UV-6300PC Double Beam spectrophotometer (VWR, Amadora, Portugal). Biomass concentration was obtained indirectly from calibration curves that relate biomass concentration in terms of dry weight (dw) with OD680. For this, a known volume of microalgal suspension at different concentrations (5 mL for C. vulgaris and 10 mL for T. obliquus and N. oleoabundans) was vacuum filtered using 0.45-μm cellulose acetate membranes previously dried at 60 °C for 24 h. After filtration, the cell-containing membranes were dried again at 105 °C until they reached a constant mass. The biomass concentration in terms of dry weight (dw) was obtained by the difference between the membrane mass divided by the filtered volume. Each microalgal suspension was also evaluated in terms of absorbance at 680 nm (OD680). The calibration curves were then established through a linear regression between OD680 and biomass concentrations (in mgdw L−1) (see Table 1).
With biomass concentration values, kinetic growth parameters, such as the specific growth rate and average biomass productivity, were determined. Specific growth rate (μ in d−1) for each experiment was determined according to Equation (1):
d X d t = μ X   μ = l n ( X 1 / X 0 ) t 1 t 0 ,
where X 1 and X 0 represent the biomass concentration (in mgdw L−1) at the final ( t 1 ) and initial moments ( t 0 ) of the exponential growth phase. Average biomass productivities ( P in mgdw L−1 d−1) were calculated as shown in Equation (2):
P = X f X i t f t i ,
where X f corresponds to the biomass concentration (in mgdw L−1) at the end of the cultivation time ( t f , d) and X i corresponds to the initial biomass concentration (in mgdw L−1) at the beginning of the cultivation time ( t i , d).

2.4. Carbon Dioxide Fixation Rate

In the last day of the experiments, samples of 200 mL were collected, centrifuged and washed twice with distilled water to determine the elemental composition of the produced biomass. After this process, biomass was dried at 70 °C for 48 h. Elemental analysis of microalgal biomass was carried out based on the method described by Rocha, et al. [19]. The average carbon fixation rates (RC in mgCO2 L−1 d−1) were calculated according to Equation (3):
R C = C C × P × M C O 2 M C ,
where CC is the carbon mass fraction in biomass (in % wt.), P is the average biomass productivity (in mgdw L−1 d−1), MCO2 is the molecular weight of CO2 (in g mol−1) and MC is the molecular weight of C (in g mol−1).

2.5. Nutrients Removal

To analyse nutrients removal, samples were collected on days 0, 1, 2, 4, 7, 9 and 11 of each experiment. The samples were centrifuged (Himac CT6E Centrifuge, VWR, Amadora, Portugal) at 4000 rpm for 10 min and then filtered with 0.45-μm nylon membrane syringe filters (Specanalitica, Cascais, Portugal). Nutrient concentrations (PO43−, and NO3) in the filtered samples were analysed by ion chromatography (ICS-2100, Dionex, VWR, Amadora, Portugal) using an AS9-HC column and the ASRS®300 suppressor. Evaluation of nutrients concentrations within cultivation time allowed the determination of nutrient removal efficiencies (RE, %) and nutrient uptake rates by the selected microalgae under the studied light conditions. Nutrients removal efficiencies were determined through Equation (4):
R E   ( % ) = S i S f S i × 100 ,
where S i and S f represent nutrients concentration (in mg L−1) in the beginning and at the end of the cultivation time, respectively.
Nutrient uptake rates were obtained by fitting the modified Gompertz model [20] (Equation (5)) to the experimental data (corresponding to the time–course evolution of nutrients concentration):
S ( t ) = S i + ( S f S i ) × e x p ( e x p [ k × ( λ t ) + 1 ] ) ,
where S ( t ) is the time–course evolution of nutrients concentration, k is the removal rate (in d−1) and λ is the lag time (in d). The kinetic parameters were obtained by minimising the sum of squared residuals using the Solver supplement of Microsoft Excel 2016. The quality of the model fits was assessed by calculating the coefficient of determination (R2) and the root mean squared error (RMSE).

2.6. Statistical Analysis

The average and standard deviation were calculated for each parameter. The statistical significance of the results was assessed using the Student’s paired t-test to verify if the differences between the studied microalgae and conditions could be considered significant. Statistical tests were performed at a significance level of 0.05.

3. Results and Discussion

3.1. Microalgal Growth

Phototrophic growth is closely related to the light quality used, with light wavelength being a factor that has a great influence on microalgal growth. Through the monitoring of biomass concentration, it was possible to analyse and characterise microalgal growth kinetics. Figure 2 presents the growth curves obtained for C. vulgaris, T. obliquus and N. oleoabundans grown under different light conditions (white, red and blue LEDs). All the species grew under the different light conditions, except N. oleoabundans, which did not grow when cultivated under blue LED. This observation may be related to the low light intensity values used in this study and to the light supply in a narrower range of the spectrum, as well as to the different responses of different microalgae to light conditions. In this case, N. oleoabundans may be more susceptible to light limitation when growing under low light intensity and in this range of the light spectrum. Higher growth was obtained when microalgae were cultured under white LED. Comparing red and blue LEDs, it was found that the growth of C. vulgaris and N. oleoabundans was favoured under red LED conditions. In the case of T. obliquus, it was observed that its growth was slightly higher in blue LED assays, being similar to the one obtained with white LED. From the growth curves present in Figure 2, it was also possible to infer the adaptation phase of each microalga to the different light conditions. This analysis shows that N. oleoabundans presented the longest adaptation phase (≈2 d) compared to the other studied species (≈0 d), for all tested light conditions. Table 2 presents the kinetic growth parameters determined for the selected species in each of the studied light conditions. The values of specific growth rates ranged between 0.0657 ± 0.0008 d−1 (for C. vulgaris with blue LED) and 0.264 ± 0.005 d−1 (for N. oleoabundans with white LED). C. vulgaris obtained the highest specific growth rate with red LED (0.090 ± 0.007 d−1) and the lowest with blue LED (0.0657 ± 0.0008 d−1). Results in the same order of magnitude were obtained by Mohsenpour, et al. [21]: when cultivating C. vulgaris under red light at a light intensity of 250 μmol m−2 s−1, the authors reported a specific growth rate of 0.07 d−1. Regarding the effect of different light wavelengths on microalgal growth, Li, et al. [22] also concluded that blue LED was not favourable for C. vulgaris growth. The higher value obtained with red light can be related to the fact that this wavelength can promote an acceleration of the cell cycle, resulting in higher growth rates and smaller cells. This occurs because the main photosynthetic pigment absorbs light at approximately 600–700 nm, thus improving photosynthetic efficiency under this range of wavelengths (white and red LEDs). On the other hand, cultivation under blue light can lead to slower growth with the formation of larger cells [23]. In the case of T. obliquus, the highest specific growth rate was obtained with white LED (0.12 ± 0.02 d−1), whereas the lowest value was obtained with red LED (0.08 ± 0.01 d−1). The values obtained are in line with the range of results presented by Gonçalves, et al. [24] for white, red and blue LEDs (0.07, 0.08 and 0.17 d−1, respectively). However, the specific growth rate values obtained in the present study followed a different trend: white LED > blue LED > red LED. The specific growth rate obtained by N. oleoabundans with white LED (0.264 ± 0.005 d−1) was the highest. This value was statistically higher (p < 0.05) than the specific growth rates obtained for the other studied microalgae grown in the same light conditions (white LED). Using red LED, the growth did not exceed 0.17 ± 0.03 d−1. Under blue LED, this microalga was unable to grow, and it was not possible to determine the specific growth rate in these conditions. In the study performed by Zhao, et al. [25], this microalga followed the same trend as the present study, though the specific growth rate value was lower under white LED (0.216 d−1) and similar for red LED (0.179 d−1). However, in this study N. oleoabundans was able to grow under blue LED, with a specific growth rate of 0.134 d−1, which may be related to the lower light intensities provided to the cultures in the present work (8 ± 1 μmol m−2 s−1, compared with the 200 μmol m−2 s−1 reported in the above-mentioned study). Regarding the maximum biomass concentration, the highest values were obtained with white LED for all microalgal species, ranging from 79 ± 9 mgdw L−1 (for T. obliquus) to 128 ± 5 mgdw L−1 (for C. vulgaris). Concerning the red LED assays, the highest value of maximum biomass concentration was obtained by C. vulgaris (116 ± 2 mgdw L−1), being this value statistically higher (p < 0.05) than those obtained by the other studied microalgae (66 ± 2 and 73 ± 8 mgdw L−1 for T. obliquus and N. oleoabundans, respectively). For blue LED conditions, C. vulgaris was the microalga that obtained the highest value of maximum biomass concentration (111 ± 2 mgdw L−1) and N. oleoabundans the lowest (34 ± 4 mgdw L−1). In terms of maximum biomass productivity values, achieved values are in agreement with the values of the specific growth rate. For all species, maximum biomass productivity values followed the trend: white LED > red LED > blue LED. These results are in accordance with previous studies that reported a similar behaviour of these microalgae in this range of light wavelengths [25]. The highest maximum biomass productivity values were obtained by C. vulgaris with white LED (14 ± 4 mgdw L−1 d−1) and the lowest was obtained by T. obliquus with blue LED (5.9 ± 0.2 mgdw L−1 d−1). The values obtained are below the values reported by Gonçalves, et al. [24] for the cultivation of Tetradesmus sp. with light intensity of 13 μmol m−2 s−1 using white LED (70 mgdw L−1 d−1), red LED (90 mgdw L−1 d−1) and blue LED (270 mgdw L−1 d−1). In the case of average biomass productivity values, the same behaviour as the other kinetic growth parameters can be observed, namely the values obtained for the assays performed under white LED were higher than the ones achieved in the other light conditions. Values obtained in these light conditions ranged from 4 ± 1 mgdw L−1 d−1 (for T. obliquus) to 6.8 ± 0.5 mgdw L−1 d−1 (for C. vulgaris). Assunção et al. [26] obtained an average productivity of 140 mgdw L−1 d−1 with T. obliquus, using a light intensity of 74 μmol m−2 s−1. These values are significantly higher than those obtained in the present study, possibly due to the higher light intensity used in their study. According to Table 2, white LED promotes increased growth rates and productivities of C. vulgaris and N. oleoabundans, while the use of blue LED results in the lowest microalgal growth. These results might be related to the emission spectra of the studied light sources and the absorption spectra of the main pigments present in the studied microalgae. In the case of green microalgae, the main photosynthetic pigments are chlorophylls, which are the most important players in light-harvesting. Considering that these pigments absorb light at approximately 600–700 nm, the light sources that promote improved light-harvesting and, hence, improved photosynthetic efficiency, are those emitting in this range of wavelengths, namely white and red LEDs [27,28]. T. obliquus achieved the highest values for all kinetic growth parameters with white LED and the lowest values with red LED. These results show that the effects of light quality on the growth of microalgae are different, depending on the studied microalgal species.

3.2. Carbon Dioxide Fixation Rates

Assuming that all CO2 captured is converted into biomass, CO2 fixation rates were determined based on the carbon content in biomass and the average productivities. Figure 3 presents the CO2 fixation rates obtained for C. vulgaris, T. obliquus and N. oleoabundans cultivated under different light conditions. The values of CO2 fixation rate ranged from 5.1 ± 0.2 (for T. obliquus with red LED) to 11.4 ± 0.5 mgCO2 L−1 d−1 (for C. vulgaris with white LED). As expected, the CO2 fixation rates were higher in the experiments with white LED, since high biomass productivities were achieved. For C. vulgaris and N. oleoabundans, the highest CO2 fixation rates were obtained with white LED (11.4 ± 0.5 and 9.2 ± 0.5 mgCO2 L−1 d−1, respectively) and the lowest with blue LED (7.11 ± 0.07 mgCO2 L−1 d−1 for C. vulgaris). Similarly, for T. obliquus the highest value was obtained with white LED (7.4 ± 1.2 mgCO2 L−1 d−1). However, the lowest value was obtained with red LED (5.1 ± 0.2 mgCO2 L−1 d−1). When comparing the results obtained for the studied microalgal species, it is possible to observe that T. obliquus presented the lowest values in all LED conditions. At the end of the experiments, the highest values of CO2 fixed by all species were achieved with white LED: 126 mgCO2 for C. vulgaris, 81.4 mgCO2 for T. obliquus and 101 mgCO2 for N. oleoabundans. Ho, et al. [29] reported CO2 fixation rates between 374 and 745 mgCO2 L−1 d−1 using different T. obliquus strains. These results are significantly higher than the ones obtained in the present study due to the higher light intensity used in the above-mentioned study (140 μmol m−2 s−1) and also to the aeration of microalgal cultures with a CO2-enriched stream (2.5% v/v). Chaudhary, et al. [30] also reported a CO2 fixation rate of 141 mgCO2 L−1 d−1 for C. vulgaris and 130 mgCO2 L−1 d−1 for T. obliquus, both species fed with a 5% (v/v) CO2 stream and grown under cool white fluorescent light. The values obtained by N. oleoabundans were also below those reported by Razzak [31]: 80 mgCO2 L−1 d−1 with a light intensity of 65 μmol m−2 s−1.
Besides the determination of carbon content in microalgal cells, the elemental analysis of the produced biomass allowed the evaluation of the effect of light wavelength on the chemical composition of microalgae and also the assessment of the different nutritional needs in each of the studied light conditions. Mass percentages of carbon (C), hydrogen (H), nitrogen (N) and sulphur (S) determined in the studied microalgae in the evaluated light conditions are presented in Table 3. Regarding C. vulgaris, determined C and H contents were higher in biomass produced with white LED (46 ± 2 wt.% and 6.8 ± 0.3 wt.%) and lower in biomass resulting from cultures grown under blue LED (43 ± 1 wt.% and 6.5 ± 0.2 wt.%). In the case of biomass produced with red LED, C and H mass fractions were not statistically different (p > 0.05) from those obtained with white LED. On the other hand, N and S contents present in microalgal biomass grown under blue LED (8.0 ± 0.3 wt.% and 0.6 ± 0.1 wt.%, respectively) were higher than those obtained under red LED conditions (7.5 ± 0.1 wt.% and 0.4 ± 0.1 wt.%, respectively), these values being statistically different (p < 0.05). The lower C content obtained by C. vulgaris with blue LED can be related to the fact that blue light releases high energy photons that induce endogenous respiration, which is responsible for the breakdown of carbohydrates reserves and their conversion into CO2 that is further released to the atmosphere. Accordingly, this phenomenon results in a great loss of carbohydrate reserves, which is reflected in the low carbon contents determined in biomass resulting from blue LED experiments [32]. At the same time, this microalga obtained the highest values of N content with the same light condition (blue light), due to a light stress caused by this light wavelength that triggers the accumulation of photo-protective pigments and induces an increase in protein content (which is closely linked with N content) [17,33]. Phukan, et al. [34] reported C, H and N contents in C. vulgaris sp. of 47.5, 7.1 and 6.7 wt.%, respectively, whose values are very similar to those obtained in the present study with white LED. C, H, N and S contents obtained by T. obliquus followed the trend: white LED > red LED > blue LED. In the case of N. oleoabundans, the highest C, H and N contents were obtained in biomass grown with white LED (46.0 ± 0.6, 6.7 ± 0.1, 7.9 ± 0.1 wt.%, respectively), being statistically higher (p < 0.05) than those obtained with red LED conditions. Tibbetts, et al. [35] reported that the proximate nitrogen content of N. oleoabundans was 6.3 wt.%, being this value lower than the one obtained in the present study.
Taking into account the mass fractions of each analysed element, the molecular formula (COaHbNcPdSe) of the biomass for each microalga was determined (a and d were not determined): (i) C. vulgaris ( b =   1.74–1.81; c =   0.14–0.16; e =   0.004–0.005); (ii) T. obliquus ( b =   1.75–1.79; c =   0.16; 0.004–0.005); and (iii) N. oleoabundans (1.74–1.76; 0.15–0.16;   e =   0.007).

3.3. Nutrient Removal

The European Union (EU) has set limits for the concentration of nutrients (nitrogen and phosphorus) in effluents, as well as minimum percentages of load reduction [36,37]. According to these Directives, the limits for effluent discharge are the following: (i) 10–15 mgN L−1 for nitrogen, with a minimum reduction percentage of 70%–80%; and (ii) 1–2 mgP L−1 for phosphorus, with a minimum reduction of 80%.
To evaluate the nutrient (nitrogen and phosphorus) removal capacity of the studied microalgae under the range of light wavelengths evaluated, nitrogen and phosphorus removal efficiencies and kinetics were determined. The results are presented in Table 4. Values of nitrogen removal efficiency ranged between 17 ± 1% (for N. oleoabundans grown with red LED) and 36 ± 1% (for C. vulgaris grown in the same light conditions). On the other hand, phosphorus removal efficiency values ranged between 7 ± 5% (for C. vulgaris grown with blue LED) and 20 ± 9% (for C. vulgaris grown with white LED). Regarding the potential of the studied microalgae for the uptake of these nutrients, it was observed that C. vulgaris was the microalga presenting the highest nitrogen and phosphorus removal efficiencies with values statistically higher (p < 0.05) than those obtained for the other studied microalgae. On the other hand, N. oleoabundans was the microalga achieving the lowest efficiency results. In terms of light wavelength, it was observed that the lowest values of nitrogen and phosphorus removal efficiency were obtained in cultures performed with blue LED. At the end of the experiments, the values of nitrogen concentration ranged from 23.0 to 36.4 mgN L−1 and the values of phosphorus concentration ranged between 8.9 and 12.7 mgP L−1, values above the limits defined by EU legislation. The low biomass productivity and specific growth rates and, consequently, the low nutrients removal efficiencies obtained in this study can be attributed to light limitation, as the light intensity supplied to the cultures did not exceed 8 ± 1 μmol m−2 s−1. Kim, et al. [38] cultivated T. obliquus under white, red and blue LEDs and the amount of nitrogen and phosphorus removed varied depending on the light used for microalgal growth, wherein the highest amounts of nitrogen and phosphorus removed were obtained with blue LED, followed by red LED and, finally, white LED. The same behaviour was obtained in the present study for nitrogen removal. Microalgae consumed more nitrates with blue light than with red light, because when growing with blue light, microalgae are more dependent on the use of nutrients for their growth. At this wavelength, the activation of nitrate and phosphorus reductases occurs, leading to an increase in the absorption of these nutrients [16,38]. The modified Gompertz model was used to determine the lag time (λ) and the uptake rate (k) for nitrogen and phosphorus. Analysing the performance parameters R2 and RMSE, obtained coefficients of determination are close to one (R2 ≥ 0.934) and RMSE values are low, showing the suitability of the modified Gompertz model to describe the experimental data. The highest values of nitrogen and phosphorus removal rate were obtained by T. obliquus with blue (0.397 d−1) and white (0.517 d−1) LEDs, respectively. Based on these results, it can be concluded that T. obliquus was able to uptake nitrogen and phosphorus faster than the other studied microalgae. Regarding nitrogen kinetic parameters, the lag time was higher when the cultures grew under blue LED.

3.4. Integrated Evaluation of the Effect of Light Wavelength on Microalgal Growth and Carbon and Nutrient Uptake

The results obtained in this study showed that light wavelength influenced microalgal growth, CO2 and nutrient uptake and elemental composition of biomass in different ways. In addition, changes in the light wavelength resulted in different responses from the studied microalgae, which demonstrates a species-specific behaviour. Table 5 summarises how light wavelength influenced microalgal growth rates, biomass productivities, CO2 uptake rates, nitrogen and phosphorus uptake and C, H, N and S contents of the studied microalgae. In terms of microalgal growth and CO2 uptake rates, in general, higher values were obtained in cultures performed with white LED, rather than with red and blue LEDs. Considering nitrogen and phosphorus uptake, higher efficiencies were also obtained for cultures grown with white LED, except in the case of phosphorus uptake by T. obliquus, which was higher in red LED conditions. Finally, C, H, N and S contents varied according to the light wavelength used, but also according to the microalgal species. These results are very important, as they give important information on how to select the best operational conditions (in terms of light wavelength), depending on the microalgal species in use and on the purpose of microalgal cultivation.

4. Conclusions

Microalgal kinetic growth parameters, such as the specific growth rate and biomass productivity, were evaluated using different light wavelengths. The results showed white LED to be the light source promoting higher growth, except for C. vulgaris, which presented higher growth with red LED. This observation may be a result of an acceleration of the cell cycle in these light conditions, which can lead to an increase in specific growth rates. Regarding CO2 fixation rate values, these were higher in the experiments performed under white LED, with values ranging from 7.4 ± 1.2 mgCO2 L−1 d−1 (for T. obliquus) to 11.4 ± 0.5 mgCO2 L−1 d−1 (for C. vulgaris). The removal of nutrients from the culture medium was evaluated in terms of removal efficiencies and uptake kinetics. Nitrogen removal efficiencies obtained under white LED were the highest for the three microalgae, ranging from 21 ± 2% to 36 ± 1%. At this light wavelength range, the highest value was obtained by C. vulgaris and the lowest by N. oleoabundans. In the case of phosphorus, the white LED assays showed the highest values of removal efficiency (up to 20%) and the blue LED assays presented the lowest values of this parameter (up to 13%). The results from this study present relevant insights on the influence of light wavelength on biomass production, CO2 and nutrients uptake, and biochemical composition of biomass, pointing out some criteria for selection of the light wavelength to use depending on the intended application for microalgae and on the microalgal species used. Regarding CO2 uptake rates determined in this study, although these values were lower than other values already reported in the literature, it is important to note that higher light intensities could be used to improve photosynthetic efficiency and, hence, CO2 uptake rates.

Author Contributions

A.F.E. performed the experiments and data analysis and wrote the manuscript; O.S.G.P.S. performed the elemental analysis of biomass and helped in manuscript revision; V.J.P.V. participated in the design of the study and helped in manuscript revision; J.C.M.P. participated in the design of the study and helped in manuscript revision; A.L.G. participated in the design of the study and helped in manuscript revision. All authors have read and agreed to the published version of the manuscript.

Funding

This work was financially supported by: (i) Project UID/EQU/00511/2019—Laboratory for Process Engineering, Environment, Biotechnology and Energy (LEPABE) and Associate Laboratory LSRE-LCM—UID/EQU/50020/2019—funded by national funds through FCT/MCTES (PIDDAC); (ii) Project POCI-01-0145-FEDER-031736—PIV4 Algae—Process Intensification for microalgal production and Valorisation, funded by FEDER funds through COMPETE2020—Programa Operacional Competitividade e Internacionalização (POCI) and by national funds (PIDDAC) through FCT/MCTES; and (iii) V.J.P. Vilar acknowledges the FCT Individual Call to Scientific Employment Stimulus 2017 (CEECIND/01317/2017) and J.C.M. Pires acknowledges the FCT Investigator 2015 Programme (IF/01341/2015).

Conflicts of Interest

The authors declare no conflict of interest.

References

  1. De Morais, M.G.; de Morais, E.G.; Duarte, J.H.; Deamici, K.M.; Mitchell, B.G.; Costa, J.A.V. Biological CO2 mitigation by microalgae: Technological trends, future prospects and challenges. World J. Microbiol. Biotechnol. 2019, 35, 78. [Google Scholar] [CrossRef] [PubMed]
  2. Tavoni, M.; Socolow, R. Modeling meets science and technology: An introduction to a special issue on negative emissions. Clim. Chang. 2013, 118, 1–14. [Google Scholar] [CrossRef] [Green Version]
  3. Solomon, S.; Plattner, G.-K.; Knutti, R.; Friedlingstein, P. Irreversible climate change due to carbon dioxide emissions. Proc. Natl. Acad. Sci. USA 2009, 106, 1704–1709. [Google Scholar] [CrossRef] [PubMed] [Green Version]
  4. Esteves, A.F.; Santos, F.M.; Pires, J.C.M. Carbon dioxide as geothermal working fluid: An overview. Renew. Sustain. Energy Rev. 2019, 114, 109331. [Google Scholar] [CrossRef]
  5. Lam, M.K.; Lee, K.T.; Mohamed, A.R. Current status and challenges on microalgae-based carbon capture. Int. J. Greenh. Gas Control 2012, 10, 456–469. [Google Scholar] [CrossRef]
  6. Ahmed, R.; Liu, G.; Yousaf, B.; Abbas, Q.; Ullah, H.; Ali, M.U. Recent advances in carbon-based renewable adsorbent for selective carbon dioxide capture and separation—A review. J. Clean. Prod. 2019, 242, 118409. [Google Scholar] [CrossRef]
  7. Pires, J.; Martins, F.; Alvim-Ferraz, M.; Simões, M. Recent developments on carbon capture and storage: An overview. Chem. Eng. Res. Des. 2011, 89, 1446–1460. [Google Scholar] [CrossRef]
  8. Klinthong, W.; Yang, Y.-H.; Huang, C.-H.; Tan, C.-S. A review: Microalgae and their applications in CO2 capture and renewable energy. Aerosol Air Qual. Res. 2015, 15, 712–742. [Google Scholar] [CrossRef]
  9. Cheah, W.Y.; Show, P.L.; Chang, J.-S.; Ling, T.C.; Juan, J.C. Biosequestration of atmospheric CO2 and flue gas-containing CO2 by microalgae. Bioresour. Technol. 2015, 184, 190–201. [Google Scholar] [CrossRef]
  10. Jiang, Y.; Zhang, W.; Wang, J.; Chen, Y.; Shen, S.; Liu, T. Utilization of simulated flue gas for cultivation of Scenedesmus dimorphus. Bioresour. Technol. 2013, 128, 359–364. [Google Scholar] [CrossRef]
  11. Wijffels, R.H.; Barbosa, M.J. An outlook on microalgal biofuels. Science 2010, 329, 796–799. [Google Scholar] [CrossRef] [Green Version]
  12. Milano, J.; Ong, H.C.; Masjuki, H.; Chong, W.; Lam, M.K.; Loh, P.K.; Vellayan, V. Microalgae biofuels as an alternative to fossil fuel for power generation. Renew. Sustain. Energy Rev. 2016, 58, 180–197. [Google Scholar] [CrossRef]
  13. Parmar, A.; Singh, N.K.; Pandey, A.; Gnansounou, E.; Madamwar, D. Cyanobacteria and microalgae: A positive prospect for biofuels. Bioresour. Technol. 2011, 102, 10163–10172. [Google Scholar] [CrossRef]
  14. Saratale, R.G.; Kumar, G.; Banu, R.; Xia, A.; Periyasamy, S.; Saratale, G.D. A critical review on anaerobic digestion of microalgae and macroalgae and co-digestion of biomass for enhanced methane generation. Bioresour. Technol. 2018, 262, 319–332. [Google Scholar] [CrossRef]
  15. Lucas, B.F.; de Morais, M.G.; Santos, T.D.; Costa, J.A.V. Spirulina for snack enrichment: Nutritional, physical and sensory evaluations. LWT 2018, 90, 270–276. [Google Scholar] [CrossRef]
  16. Schulze, P.S.; Pereira, H.G.; Santos, T.F.; Schueler, L.; Guerra, R.; Barreira, L.A.; Perales, J.A.; Varela, J.C. Effect of light quality supplied by light emitting diodes (LEDs) on growth and biochemical profiles of Nannochloropsis oculata and Tetraselmis chuii. Algal Res. 2016, 16, 387–398. [Google Scholar] [CrossRef]
  17. Schulze, P.S.C. Effects of Light Quality Supplied by Light Emitting Diodes (LEDs) on Microalgal Production. Master’s Thesis, Universidade do Algarve Faculdade de Ciências e Tecnologia, Algarve, Portugal, 2014. [Google Scholar]
  18. Gonçalves, A.L.; Rodrigues, C.M.; Pires, J.C.; Simões, M. The effect of increasing CO2 concentrations on its capture, biomass production and wastewater bioremediation by microalgae and cyanobacteria. Algal Res. 2016, 14, 127–136. [Google Scholar] [CrossRef]
  19. Rocha, R.P.; Soares, O.S.G.; Gonçalves, A.G.; Órfão, J.J.; Pereira, M.F.R.; Figueiredo, J.L. Different methodologies for synthesis of nitrogen doped carbon nanotubes and their use in catalytic wet air oxidation. Appl. Catal. A Gen. 2017, 548, 62–70. [Google Scholar] [CrossRef]
  20. Zwietering, M.H.; Jongenburger, I.; Rombouts, F.M.; Van’t Riet, K. Modeling of the bacterial growth curve. Appl. Environ. Microbiol. 1990, 56, 1875–1881. [Google Scholar] [CrossRef] [Green Version]
  21. Mohsenpour, S.F.; Richards, B.; Willoughby, N. Spectral conversion of light for enhanced microalgae growth rates and photosynthetic pigment production. Bioresour. Technol. 2012, 125, 75–81. [Google Scholar] [CrossRef]
  22. Li, D.; Yuan, Y.; Cheng, D.; Zhao, Q. Effect of light quality on growth rate, carbohydrate accumulation, fatty acid profile and lutein biosynthesis of Chlorella sp. AE10. Bioresour. Technol. 2019, 291, 121783. [Google Scholar] [CrossRef] [PubMed]
  23. Schulze, P.S.C.; Barreira, L.A.; Pereira, H.G.C.; Perales, J.A.; Varela, J.C.S. Light emitting diodes (LEDs) applied to microalgal production. Trends Biotechnol. 2014, 32, 422–430. [Google Scholar] [CrossRef] [PubMed]
  24. Gonçalves, V.D.; Fagundes-Klen, M.R.; Trigueros, D.E.G.; Schuelter, A.R.; Kroumov, A.D.; Módenes, A.N. Combination of Light Emitting Diodes (LEDs) for photostimulation of carotenoids and chlorophylls synthesis in Tetradesmus sp. Algal Res. 2019, 43, 101649. [Google Scholar] [CrossRef]
  25. Zhao, Y.; Sun, S.; Hu, C.; Zhang, H.; Xu, J.; Ping, L. Performance of three microalgal strains in biogas slurry purification and biogas upgrade in response to various mixed light-emitting diode light wavelengths. Bioresour. Technol. 2015, 187, 338–345. [Google Scholar] [CrossRef]
  26. Assunção, J.; Batista, A.P.; Manoel, J.; da Silva, T.L.; Marques, P.; Reis, A.; Gouveia, L. CO2 utilization in the production of biomass and biocompounds by three different microalgae. Eng. Life Sci. 2017, 17, 1126–1135. [Google Scholar] [CrossRef] [Green Version]
  27. Masojídek, J.; Torzillo, G.; Koblížek, M. Photosynthesis in Microalgae. In Handbook of Microalgal Culture: Applied Phycology and Biotechnology; Blackwell Science Ltd.: Oxford, UK, 2013; pp. 21–36. [Google Scholar]
  28. Richmond, A.; Hu, Q. Biological principles of mass cultivation of photoautotrophic microalgae. In Handbook of Microalgal Culture: Applied Phycology and Biotechnology; Blackwell Science Ltd.: Oxford, UK, 2013; pp. 171–204. [Google Scholar]
  29. Ho, S.-H.; Chen, C.-Y.; Chang, J.-S. Effect of light intensity and nitrogen starvation on CO2 fixation and lipid/carbohydrate production of an indigenous microalga Scenedesmus obliquus CNW-N. Bioresour. Technol. 2012, 113, 244–252. [Google Scholar] [CrossRef]
  30. Chaudhary, R.; Dikshit, A.K.; Tong, Y.W. Carbon-dioxide biofixation and phycoremediation of municipal wastewater using Chlorella vulgaris and Scenedesmus obliquus. Environ. Sci. Pollut. Res. 2018, 25, 20399–20406. [Google Scholar] [CrossRef]
  31. Razzak, S. In situ biological CO2 fixation and wastewater nutrient removal with Neochloris oleoabundans in batch photobioreactor. Bioprocess Biosyst. Eng. 2019, 42, 93–105. [Google Scholar] [CrossRef]
  32. Kowallik, W. Blue light effects on respiration. Annu. Rev. Plant Physiol. 1982, 33, 51–72. [Google Scholar] [CrossRef]
  33. Kamiya, A.; Saitoh, T. Blue-light-control of the uptake of amino acids and of ammonia in Chlorella mutants. Physiol. Plant. 2002, 116, 248–254. [Google Scholar] [CrossRef]
  34. Phukan, M.M.; Chutia, R.S.; Konwar, B.; Kataki, R. Microalgae Chlorella as a potential bio-energy feedstock. Appl. Energy 2011, 88, 3307–3312. [Google Scholar] [CrossRef]
  35. Tibbetts, S.M.; Milley, J.E.; Lall, S.P. Chemical composition and nutritional properties of freshwater and marine microalgal biomass cultured in photobioreactors. J. Appl. Phycol. 2015, 27, 1109–1119. [Google Scholar] [CrossRef] [Green Version]
  36. Directive 1991/271/EEC. Directive 1991/271/EEC. Directive of the European Council oh 21 May 1991 concerning urban wastewater treatment. In 1991/271/EEC, Official Journal of the European Union L 0271; European Comission: Brussels, Belgium, 1991. [Google Scholar]
  37. Directive 1998/15/EC. Directive 1998/15/EC. Directive of the European Commissin of 27 February 1998 amending Council Directive 91/271/EEC with respect to certain requirements established in Annex I thereof. In 1998/15/CE, Official Journal of the European Union L67/29; European Comission: Brussels, Belgium, 1998. [Google Scholar]
  38. Kim, T.-H.; Lee, Y.; Han, S.-H.; Hwang, S.-J. The effects of wavelength and wavelength mixing ratios on microalgae growth and nitrogen, phosphorus removal using Scenedesmus sp. for wastewater treatment. Bioresour. Technol. 2013, 130, 75–80. [Google Scholar] [CrossRef] [PubMed]
Figure 1. Schematic representation of the experimental setup: (1) air pump; (2) LED panel and (3) culture flasks.
Energies 13 00333 g001
Figure 2. Growth curves obtained for (a) C. vulgaris, (b) T. obliquus and (c) N. oleoabundans under different light conditions (white, red and blue LEDs).
Energies 13 00333 g002
Figure 3. CO2 fixation rates obtained for (a) C. vulgaris, (b) T. obliquus and (c) N. oleoabundans under different light conditions (white, red and blue LEDs). Error bars correspond to the standard deviation. * Value not determined because this species did not grow under blue light.
Energies 13 00333 g003
Table 1. Calibration curves of OD680 and biomass concentration in terms of dry weight.
MicroalgaeCalibration CurvesR2LOD (mgdw L−1)LOQ (mgdw L−1)
C. vulgaris y = 0.00352 x + 0.01157 0.9995.4618.8
T. obliquus y = 0.00374 x + 0.00331 0.9991.264.21
N. oleoabundans y = 0.00377 x + 0.02337 0.9977.0323.4
R2—coefficient of determination; LOD—limit of detection; LOQ—limit of quantification.
Table 2. Kinetic growth parameters determined for the studied microalgae grown under different light wavelengths.
ParametersLight C. vulgarisT. obliquusN. oleoabundans
µ (d1)White0.084 ± 0.0070.12 ± 0.020.264 ± 0.005
Red0.090 ± 0.0070.08 ± 0.010.17 ± 0.03
Blue 0.0657 ± 0.00080.106 ± 0.006ND
Xmax (mgdw L1)White128 ± 579 ± 980 ± 4
Red116 ± 266 ± 273 ± 8
Blue 111 ± 275 ± 134 ± 4
Pmax (mgdw L1 d1)White14 ± 48.8 ± 0.910.6 ± 0.3
Red10.2 ± 0.48 ± 110 ± 1
Blue 11 ± 35.9 ± 0.2ND
P (mgdw L1 d1)White6.8 ± 0.54 ± 15.5 ± 0.5
Red4.6 ± 0.53.0 ± 0.24.2 ± 0.3
Blue 4.53 ± 0.073.70 ± 0.08ND
µ—specific growth rate (d−1); ND—value not determined; Xmax—maximum biomass concentration (mgdw L−1); Pmax—maximum biomass productivity (mgdw L−1 d−1); P—average biomass productivity (mgdw L−1 d−1).
Table 3. Elemental analysis of the algal biomass grown under different light wavelengths.
ParametersLightC. vulgarisT. obliquusN. oleoabundans
C (wt.%)White46 ± 248 ± 246.0 ± 0.6
Red45.6 ± 0.945.8 ± 0.940 ± 1
Blue 43 ± 143.6 ± 0.7ND
H (wt.%)White6.8 ± 0.37.0 ± 0.26.7 ± 0.1
Red6.7 ± 0.16.9 ± 0.26.0 ± 0.1
Blue 6.5 ± 0.26.6 ± 0.2ND
N (wt.%)White7.9 ± 0.38.7 ± 0.17.9 ± 0.1
Red7.5 ± 0.18.6 ± 0.27.4 ± 0.2
Blue 8.0 ± 0.38.4 ± 0.3ND
S (wt.%)White0.5 ± 0.10.6 ± 0.10.8 ± 0.1
Red0.4 ± 0.10.6 ± 0.10.8 ± 0.1
Blue 0.6 ± 0.10.5 ± 0.1ND
ND—value not determined.
Table 4. Nitrogen and phosphorus removal efficiencies and kinetic parameters of nitrogen and phosphorus uptake (obtained through the modified Gompertz model) determined for the studied microalgae grown under different light wavelengths.
MicroalgaeLightRE (%)λ (d)k (d−1)R2RMSE (mg L−1) 2
NC. vulgarisWhite36 ± 10.8040.3160.9930.786
Red23 ± 100.3280.9920.611
Blue 20 ± 50.9170.3190.9940.485
T. obliquusWhite23 ± 30.1640.3550.9740.846
Red20 ± 50.1570.3220.9930.467
Blue 20 ± 22.060.3970.9950.522
N. oleoabundansWhite21 ± 20.3680.3180.9920.450
Red17 ± 10.3330.3390.9950.361
Blue NDNDNDNDND
PC. vulgarisWhite20 ± 91.790.3940.9900.168
Red9 ± 100.2130.9340.222
Blue 7 ± 500.2500.9650.129
T. obliquusWhite17 ± 400.5170.9680.188
Red18 ± 400.2760.9800.213
Blue 13 ± 12.410.2700.9760.230
N. oleoabundansWhite16 ± 200.2690.9700.209
Red14 ± 200.3100.9760.176
Blue NDNDNDNDND
RE—removal efficiency (%); λ—lag time (d); k—uptake rate (d−1); R2—coefficient of determination; RMSE—root mean squared error; ND—value not determined.
Table 5. Summary of the influence of light wavelengths on studied microalgae.
MicroalgaeLightEffects
C. vulgarisWhiteHigh biomass productivities;
High C, H and N contents;
High CO2 uptake rates;
High N and P uptake.
RedHigh specific growth rates;
High C and H contents.
BlueHigh N and S contents.
T. obliquusWhiteHigh specific growth rates and biomass productivities;
High C, H, N and S contents;
High CO2 uptake rates;
High N uptake.
RedHigh P uptake.
N. oleoabundansWhiteHigh specific growth rates and biomass productivities;
High C, H, N and S contents;
High CO2 uptake rates;
High N and P uptake.

