Abstract
This paper is aimed at assessing the impact of unintentional islanding operations (IOs) in the presence of large induction motors (IMs) within distribution networks (DNs). When a fault occurs, following the circuit breaker (CB) fault clearing, the IMs act transiently as generators, due to its inertia, until the CB reclosing takes place. The present work is the outcome of a project carried out in a small DN, where field measurements were recorded over two years. This paper provides a detailed description of the test system, a selected list of field measurements, and a discussion on modeling guidelines used to create the model of the actual power system. The main goal is to validate the system model by comparing field measurements with simulation results. The comparison of simulations and field measurements prove the appropriateness of the modeling guidelines used in this work and highlight the high accuracy achieved in the implemented three-phase Matlab/Simulink model.
1. Introduction
An islanding operation can be defined as a parallel operation between the main utility and an isolated area due to either, a fault or a maintenance task. Several categories may be used to classify such operations; the first distinguishes between intentional and unintentional; the second is referred to long term and short term. When a part of the grid is isolated, the mismatch between the power injected by the sources and the power demanded by the loads that remain in the isolated part plays a pivotal role in maintaining system stability within the islands [1,2]. According to IEEE Std. 1547, during unintentional islanding operations, distributed generation (DG) must be disconnected within 2 s for small voltage and frequency deviations, and in 0.16 s for significant variations [3]. Several detailed studies have been carried out to prevent islanding operations in distribution networks (DNs) in the presence of DG [4,5], and several authors have studied (intentional or unintentional) islanding operations under different contexts; see, for instance, [6,7,8].
In the present work, the scenario under study is the formation of an island in a radial DN due to a fault, which is cleared by a circuit breaker (CB). After CB clearing, the induction motors (IMs) act transiently as generators and feed the loads that remain within the isolated section until the CB recloses the circuit and restores the electrical supply. When the CB recloses, an out-of-phase reclosing can take place due to frequency and voltage mismatches between the main grid and the island.
This transient has been partially studied in industry fast bus transfers when IMs are transferred from one bus to another [9,10]. A thorough analysis of bus transfer is shown in the IEEE Task Force report [11]. In [12,13] several tools have been proposed to fulfil seamless transitions in bus transfers. Nonetheless, the IO caused in the DN and its effects, have not been considered yet.
Commonly, DN configuration is radial (i.e., there is only one source); in this situation, if a fault appears and no DG is considered, the only source is the main grid. Therefore, the costumers located downstream of the faulted section, before the CB clears the fault, will experience a voltage sag; once the fault is cleared, a supply interruption is expected. In the presence of IMs the last assumption may not be true, because an unintentional IO can occur. The study of these unexpected islanding operations (IOs) is the main issue discussed in the present paper.
Model validation is a crucial task for the accurate simulation of transient events. The best way to perform a validation is to compare field or lab recordings and simulation results. When these recordings are available, a second step is to apply (or even develop) modeling guidelines that could justify the approaches followed, in order to use a given representation for each test system component.
The main goal of this paper is to validate models of power system components adequate for simulation of islanding scenarios in which large IMs are involved. A secondary goal is to apply and justify the guidelines used to represent system components. Field measurements will be used to justify the models selected for representing system components. The guidelines followed in this work are basically those proposed in the literature for representing delivery components, protective devices, and loads in low-frequency transients [14,15].
This paper has been organized as follows. Section 2 presents the test system under study. Section 3 details the selected events in this work from the recorded field measurements. Section 4 summarizes the modeling guidelines of the system components. Section 5 analyzes the frequency and voltage deviations during islanding. In Section 6, the proposed model is validated, and a discussion of this validation is presented. Section 7 summarizes the main conclusions of the paper.
2. Test System Description
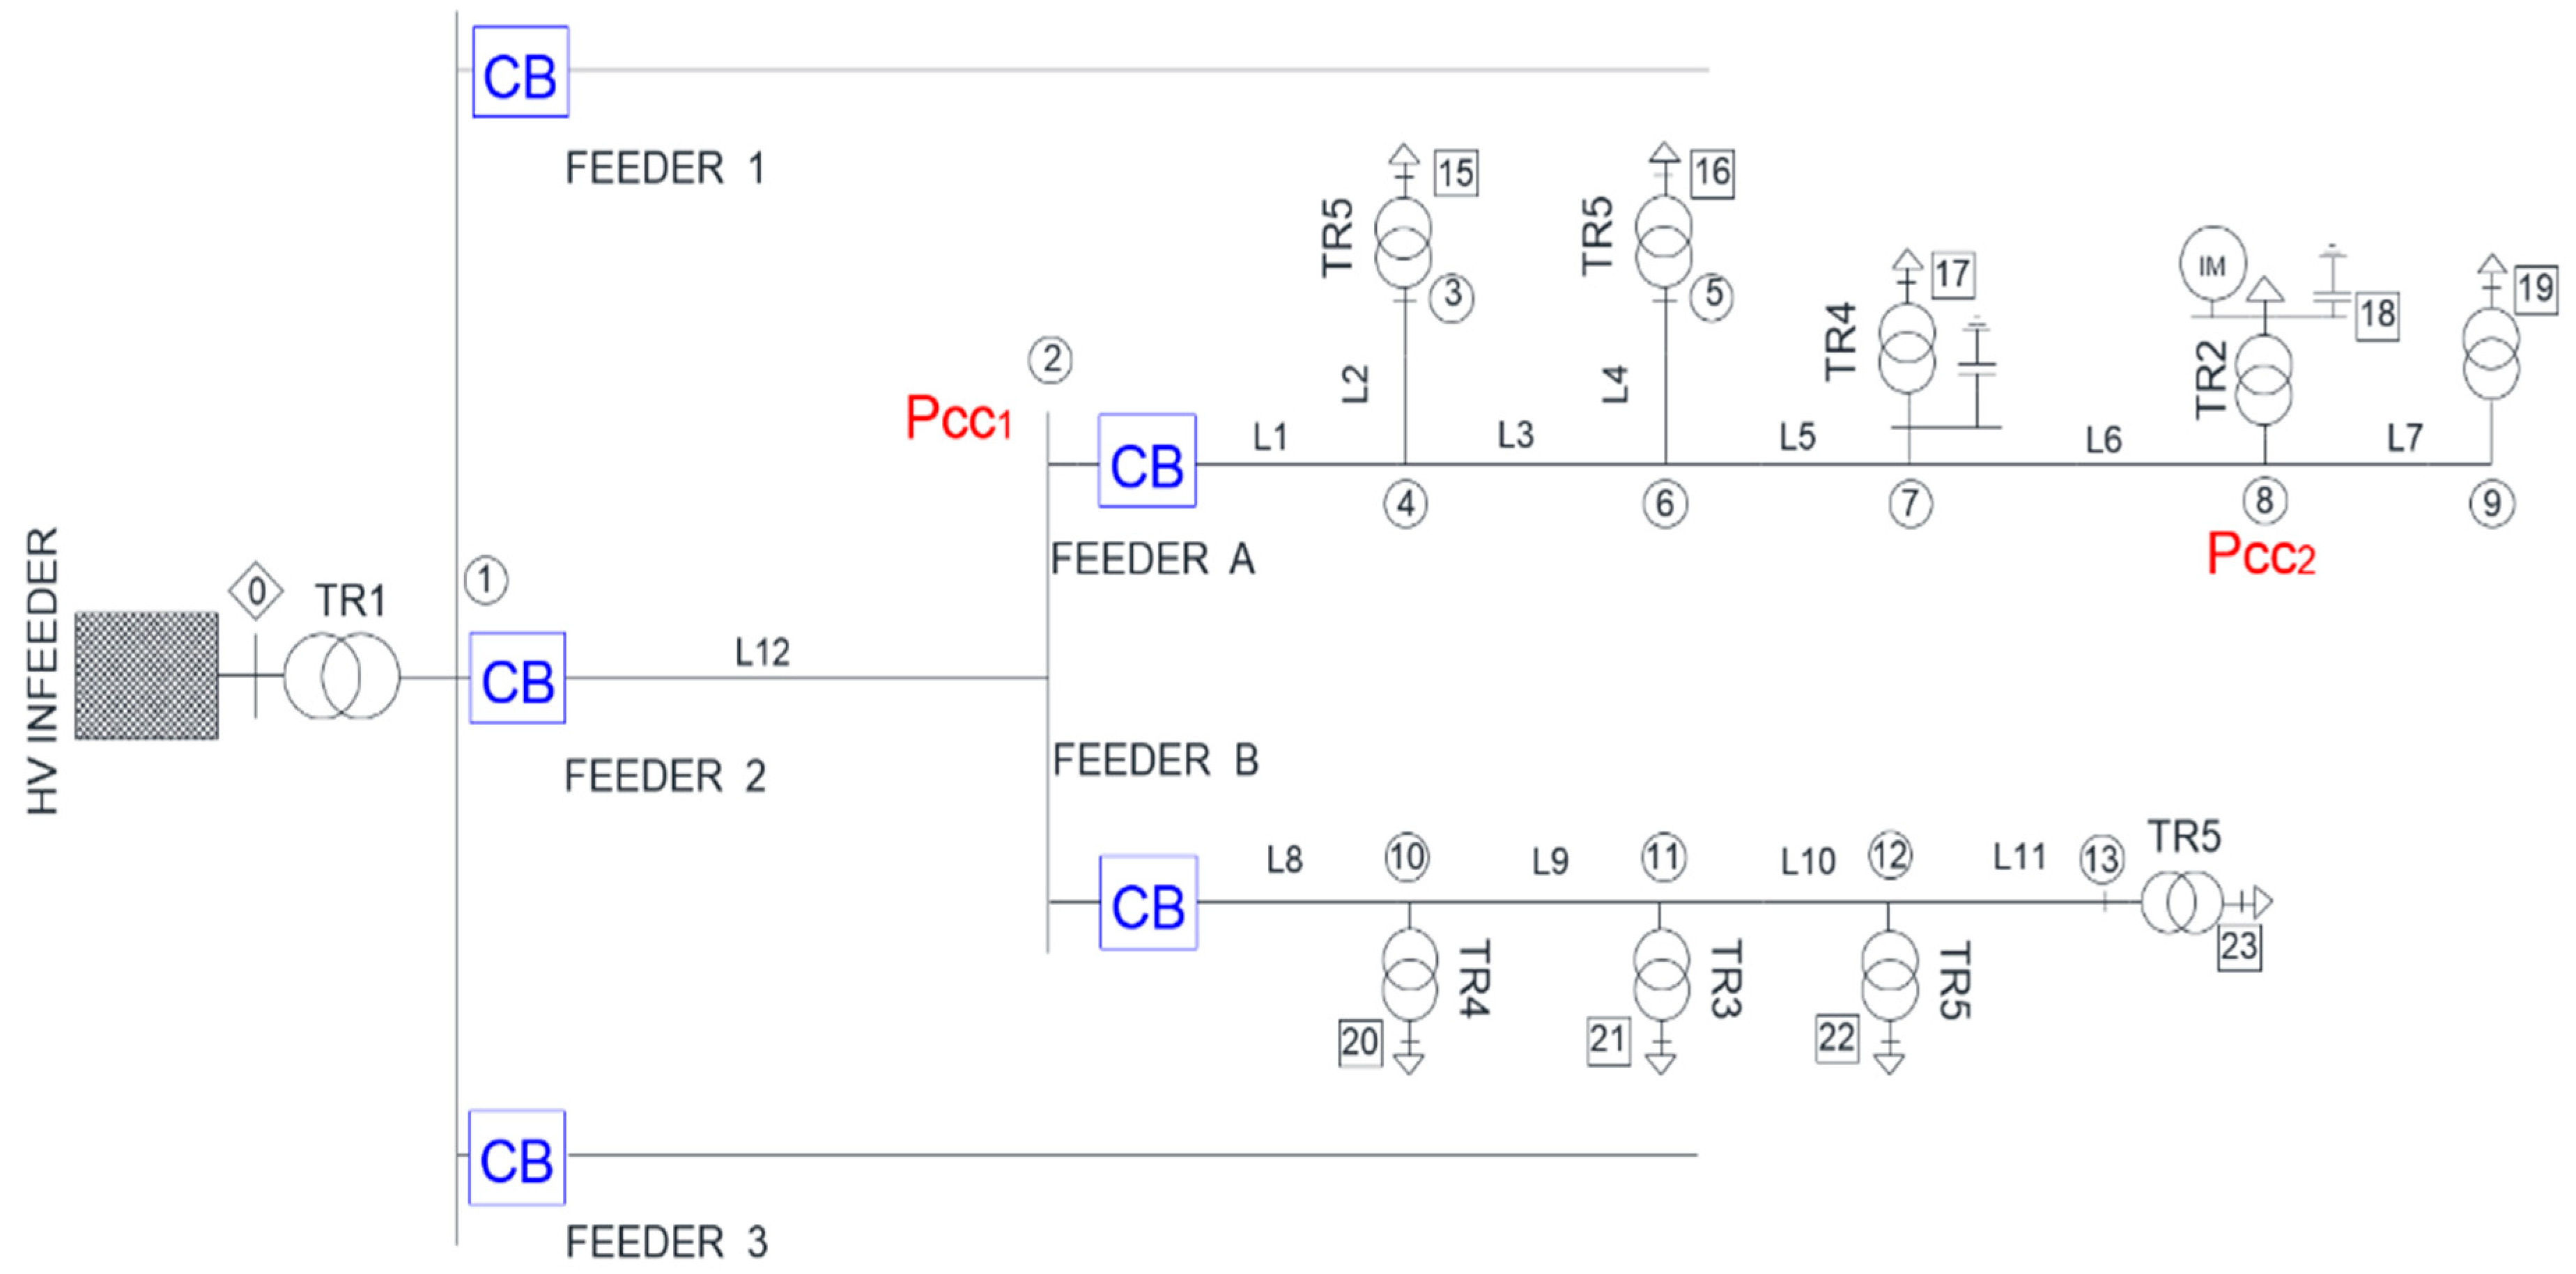
The system where measurements have been recorded is a real DN, which operates radially with an in-feeder from a transmission system at 120 kV. The single-line diagram of the system is depicted in Figure 1. The parameters of the main system components and IMs are detailed in Appendix A. As shown in the figure, the substation wye/delta transformer supplies three medium voltage (MV) feeders. Feeder 2 and sub-feeders A and B form the system analyzed in this work; see Figure 1. Feeders 1 and 3 are not detailed, because they are not relevant to this study due to the radial configuration of the system. The end-users are supplied at a low voltage (LV) level of 0.4 kV through their MV/LV Dyn 11 transformers. The MV system is grounded via a zig-zag transformer that limits the fault current to 630 A. The short circuit capacity at the 120 kV busbar is 1000 MVA.
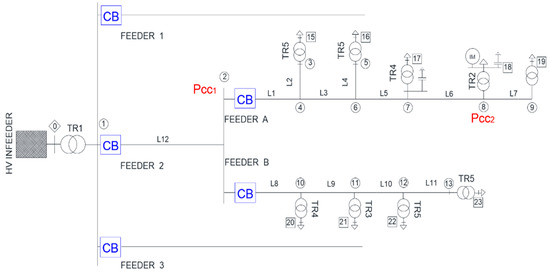
Figure 1.
One-line diagram of the test system under study.
3. Field Measurements
This section provides a summary of the field measurements and a discussion about the main conclusions derived from the recorded measurements. Two locations were selected for recording system variables (see Figure 1): node PCC1 (node 2), located at the head of feeder A, and node PCC2 (node 8), from which a large IM is supplied. Although, a high number of real events have been recorded, to not excessively extend the document, only three events are analyzed here. A representative sample of these events is listed in Table 1.

Table 1.
Summary of recorded events.
The equipment used to record the events are the protective relays installed at both PCC1 and PCC2. The fault recorders register voltage and current signals with 32 samples per cycle. The over-current relays are equipped with an oscillography function; in PCC1 the relay registration is set to 400 ms, whilst in PCC2, this value is set to 600 ms. More information about the relays and their recording characteristics can be obtained from the manufacturer in [16]. The reason why each event is displayed in different figures is the memory limitation of the digital fault recorder; therefore, in each relay and for every event, two files are generated. Note, however, that for brevity purposes, the recordings from the relay located at (PCC1) will only be shown for the first and third event. Measurements at PCC1, are plotted to display the type of fault that caused CB operation that precedes the IO.
All the recorded events were caused by faults located in Feeder A, at either a system node or a distribution line midpoint (e.g., Events 2, 3, and 9 of Table 1). An opening operation of the circuit breaker CB, see Figure 2, will always cause an island in which the large IM can continue operating after CB operation. The figure in Appendix B depicts the load profile measured at PCC1 during half month and the time of occurrence of some recorded events; namely Events 1, 4, 5, 7, 8, and 9, as numbered in Table 1. Figure 2 and Figure 3 show measurements recorded respectively at PCC1, and PCC2, and corresponding to the beginning and the end of Event 1. Figure 4 and Figure 5 show the recordings corresponding to Events 2, and 3, respectively. A short analysis of the three events is presented below.
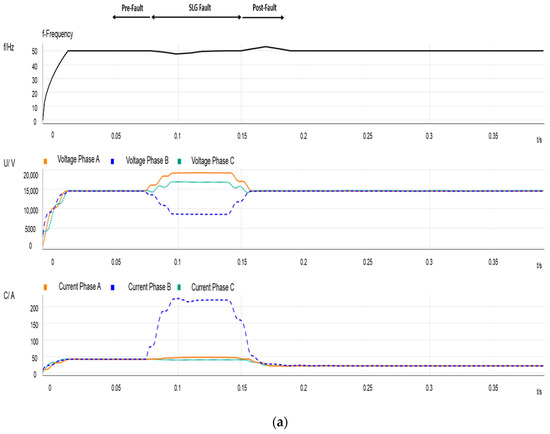
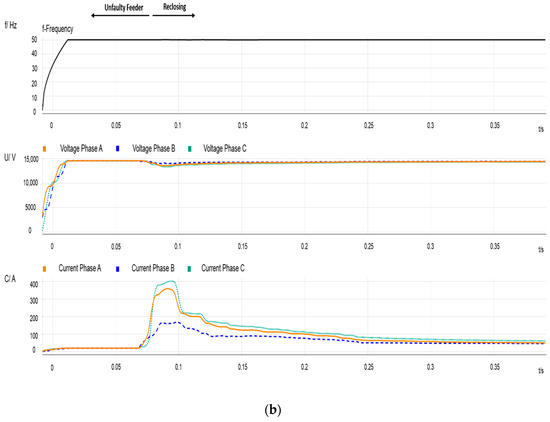
Figure 2.
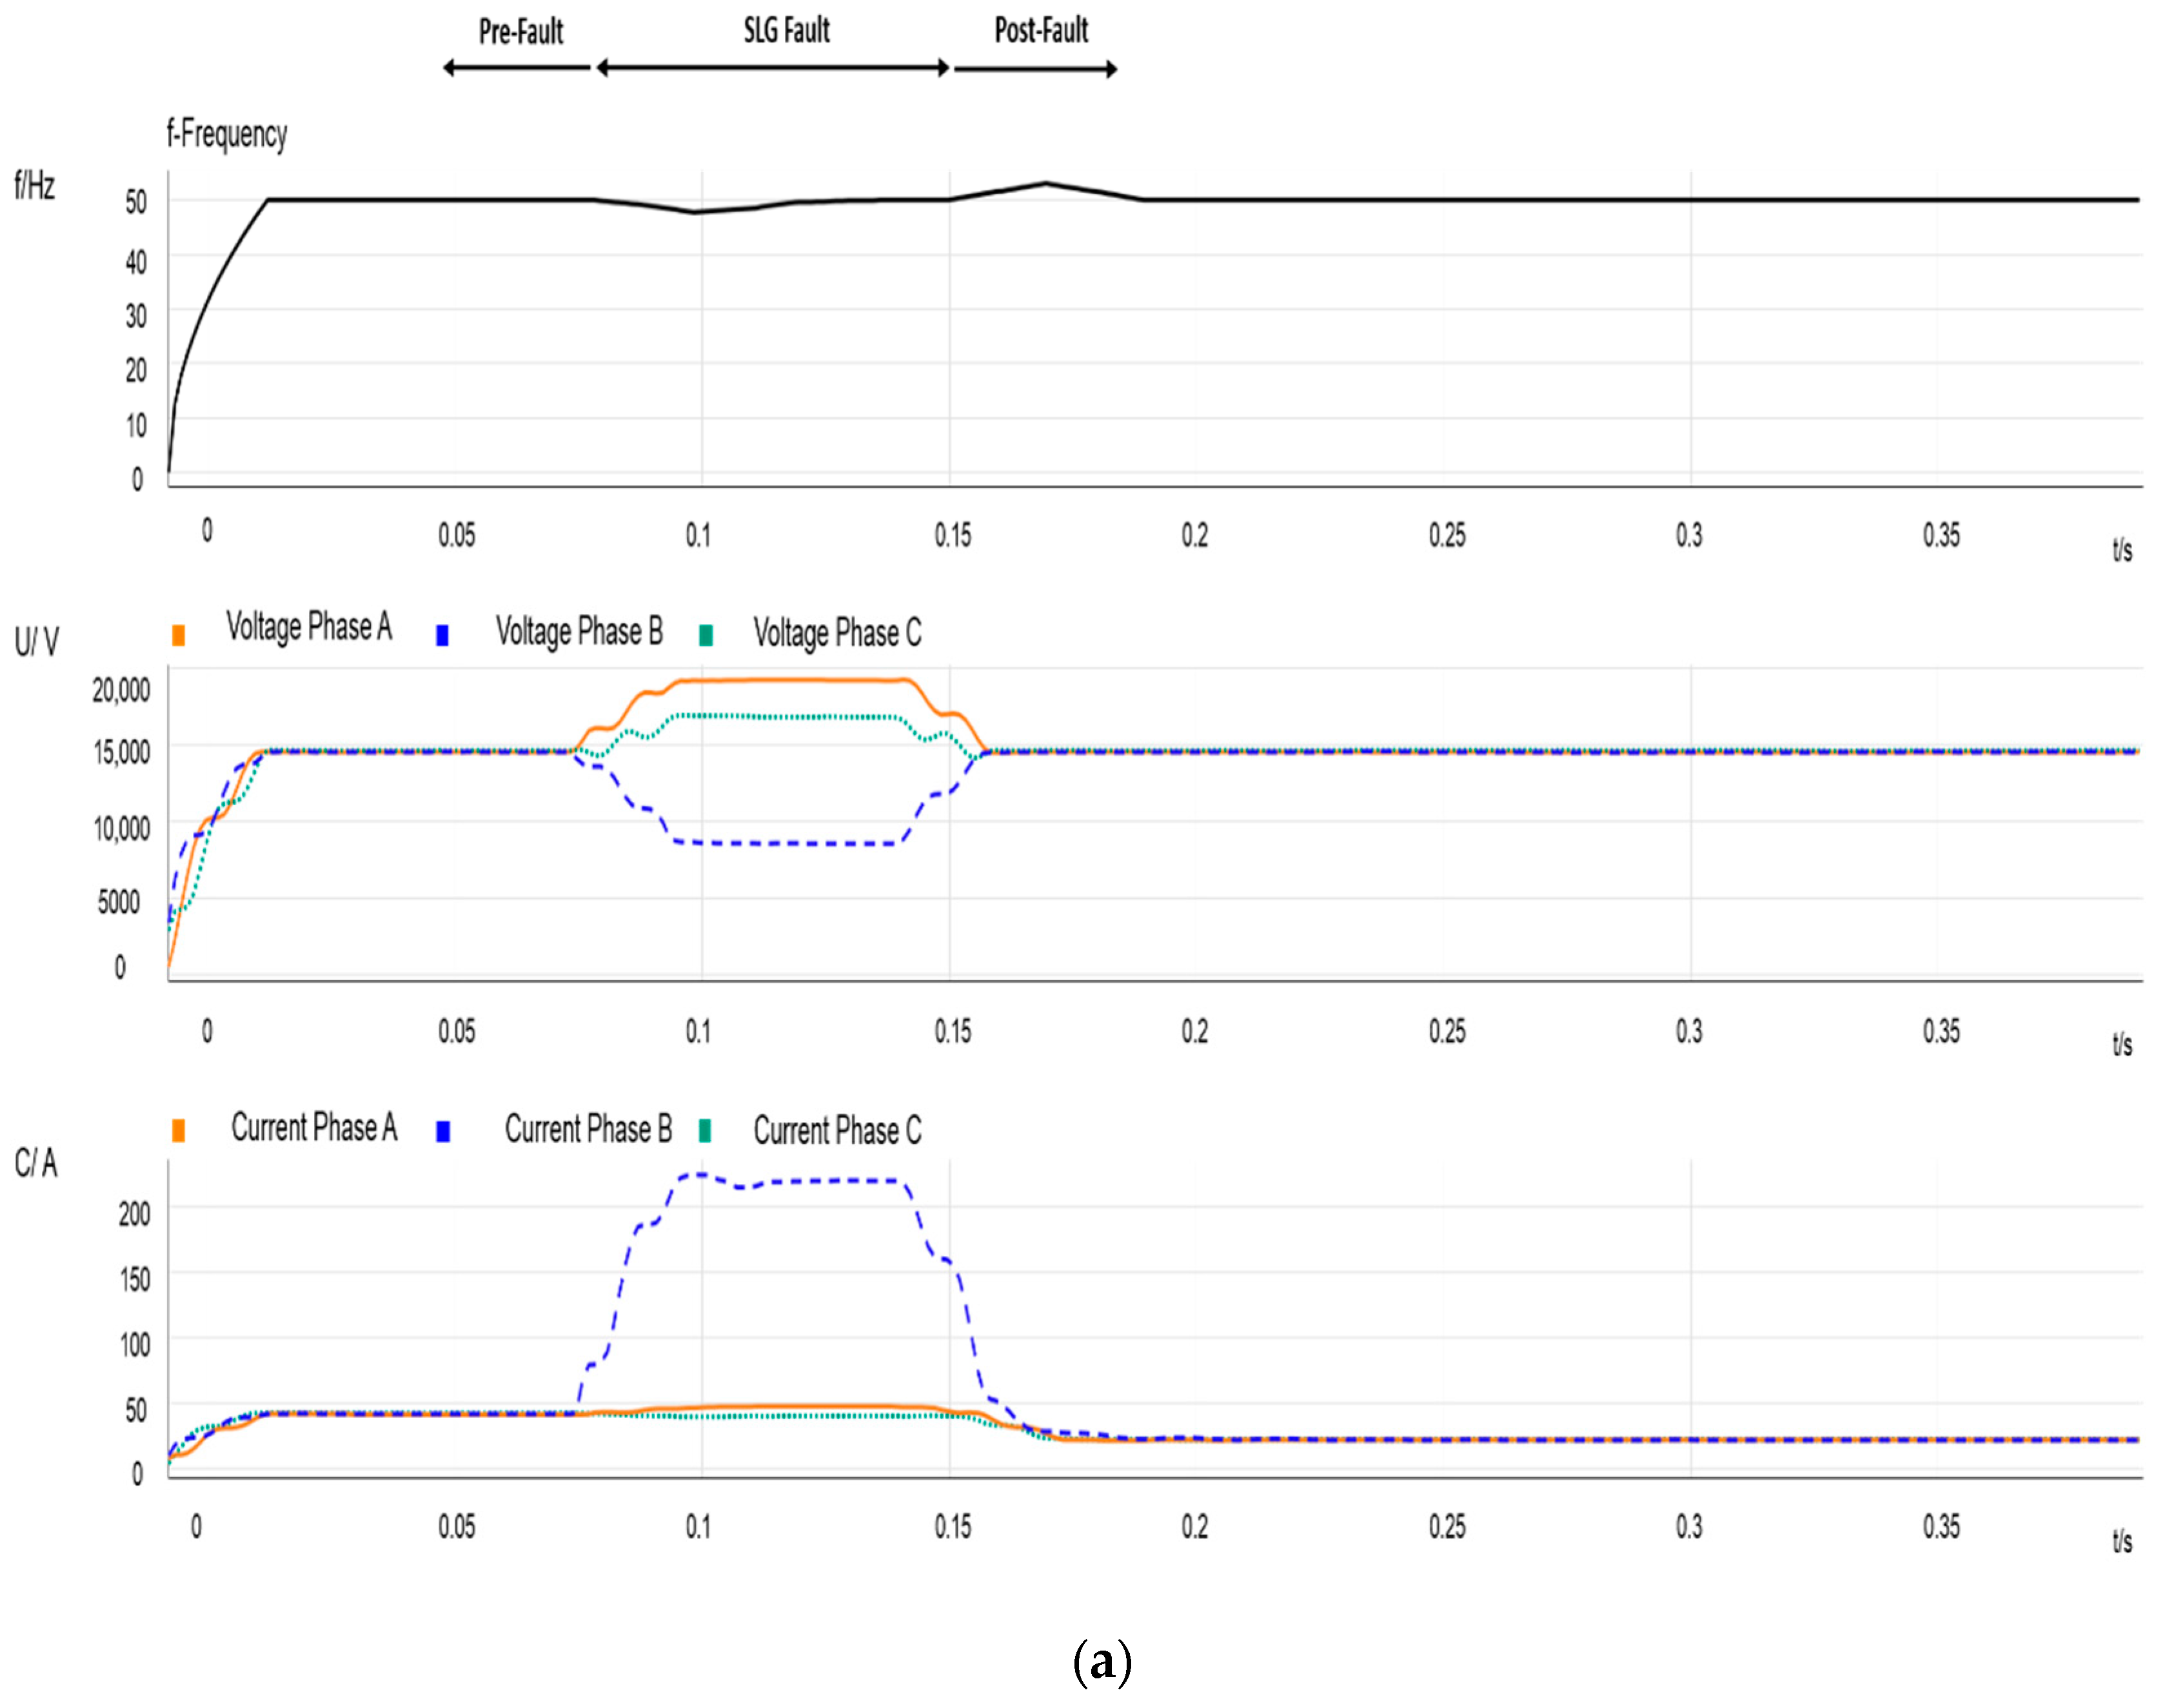
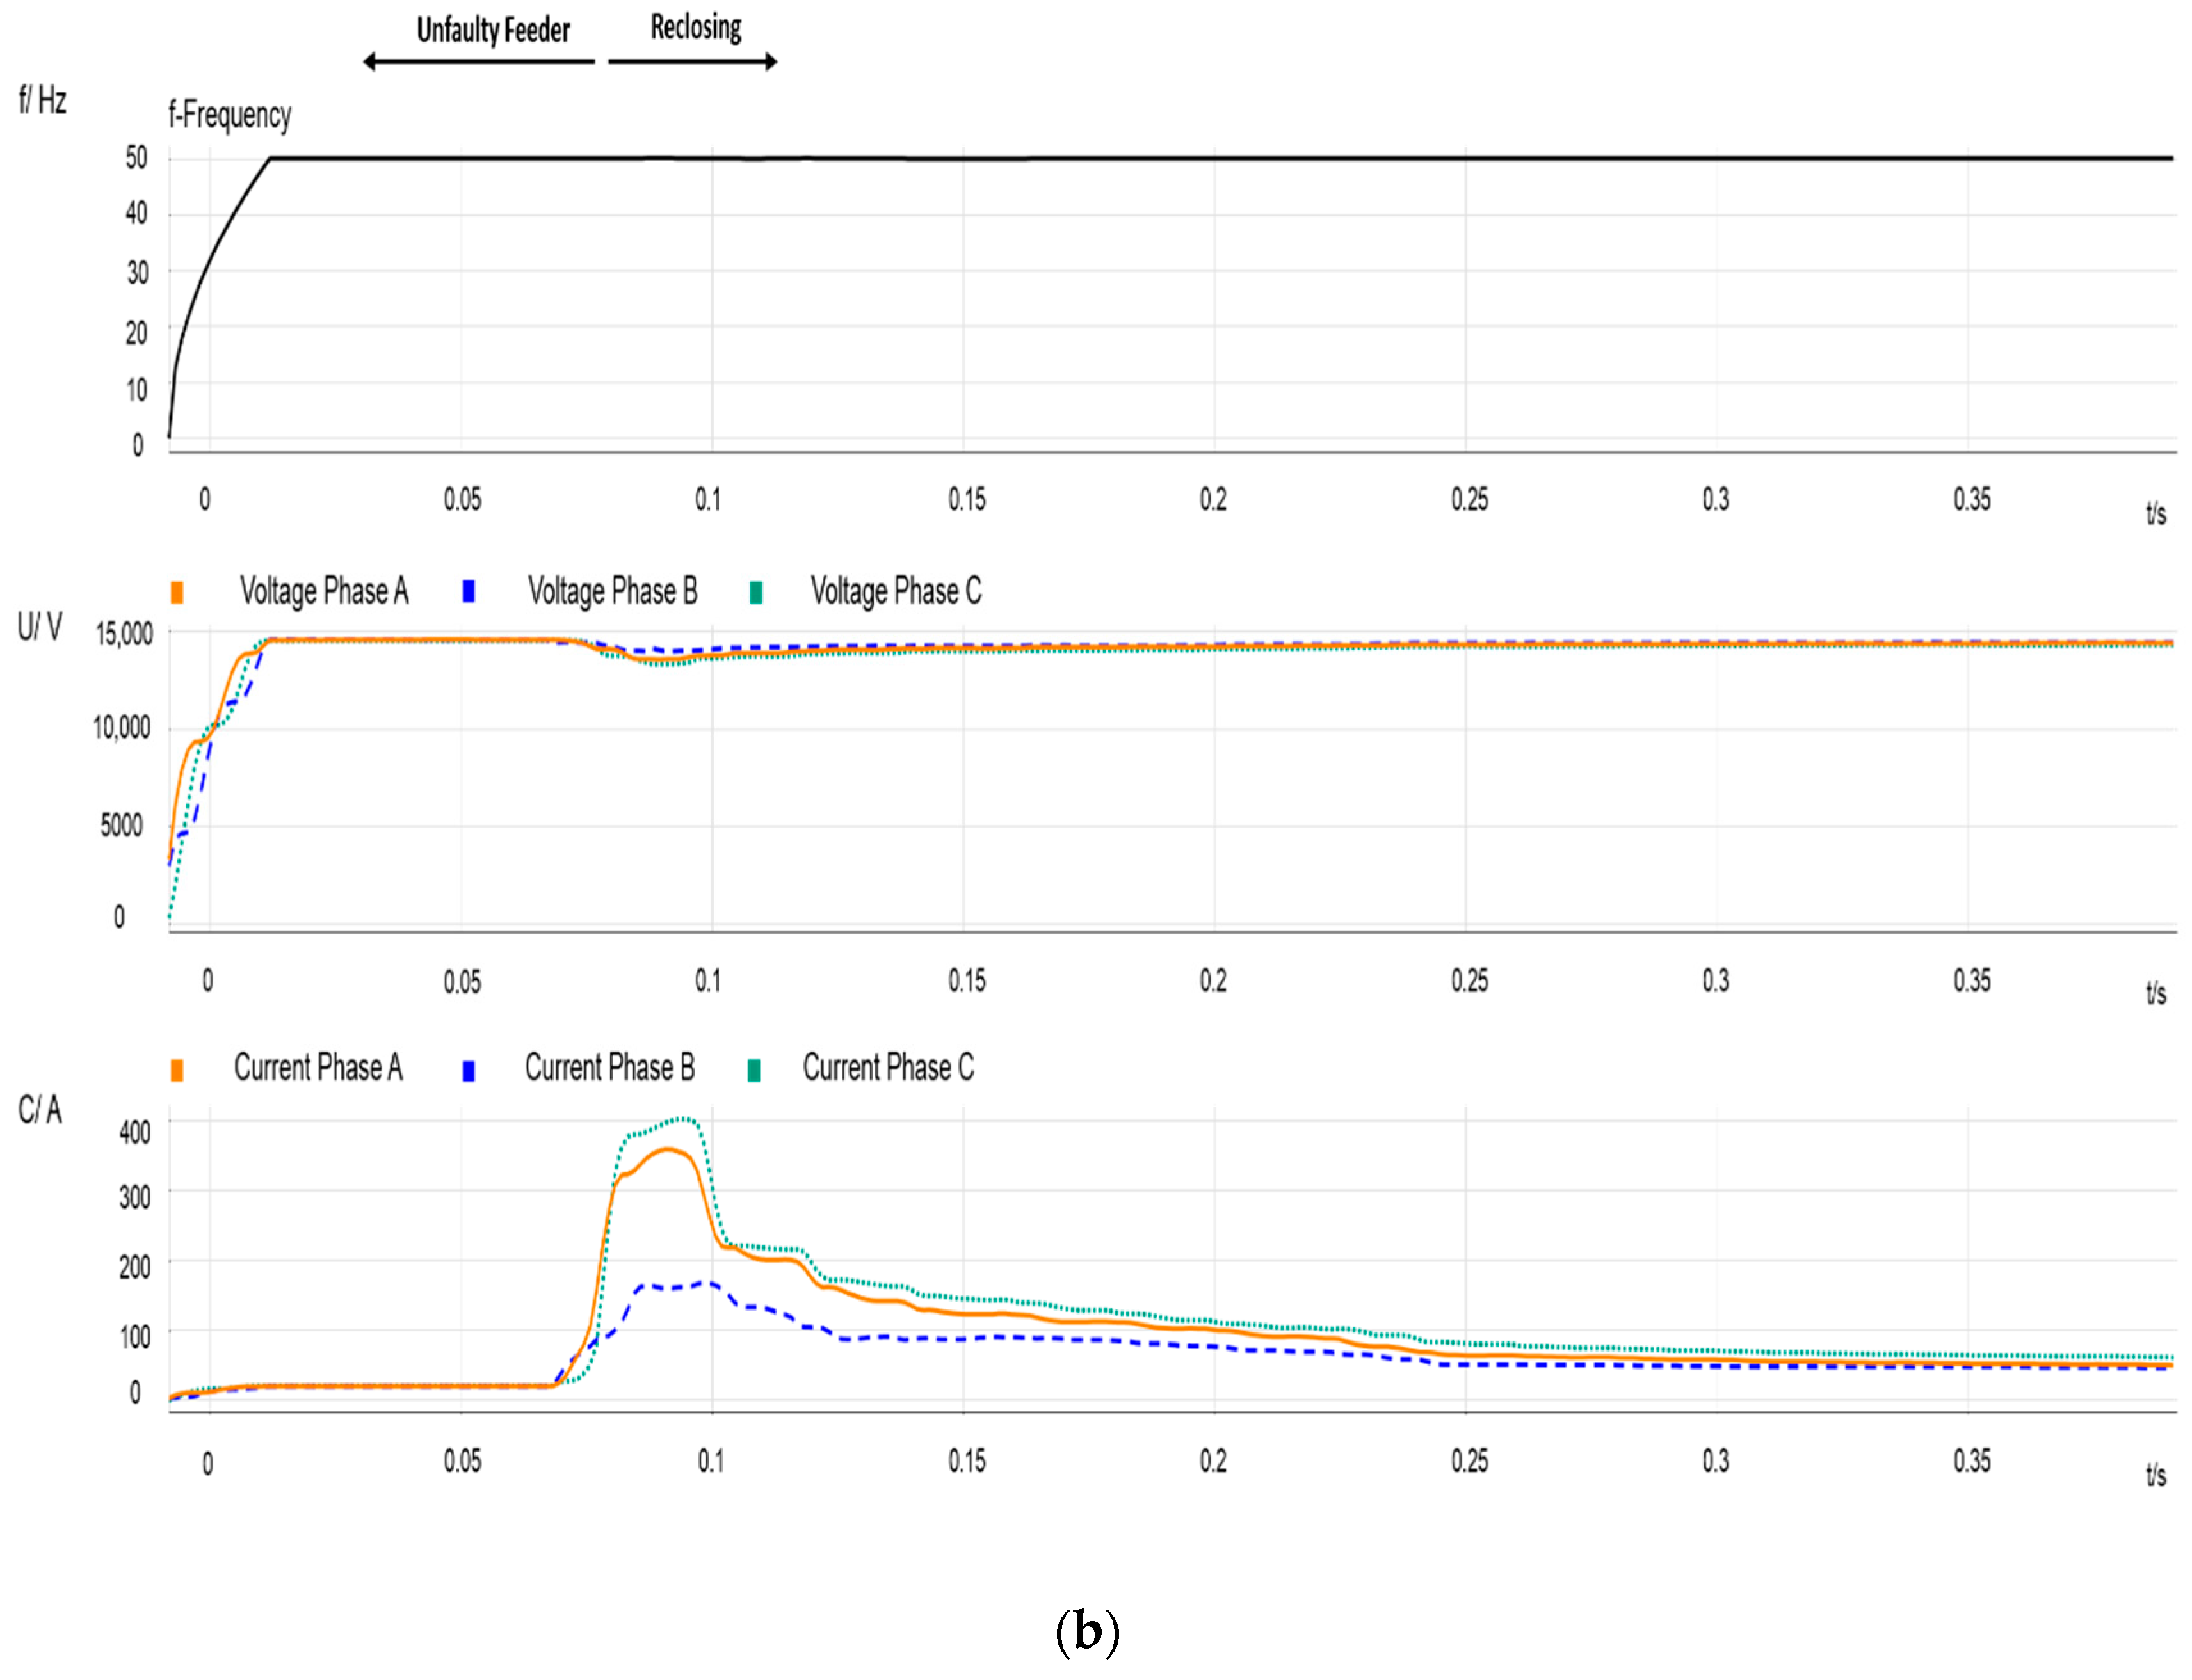
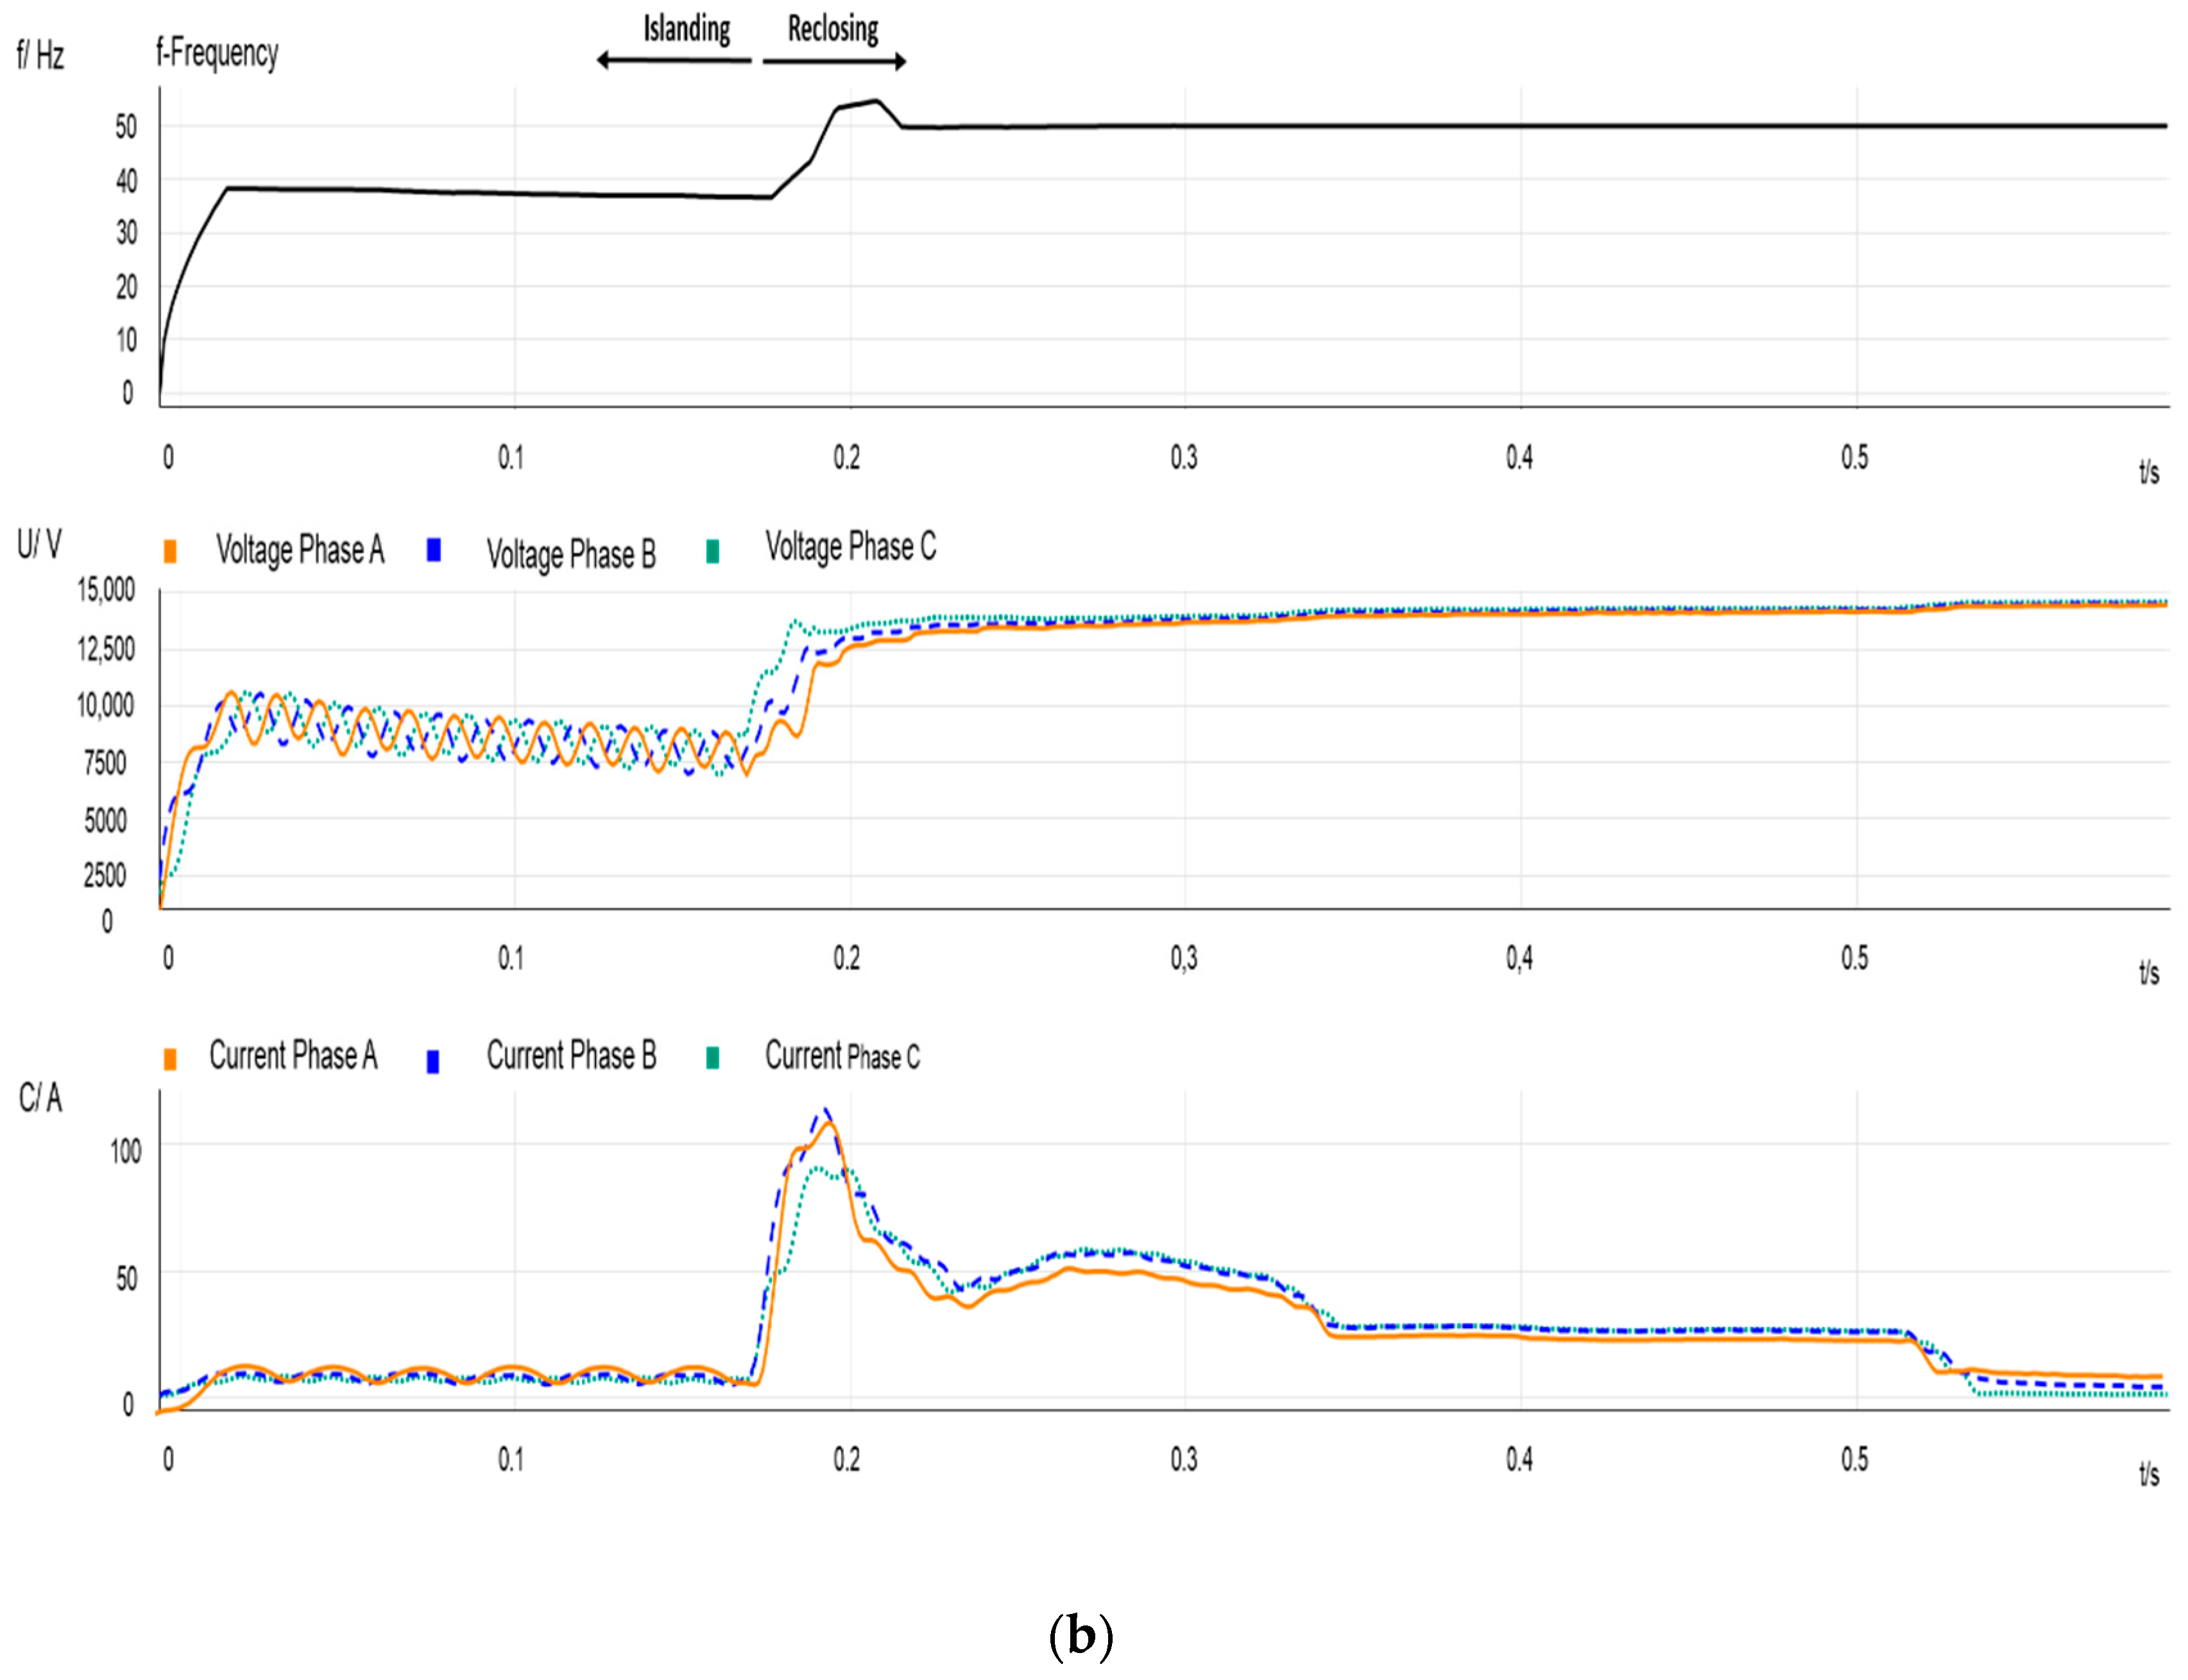
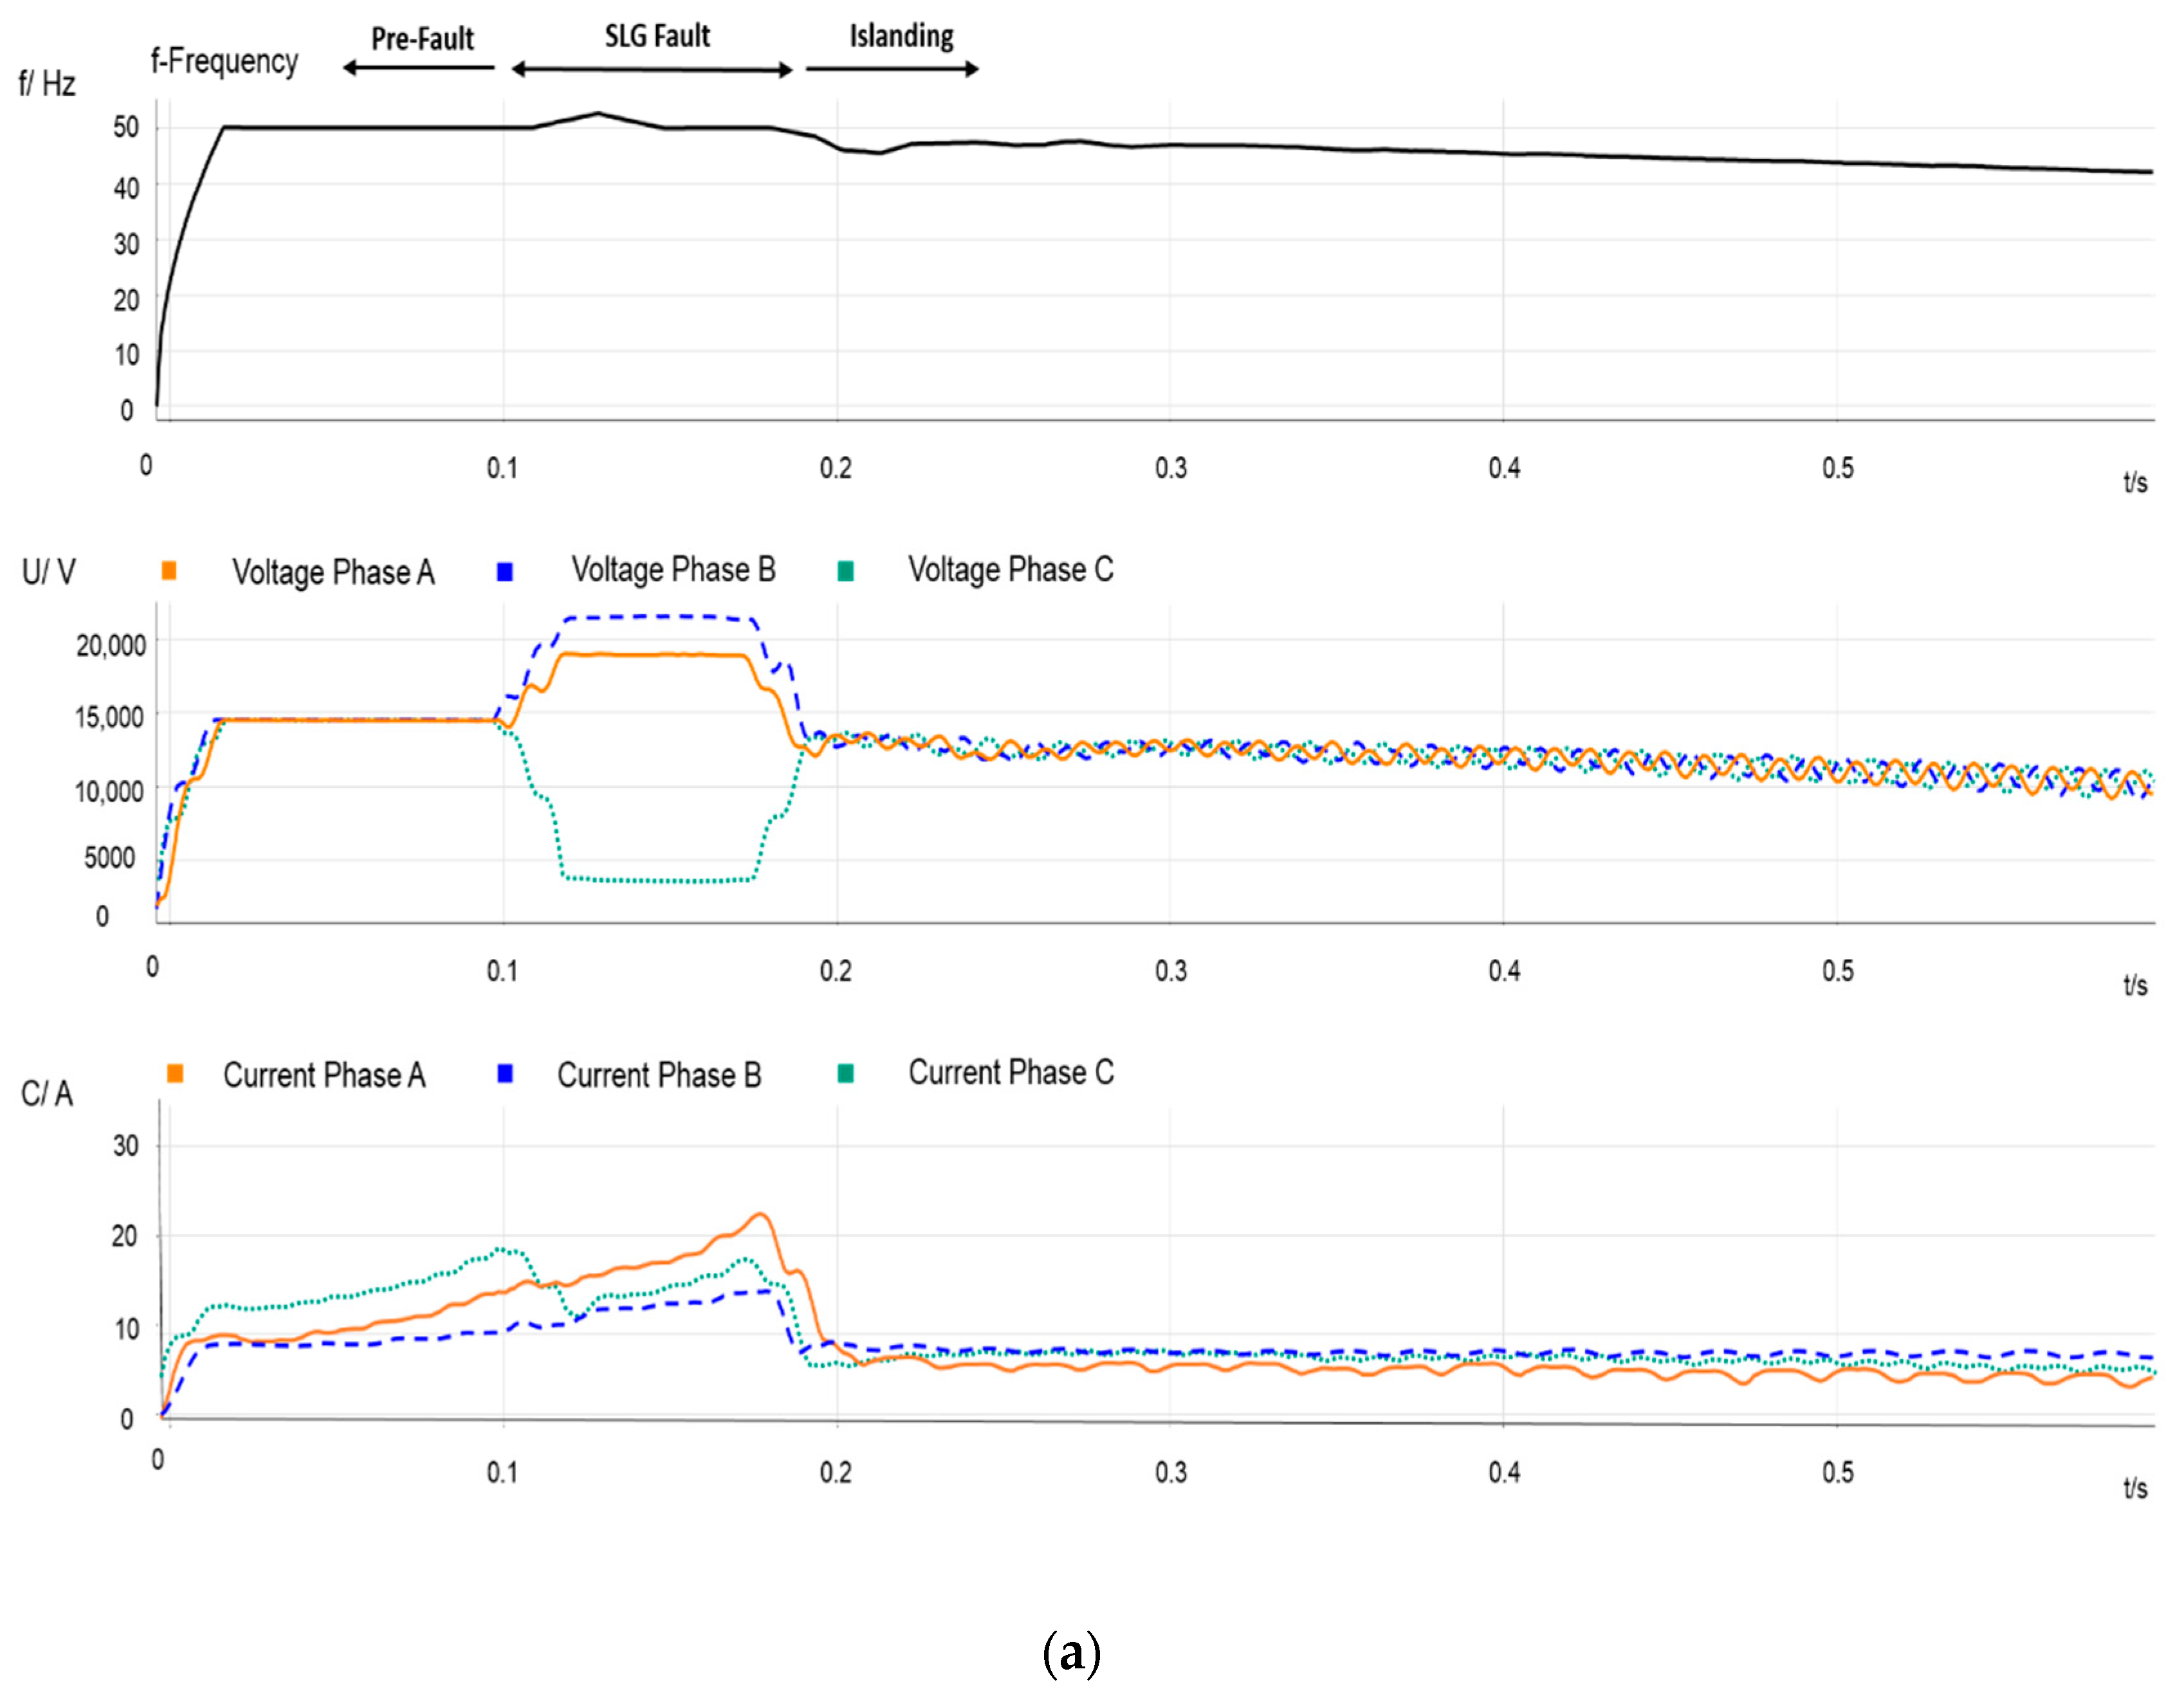
Event 1—Single-line-to-ground fault at node 8. Measurements recorded in PCC1. (a) Frequency, RMS phase voltages and current signals before and during the beginning of the event; (b) frequency, RMS voltages and current signals during the end of the event.
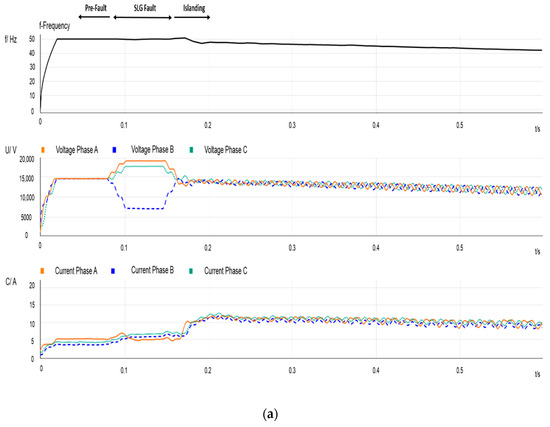
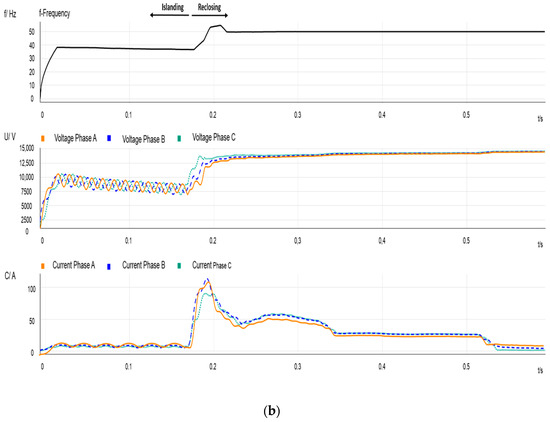
Figure 3.
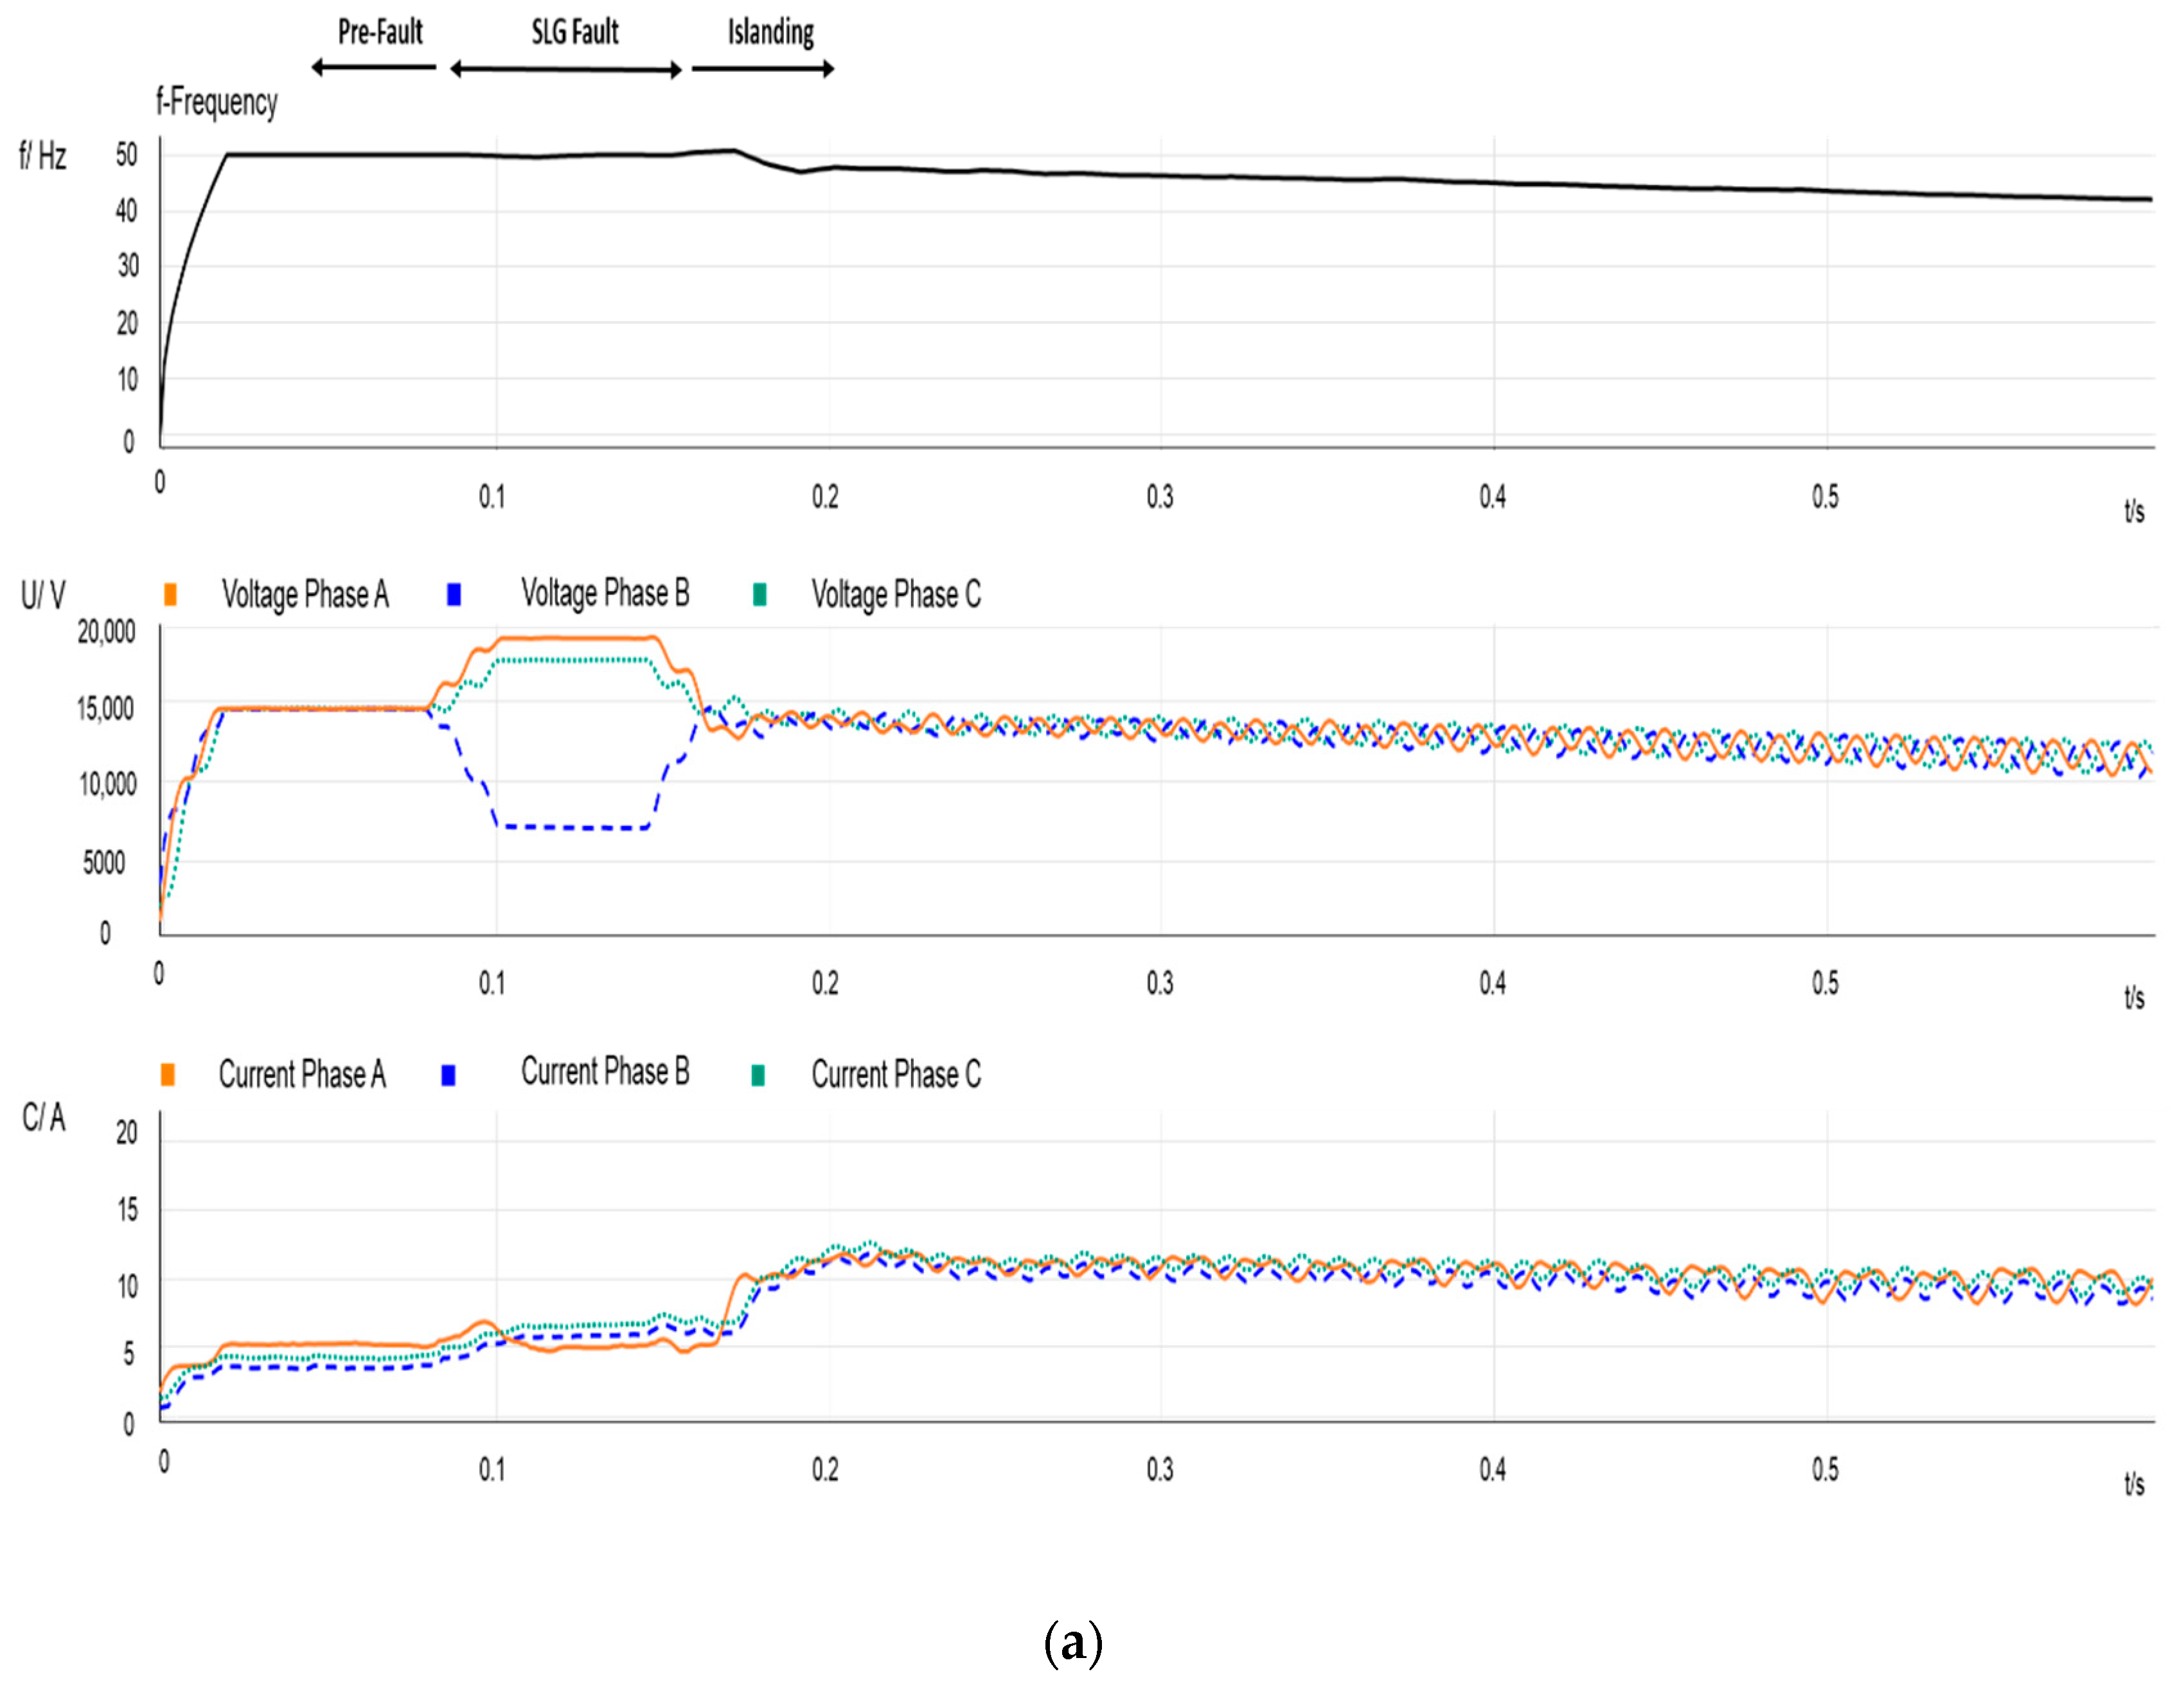
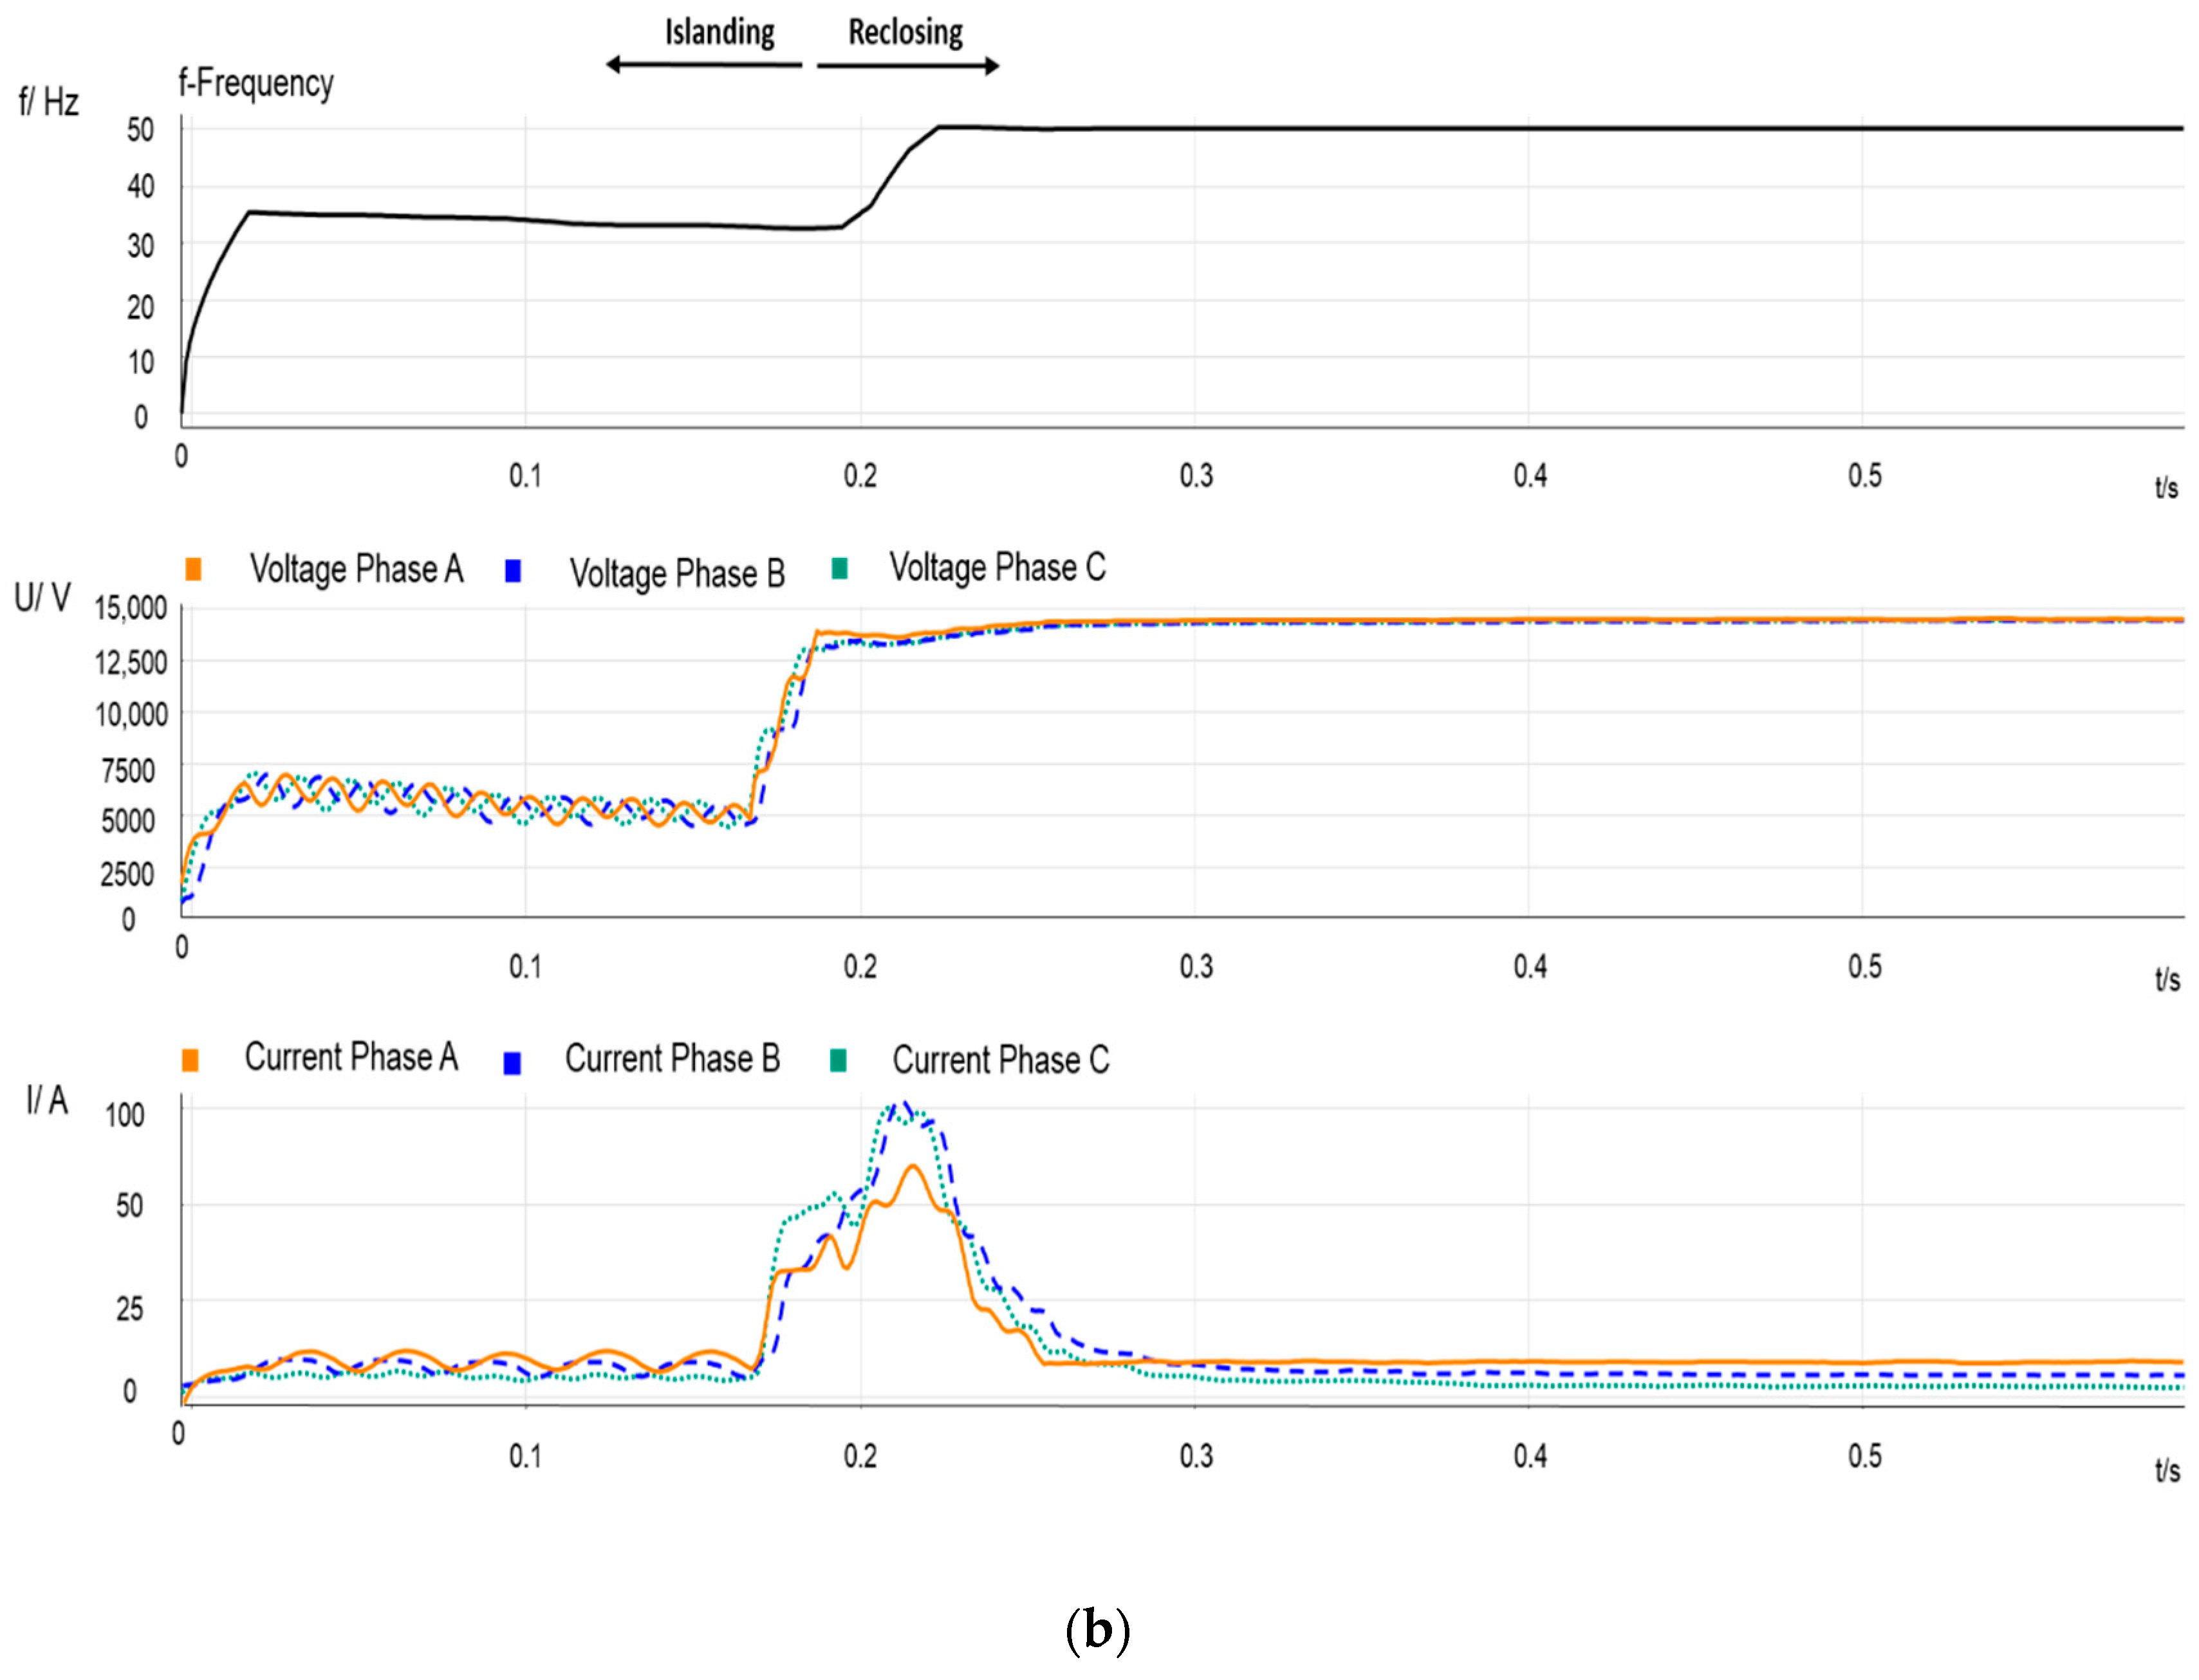
Event 1—Single-line-to-ground fault at node 8. Measurements recorded in PCC2. (a) Frequency, RMS phase voltages and current signals before and during the beginning of the event; (b) frequency, RMS voltages and current signals during the end of the event.
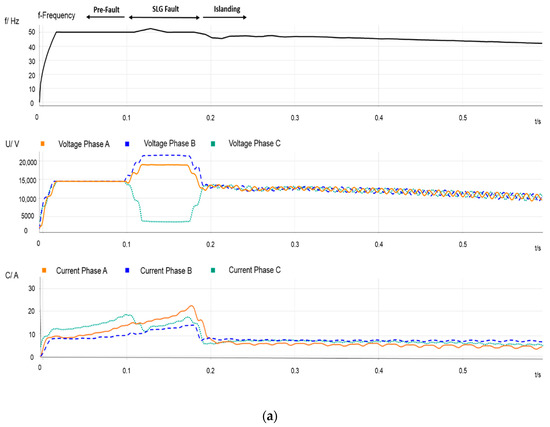
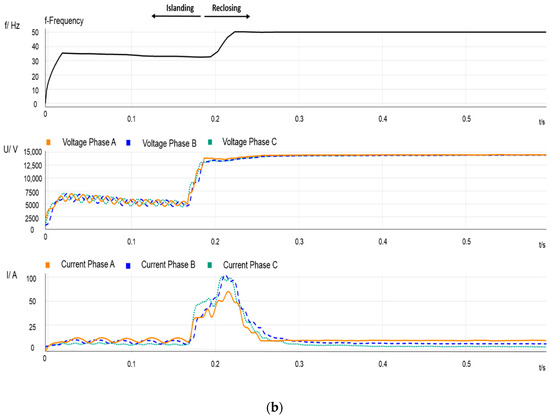
Figure 4.
Event 2—Single-line-to-ground between nodes 6 and 7. Measurements recorded in PCC2. (a) Frequency, RMS phase voltages and current signals before and during the beginning of the event; (b) frequency, RMS voltages and current signals during the end of the event.
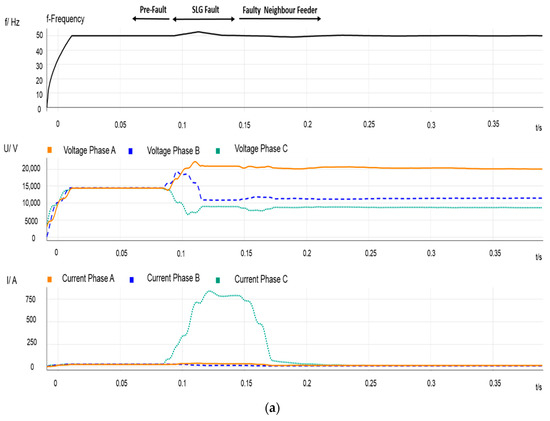
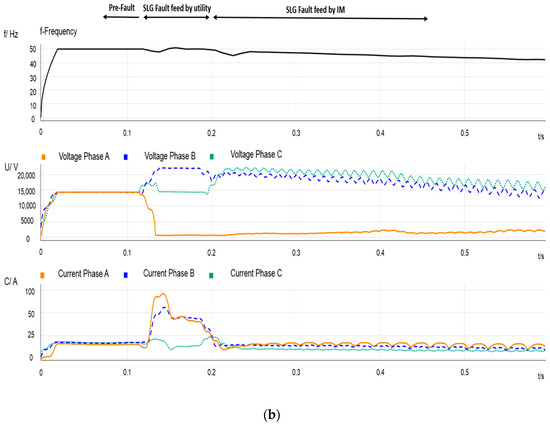
Figure 5.
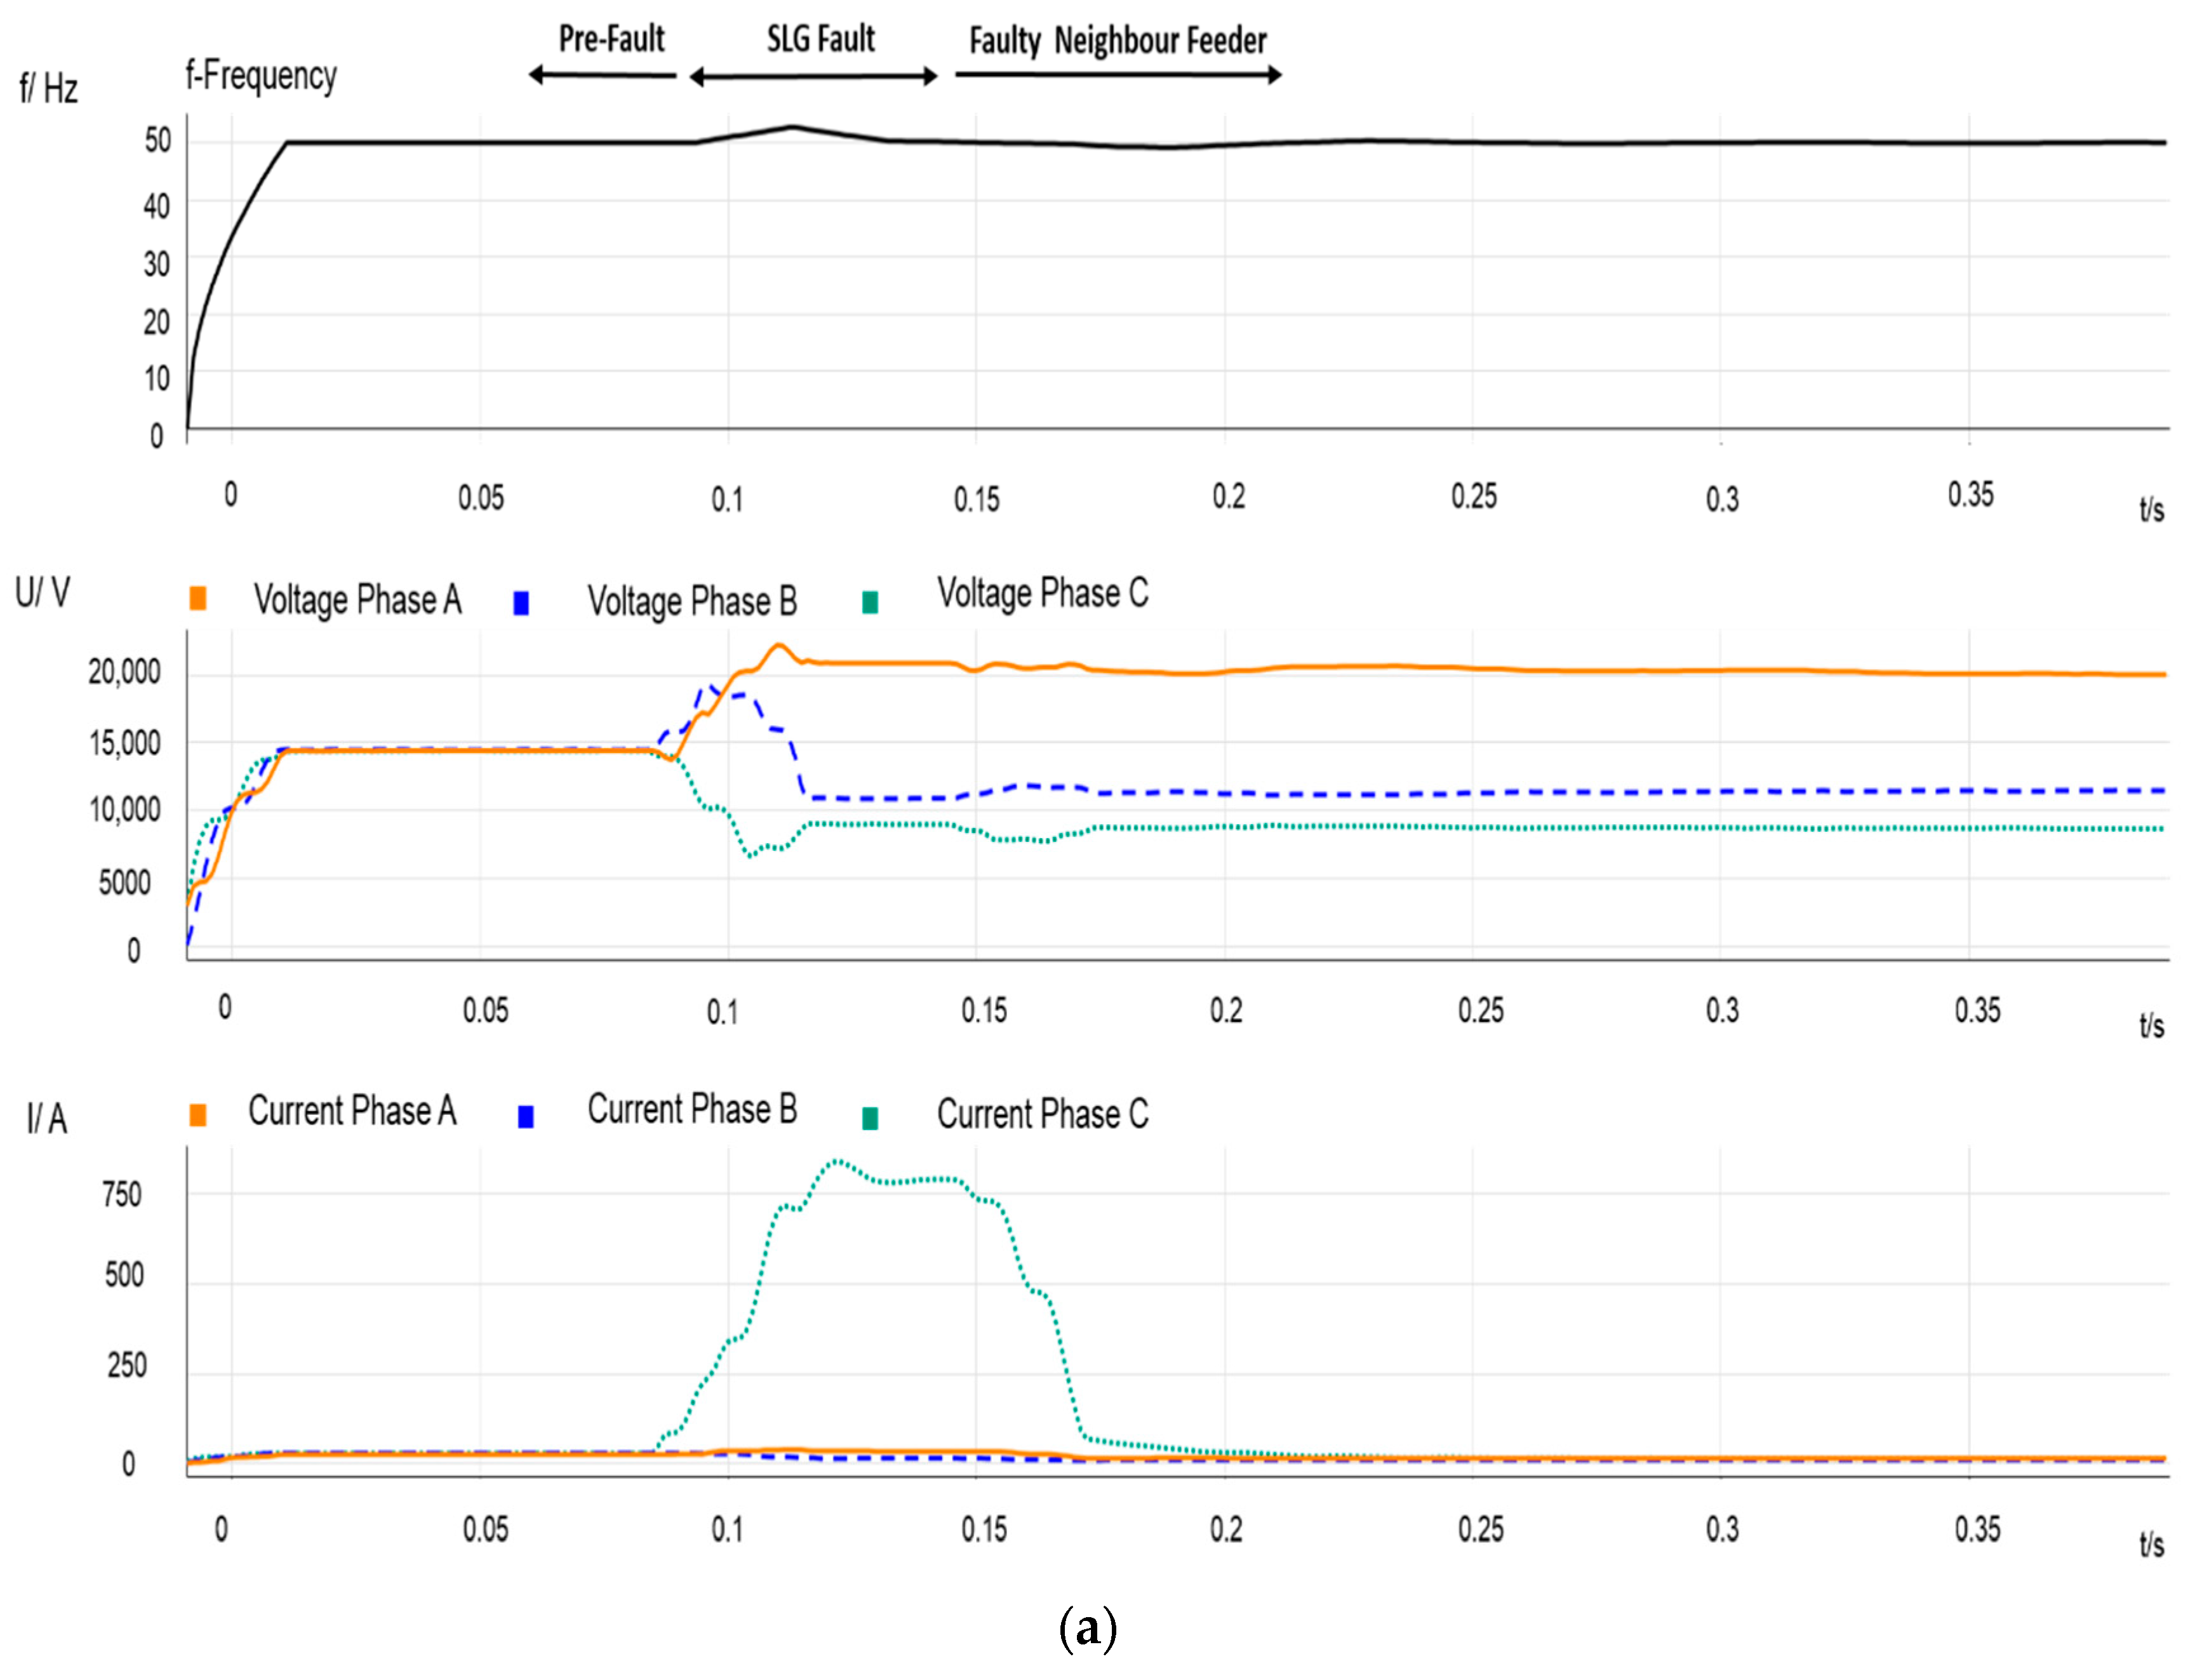
Event 3—Permanent fault at node 8. (a) Frequency value, RMS phase voltages and current signals recorded at PCC1; (b) frequency value, RMS phase voltages and current signals recorded at PCC2.
Event 1: It is caused by a single line-to-ground (SLG) fault at node 8 with a high-resistance fault of roughly 31.5 Ω. It is event 1 in Table 1, and is cleared by the circuit breaker CB installed at the head of feeder A. According to the root mean square (RMS) value of the phase voltages measured in both PCC1 and PCC2, the effect of line impedance from node 2 to 8 (11 Ω) is observable, thus, the voltage sag of 7.1 kV at node 8 becomes 8.89 kV at the PCC1. The sequence is as follows: (i) SLG fault occurs at node 8; (ii) CB opens; (iii) CB recloses after a prefixed period (820 ms).
- Figure 2 depicts some recordings measured at the source side of PCC1. The two plots show frequency, voltage and current variations during a period that covers pre-fault, during-fault, and post-fault scenarios, including the post-reclosing period. The beginning of the full event is depicted in Figure 2a; the upper arrows indicate the three parts of the transient process. One can observe voltage and current variations due to CB operation: The measured currents correspond to those flowing through feeder B; the frequency is that of the transmission system and remains constant; voltages are affected by substation grounding, and they exhibit both sags and swells. Take into consideration that this can also affect the unfaulted feeder loads. Figure 2b plots the transient response caused by the reclosing operation: The current due to the re-energization, the effect of the current drawn due to the IM reacceleration, and the effect of the out-of-phase reconnection are observable.
- Figure 3 depicts the measurements recorded at the MV side of the transformer at the load-side of PCC2 during the same period that Figure 2. After CB operation, the IM continues connected to the feeder, which does not longer supply active power. Consequently, the frequency in this part of the system steadily decreases until the reclosing instant. Figure 3b also shows that, according to the waveforms measured, after CB reclosing the IM reaccelerates until it recovers its rate speed, although, initially, the frequency (and the IM speed) decreases even more as a consequence of the reclosing transient; see Section 4. Take into account that frequency and voltage mismatches between the two CB terminals at the reclosing time will cause a transient torque that could seriously affect the machine.
Event 2: The event corresponds to a SLG fault that occurs at a midpoint of the line between nodes 6 and 7 (L5) with a resistance fault of about 12 Ω; it is Event 4 in Table 1. Figure 4 shows measurements recorded at PCC2. It is clear from Figure 4b that the IM is acting as a generator after the circuit breaker CB clears the fault. It is also noticeable that the values when the CB recloses are lower when compared with the previous Event 1, due to the higher loads connected into the affected feeder at that instant.
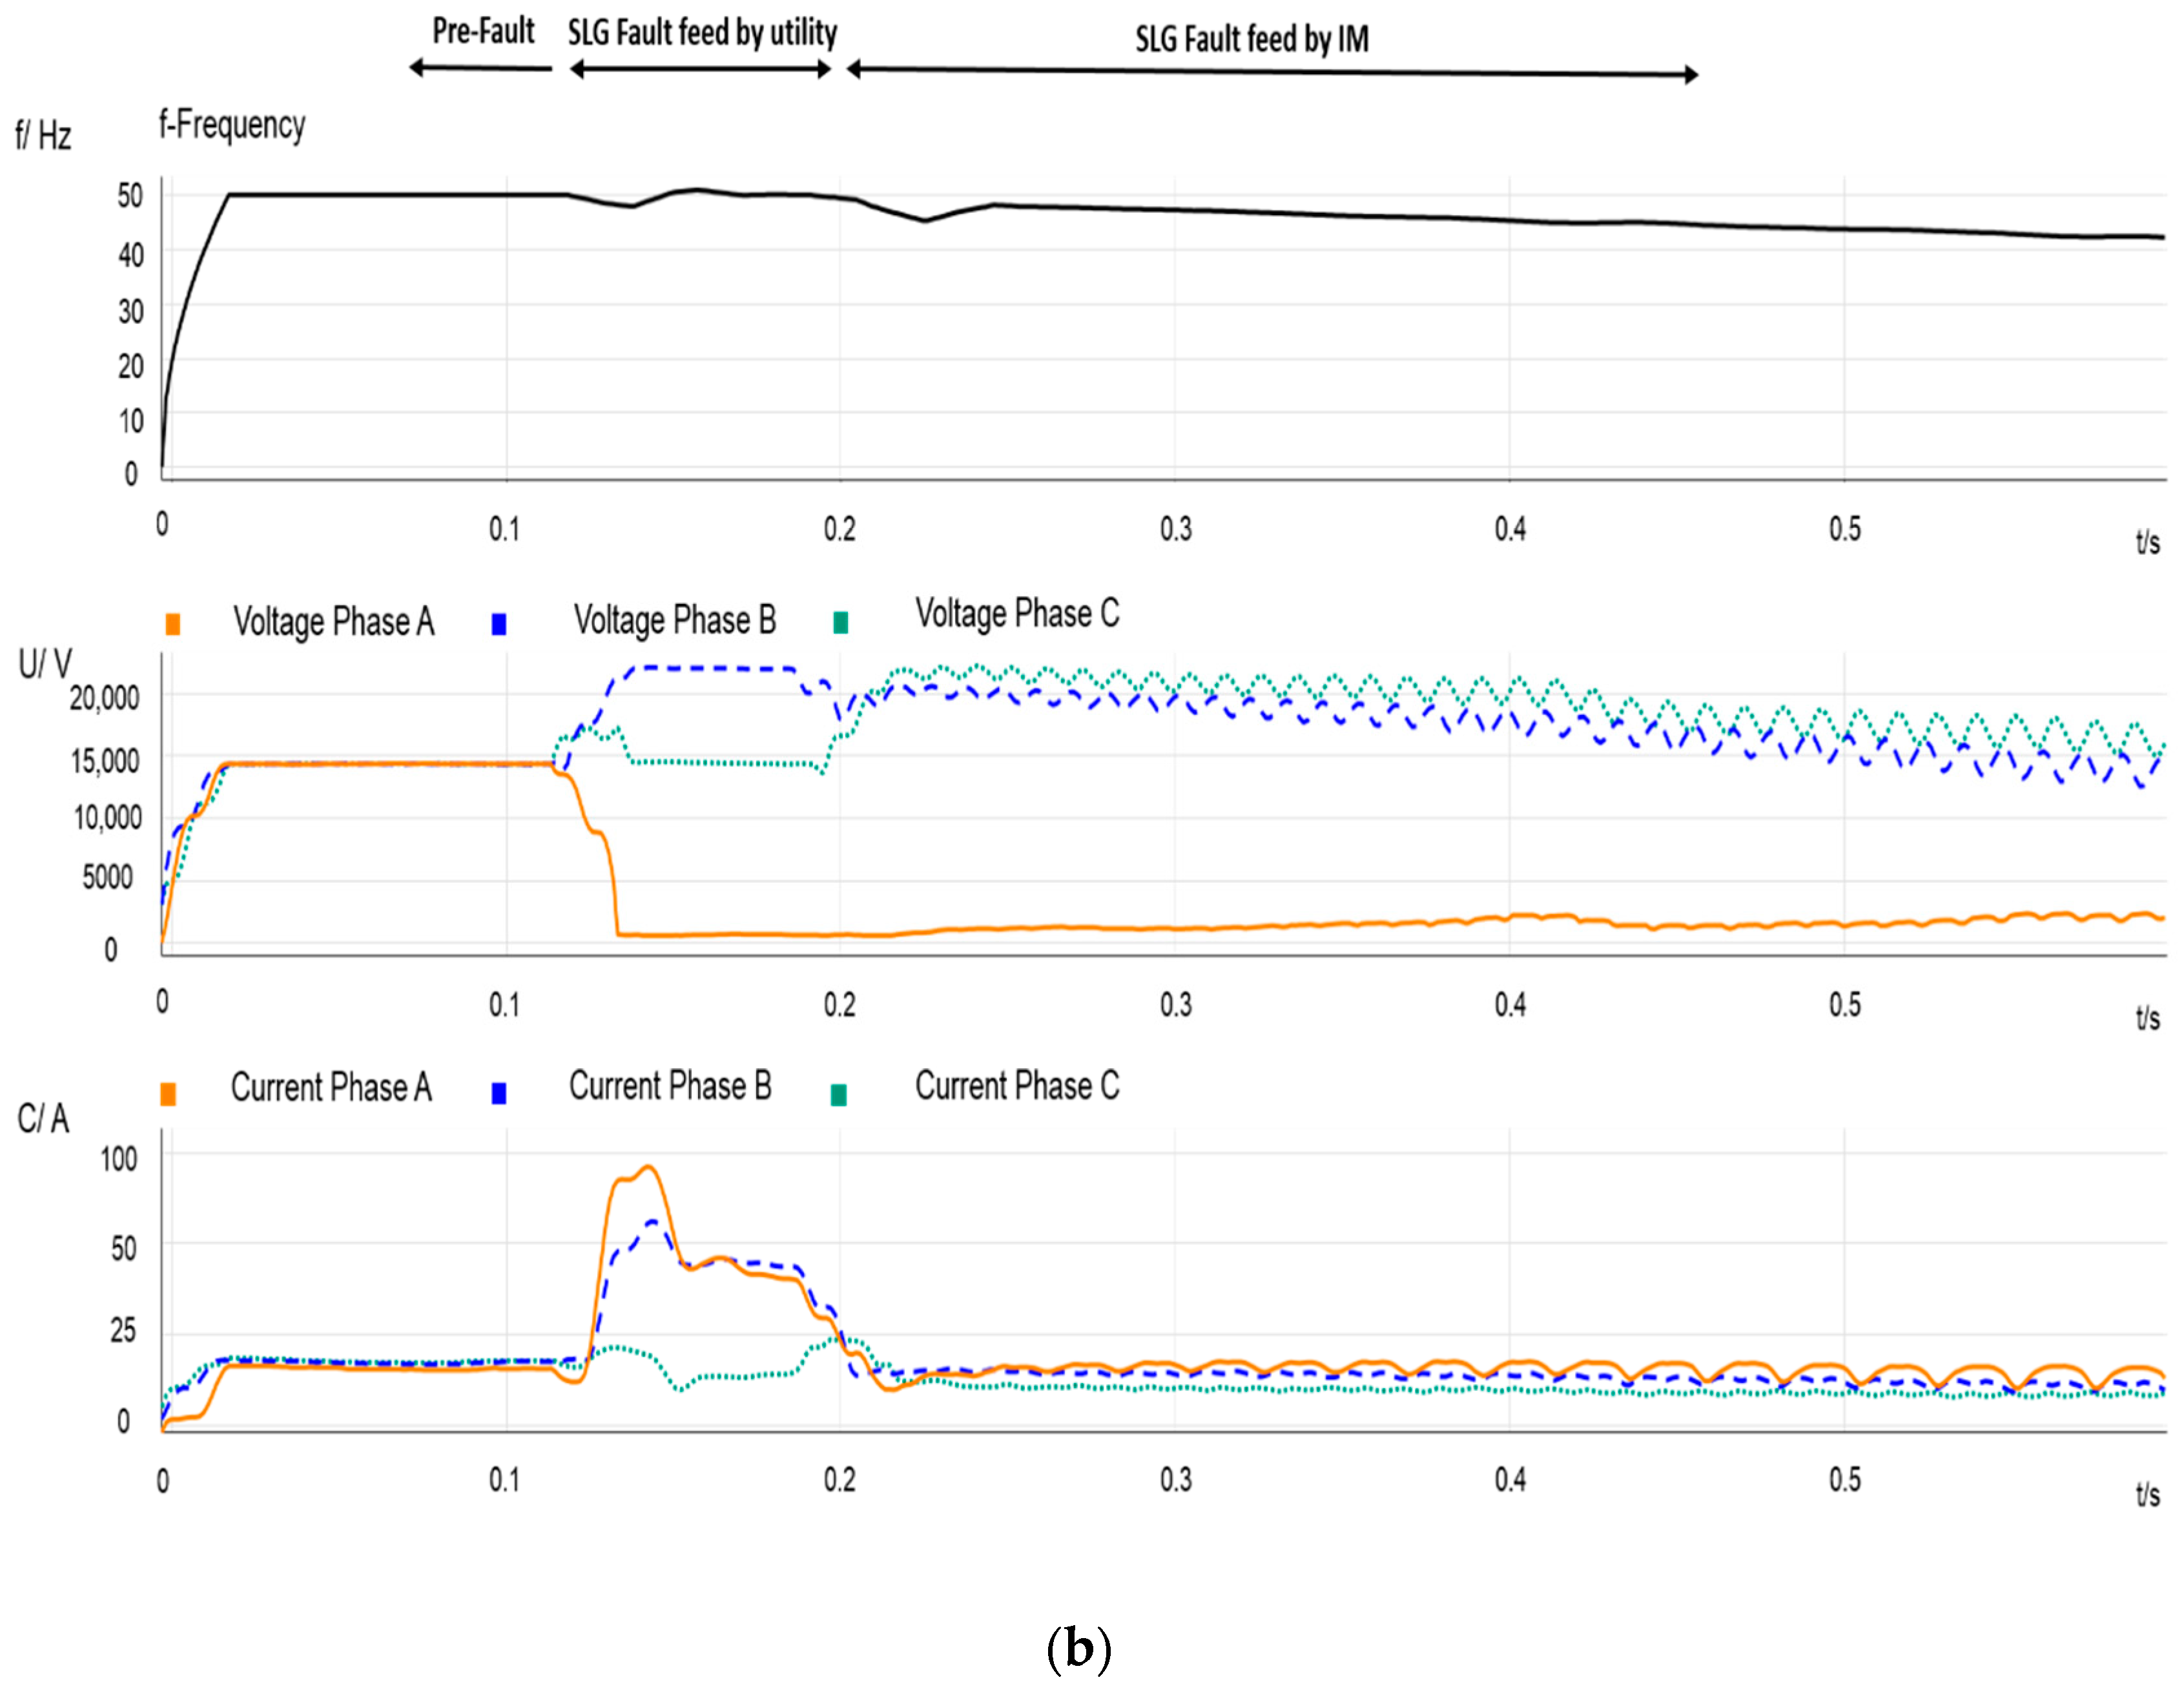
Event 3: The CB successfully cleared previous faults. However, Event 3 presents a different scenario in which the fault is prolonged due to the IM. It must be emphasized that this fact constitutes a high risk for the grid. Figure 5 shows measurements recorded at both PCC1 and PCC2 corresponding to a permanent SLG fault that occurs at node 8, clearly observable by taking a look at the voltage sag magnitude for the faulty phase at the PCC2; see Figure 5 and Event 3 in Table 1. Moreover, it is worth mentioning that the SLG in Feeder A appears simultaneously with a two-phase-to-ground (LLG) in an MV neighbor feeder. After the CB opening operation, the fault is fed by the IM. Figure 5b shows the measurements of the PCC2 and evidences the untimely tripping operations by the head-CB. For this event, the fault was prolonged 800 ms after the CB aperture. The transient represented in Figure 5b can be divided into parts: the top arrows in this figure indicate the pre-fault situation, the SLG fed by the main grid, and the fault fed by the IM.
4. System Components Modeling
4.1. Introduction to Modeling Guidelines
This section aims to discuss how to model the main test system elements: Lines, transformers, loads, IMs, and protective devices. A crucial aspect to consider in order to accurately assess the transient behavior of the test system is the range of frequencies with which transients are generated. Other factors that may significantly affect the simulation results are the load profiles, the voltage/frequency-dependence of loads, or protective device settings. The guidelines followed when implementing the test system model are summarized below:
- The saturation effect is considered in transformers.
- Transmission line impedance, for each particular section, is assumed to be equal for the three phases.
- IM is modelled as saturable because of the stator current increment that follows CB opening.
- Typical IEC-IEEE curves are considered for protective devices.
4.2. Transmission System
Transmission and distribution line representation can be based on either distributed or lumped parameters. A precise way to model a transmission line is with distributed parameters at a specific range of frequency; see, for instance, [14]. The representation of transmission lines for transient studies has been analyzed in [17]. The frequency dependence of line parameters is discussed in [18,19]. Although, the main part of the system under study is composed of overhead lines, a non-negligible portion is formed of underground cables; a thorough evaluation of the cable models is carried out in [20].
In the present study, a series impedance model for direct/inverse and zero sequences with parameters measured at 50 Hz will suffice to model overhead lines. However, the zero sequence component of cable shunt capacitances has been taken into consideration. Direct and inverse sequence values of the series impedance will be assumed equal. The line parameters of the test system are summarized in Table A2 of Appendix A.
4.3. Transformers
Transformers can be categorized by the number of windings and its connection, the number of phases (e.g., three-limb core, five-limb core or three single-phase transformer), the turns ratio, the power rating, the clock ratio between windings, and the type of cooling. In addition, several transformer designs can be installed in the same test system (e.g., power distribution transformers, grounding transformers, instrument transformers). ANSI/IEEE-Std. C57.12 provides useful data regarding transformers characteristics and tests [21].
Since saturation effects can be crucial [22], transformers will be modeled as saturable. Although a frequency-dependent representation can be required in some transformer transients, this dependence will not be considered in the present study due to the low-frequency range of the analyzed transients. The saturation curve that has been used for a three-limb three-phase transformer design is that implemented in the power systems toolbox library of Matlab/Simulink, and is based on the following polynomial expression,
where the generic coefficients depend on transformer power rating and configuration. In-depth research regarding transformer modelling for low and mid-frequencies can be found in [23,24,25]. In [26] a practical saturation estimation from recorded inrush currents waveform is proposed.
Up to three transformer models have been implemented in this study: (i) HV/MV transformer, which is wye/delta connected (substation transformer); (ii) MV/LV transformers, which are delta/wye connected; (iii) grounding zig-zag transformer, which allows to ground MV feeders. Transformer parameters are provided in Table A2 of Appendix A. Transformer ratios are assumed constant during this study.
4.4. Protective Devices
Protective devices can have a significant impact on transient performance. The list of concerns in DNs with DG includes the mis-coordination of protective devices, due to the changing short-circuit current, sensed by the main relays and the impact of reclosing on distribution equipment [27]. A general overview of protection performance in distribution networks in the presence of DG has been analyzed in [28]. In the present study, there are no generating units but there are induction motors present.
This section details the models used for characterizing and representing protective devices. Relay settings and its characteristic curves are critical factors to consider when designing the coordination between devices. Overcurrent protection is commonly used in radial DNs because of its simplicity for selectivity purposes. The protections accounted for here are 50/51 (phase-overcurrent), and 50/51N (neutral overcurrent), respectively. Remember that clearing times depend on these curves and their settings.
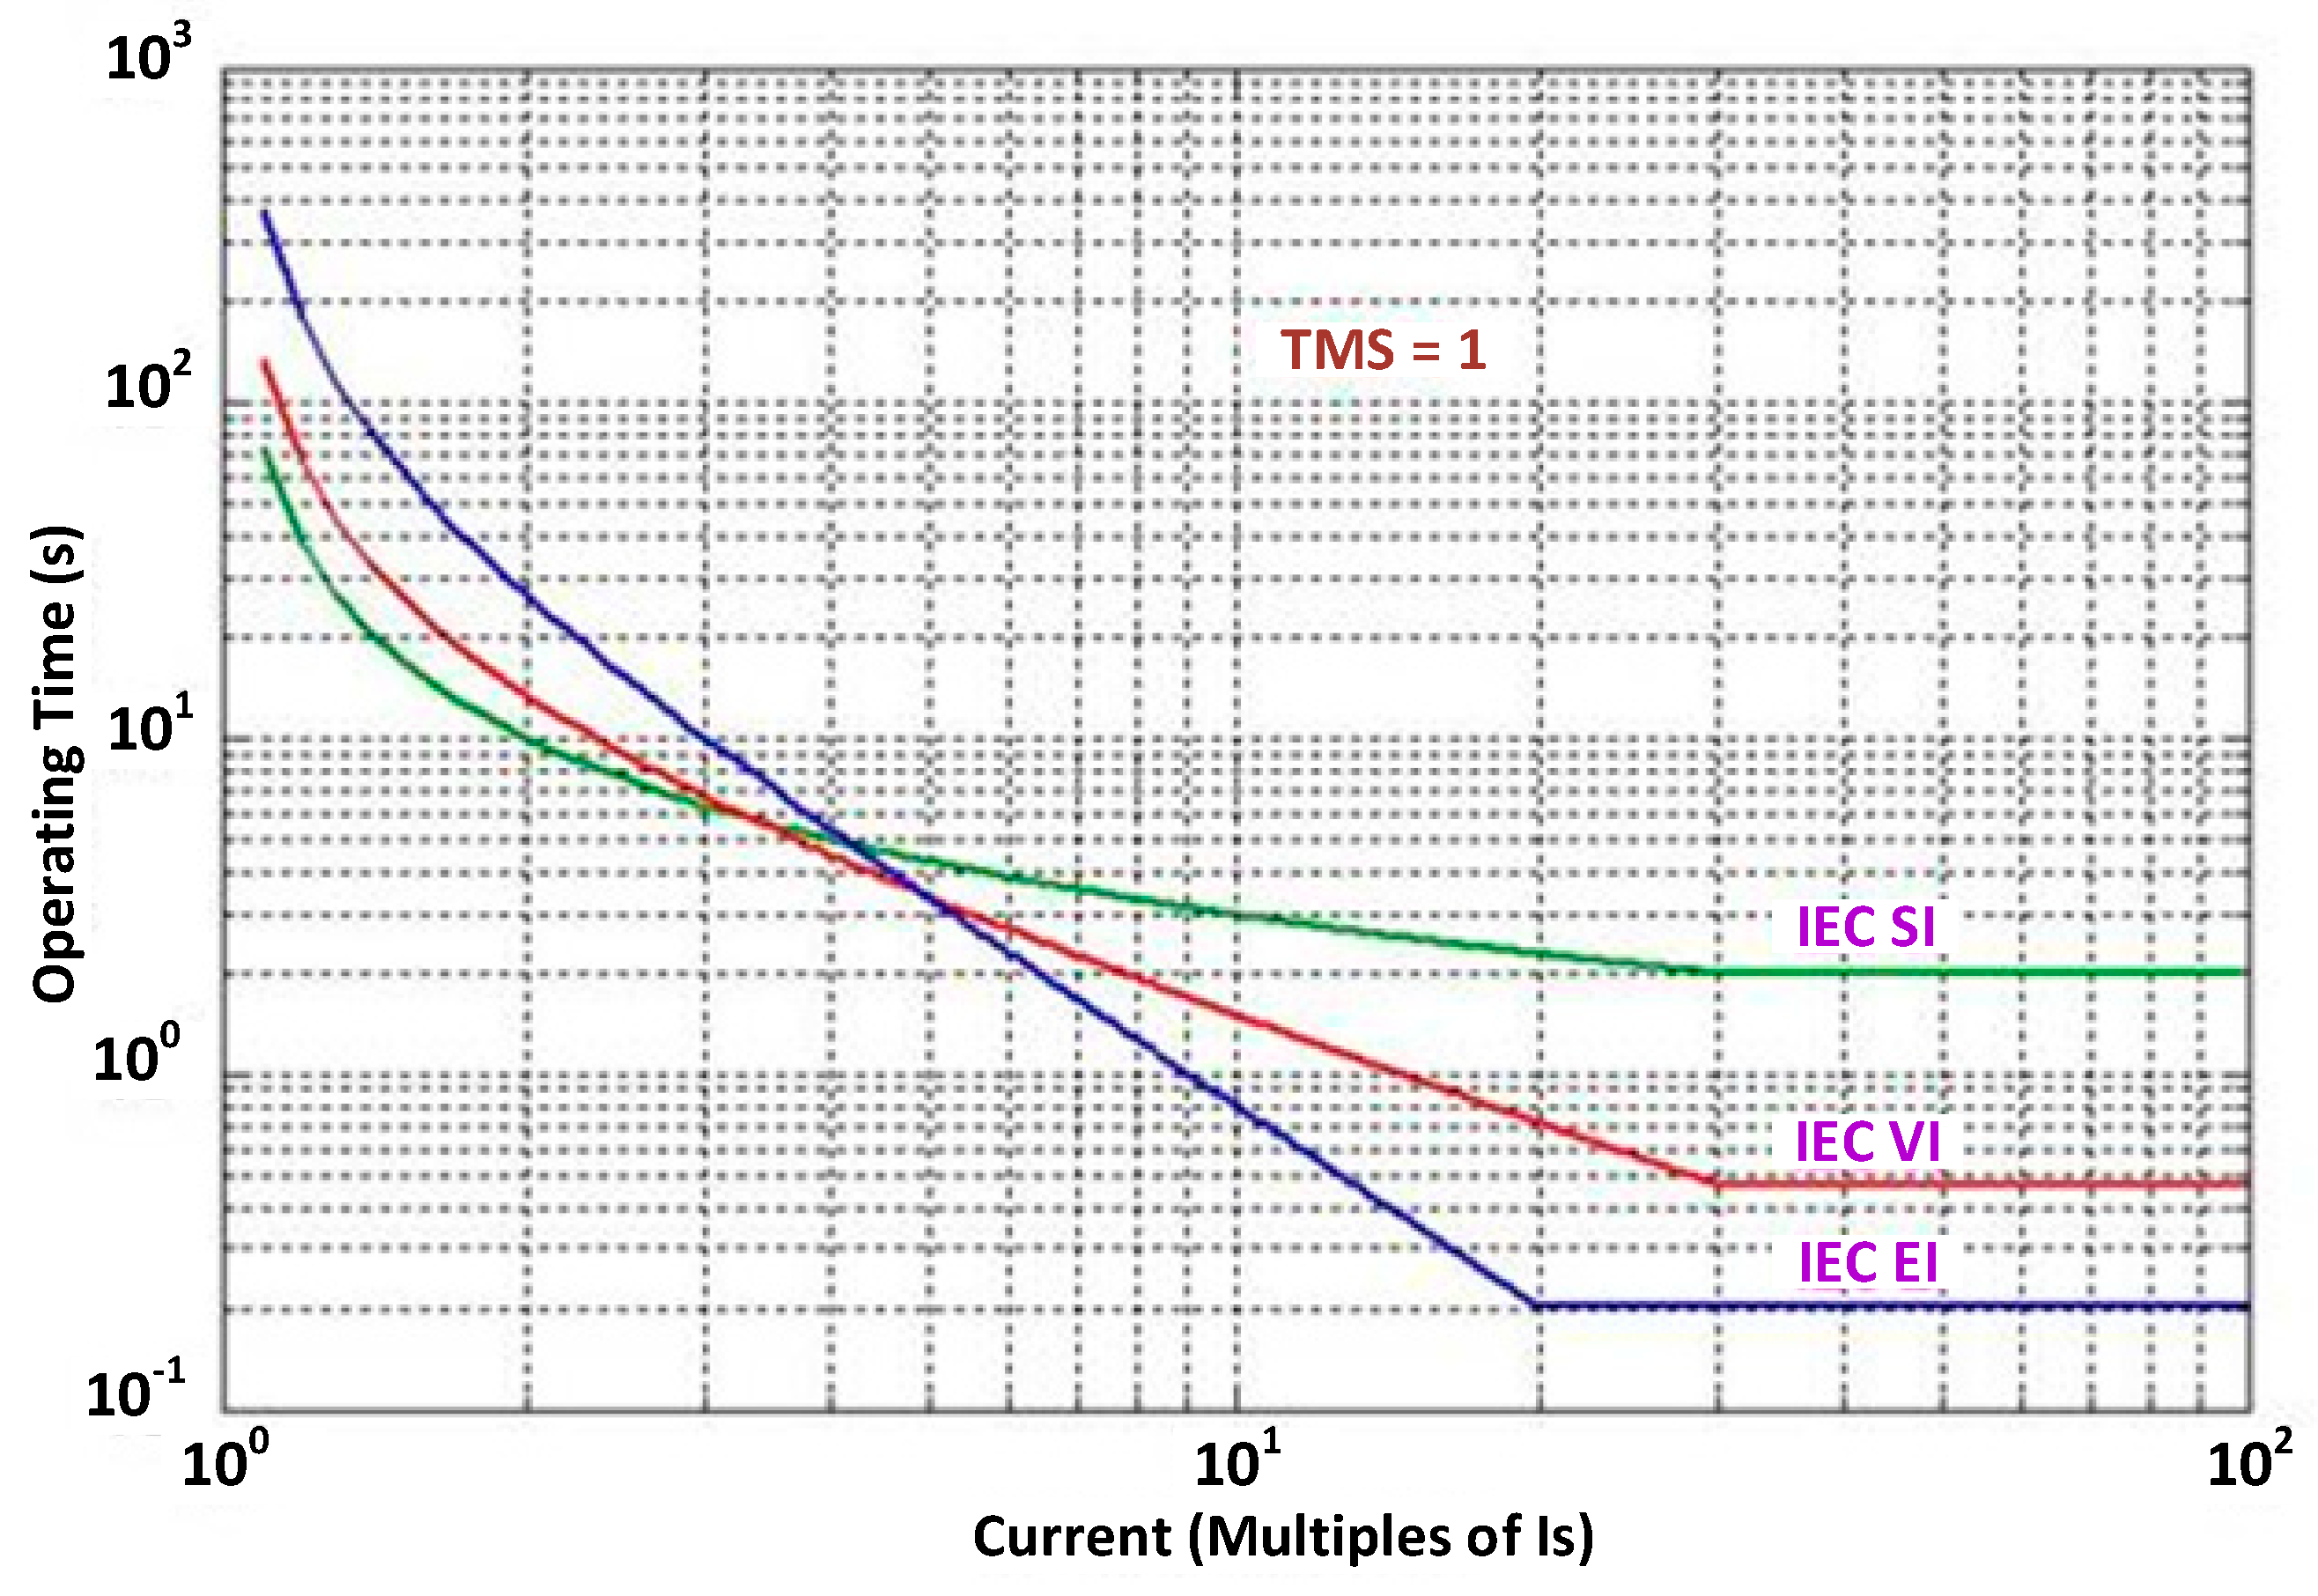
Only the characteristic curves of overcurrent relays are considered. The most common used curves are: standard inverse (SI), very inverse (VI) or extremely inverse (EI); see Figure 6. The operation time T of a 50/51 overcurrent relay can be defined by the following equation:
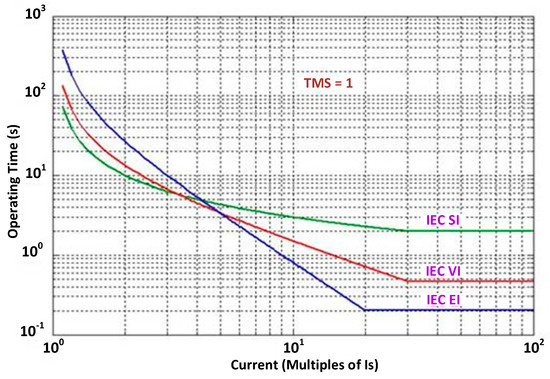
Figure 6.
Time-current curves of overcurrent relays.
The operation time T0 for a 50/51N earth overcurrent relay can be calculated as follows,
where factors K and K0 are adjustable and typically ranged between 0.05 and 1.6, I is the picked up current, In is the rated current, I> is an acceptable overload factor, and n is a factor to distinguish between relay curves. In particular, n is 0.02 for SI, 1 for VI and 2 for EI; t is a factor which also depends on the curve, for SI is 0.14, for VI is 13.5, and for EI is 80. For ground faults, I0 is the sum vector of the three picked up currents sensed by the relay, I0> is the overload factor, between 0.1 and 0.8.
Selectivity tasks define the time constraint. CB modeling is not unique because of some physical factors are involved (e.g., SF6, oil or air insulation); a study of CB characterization has been presented in [29].
Lastly, several preset reclosing operations are implemented into the relay model; they are aimed at restoring the electrical supply after its tripping. Commonly, between three and four reclosing are used for unsuccessful reclosing operations. The first reclosing is typically fast, between 0.5 and 1 s.
The implemented settings in the relay located at the PCC1 are summarized in Table 2.

Table 2.
Over-current relay parameters.
4.5. Induction Motors
Since the magnetic field in the rotor of the IM and its kinetic energy at the time the CB opens the circuit will dictate the behavior of the island, an accurate representation of the IM is of utmost importance in this study. The electrical equations of a squirrel cage IM in the abc reference frame can be expressed as follows [30]:
The mechanical equations, as well as the mechanical power, can be expressed as follows,
where Γem is the electromagnetic torque, Γb is the friction torque, Γload is the mechanical load torque, θm is the angular position, JT is the total moment of inertia (considering the rotor inertia and mechanical load), and Pm is the mechanical power developed by the IM. Since the IMs considered here are the squirrel cage, the rotor voltages are set to zero.
The electromagnetic torque developed by the IM in Park’s dq components can be expressed by the following equation,
where ird and irq are the direct and quadrature components of the rotor currents, isd and isd are the direct and quadrature components of the IM stator currents, M represents the coupling inductance between stator and rotor and 𝓅 are the pole pairs. The data of the IMs are detailed in Table A2 of Appendix A.
4.6. Loads
Load modelling has been the subject of several studies, see [31,32,33,34]. In [35], the voltage and frequency dependence of composite load models are evaluated, and the following equations for both active and reactive powers are derived,
where Pn and Qn are the initial active and reactive powers, V is the initial value of voltage, Vn is the adjusted voltage, P and Q the active and reactive power with the adjusted voltage, Δf is the difference between the rated frequency (50 Hz) and the adjusted frequency, kpv is the exponential factor that varies from 0 to 2 depending on the load type, and kpf is the frequency sensitivity factor.
Since a deviation in the supply frequency affects the power drawn by loads, this dependence has to be considered as a frequency sensitivity [36,37]. Even though in this study, frequency deviations occur during islanding, the loads are mainly resistive, they are not affected by this frequency deviation. Although, there is not sufficient evidence (or field measurements) to select a given model, the model selected for each load provides a close enough simulation result to that obtained from measurements.
The appropriateness of the selected load models is evidenced in Section 3 if one takes a look into the pre-fault values in column 9 and 10 of Table 1: feeder load power is mainly active. Therefore, in the implemented models, loads are only considered voltage dependents. The available three-phase dynamic load model of the power systems toolbox library of Matlab is used [38]. The equations that define both active and reactive powers are the following,
where Po and Qo are the active and reactive powers at the initial voltage Vo, P(s) and Q(s) are the active and reactive powers at the rated voltage V, np and nq are constants to model the three type of loads (i.e., if n = 0 the load is modelled as constant power, if n = 1 the load is modelled as constant current, and if n = 2 the load is modelled as constant impedance), tp and tq are time constants that control the dynamics of both active and reactive powers.
The rated power values and the load models for LV feeder loads are summarized in the Appendix B; see Table A3. Remember, however, that active and reactive powers at the time the fault occurs, do not have to meet this value due to the random pattern of costumers. As mentioned above, Figure A1 in Appendix B shows the real load profile for a half month in order to observe its effect on the survivability of the islanding events. During the period depicted in this figure, four events were recorded. These events are highlighted in red circles.
4.7. System Model
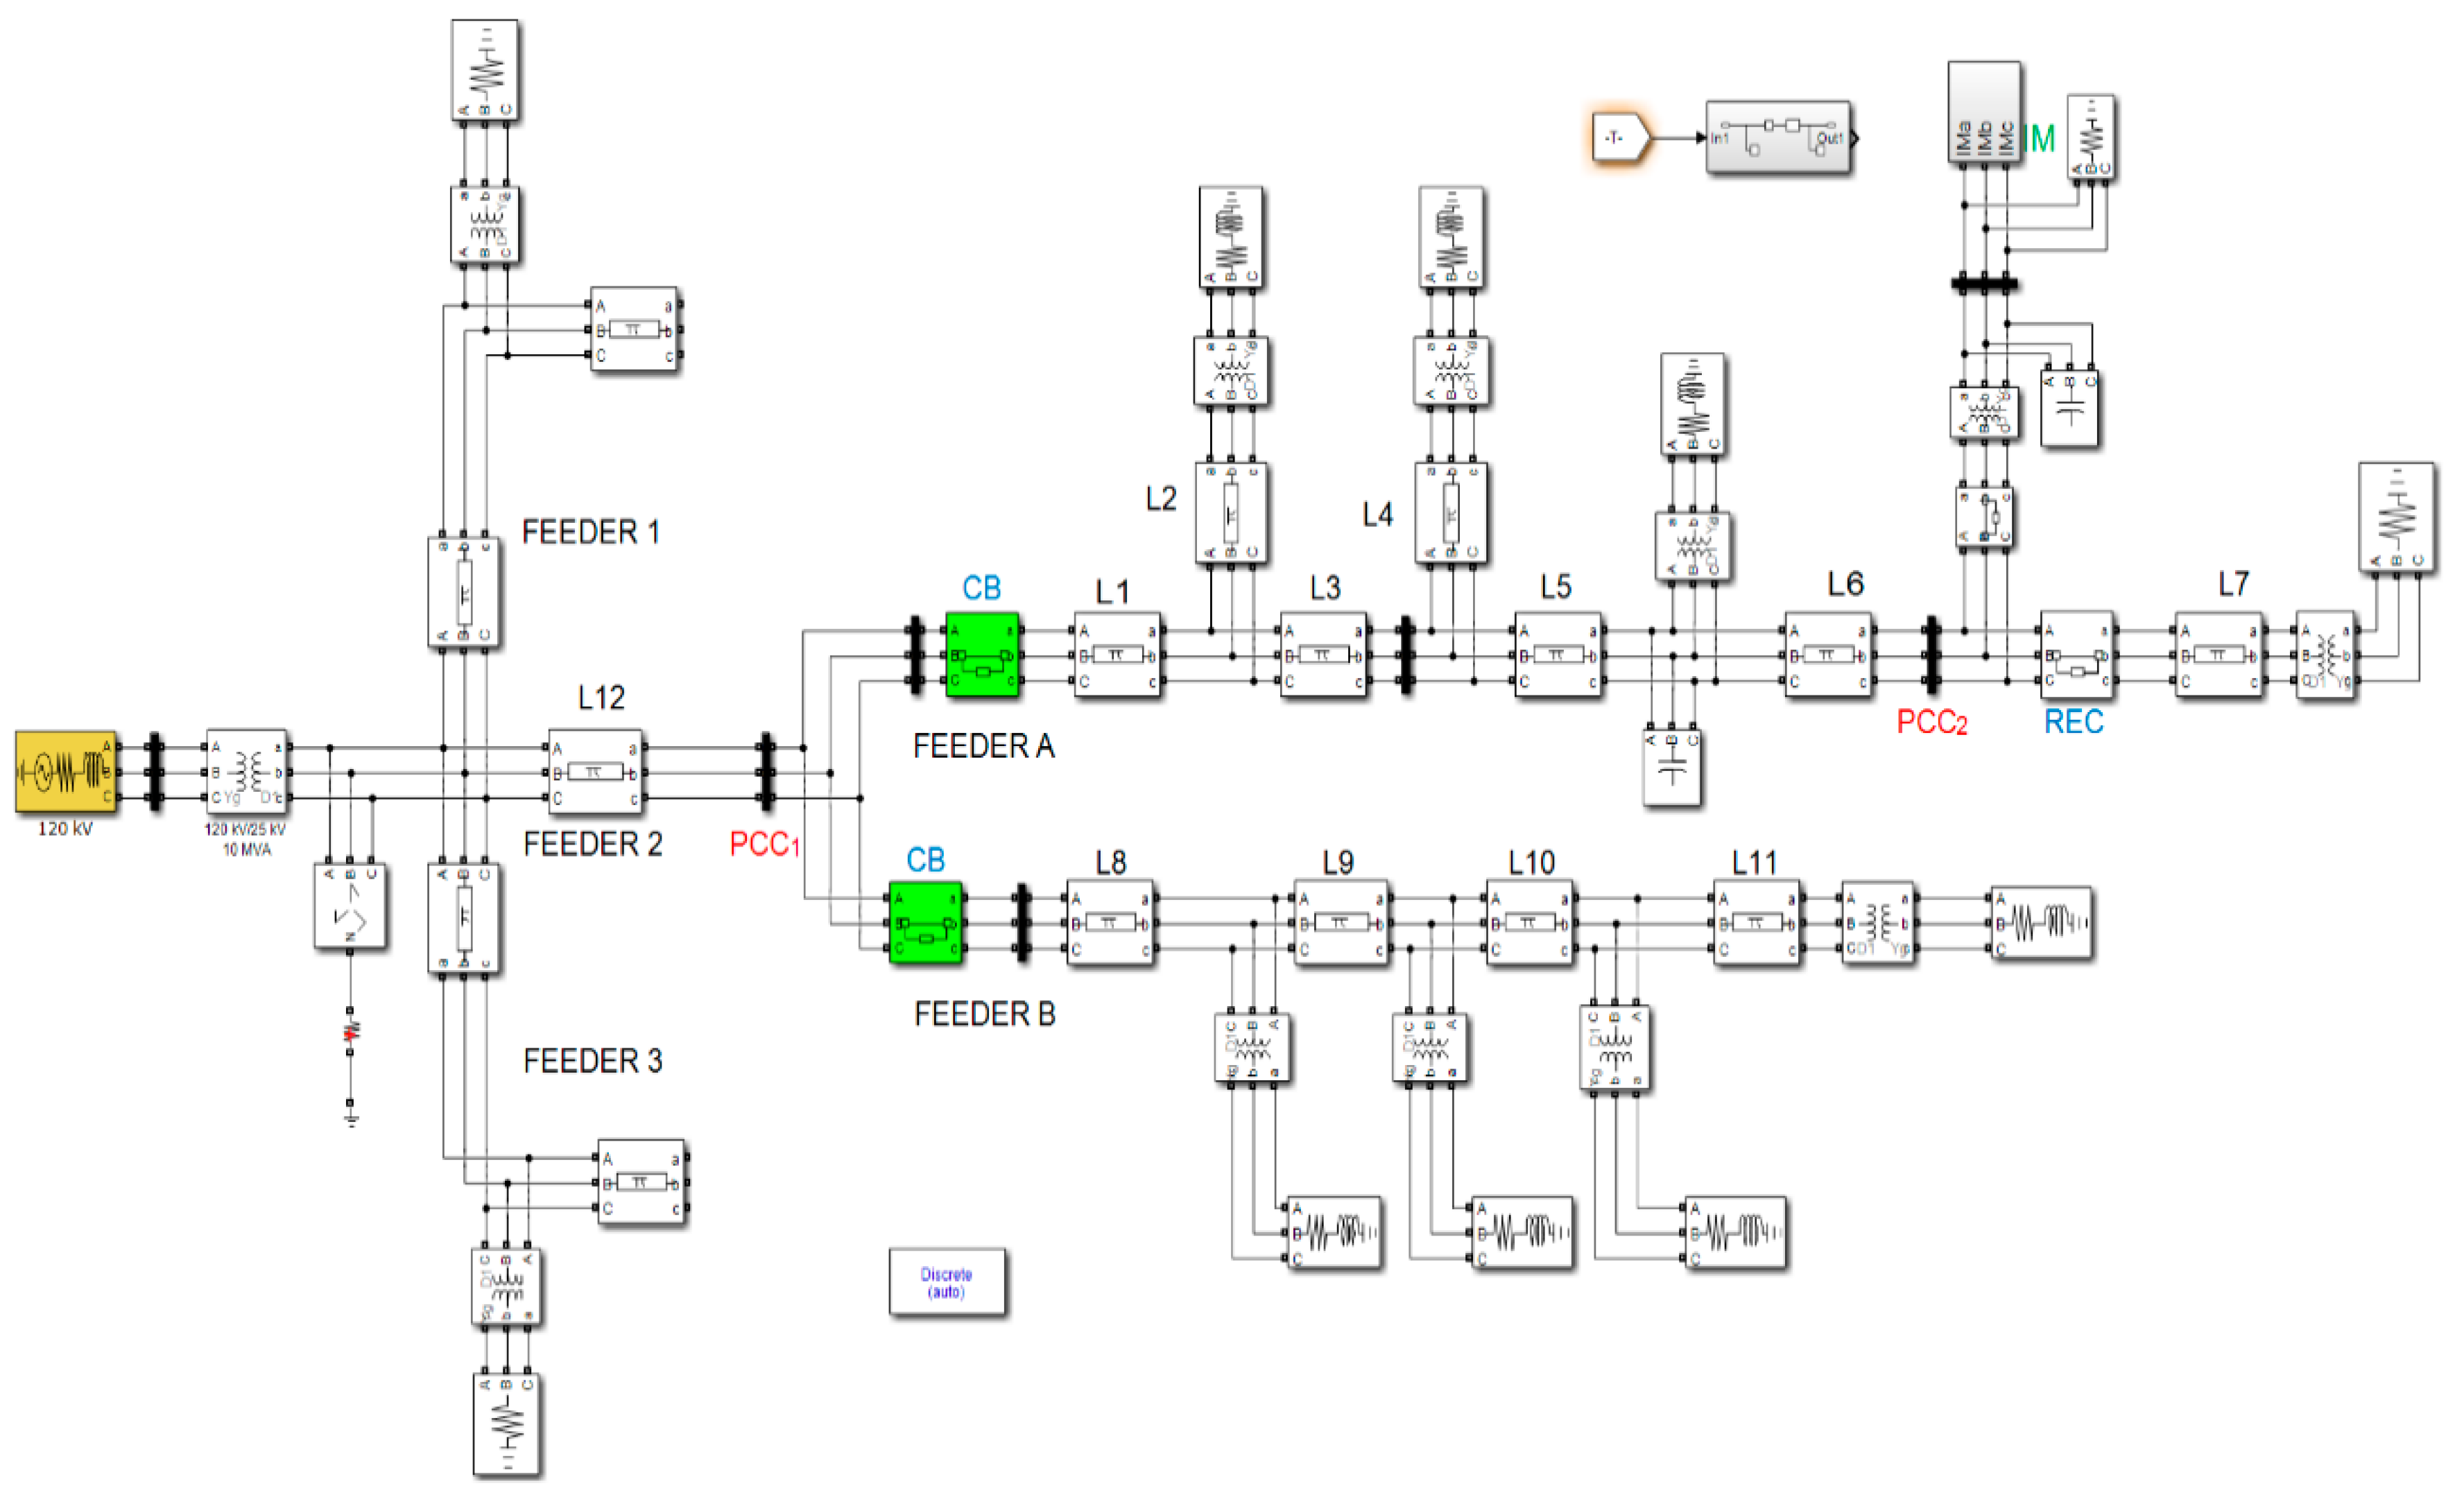
The test system model has been implemented in the MATLAB/Simulink environment using the specialized power systems toolbox library [38]. The three-phase model shown in Figure 7 has been implemented in a computer with a processor of 3.6 GHz 8-core Intel i7 and 8 GB of RAM. The simulation has been conducted in a discrete mode with a fixed sample time of 50·µs, a solver based on the Dormand-Prince eight-order (RK8) method and a simulation time for all scenarios of 2.5 s.
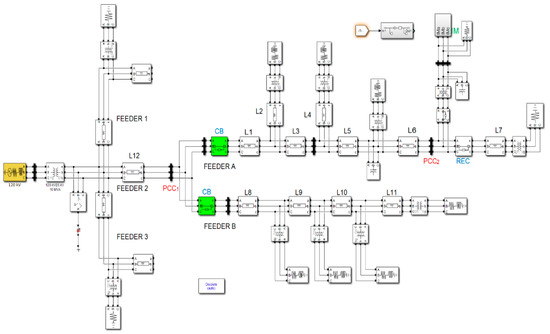
Figure 7.
Three-phase Matlab/Simulink implementation of the test system.
5. Islanding Analysis
5.1. Overview
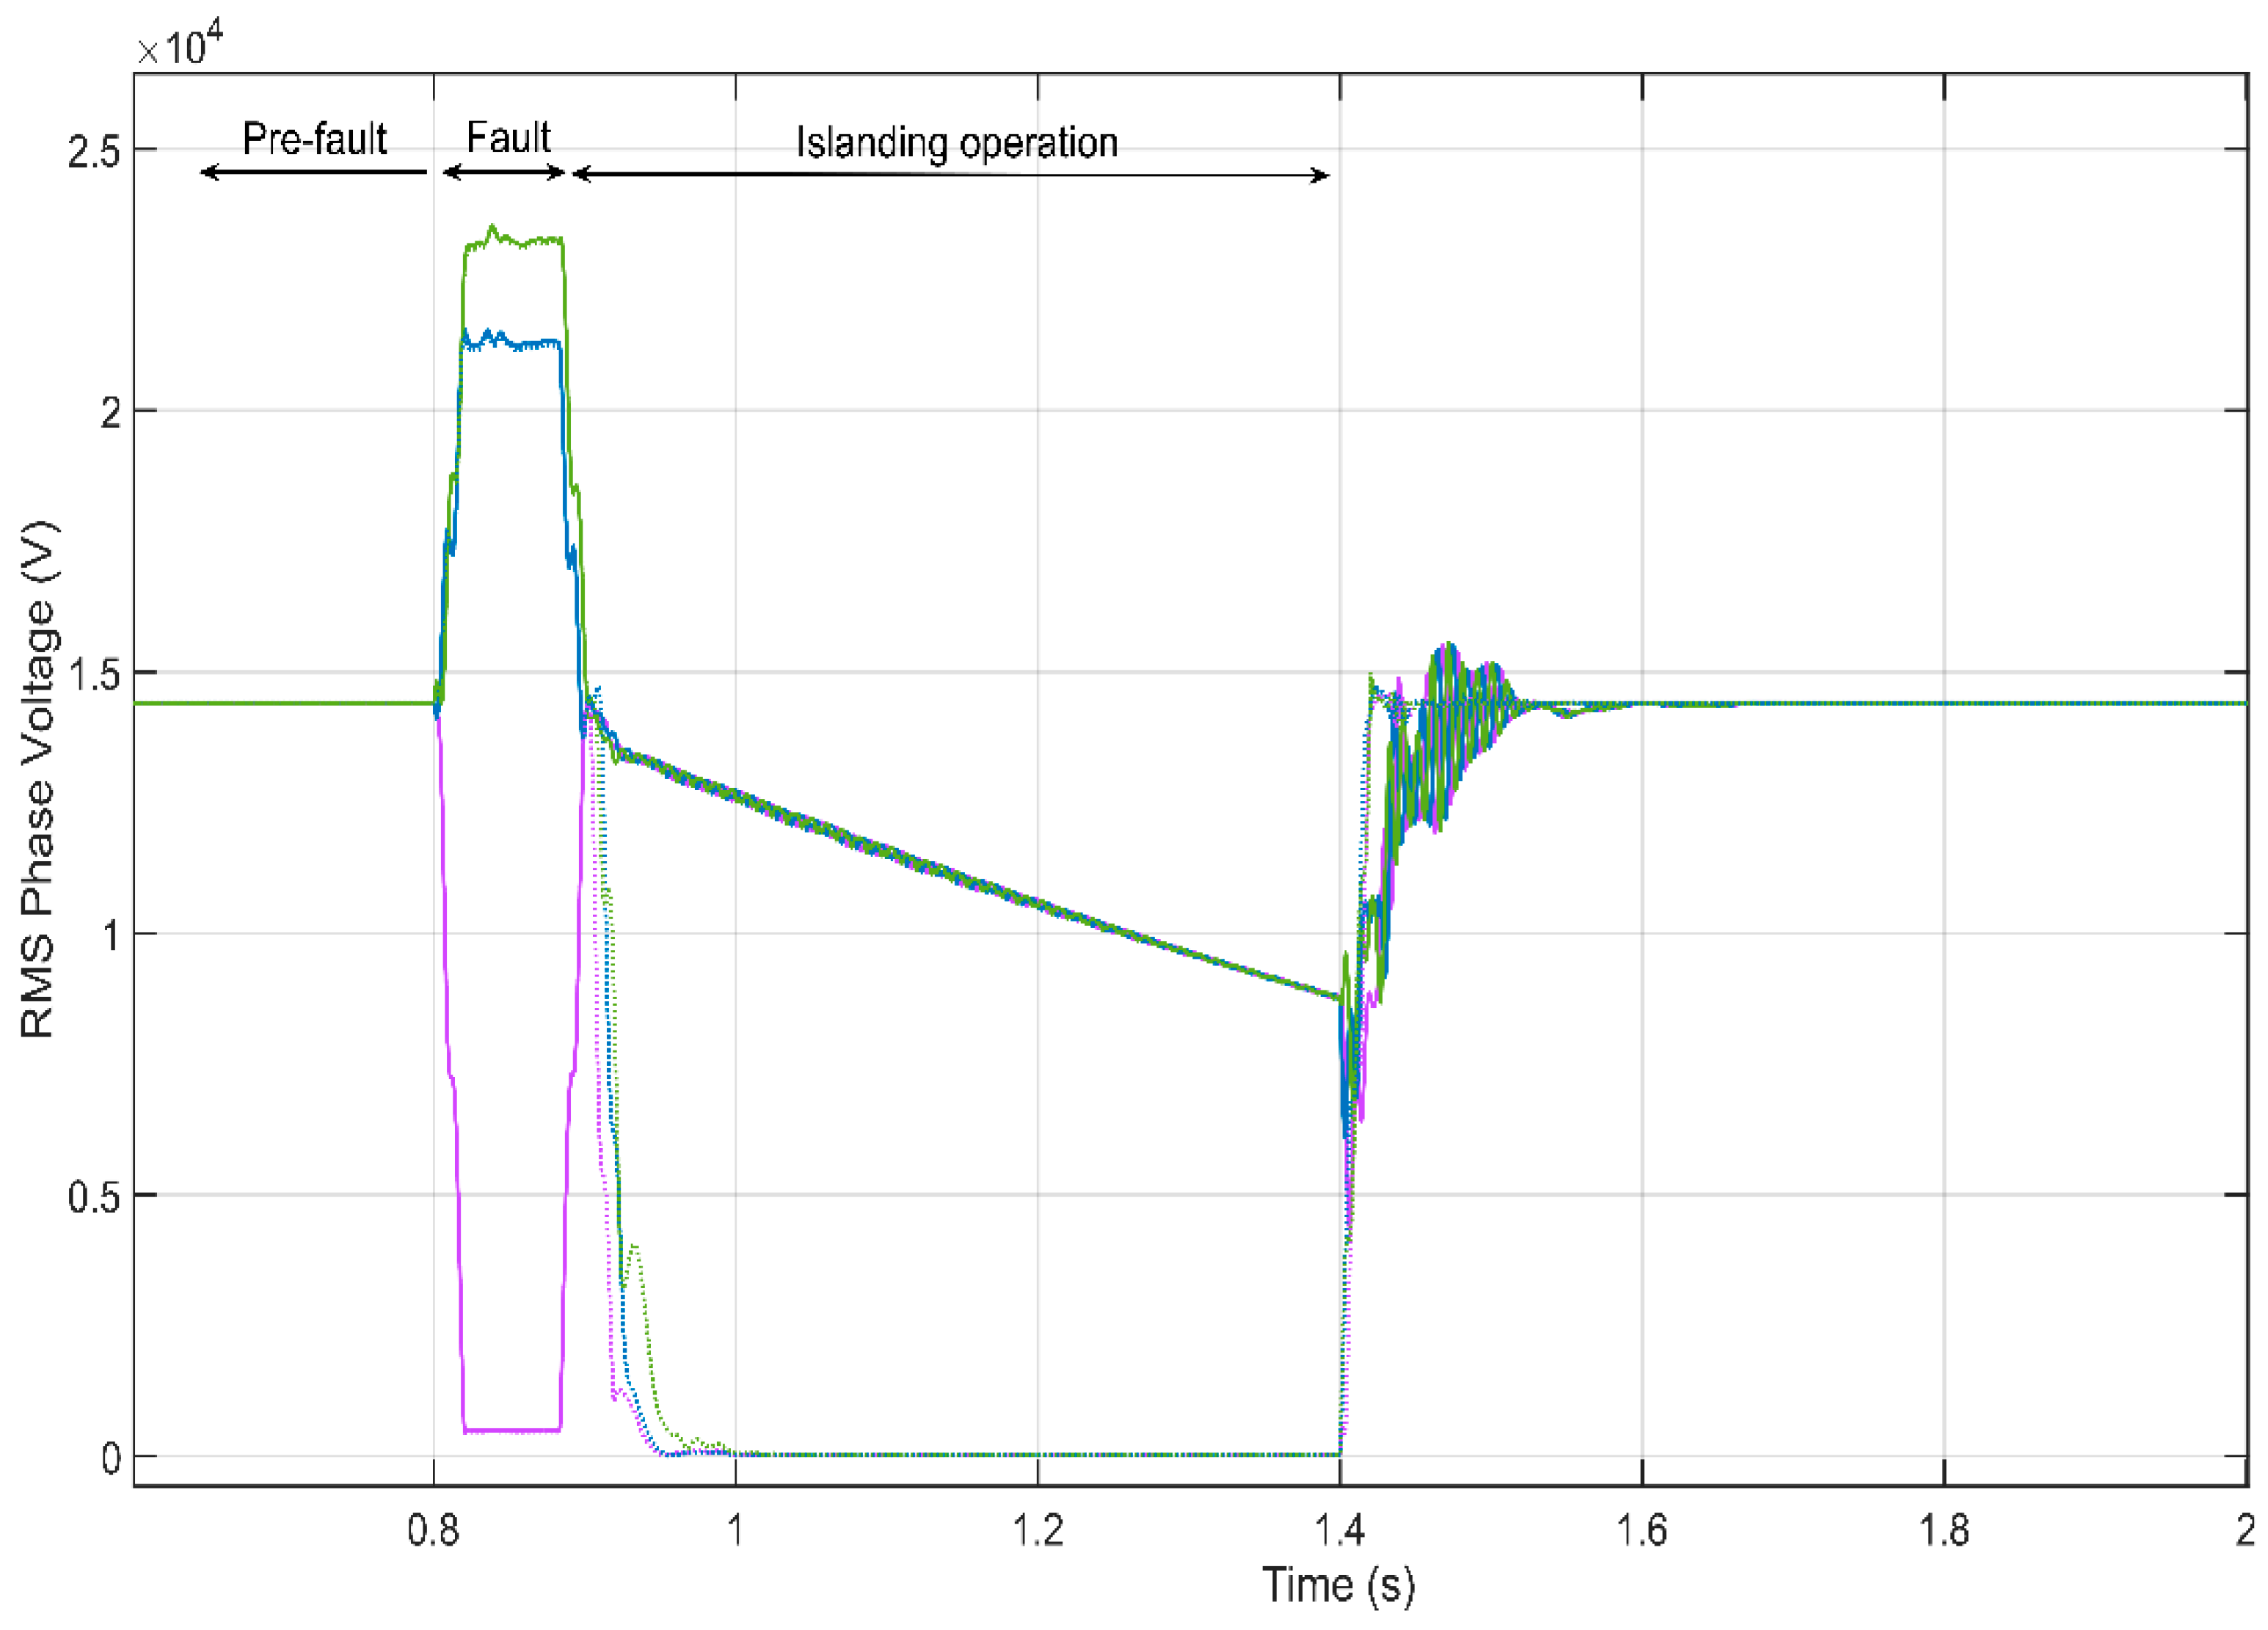
This section provides a brief overview of the islanding process prior to the model validation discussion. To emphasize the importance of this phenomenon, Figure 8 shows the simulated RMS values of the three-phase voltages of two scenarios; one scenario with IMs (solid lines) and another one replacing the IMs (dashed lines) with a static load of the same rated power. From the inspection of this figure, between the fault clearing (t = 0.9 s) and the CB reclosing (t = 1.4 s), one can observe that the IMs are energizing the isolated feeder A (See Figure 7) once its CB has opened. However, when the IMs are replaced with static loads, an interruption occurs, as expected.
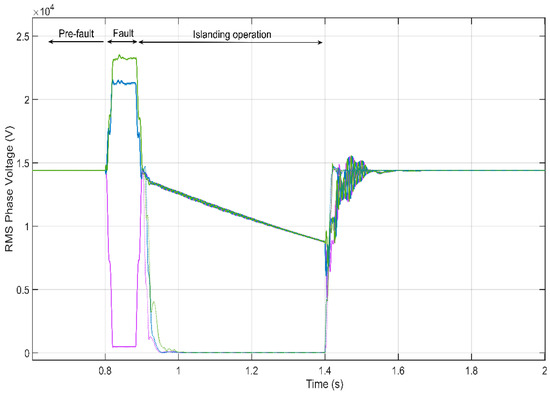
Figure 8.
Phase voltage comparison.
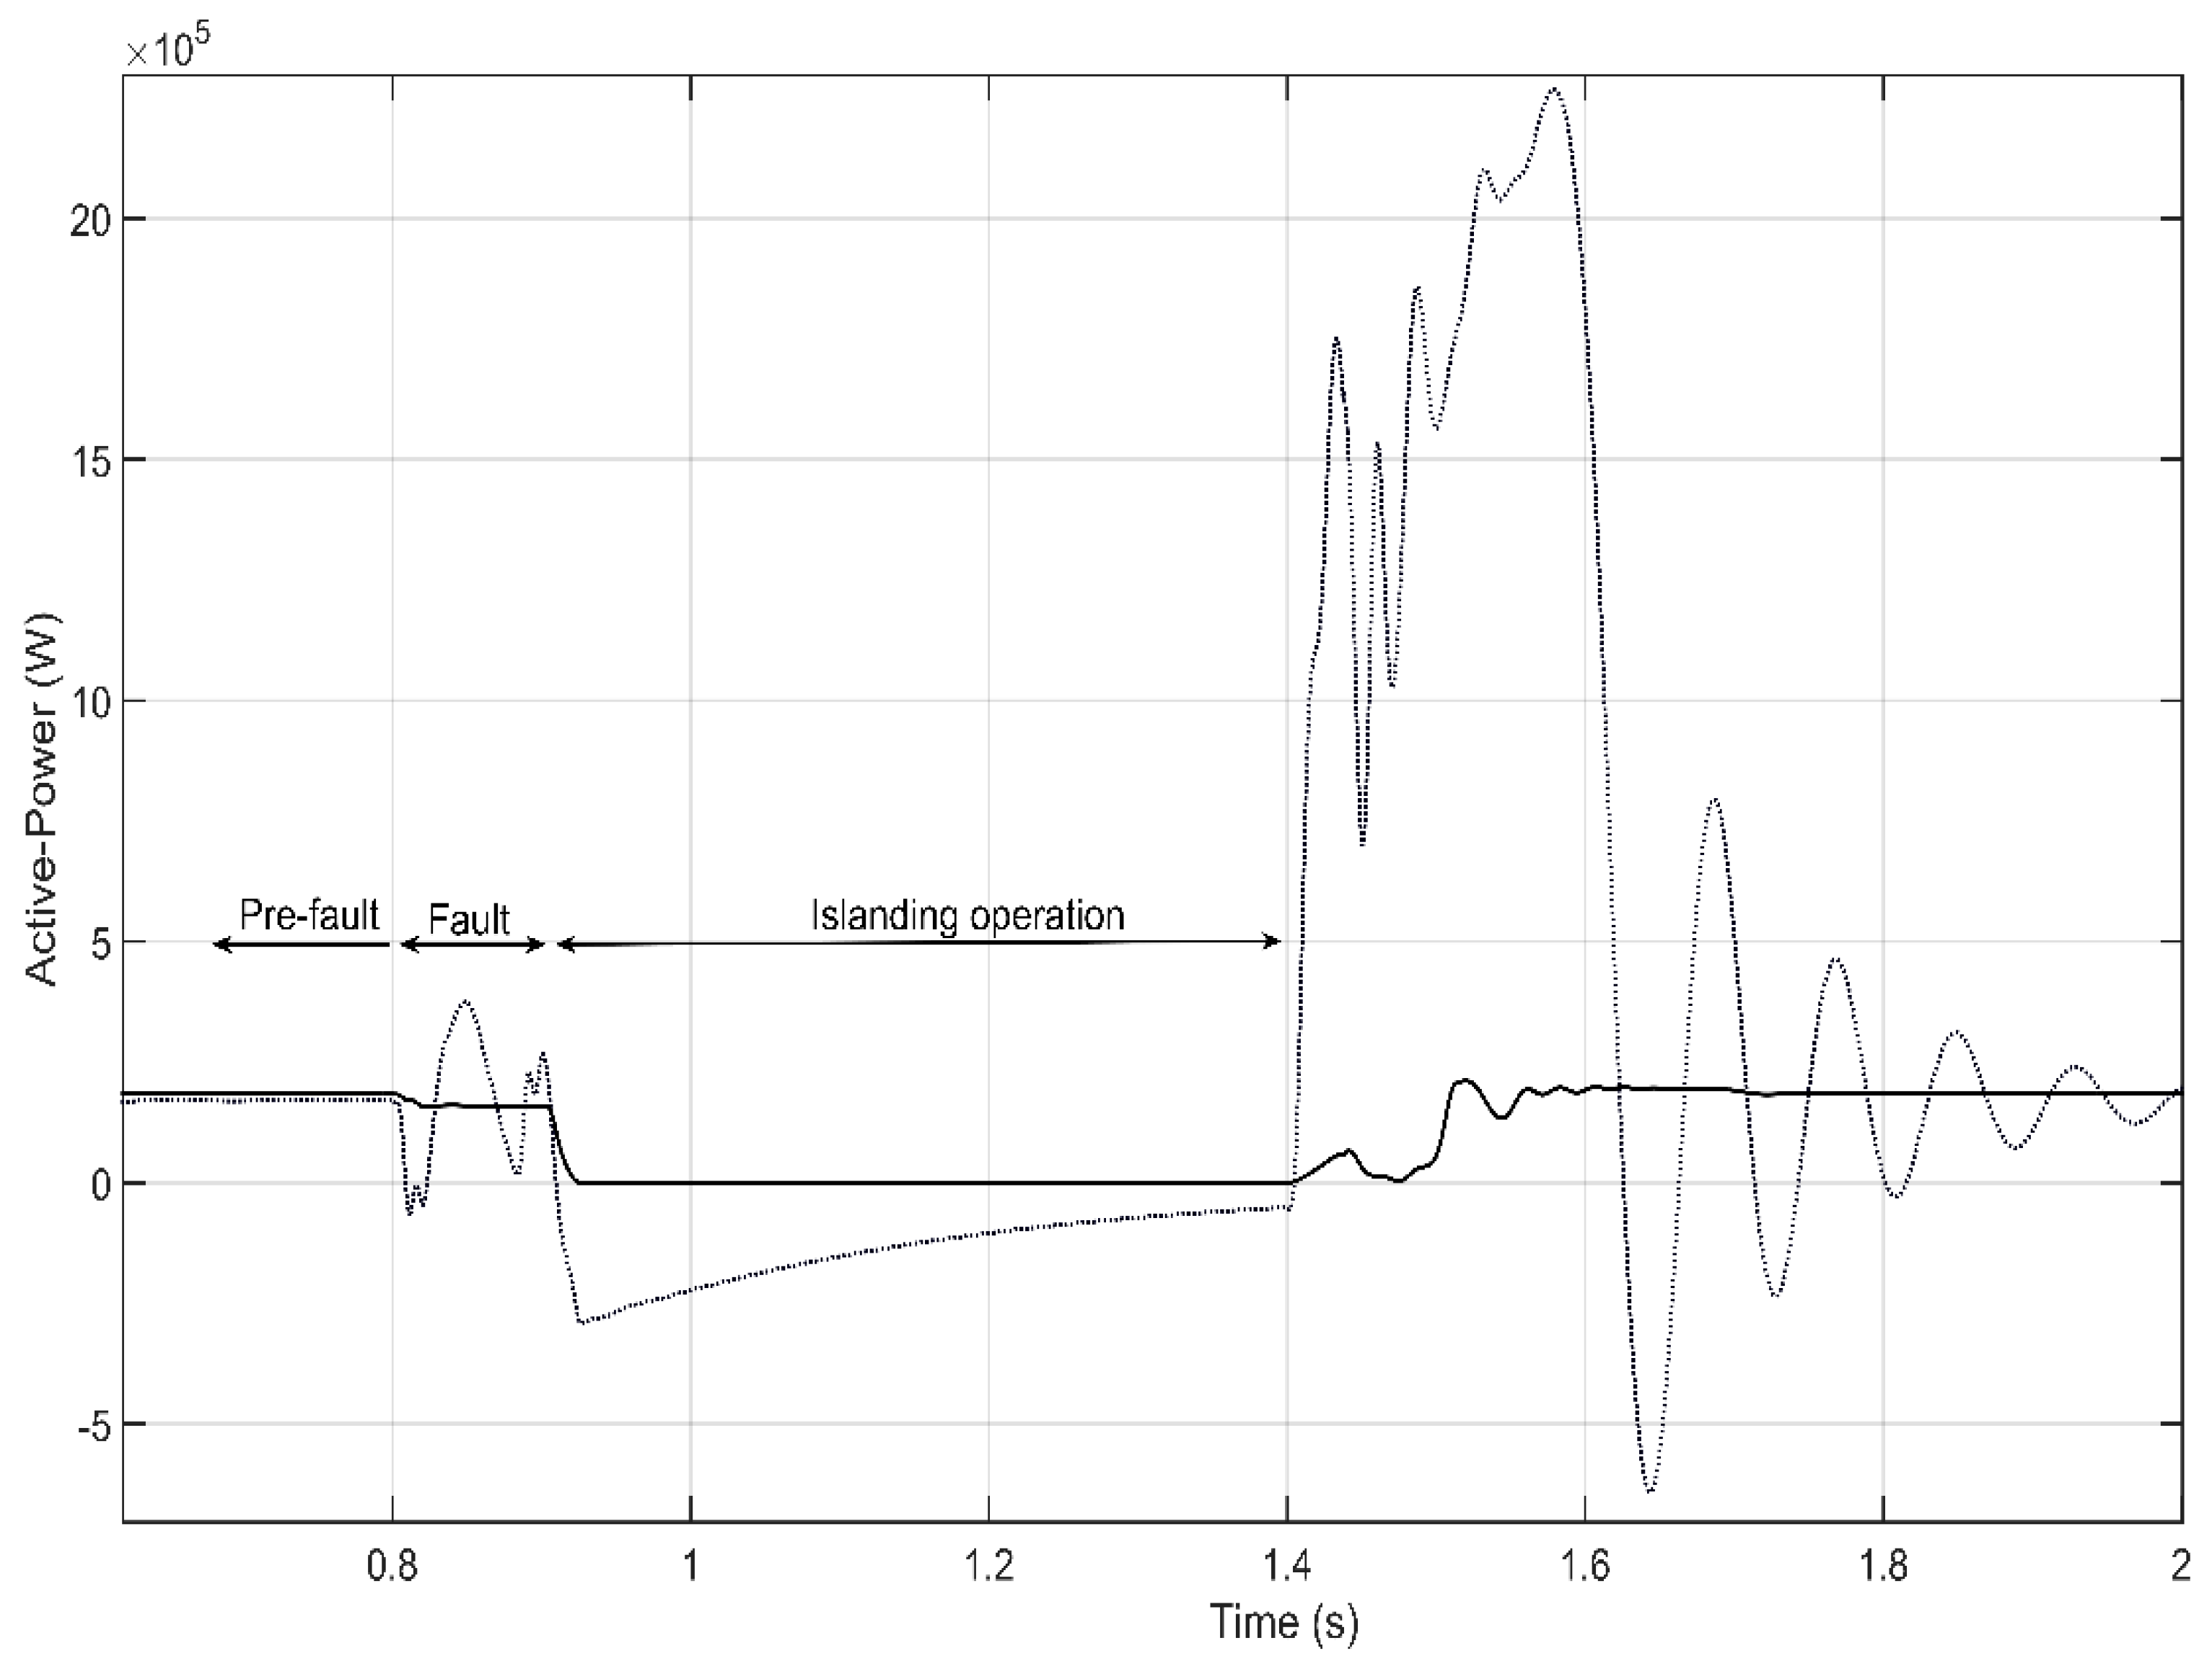
To provide more evidence that the IM is energizing the distribution network and acting as a generator, Figure 9 plots the active-power recorded at the PCC2 (see Figure 7) where the IM are connected. In this figure, it can be seen that, before the fault occurs (t = 0.8 s), the induction machine is acting as a motor (the measured active power is positive), but once the fault is cleared the power becomes negative, which demonstrates the fact that the IM is transiently acting as a generator.
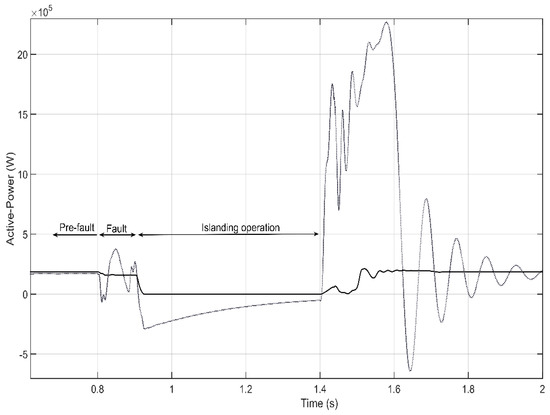
Figure 9.
Active-power comparison.
5.2. Dynamic Model Analysis during Islanding
In steady state, the machine is acting as a motor, so it is being supplied by the grid and running at a specific operation condition. This condition is defined by the mechanical speed and the torque. During normal operation, the IM electromagnetic torque equals the load torque. These conditions dictate the initial kinetic energy of the machine before the fault appears. When a fault occurs, the IM will decrease its speed depending on the voltage sag severity (i.e., magnitude and duration). Once the CB clears the fault, the machine is disconnected from the grid, and due to its stored kinetic energy, transiently acts as generator. Therefore, one initial condition to assess the IO is the pre-islanding kinetic energy,
where EKin_initial is the initial kinetic energy prior to the CB opening, JT the total moment of inertia (considering the rotor inertia and mechanical load), and ωpre_islanding is the mechanical speed before the island is formed.
Following the CB opening, due to the lack of supply, the equilibrium between torques is broken, the IM speed derivative becomes negative and, therefore, only the dynamic torque (due to the non-zero derivative of the rotor speed) drives the machine. During islanding, the electromagnetic torque Γem is set to zero, and (6) can be rewritten:
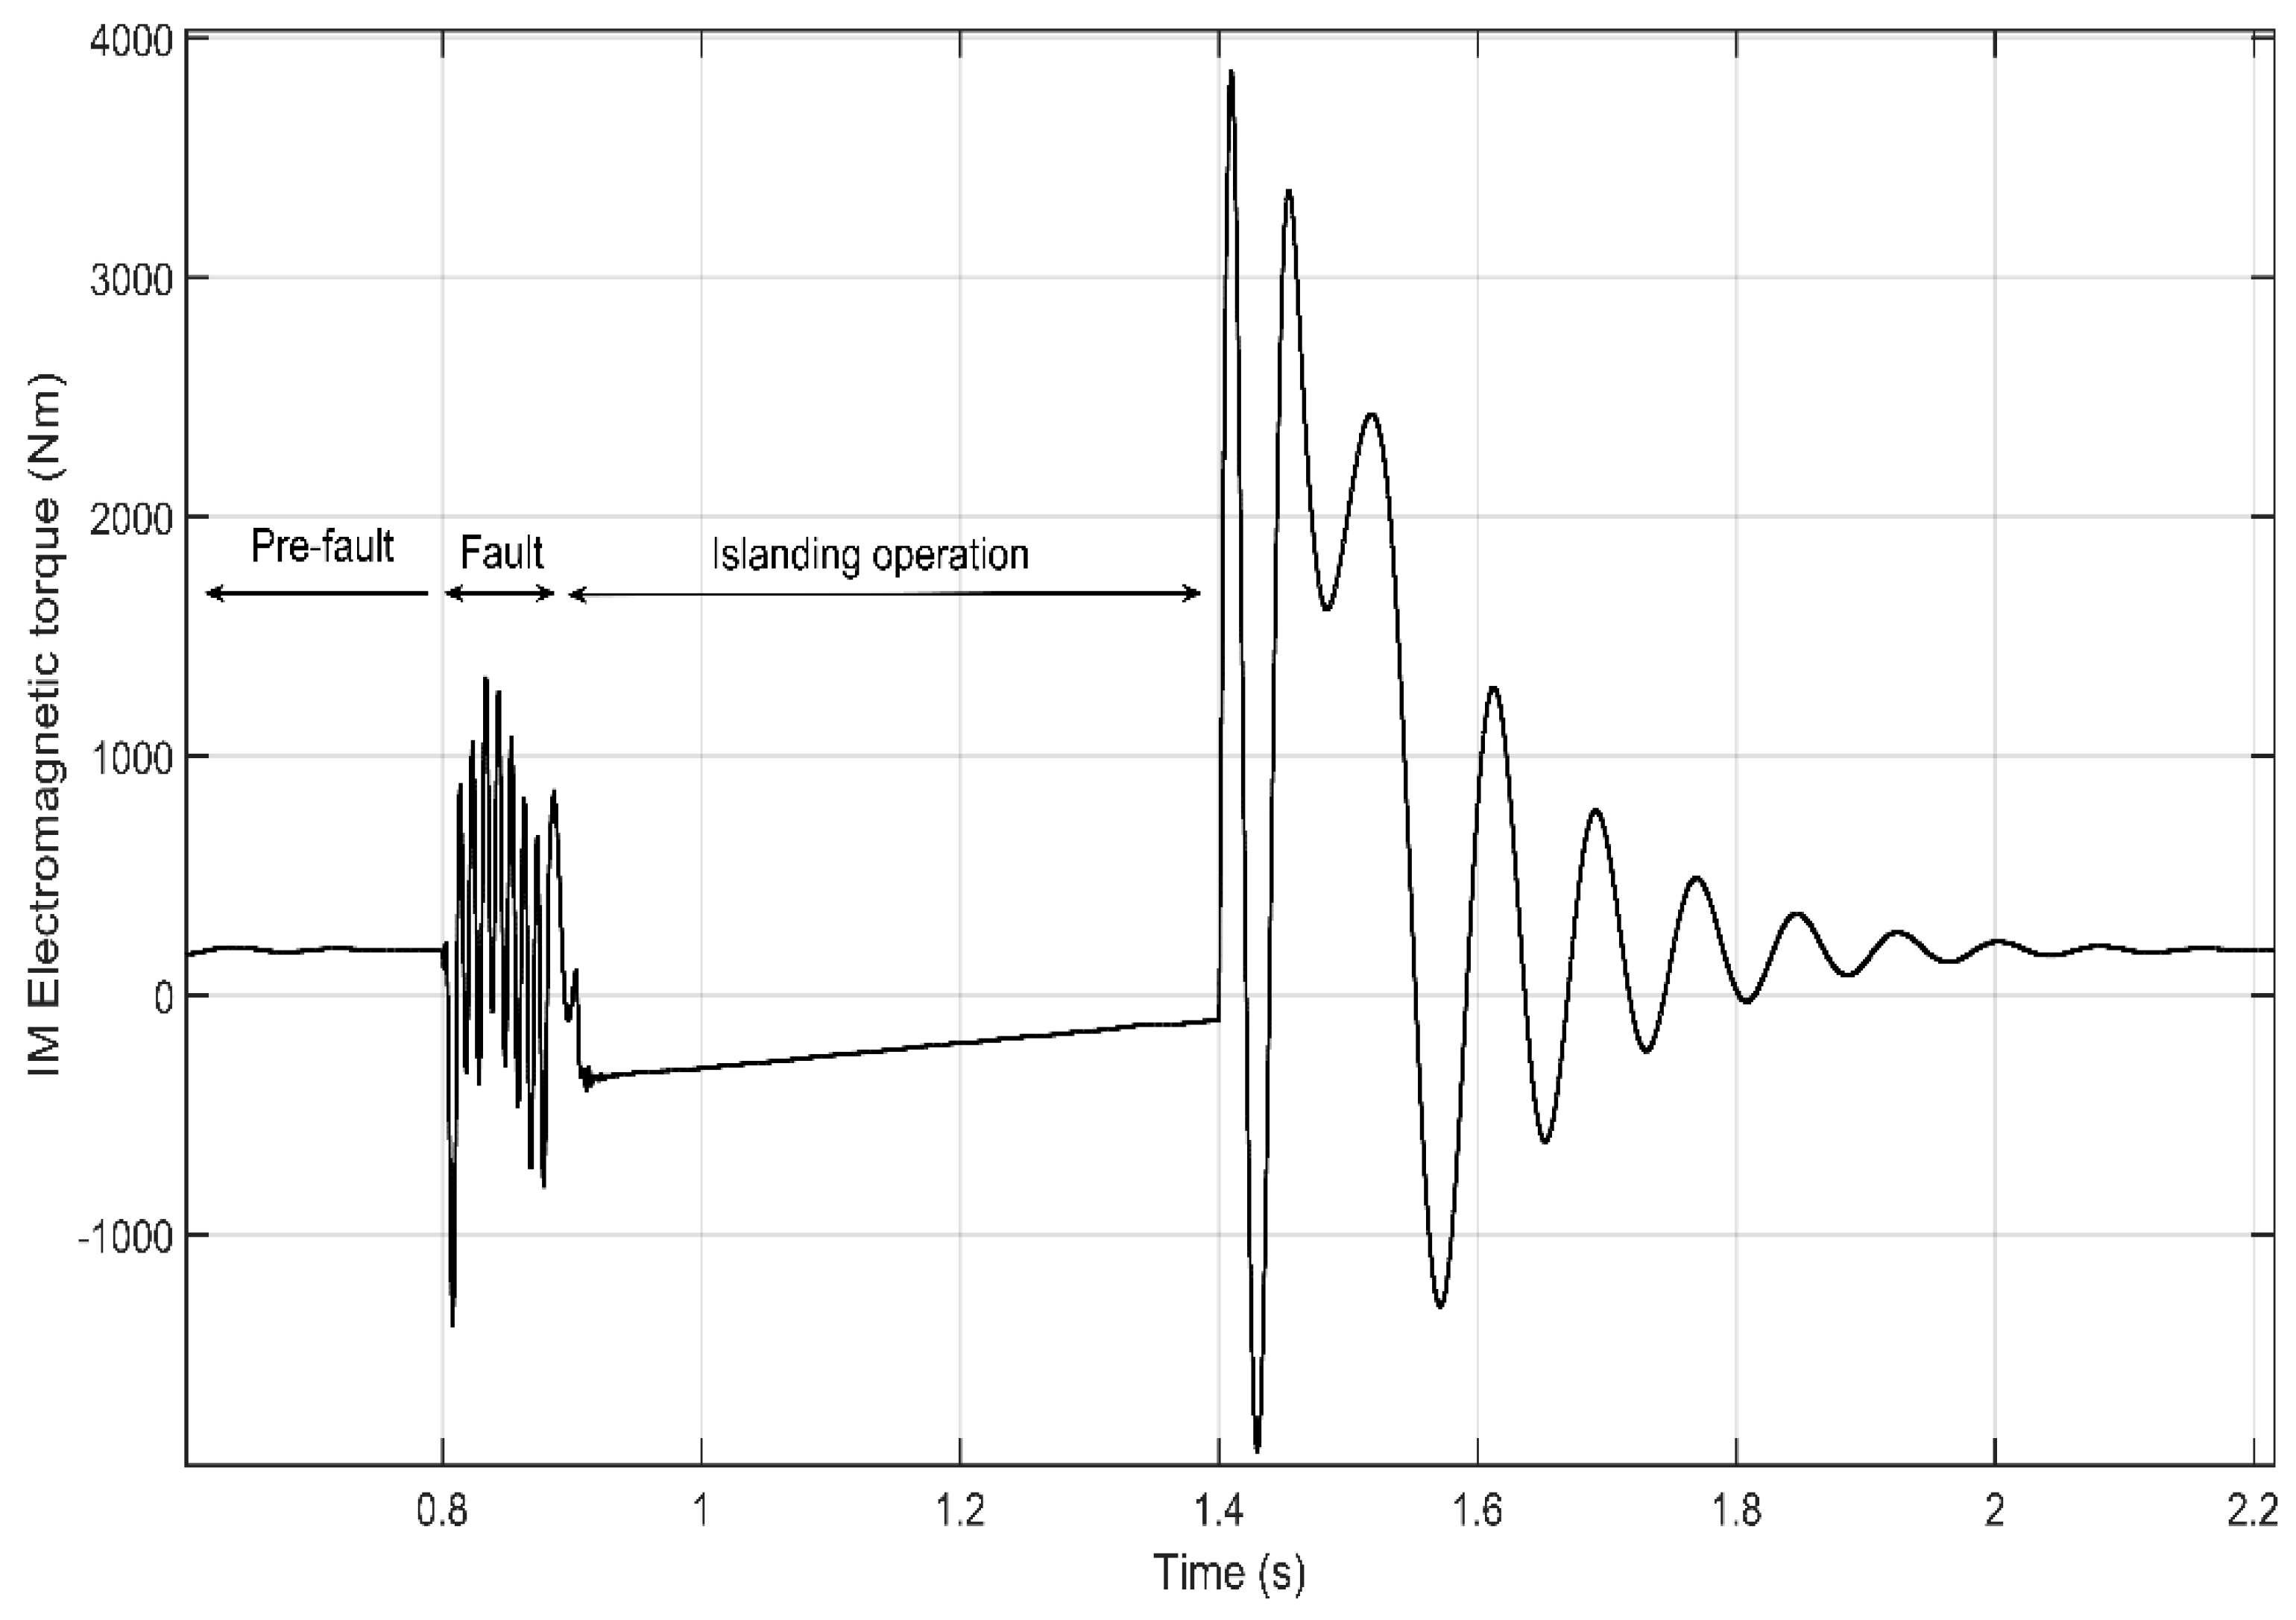
Before the fault, the electromagnetic torque of the IM acting as a motor is by convention positive. This can be observed before the fault occurs (before t = 0.8 s) in Figure 10. During the fault, the torque is not constant (between t = 0.8 s and t= 0.9 s). Once the main CB has opened (at t = 0.9 s), the dynamic torque drives the machine; its speed derivative and electromagnetic torque are both negative when acting as generator (between t = 0.9 s and t = 1.4 s). Note that the high torque that occurs once the CB recloses (t = 1.4 s) is mostly due to the out-of-phase reclosing. This reclosing transient can be more or less severe depending on the voltage amplitude and frequency difference between sources (i.e., the main grid and the IM acting as a generator).
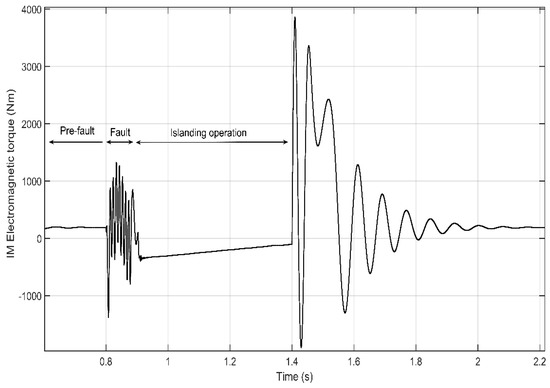
Figure 10.
Electromagnetic torque developed by the IM.
If the IM is the only rotating machine that remains within the island following CB operation, assuming that it is under no-load torque (i.e., that there is no mechanical load coupled to the rotor shaft) and considering that there is no damping effect while acting as generators, the balance during the island condition is given by,
where ωim is the IM angular speed, ωim0 is IM initial angular speed, δim is the IM rotor angle, PmIM is the mechanical power developed by the IM when acting as a generator, Peload is the power drawn by the feeder loads, and Him is the inertia constant of the IM, expressed in seconds. In fact, the amount of feeder loads that remain within the island, represent a load torque for the IM when acting as a generator.
The variation of the IM rotor angle during the island period (i.e., between ti and tf) is related to the frequency as follows,
where fisland is the frequency during the island. As has been mentioned, load voltage dependence has been considered. If the term Peload includes constant impedance, constant power and constant current load models, electrical powers are divided into P1 which is assumed to be the sum of all constant impedance loads, P2 the sum of all constant current loads and P3 are the sum of all static constant power loads within the island. Thus, it follows that,
where ΔV represents the voltage variation, P1, P2, P3 are the sum of all constant impedance, constant current and constant power considering n LV nodes, which are computed as follows:
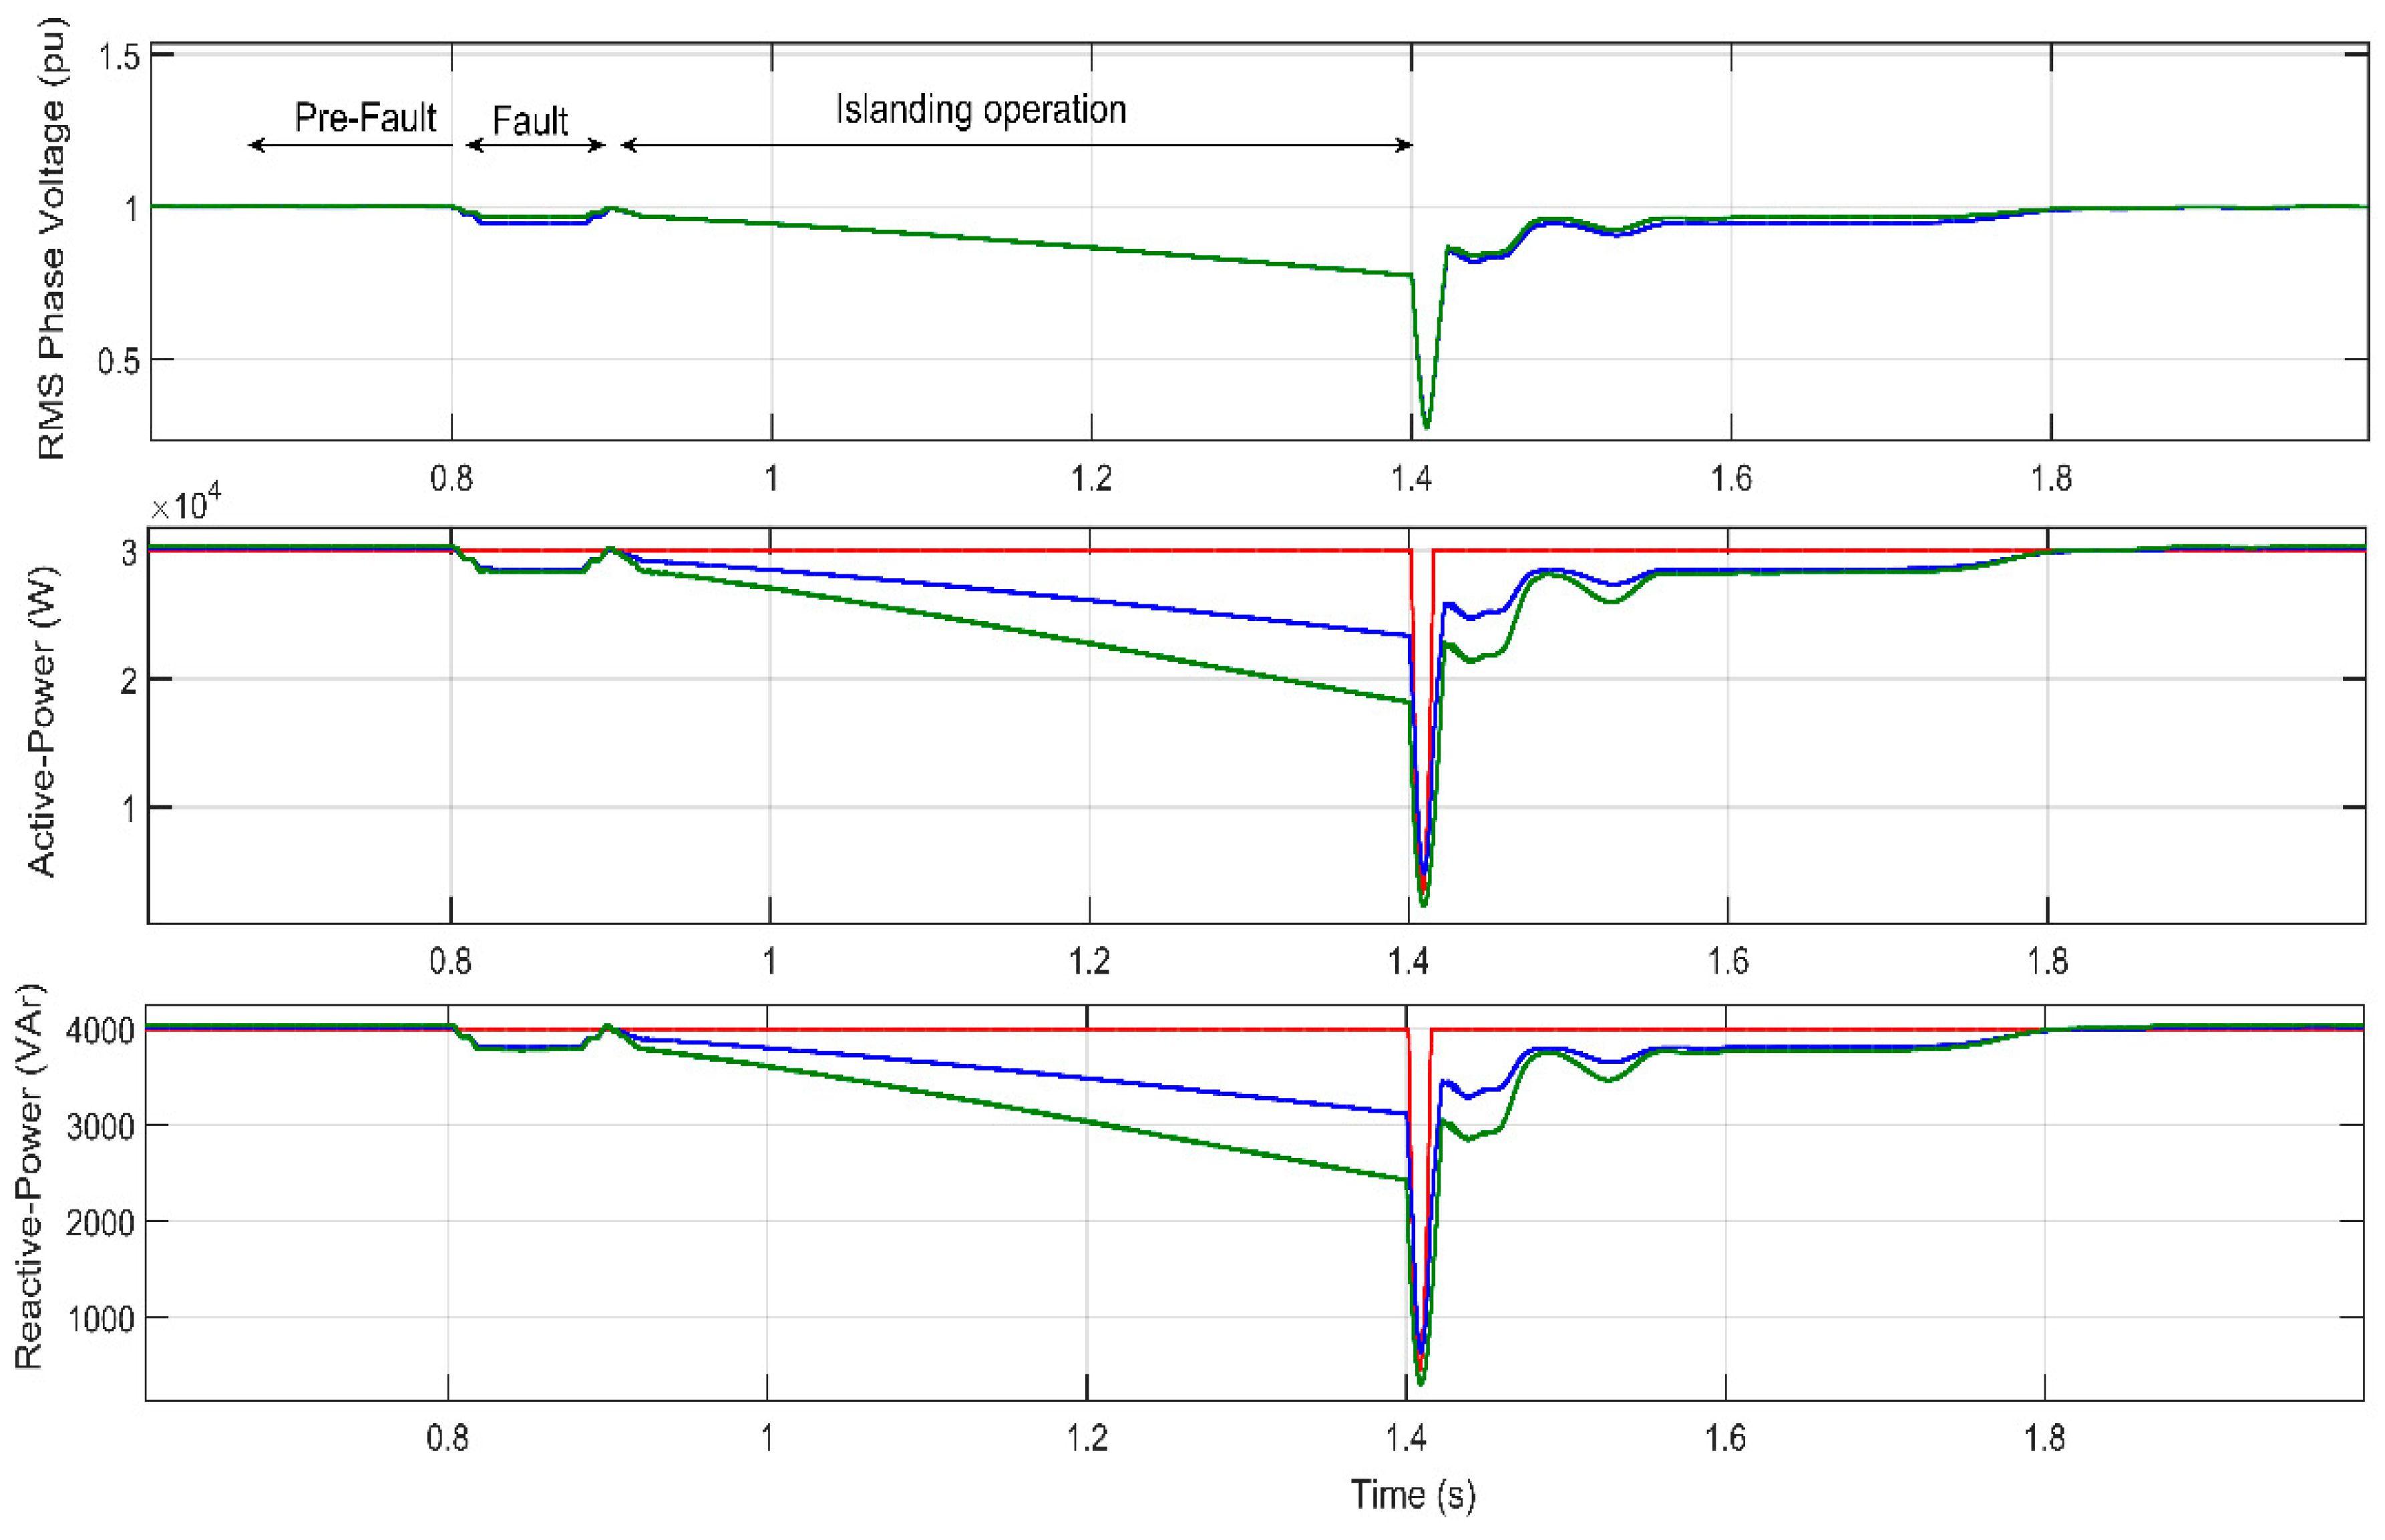
Figure 11 shows the response of the three mentioned load models during the simulation. The first plot shows the RMS voltage in pu. It is relevant to note that during the SLG fault (between t = 0.8 s and t = 0.9 s), the constant current and constant impedance loads reduce its active and reactive power consumed, due to the unbalanced voltage sag experienced by the IM.
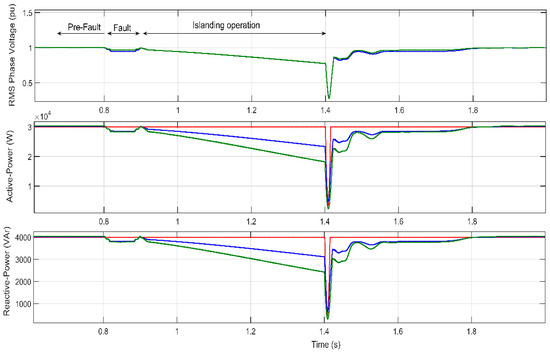
Figure 11.
RMS voltage, active and reactive-powers for each load model-Constant Power = Red line, Constant Current = Blue line; Constant Impedance = Green line.
By observing the first plot during the fault and the post-islanding recovery, a small difference is seen in the voltage. This difference is due to the impedance between the two MV buses. As expected, due to the low voltage drop in steady-state, before the fault and during islanding, the voltage is practically the same.
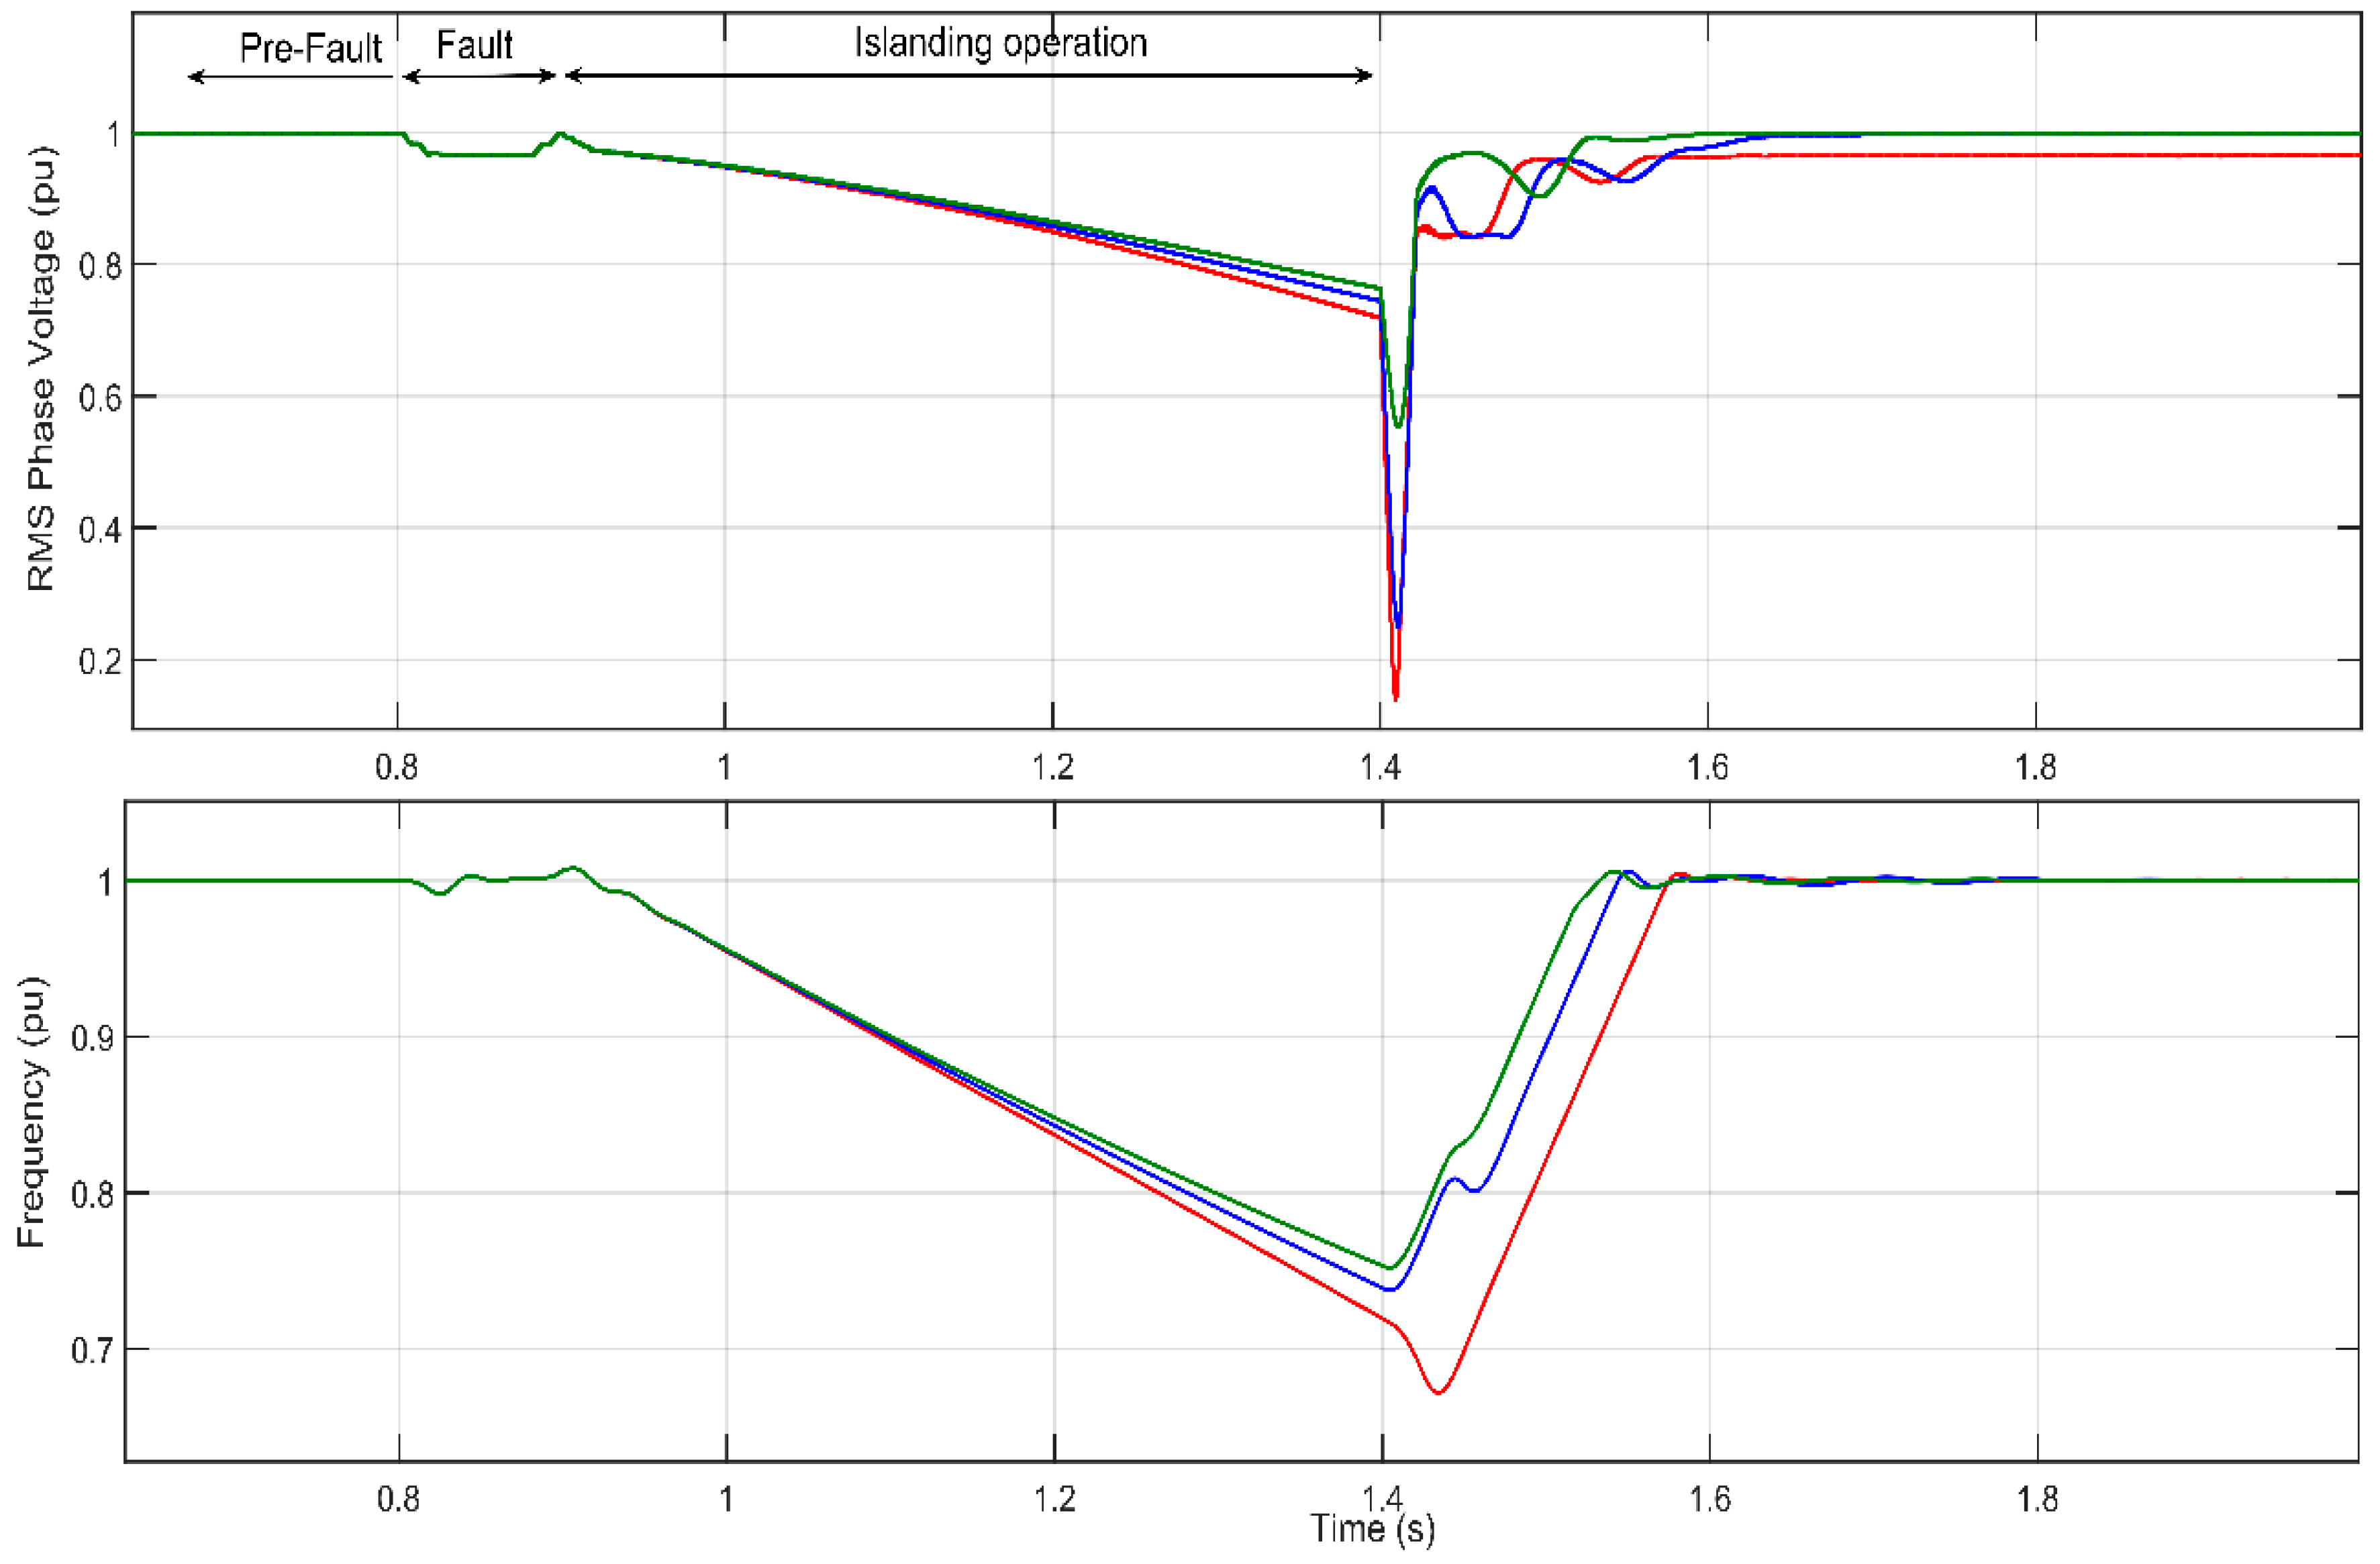
To reflect the effect of such models, Figure 12 shows the difference between three scenarios: (i) Constant power loads, (ii) constant current loads and, (iii) constant impedance loads. From this figure, it is evident that voltage and frequency deviations depend on the selected load model. Thus, the constant impedance model has the most significant power curtailment, so it causes the smallest IM deceleration, which in turn, results in a greater voltage and frequency value. On the contrary, the constant power model causes the largest IM deceleration and larger voltage and frequency deviations.
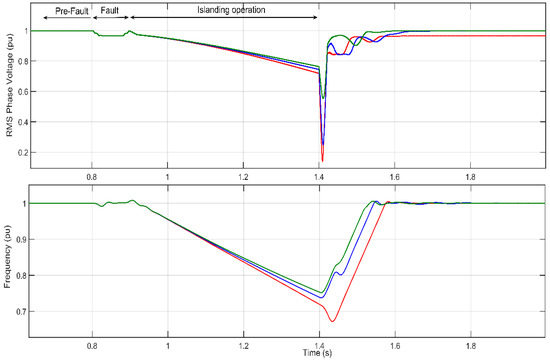
Figure 12.
Frequency and voltage comparison between scenarios with different load models-Constant Power = Red line, Constant Current = Blue line; Constant Impedance = Green line.
6. Model Validation
This section compares the field measurements presented in Section 3 and the simulation results derived from the test system model implemented in MATLAB/Simulink. The three events presented in Section 3 are simulated and analyzed.
6.1. Event 1
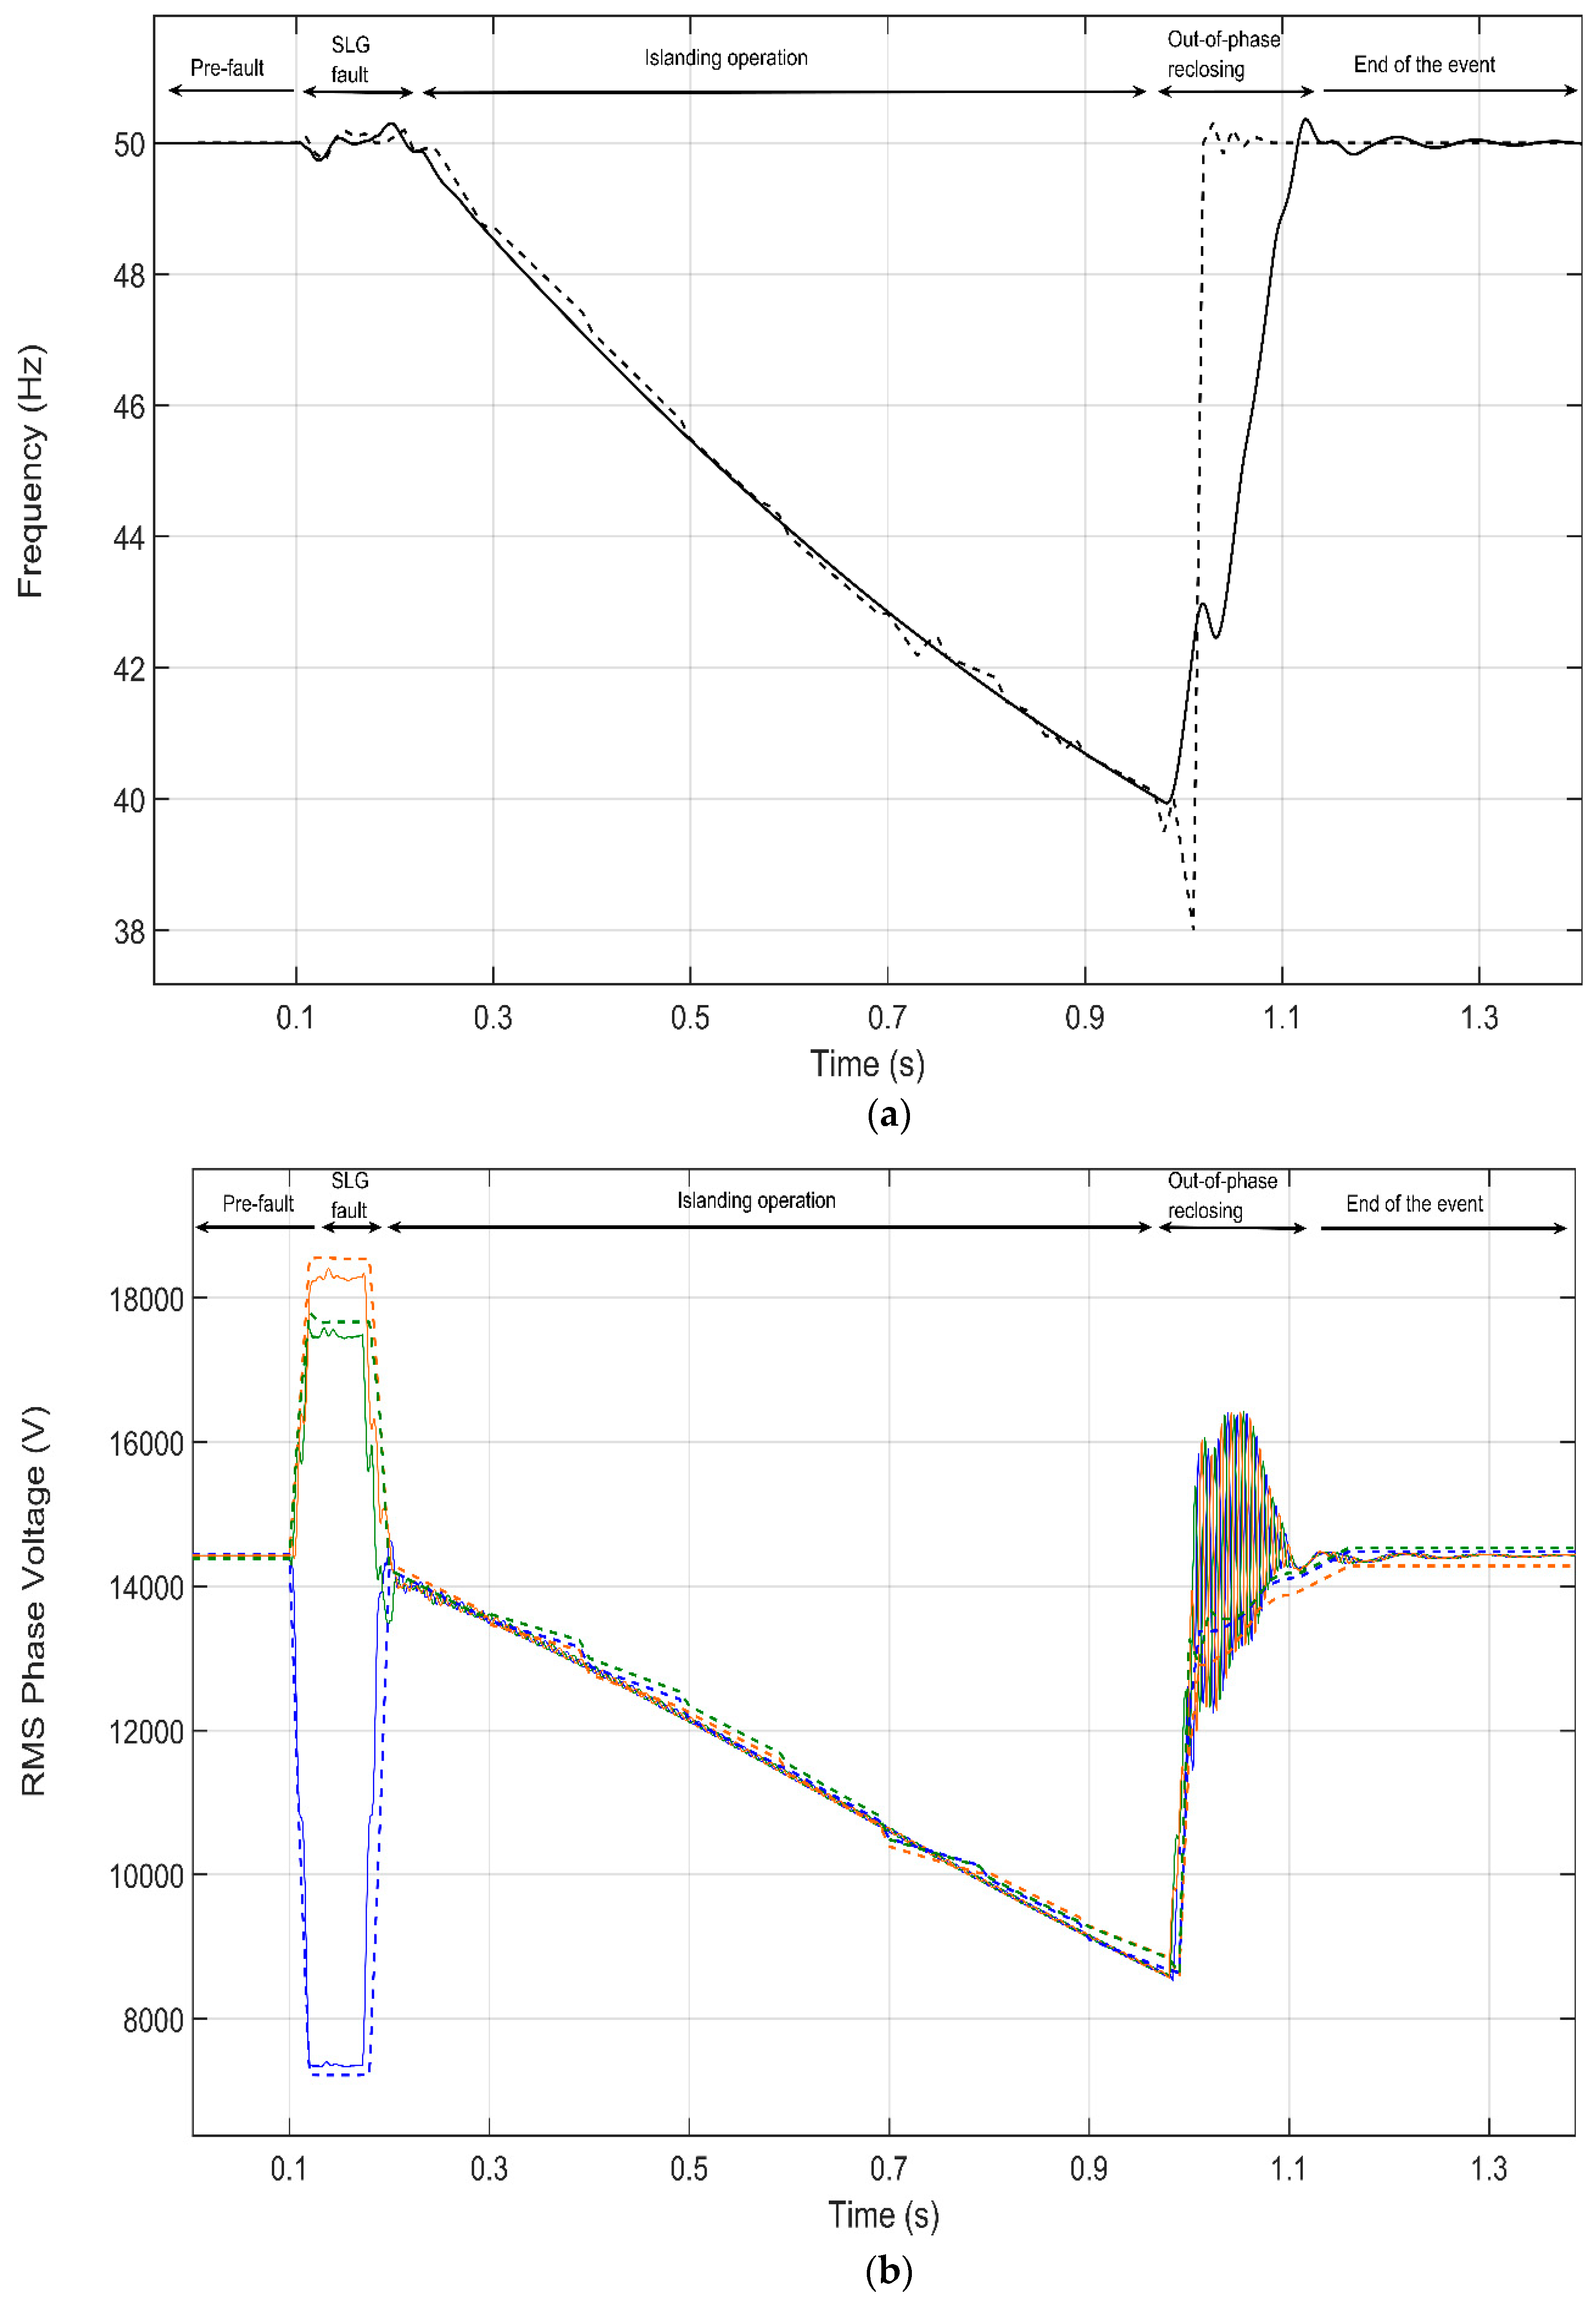
Frequency: Figure 13a displays the frequency value; its oscillation demonstrates that the adopted model approaches satisfactorily the field measurement. At the reclosing time, the frequency is 40 Hz. The pre-fault active-power of the Feeder A loads is 520 kW.
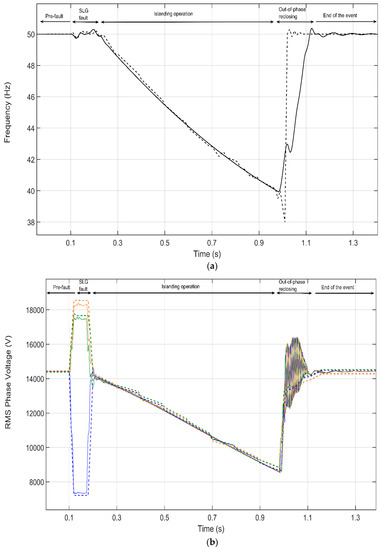
Figure 13.
Event 1 validation. (a) Frequency comparison, dashed-black (measurement), solid-black (simulation); (b) RMS Phase voltage comparison, solid (simulation)/dashed (measurements), orange (Phase A), blue (Phase B), and green (Phase C).
Voltage: Figure 13b compares the three-phase voltages: The simulation results are depicted in solid lines whilst field measurements are in dashed lines. The event starts in pre-fault conditions until the single line-to-ground (SLG) fault occurs in phase b at 0.1 s and it is cleared within 90 ms. Afterwards, the islanding operation takes place during 810 ms, while the voltage at the end of the event, that is, when the head CB takes place, reaches 8.58 kV in both simulation and measurements.
6.2. Event 2
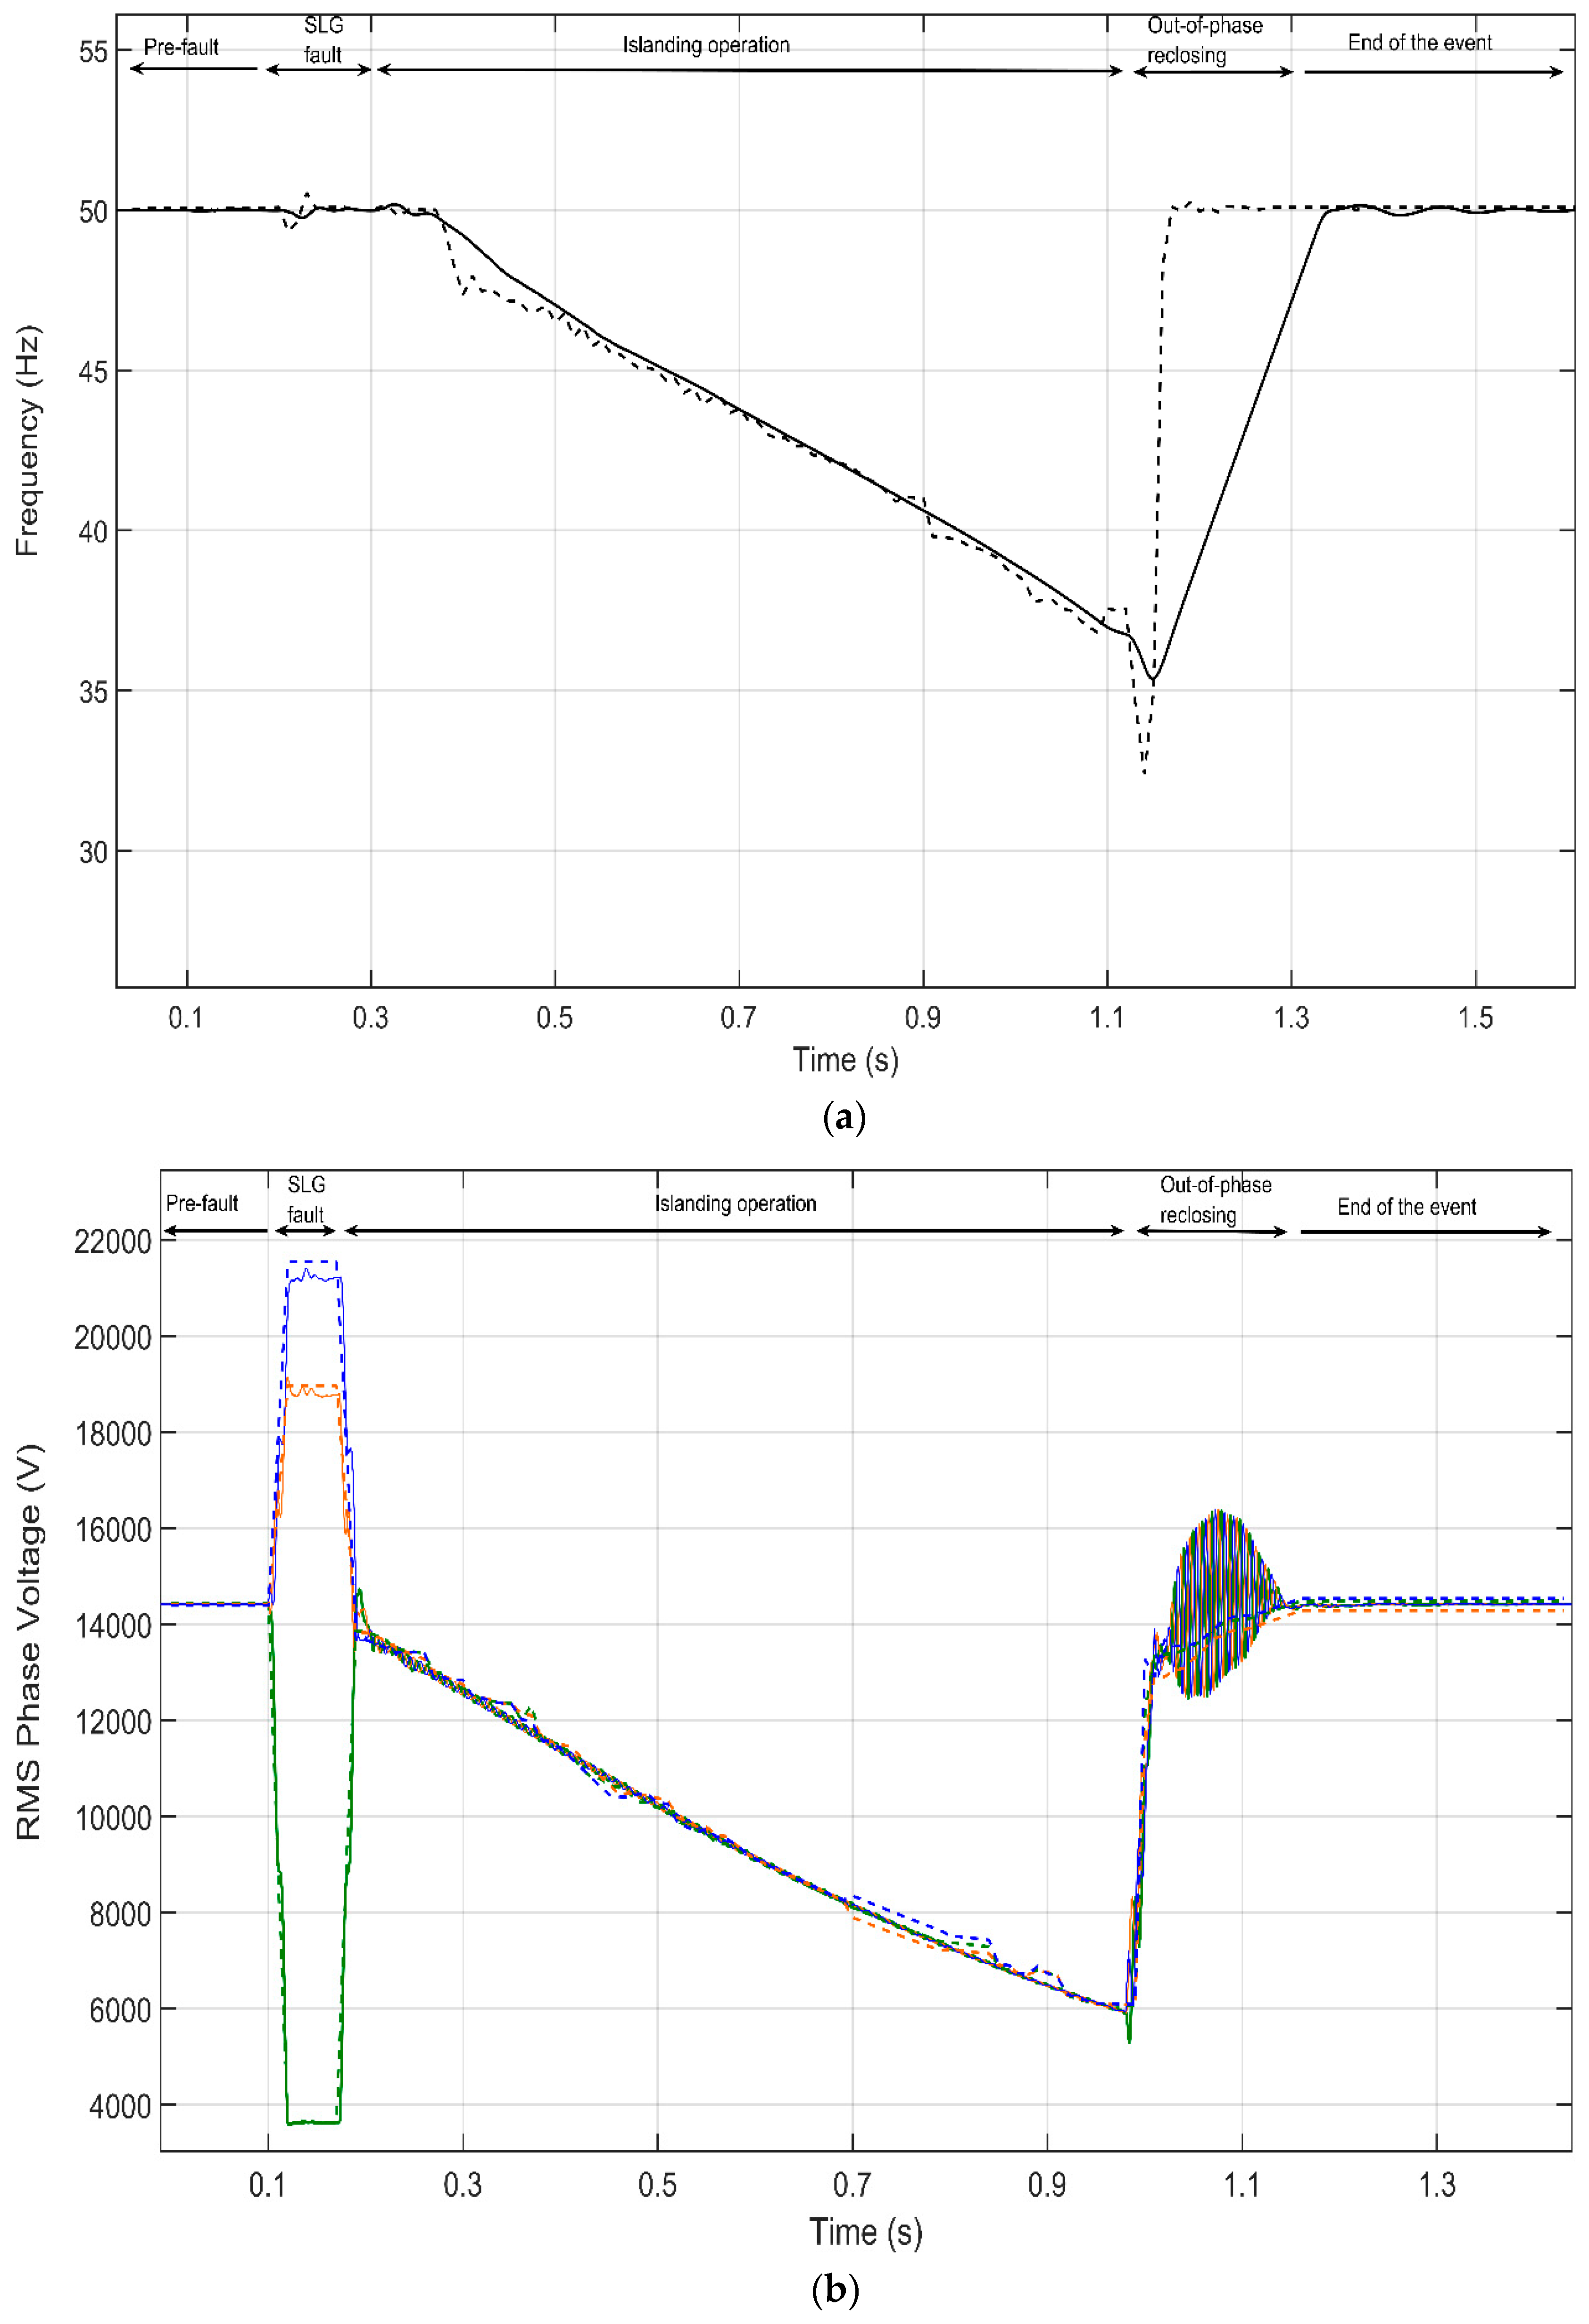
Frequency:Figure 14a displays the frequency; its variation demonstrates that the adopted model approaches satisfactorily the field measurement. At the reclosing time, the frequency is 36.5 Hz. The pre-fault active-power of the Feeder A loads was 770 kW.
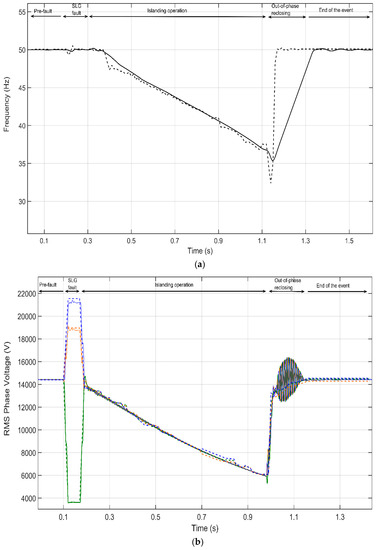
Figure 14.
Event 2 validation. (a) Frequency comparison, dashed-black (measurement), solid-black (simulation); (b) RMS Phase voltage comparison, solid (simulation)/dashed (measurements), orange (Phase A), blue (Phase B), and green (Phase C).
Voltage: Figure 14b compares the three-phase voltages. The event starts at 0.1 s, the SLG that occurs in phase c is cleared within 88 ms, and the event ending takes place at 1 s with a voltage of 6 kV; such value is lower than in Event 1 due to the higher feeder loads when the fault occurs.
6.3. Event 3
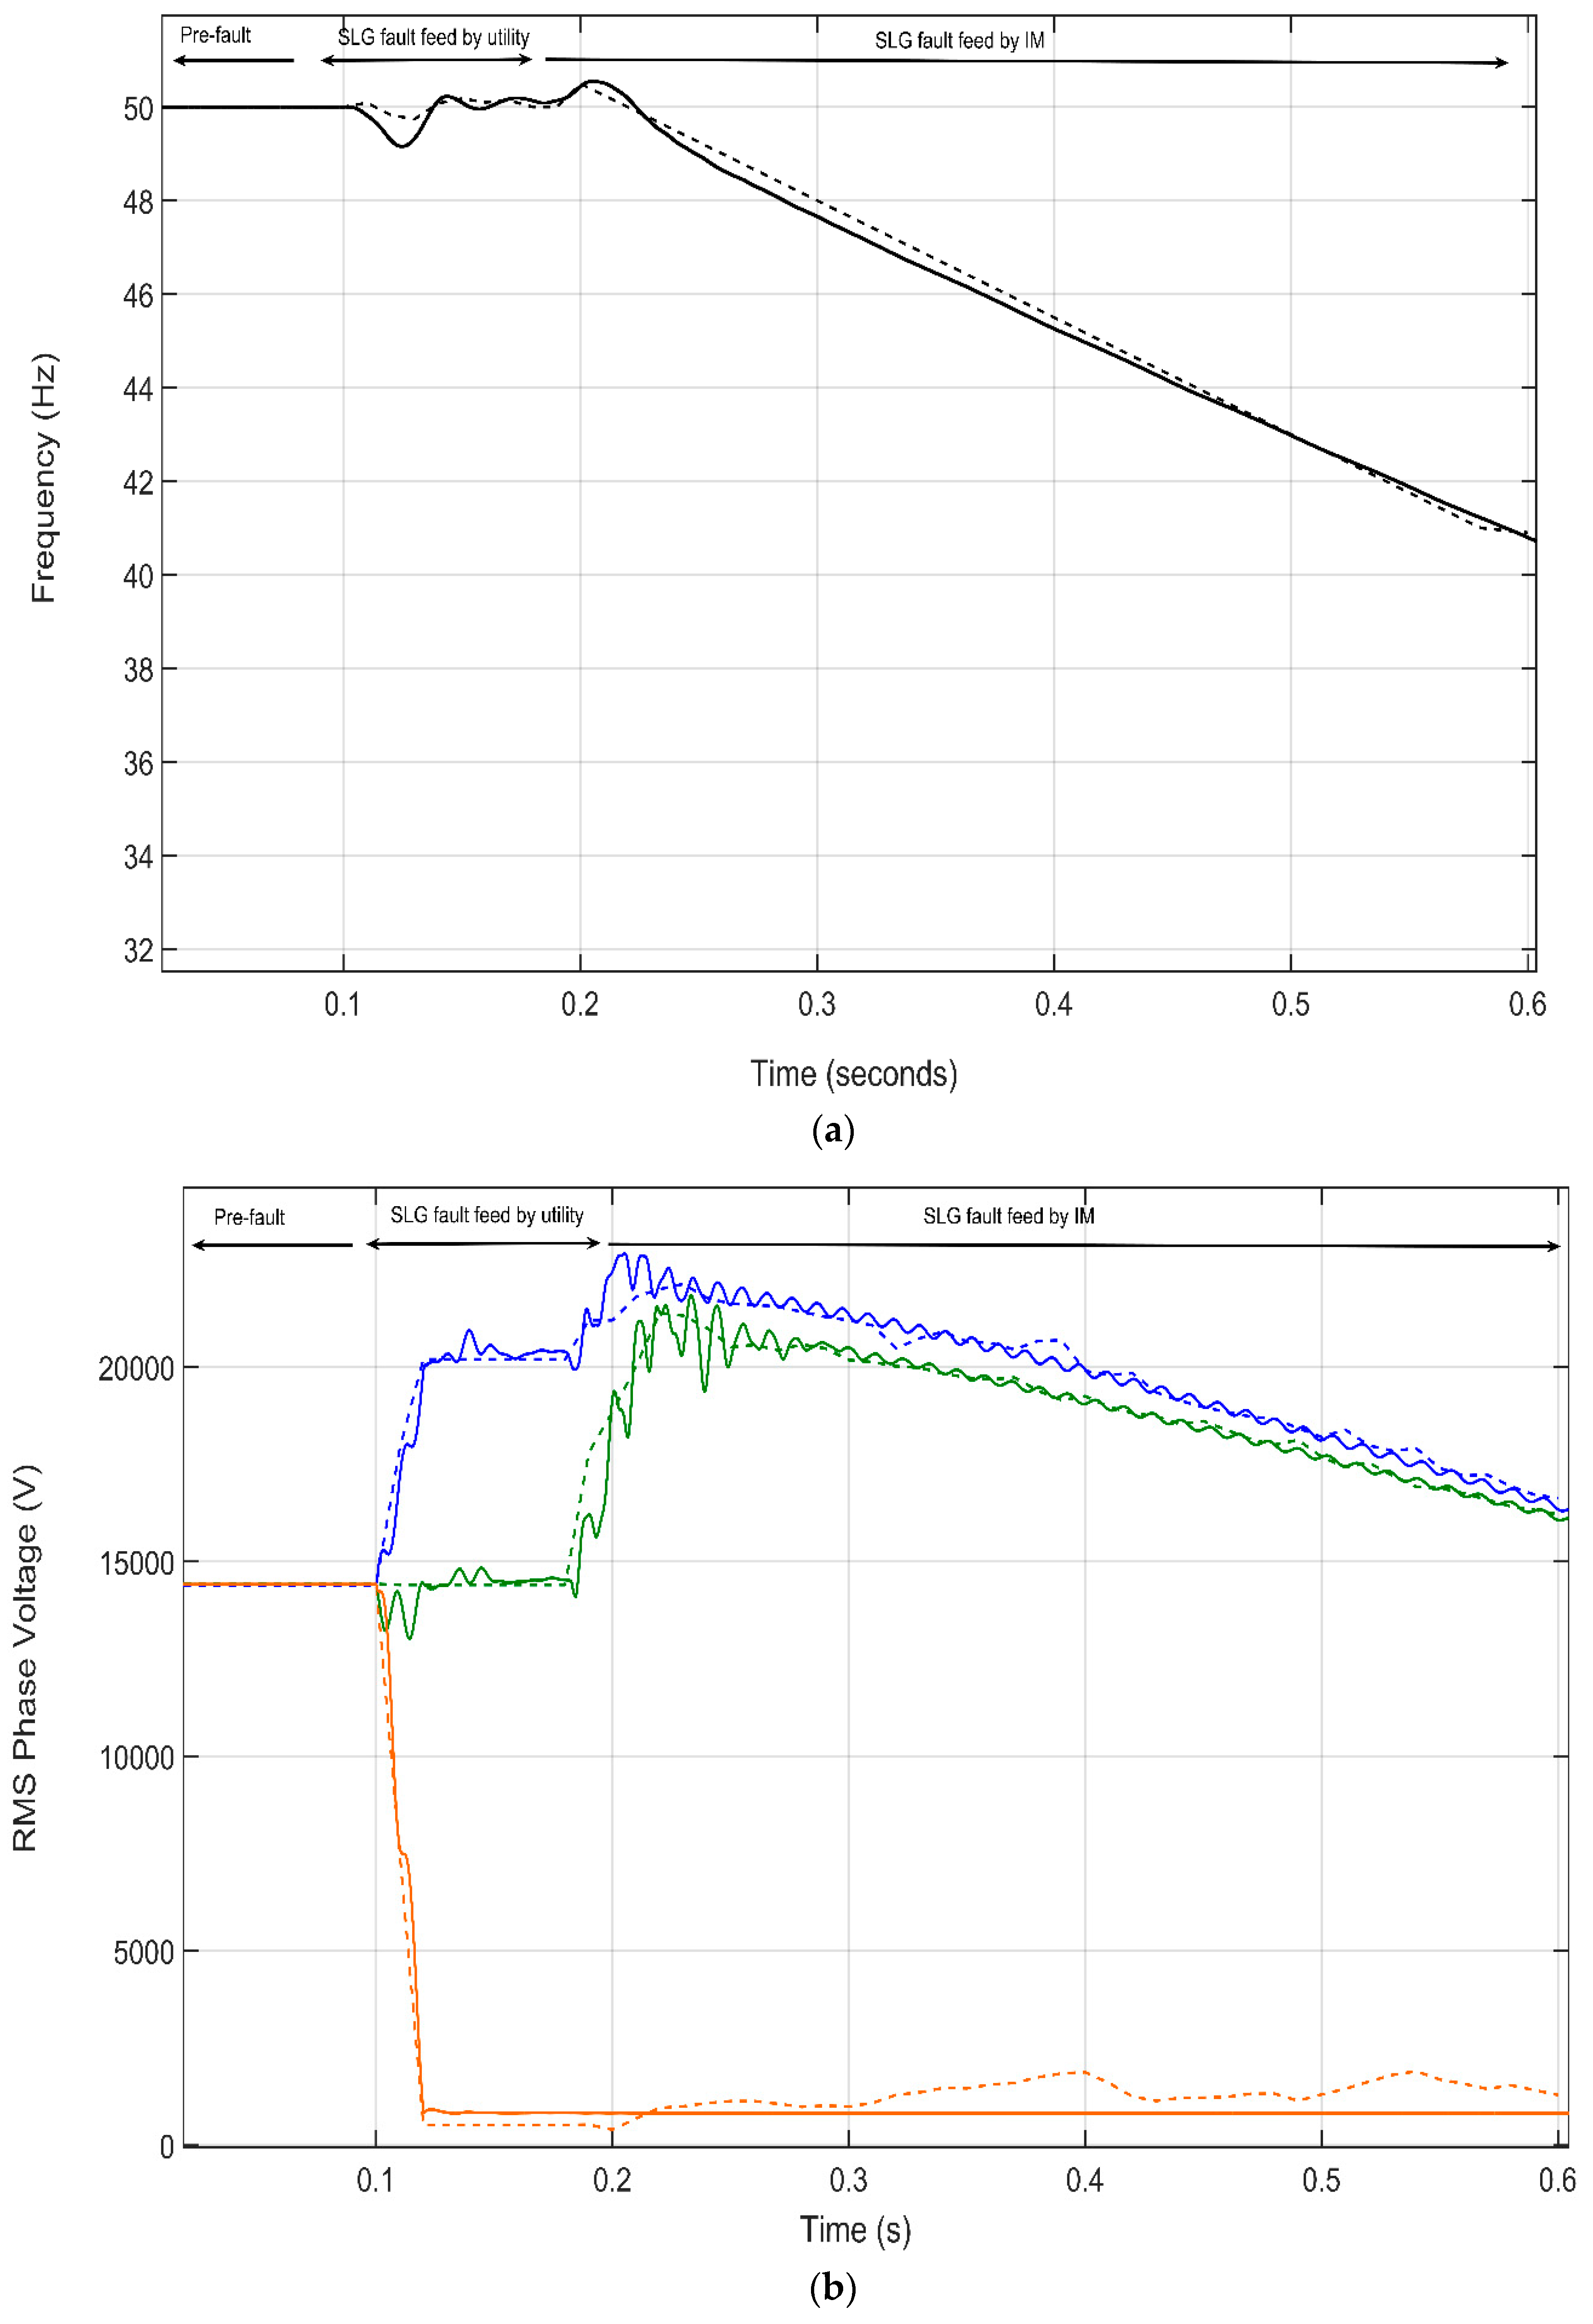
Frequency: Figure 15a shows that the simulation frequency profile approaches satisfactorily the field measurement. Thus, at t = 1.1s, the frequency is 40.8 Hz for both simulation result and field measurement. Pre-fault active-power of Feeder A loads is 980 kW.
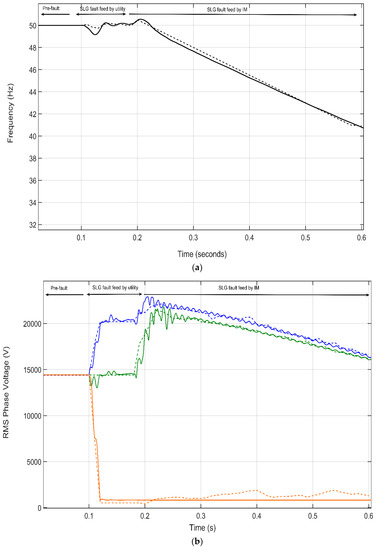
Figure 15.
Event 3 validation. (a) Frequency comparison, dashed-black (measurement), solid-black (simulation); (b) RMS Phase voltage comparison, solid (simulation)/dashed (measurements), orange (Phase A), blue (Phase B), and green (Phase C).
Voltage: Figure 15b displays the three-phase voltages of a permanent fault. Firstly, the SLG (Phase a is the faulty phase) that occurs in the Feeder A is fed by the main utility during 88 ms; the IM continue feeding this SLG fault after the CB has opened. It is noticeable that this type of event is highly risky for a DN: The IM is contributing to the fault with its short-circuit current. As the voltage decreases faster, the rapid reclosing takes place at 1.3 s, and the island has been de-energized. As with the frequency validation, the voltage value before the reclosing is lower than in Event 2 due to the higher feeder load values at the time the fault occurs.
6.4. Discussion
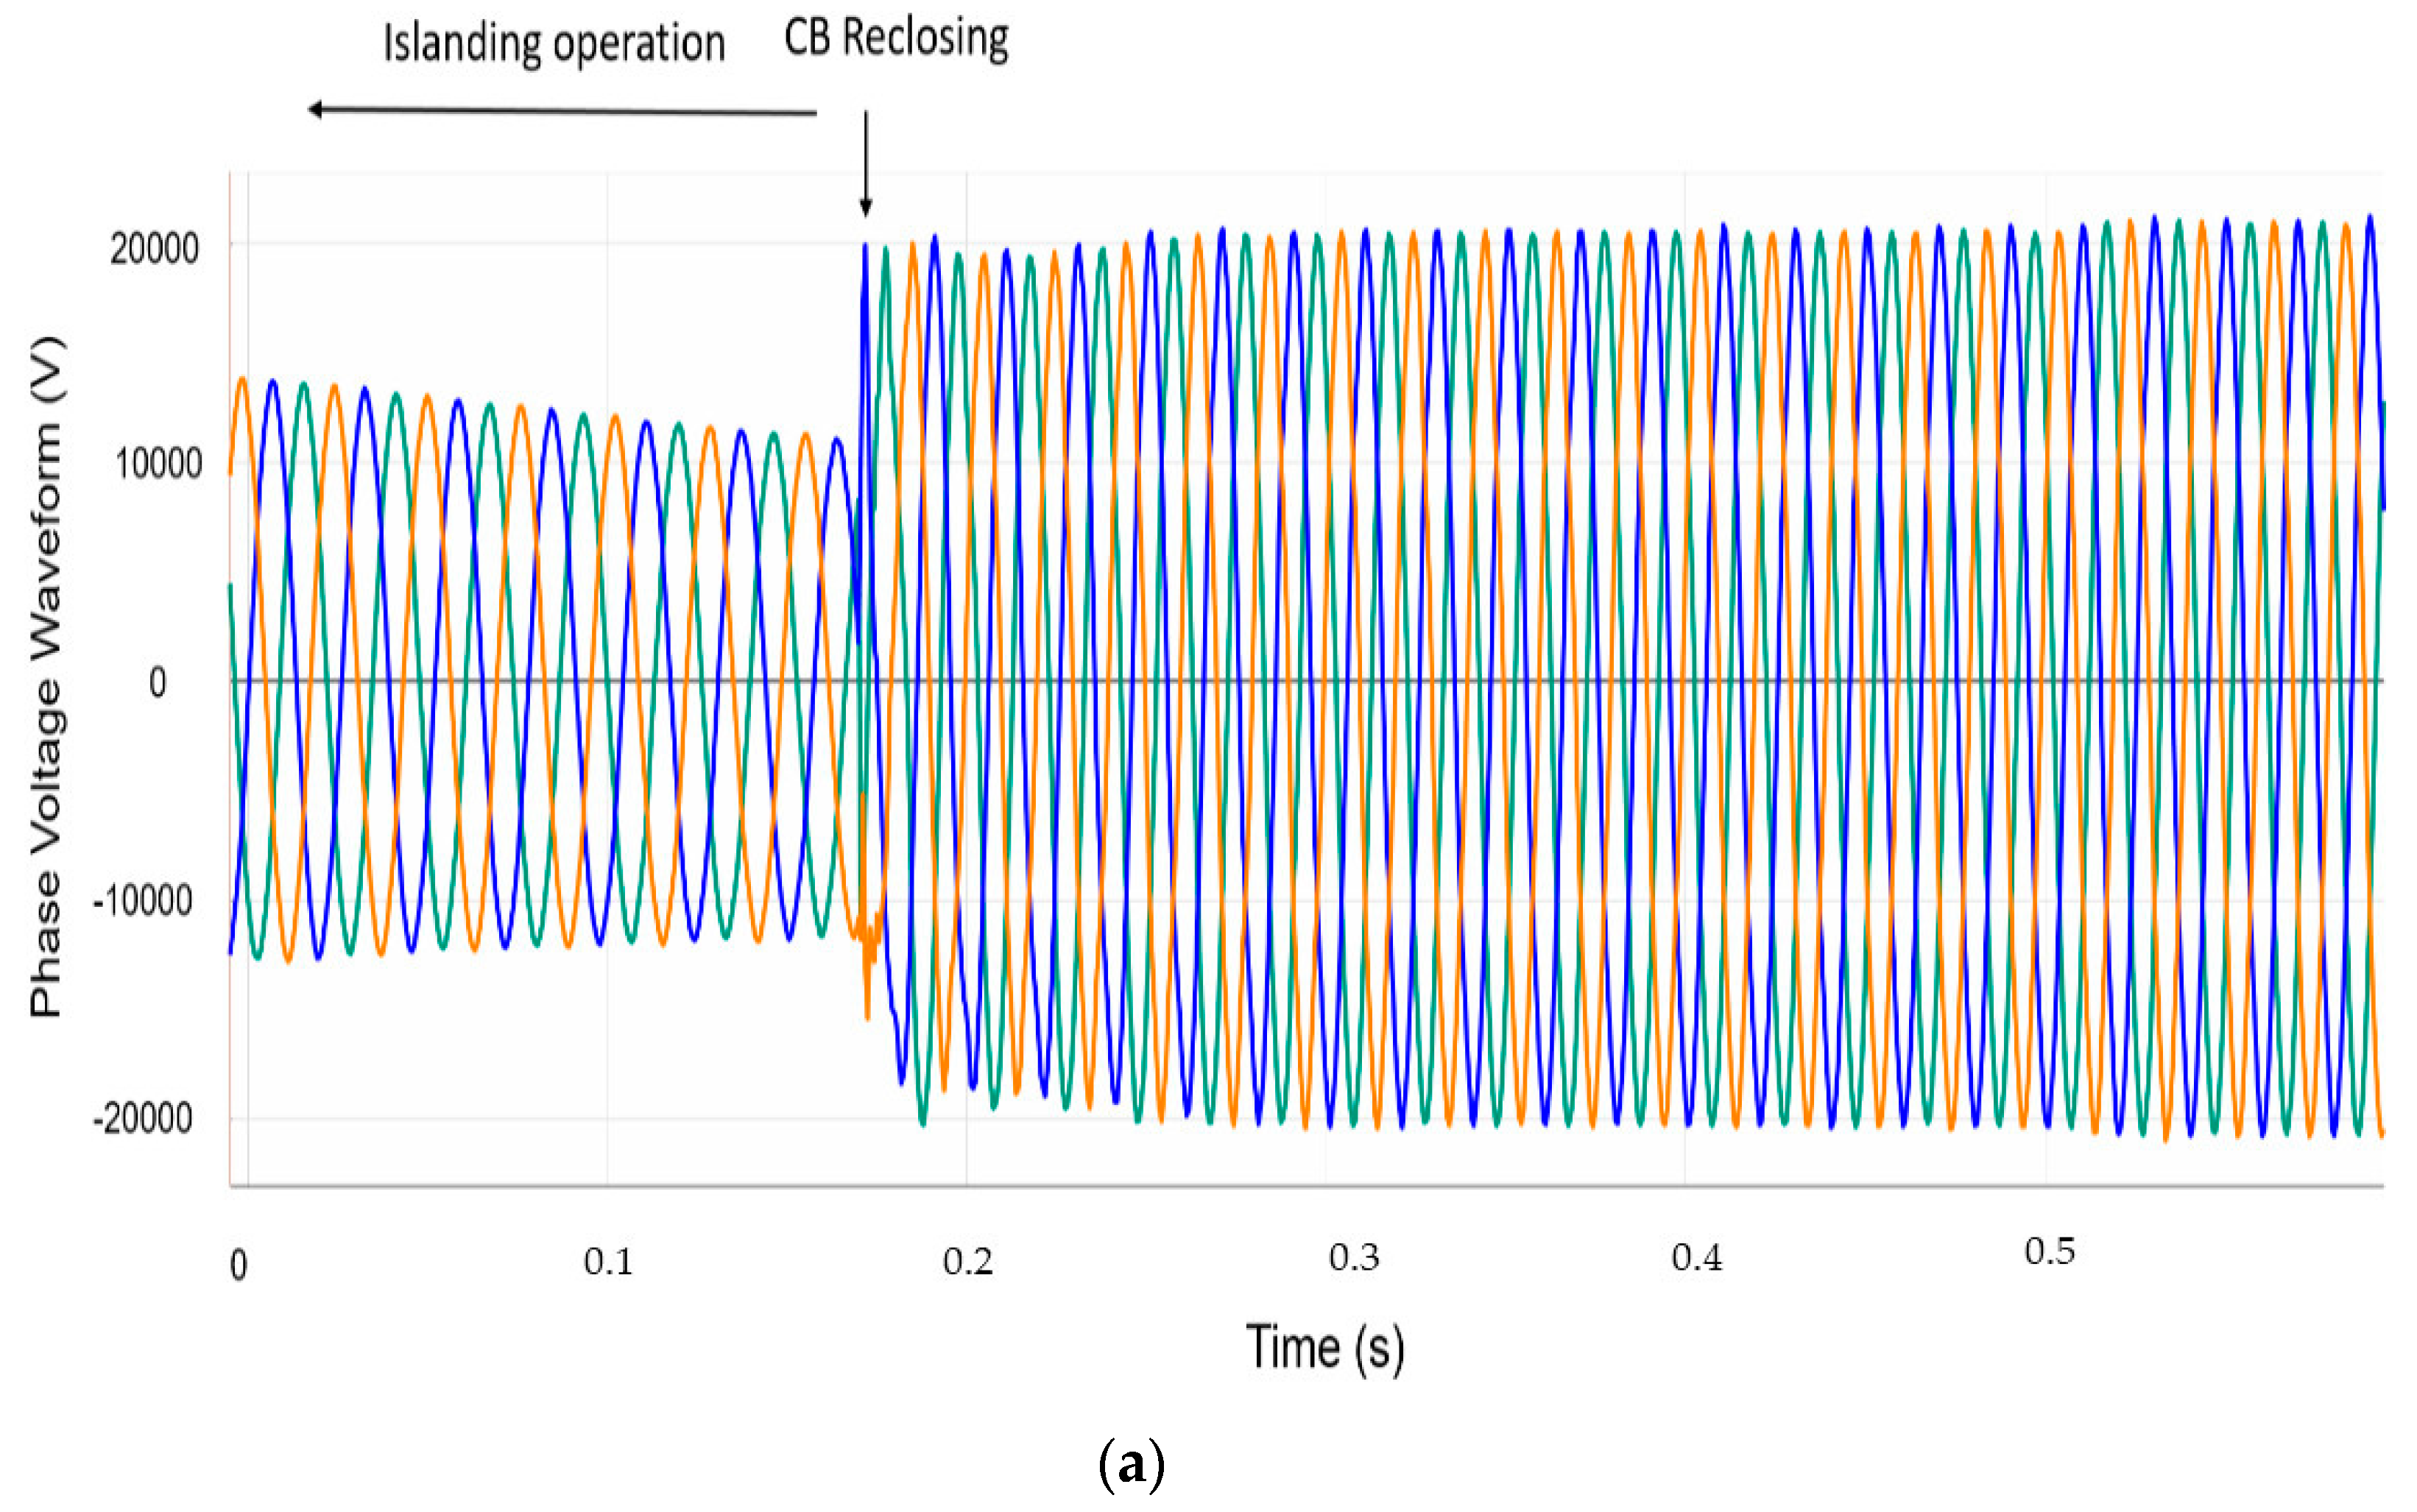
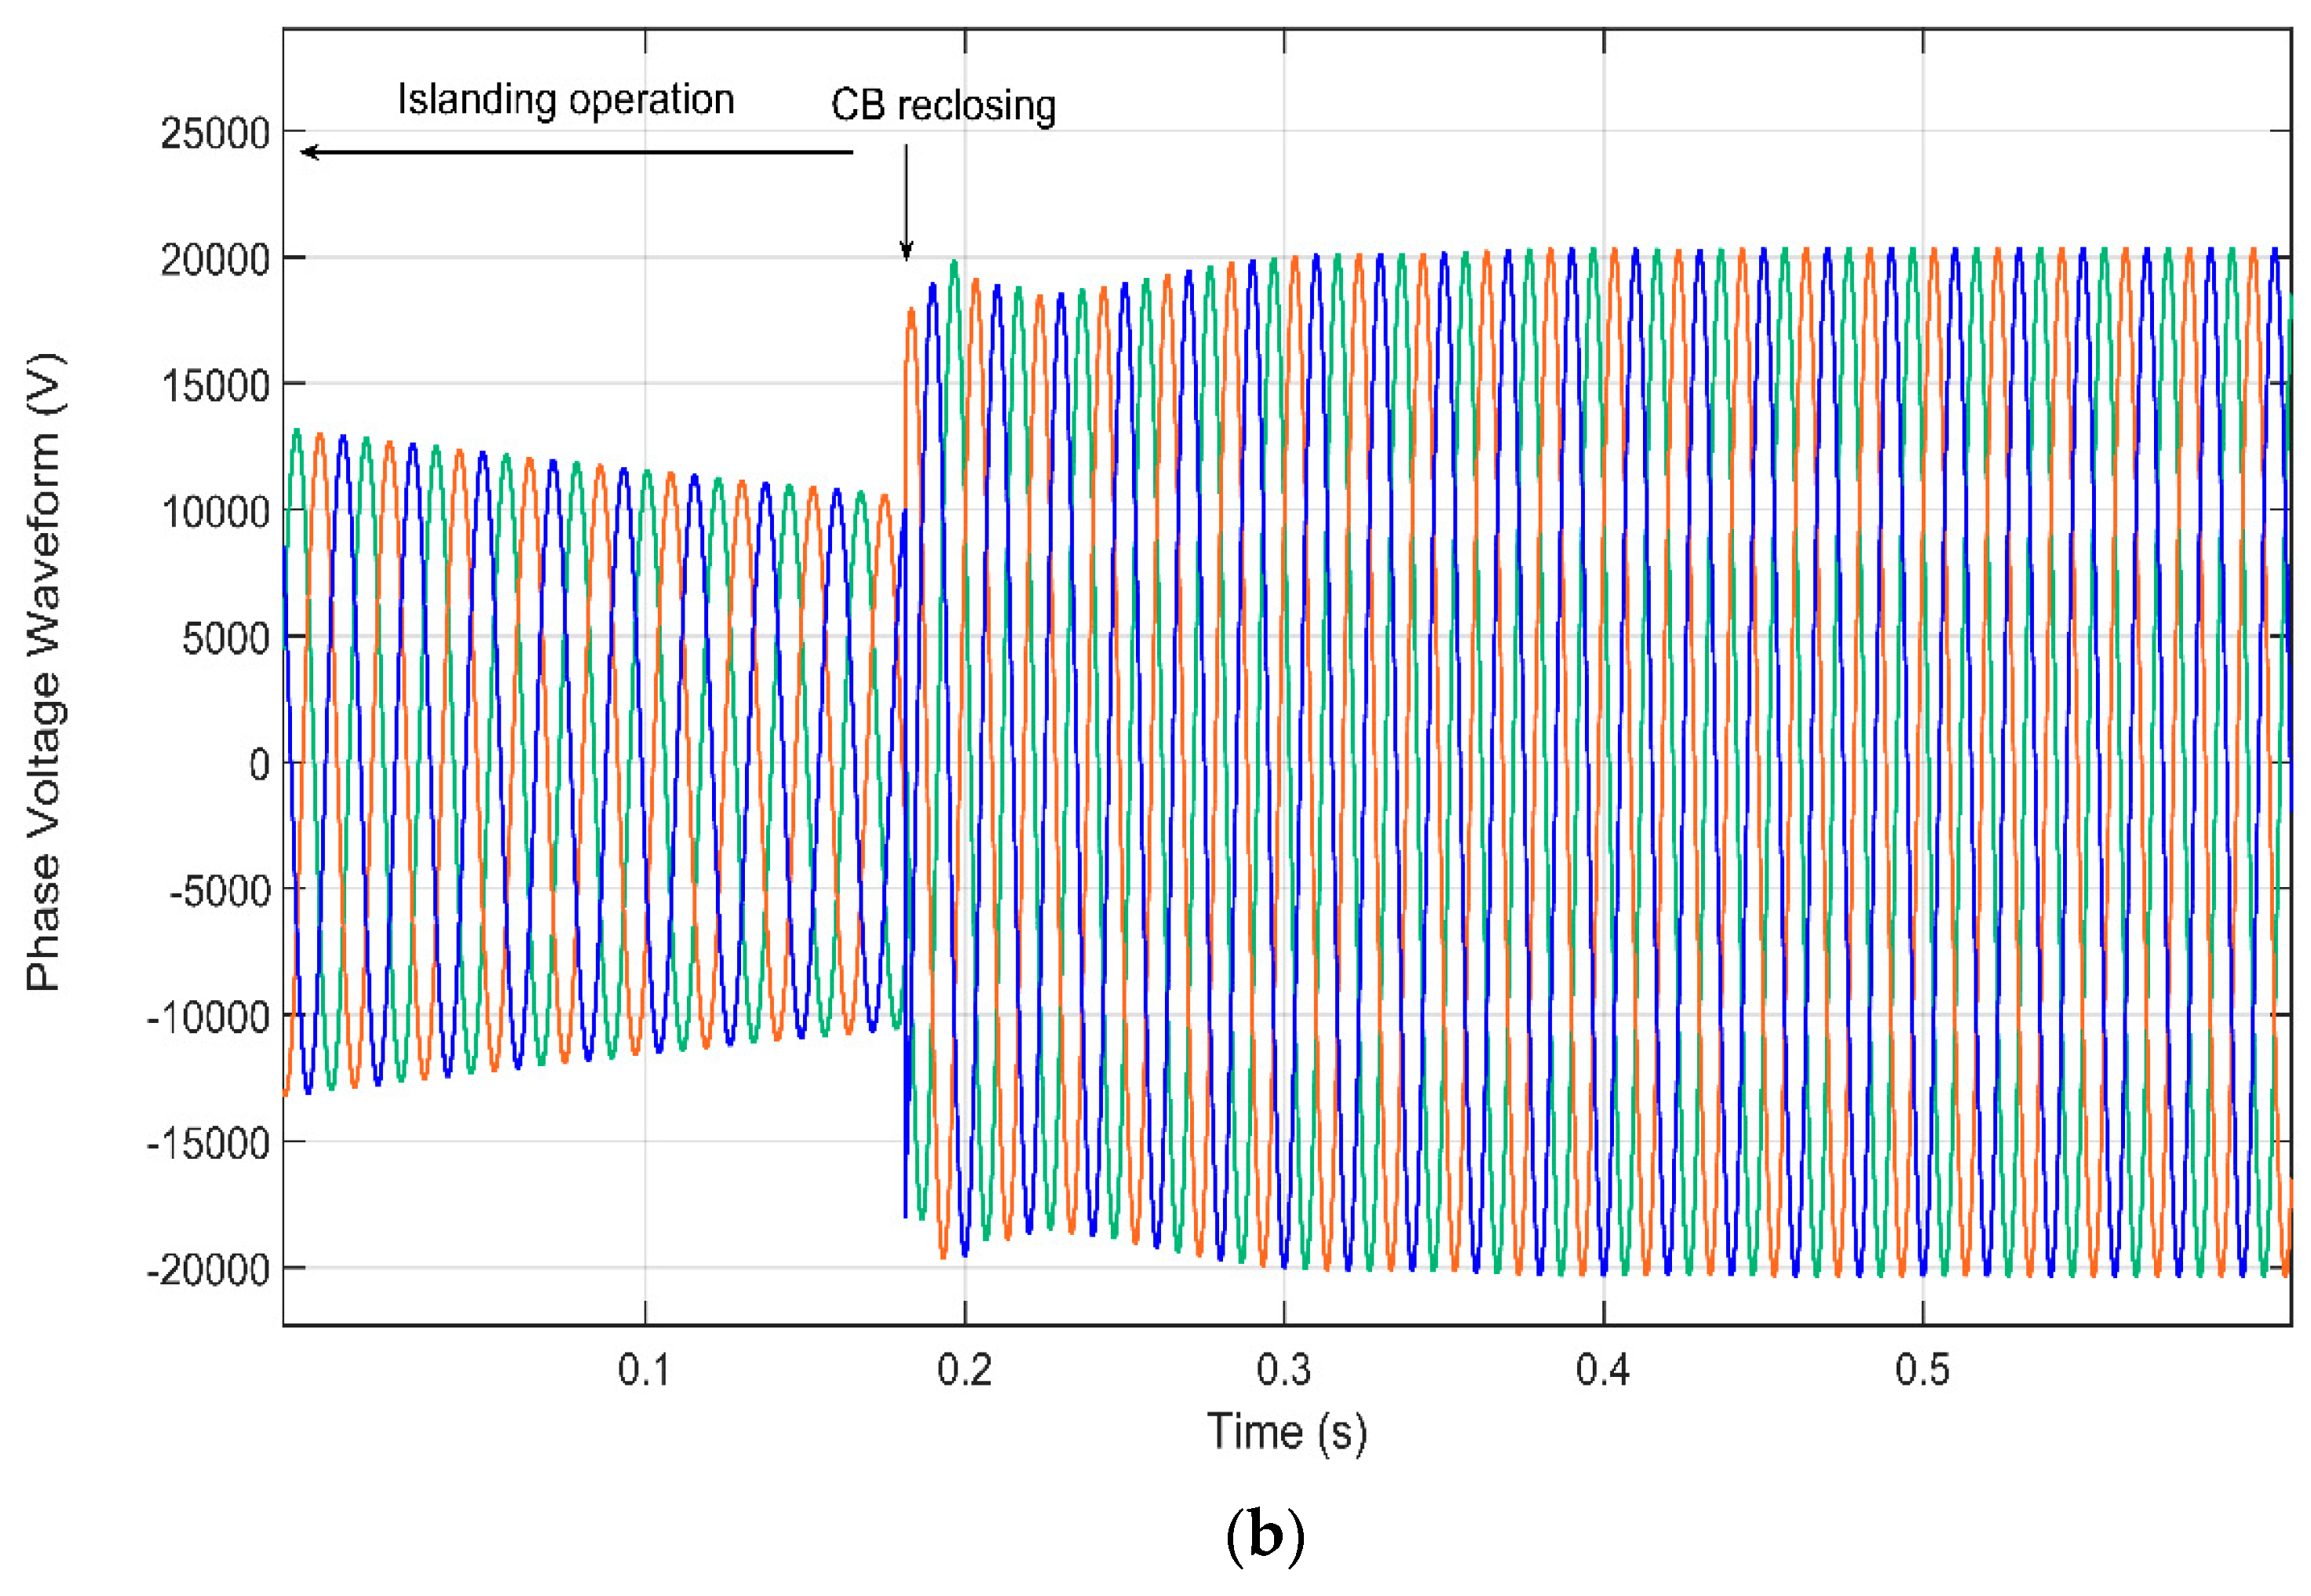
It is important to mention that a small difference between field measurements and simulation results can be seen for the RMS phase voltage; this is mostly due to the frequency dependence of the PLL measurement unit used in the simulation model. As a result of the frequency oscillation during the recovery (i.e., between t = 1 s and t = 1.1 s in Figure 13b and between t = 1.05 s, and t = 1.15 s in Figure 14b), an overvoltage in the RMS phase voltage is observed; thus, if the voltage waveform is taken into consideration, instead of its computed RMS value, simulation fits the recorded measurements for all events, and this transient overvoltage disappears. Accordingly, Figure 16 underscores this fact by showing the voltage wave-form for both field measurement (Figure 16a) and simulation result (Figure 16b). This figure shows that, for modeling purposes, the simulation results from the adopted model match very well the recorded events in the real DN.
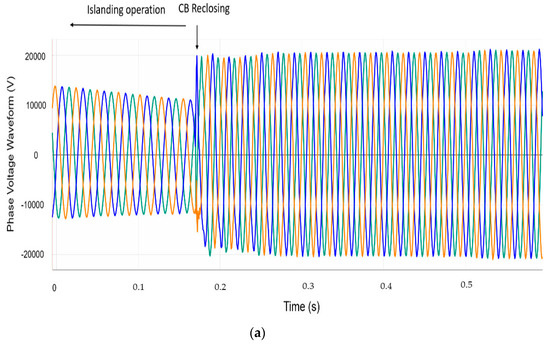
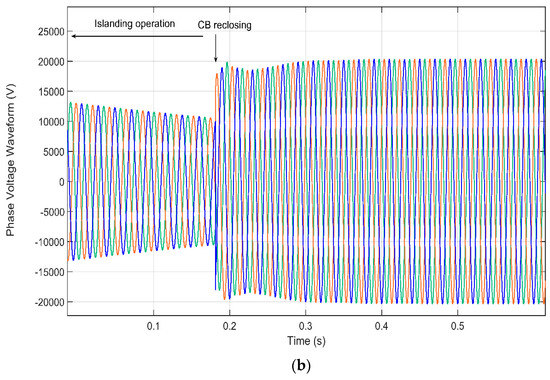
Figure 16.
Phase voltage waveform comparison. (a) Field measurements; (b) simulation results.
7. Conclusions
This paper has proposed and validated a modeling approach for representing islanding operations where induction motors transiently act as generators energizing the electrical grid.
To carry out model validation, field recorded events have been used. In each event, voltage and frequency are analyzed and discussed separately. By comparing field measurements and simulation results, it can be concluded that the three-phase model, implemented in Matlab, exhibits a high accuracy for transient modeling purposes.
It has been found that the feeder loads that remain connected within the island at the time the fault occurs play a pivotal role in this transient and dictate the survivability of the island. As expected, the lower the value, the smaller the voltage and frequency deviations during the islanding period. Furthermore, since the power drawn by the loads which remain within the island is mainly active (see the load profile plotted on Figure A1 in Appendix B), the assumption of neglecting its frequency-dependence in the load modeling proved to be appropriate.
It is important to emphasize the fact that this transient modeling provides a useful evaluation for DSOs to prevent hazardous events, especially in DNs with large IMs and low loaded feeders.
A relevant conclusion derived from the analysis of the recorded measurements is that, as a consequence of a fault, the operation of a large IM in an unintentional island can damage other components that remain connected to the IM.
Future research will be focused on implementing an islanding detection tool to prevent this unintentional islanding operation.
Author Contributions
All authors have contributed equally to this research. All authors have read and agreed to the published version of the manuscript.
Funding
This research was funded by a grant of the Catalonian College of Engineers.
Acknowledgments
The authors want to acknowledge the willingness of sharing field measurements by the Spanish DSO Electrica Serosense Distribuidora. The authors would also like to thank the Catalonian College of Engineers for the grant received to carry out this research.
Conflicts of Interest
The authors declare no conflict of interest.
Appendix A

Table A1.
Induction motor (IM) data.
Table A1.
Induction motor (IM) data.
| Internal Parameters | Values | Rated Parameters | Values |
|---|---|---|---|
| Ls | 0.0078 H | P | 160 kW |
| Lr | 0.0078 H | 𝓅 | 1 |
| Rr | 0.0077 Ω | f | 50 Hz |
| Rs | 0.0137 Ω | V | 400 V |
| Lm | 0.0076 H | J | 2.9 kgm2 |

Table A2.
Test system parameters.
Table A2.
Test system parameters.
| Transformers | |||||||
| Transformer Type | Vp/Vs (kV) | S (MVA) | ε (%) | Lm/Rm (H/kΩ) | |||
| Substation transformer | TR1 | 120/25 kV | 10 | 10.4 | 78; 313 | ||
| Distribution transformers | TR2 | 25/0.4 kV | 1 | 6 | 180; 370 | ||
| TR3 | 25/0.4 kV | 0.63 | 5.1 | 350; 480 | |||
| TR4 | 25/0.4 kV | 0.4 | 4.3 | 404; 694 | |||
| TR5 | 25/0.4 kV | 0.25 | 4.1 | 811; 1666 | |||
| Distribution Lines | |||||||
| Lines | Nodes | Length (km) | Parameters:Z1/Z0 (Ω/km); C0 (μF/km) | Loadability (A) | |||
| L1 | 2–4 | 5 | 0.306 + j0.405/0.38 + j1.62 | 300 | |||
| L2 | 4–3 | 3.3 | 1.07 + j0.441/1.3 + j1.76, | 120 | |||
| L3 | 4–6 | 4.3 | 0.306 + j0.405/0.38 + j1.62 | 300 | |||
| L4 | 6–5 | 4 | 1.07 + j0.441/1.3 + j1.76 | 120 | |||
| L5 | 6–7 | 2.5 | 0.306 + j0.405/0.38 + j1.62 | 300 | |||
| L6 | 7–8 | 2 | 0.306 + j0.405/0.38 + j1.62 | 300 | |||
| L7 | 8–9 | 7 | 0.687 + j0.416/0.8 + j1.66 | 200 | |||
| L8 | 2–10 | 3.8 | 0.127 + j0.114/0.17 + j0.45; 0.229 | 389 | |||
| L9 | 10–11 | 4.43 | 0.208 + j0.123/0.278 + j0.492; 0.192 | 320 | |||
| L10 | 11–12 | 4 | 0.687 + j0.416/0.8 + j1.66 | 200 | |||
| L11 | 12–13 | 3.3 | 0.687 + j0.416/0.8 + j1.66 | 200 | |||
| L12 | 1–2 | 0.28 | 0.306 + j0.405/0.38 + j1.62 | 300 | |||
Appendix B

Table A3.
Feeder A loads rated value.
Table A3.
Feeder A loads rated value.
| Load Node | Rated Voltage (V) | Rated P/Q (kW/kVAr) | Load Model * |
|---|---|---|---|
| Node 15 | 400 | 30/4 | Constant power |
| Node 16 | 400 | 100/20 | Constant impedance |
| Node 17 | 400 | 300/45 | Constant impedance |
| Node 18 | 400 | 600/−157 | Induction motors |
| Node 19 | 400 | 100/10 | Constant impedance |
| Node 20 | 400 | 30/4 | Constant current |
| Node 21 | 400 | 25/10 | Constant impedance |
| Node 22 | 400 | 200/80 | Constant impedance |
| Node 23 | 400 | 40/18 | Constant impedance |
* The load model type listed in the table is model type implemented in Matlab/Simulink. Although there is not sufficient evidence (or field measurements) to select a given model, the model selected for each load provides a close enough simulation result to that obtained from measurements.
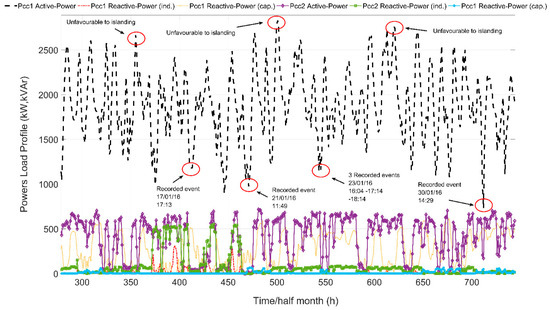
Figure A1.
Load profile at PCC1 with the time of occurrence of some events.
Figure A1.
Load profile at PCC1 with the time of occurrence of some events.
References
- Bignucolo, F.; Cerretti, A.; Coppo, M.; Savio, A.; Turri, R. Impact of distributed generation grid code requirements on islanding detection in LV networks. Energies 2017, 10, 156. [Google Scholar] [CrossRef]
- Song, H.; Wu, J.; Wu, K. A wide-area measurement systems-based adaptive strategy for controlled islanding in bulk power systems. Energies 2014, 7, 2631–2657. [Google Scholar] [CrossRef]
- IEEE Standards Coordinating Committee 21. IEEE Application Guide for IEEE Std 1547TM, IEEE Standard for Interconnecting Distributed Resources with Electric Power Systems; IEEE Press: Piscataway, NJ, USA, 2009. [Google Scholar]
- Khodaparastan, M.; Vahedi, H.; Khazaeli, F.; Oraee, H. A Novel hybrid islanding detection method for inverter-based DGs using SFS and ROCOF. IEEE Trans. Power Deliv. 2017, 9, 6448–6460. [Google Scholar]
- di Fazio, A.R.; Russo, M.; Valeri, S. A new protection system for islanding detection in LV distribution systems. Energies 2015, 8, 3775–3793. [Google Scholar] [CrossRef]
- Chen, Y.; Xu, Z.; Østergaard, J. Control mechanism and security region for intentional islanding transition. In Proceedings of the 2009 IEEE Power Energy Society Genenerl Meeting, PES ’09, Calgari, AB, Canada, 23–26 July 2009; pp. 1–6. [Google Scholar]
- Serrano-Fontova, A.; Casals-Torrens, P.; Bosch, R. Power quality disturbances assessment during unintentional islanding scenarios. A contribution to voltage sag studies. Energies 2019, 12, 3198. [Google Scholar] [CrossRef]
- Ambia, M.N.; Al-Durra, A. Adaptive power smoothing control in grid-connected and islanding modes of hybrid micro-grid energy management. J. Renew. Sustain. Energy 2015, 7. [Google Scholar] [CrossRef]
- Mulukutla, S.S.; Gulachenski, E.M. A Critical Survey of considerations in maintaining process continuity during voltage dips while protecting motors with reclosing and bus-transfer practices. IEEE Trans. Power Syst. 1992, 7, 1299–1305. [Google Scholar] [CrossRef]
- Pettigrew, R.D.; Powell, P.; Burnworth, J.; Haas, R.; Gil-Berlinches, J.; Waudby, P.; Mozina, C.; Pierce, A.; Beckwith, F.T.R.; et al. Motor bus transfer. IEEE Trasactions Power Deliv. 1993, 8, 1747–1758. [Google Scholar] [CrossRef]
- Beckwith, T.R.; Hartmann, W.G. Motor bus transfer: Considerations and methods. IEEE Trans. Ind. Appl. 2006, 42, 602–611. [Google Scholar] [CrossRef]
- Yalla, M.V.V.S. esign of a high-speed motor bus transfer system. IEEE Trans. Ind. Appl. 2010, 46, 612–619. [Google Scholar] [CrossRef]
- Muralimanohar, P.K.; Haas, D.; McClanahan, J.R.; Jagaduri, R.T.; Singletary, S. Implementation of a Microprocessor-Based Motor Bus Transfer Scheme. IEEE Trans. Ind. Appl. 2018, 54, 4001–4008. [Google Scholar] [CrossRef]
- Martinez, J.A. Power System Transients: Parameter Determination; CRC PRESS: Boca Raton, FL, USA, 2010; Volume 8. [Google Scholar]
- Martinez, J.A.; Johnson, B.; Grande-Moran, C. Parameter determination for modeling system transients—Part IV: Rotating Machines. IEEE Trans. Power Deliv. 2005, 20, 2063–2072. [Google Scholar] [CrossRef]
- Ormazabal Protection and Automation, EkorRPS-Multifunctional Protection. Available online: https://www.ormazabal.com/es/tu-negocio/productos/ekorrps (accessed on 9 January 2020).
- Martinez, J.A.; Gustavsen, B.; Durbak, D. Parameter determination for modeling system transients—Part I: Overhead lines. IEEE Trans. Power Deliv. 2005, 20, 2038–2044. [Google Scholar] [CrossRef]
- Papagiannis, G.K.; Papadopoulos, T.A.; Chrysochos, A.I. Rigorous calculation method for resonance frequencies in transmission line responses. IET Gener. Transm. Distrib. 2015, 9, 767–778. [Google Scholar]
- Papadopoulos, T.A.; Chrysochos, A.I.; Papagiannis, G.K. Analytical study of the frequency-dependent earth conduction effects on underground power cables. IET Gener. Transm. Distrib. 2013, 7, 276–287. [Google Scholar] [CrossRef]
- Papadopoulos, T.A.; Tsiamitros, D.A.; Papagiannis, G.K. Impedances and admittances of underground cables for the homogeneous earth case. IEEE Trans. Power Deliv. 2010, 25, 961–969. [Google Scholar] [CrossRef]
- IEEE. IEEE Standard for General Requirements for Liquid-Immersed Distribution, Power, and Regulating Transformers; IEEE Press: Piscataway, NJ, USA, 2016. [Google Scholar]
- Neves, W.L.A.; Dommel, H.W. Saturation Curves of Delta-Connected Transformers from Measurements. IEEE Trans. Power Deliv. 1995, 10, 1432–1437. [Google Scholar] [CrossRef]
- Martinez, J.A.; Walling, R.; Mork, B.A.; Martin-Arnedo, J.; Durbak, D. Parameter determination for modeling system transients—Part III: Transformers. IEEE Trans. Power Deliv. 2005, 20, 2051–2062. [Google Scholar] [CrossRef]
- de León, F.; Martinez, J.A. Dual three-winding transformer equivalent circuit matching leakage measurements. IEEE Trans. Power Deliv. 2009, 24, 160–168. [Google Scholar] [CrossRef]
- Rezaei-Zare, A. Enhanced transformer model for low- And mid-frequency transients—Part II: Validation and simulation results. IEEE Trans. Power Deliv. 2015, 30, 316–325. [Google Scholar] [CrossRef]
- Abdulsalam, S.G.; Xu, W.; Neves, W.L.A.; Liu, X. Estimation of transformer saturation characteristics from inrush current waveforms. IEEE Trans. Power Deliv. 2006, 21, 170–177. [Google Scholar] [CrossRef]
- Papaspiliotopoulos, V.A.; Korres, G.N.; Kleftakis, V.A.; Hatziargyriou, N.D. Hardware-In-the-Loop Design and Optimal Setting of Adaptive Protection Schemes for Distribution Systems with Distributed Generation. IEEE Trans. Power Deliv. 2017, 32, 393–400. [Google Scholar]
- Jia, K.; Wei, H.; Bi, T.; Thomas, D.W.P.; Sumner, M. An Islanding Detection Method for Multi-DG Systems Based on High-Frequency Impedance Estimation. IEEE Trans. Sustain. Energy 2017, 8, 1. [Google Scholar] [CrossRef]
- Martinez, J.A.; Mahseredjian, J.; Khodabakhchian, B. Parameter Determination for Modeling System Transients—Part VI: Circuit Breakers. IEEE Trans. Power Deliv. 2005, 20, 2079–2085. [Google Scholar] [CrossRef]
- Corcoles, F.; Pedra, J.; Salichs, M.; Sainz, L. Analysis of the induction machine parameter identification. IEEE Trans. Energy Convers. 2002, 17, 183–190. [Google Scholar] [CrossRef]
- Schneider, K.P.; Fuller, J.C.; Chassin, D.P. Multi-state load models for distribution system analysis. IEEE Trans. Power Syst. 2011, 26, 2425–2433. [Google Scholar] [CrossRef]
- Alexiadis, M.C.; Papagiannis, G.K.; Panapakidis, I.P. Enhancing the clustering process in the category model load profiling. IET Gener. Transm. Distrib. 2015, 9, 655–665. [Google Scholar]
- Hill, D.J. Nonlinear dynamic load models with recovery for voltage stability studies. IEEE Trans. Power Syst. 1993, 8, 166–176. [Google Scholar] [CrossRef]
- Li, H.; Chen, Q.; Fu, C.; Yu, Z.; Shi, D.; Wang, Z. Bayesian Estimation on Load Model Coefficients of ZIP and Induction Motor Model. Energies 2019, 12, 547. [Google Scholar] [CrossRef]
- IEEE Task Force on Load Representation for Dynamic Performance. Load representation for dynamic performance analysis (of power systems). IEEE Trans. Power Syst. 1993, 8, 472–482. [Google Scholar] [CrossRef]
- Zhang, Z.; Yang, H.; Yin, X.; Han, J.; Wang, Y.; Chen, G. A load-shedding model based on sensitivity analysis in on-line power system operation risk assessment. Energies 2018, 11, 727. [Google Scholar] [CrossRef]
- Farrokhabadi, M.; Cañizares, C.A.; Bhattacharya, K. Frequency control in isolated/islanded microgrids through voltage regulation. IEEE Trans. Smart Grid 2017, 8, 1185–1194. [Google Scholar] [CrossRef]
- The Mathworks Inc. MATLAB 2015-MathWorks. 2016. Available online: www.mathworks.com/products/matlab (accessed on 9 January 2020).
© 2020 by the authors. Licensee MDPI, Basel, Switzerland. This article is an open access article distributed under the terms and conditions of the Creative Commons Attribution (CC BY) license (http://creativecommons.org/licenses/by/4.0/).

