Article

Brittleness Evaluation in Shale Gas Reservoirs and Its Influence on Fracability

1
School of Energy Resources, China University of Geosciences, Beijing 100083, China
2
Key Laboratory of Marine Reservoir Evolution and Hydrocarbon Enrichment Mechanism, Ministry of Education, Beijing 100083, China
3
Key Laboratory of Strategy Evaluation for Shale Gas, Ministry of Land and Resources, Beijing 100083, China
*
Author to whom correspondence should be addressed.
Energies 2020, 13(2), 388; https://doi.org/10.3390/en13020388
Submission received: 23 December 2019 / Revised: 8 January 2020 / Accepted: 9 January 2020 / Published: 13 January 2020
(This article belongs to the Section H: Geo-Energy)

Abstract

:
The brittleness index (BI) is a key parameter used to identify the desirable fracturing intervals of shale gas reservoirs. Its correlation with fracability is still controversial. There have been a variety of methods proposed that can estimate BI. The brittleness evaluation method based on stress-strain curves according to the energy-balanced law is the most suitable and reliable in this study. Triaxial compression test, optical microscopy and scanning electron microscopy (SEM) observation, and X-ray diffraction analysis (XRD) were performed on nine drill core samples from well SY3 located in the peripheral regions of Sichuan Basin, China. These tests further evaluated several commonly used methods (brittleness indices based on rock elastic parameters, rock mineral compositions) and determined the relationship between brittleness, rock elastic parameters, and the content of minerals. The results obtained indicate that for sedimentary rocks, a higher Young’s modulus reduces the brittleness of rock, and Poisson’s ratio weakly correlates with brittleness. Excessive amounts of quartz or carbonate minerals can increase the cohesiveness of rock, leading to poor brittleness. Furthermore, the most suitable fracturing layers possess a high brittleness index and low minimum horizontal stress.

1. Introduction

Shale gas reservoirs are remarkably different compared to conventional reservoirs due to their ultra-low porosity and permeability. It is of utmost importance to hydraulically fracture the unconventional oil and gas reservoirs for commercial production. Consequently, the identification of candidates for prospected fracturing in shale gas reservoirs is necessary to enhance gas productivity. Brittleness index is an essential mechanical parameter that has been used to evaluate whether shale gas reservoirs can easily form complex fracture networks [1,2]. Also, shales with high brittleness tend to close hydraulically created fractures slowly [3]. Therefore, the quantitative evaluation of brittleness is of considerable significance to the optimization of fracturing intervals.
At present, there exists no unique and universally accepted definition for rock brittleness. Different definitions are based on their purpose. For example, brittleness has been described as the lack of ductility [4] or the destruction of internal cohesion [5], the ability for a rock to deform and fail with a low degree of inelastic behavior has also been used to define brittleness [6], along with the process by which sudden loss of strength occurs with little or no plastic deformation [7], and the rock’s capability to self-sustain fracturing [8]. Although there is no consensus on the definition, it is commonly believed that brittle rocks are characterized by the following features: (1) easily fractured with the formation of more cracks and (2) little plastic deformation under compression.
Brittleness is a comprehensive response of a rock’s combined mechanical properties. The influencing factors of rock brittleness are divided into internal factors and external factors. The intrinsic factors mainly include composition (e.g., total organic carbon (TOC), minerals, water/gas/oil content), texture, and porosity of the rock. The external factors comprise the ambient pressure and temperature [9]. Considering different affecting factors, numerous quantification methods for evaluating rock brittleness have been proposed. The most widely used methods are categorized into three general groups:(1) brittleness indices based on rock elastic parameters [10], (2) brittleness indices attained from rock mineral compositions [11,12,13], and (3) brittleness indices derived from rock stress-strain curves [8,14].
The aim of this paper is to select the most suitable and reliable brittleness evaluation method as standard after analyzing these three methods. Through a series of experiments, the brittleness indices by means of these three methods are respectively calculated and compared with each other. Meanwhile, the relationship between standard brittleness index, rock elastic parameters, and the content of minerals are investigated.
The role that brittleness plays in the selection of desired fracturing intervals is also discussed in this study. The primary motivation of brittleness evaluation is to select prospective gas and oil shales that can be efficiently fractured for profitable production. However, others believe that the brittleness parameter usually ignores the actual mechanisms of effective fracturing, failing to select the desired fracturing intervals [15,16,17]. Consequently, the “fracability index” is defined to select fracturing intervals by using the parameters affecting fracability beyond the brittleness index [18]. Accordingly, the correlation of brittleness index and fracability index is studied.

2. Reviewing and Evaluating the Existing Brittleness Indices

2.1. Brittleness Indices Based on Rock Elastic Parameters

Brittleness is a property of a material correlated with elastic and plastic deformation. If a rock under stress has a broader region of elastic behavior and a smaller region of ductile behavior, it is considered more brittle [19]. Therefore, elastic parameters (Young’s modulus and Poisson’s ratio) are utilized to calculate the brittleness index of materials. Young’s modulus is a ratio of stress and strain. Poisson’s ratio is a ratio of radial strain over axial strain. Equation (1) proposed by [10] combines Young’s modulus and Poisson’s ratio to evaluate rock brittleness:
B I = E n + v n 2 ,
E n = E E m i n E m a x E m i n ;   v n = v max v v max v min
where E and ν are Young’s modulus and Poisson’s ratio, respectively; En and νn are normalized Young’s modulus and Poisson’s ratio, respectively; min and max indices in the equation are the minimum and maximum of the elastic parameters in the study area, respectively.
In this framework, the brittle rocks with a higher Young’s modulus and lower Poisson’s ratio experience less axial strain and less radial strain under the same applied force. This indicates that these brittle rocks can transform more absorbed energy into elastic energy to promote the initiation and extension of cracks. However, the controversial debate of whether Young’s modulus and Poisson’s ratio can be used to assess brittleness has intensified recently. These two parameters are elastic parameters only corresponding to non-permanent (or elastic) deformation, but the failure of materials refers to not only non-permanent deformation but also permanent deformation [16]. Furthermore, previous research works found that the brittleness indices calculated from this model tend to remain almost unchanged, or even increase, with an increase in confining pressure [15,20]. This observation conflicts with the fact that a decrease in confinement stress increases rock brittleness [7,21]. Therefore, the brittleness index based on elastic modulus is inappropriate to evaluate rock brittleness correctly.

2.2. Brittleness Indices Attained from Rock Mineral Compositions

Minerals are regarded as the most significant factor in controlling brittle rock behavior. In this framework, it is universally regarded that brittle minerals (e.g., quartz, carbonate minerals) tend to promote rock brittleness while ductile matters (e.g., clay minerals, organic matter) diminish brittle rock characteristics. Consequently, the method based on rock mineral components is expressed as follows [11,12,13]:
B I = w b w b + w d ,
where Wb is the weight fraction of brittle minerals that tend to promote rock brittleness, Wd is the weight fraction of ductile minerals that diminish rock brittle characteristics.
The content of rock minerals is easily obtained from laboratory tests or well-logging data, so it is convenient for researchers to understand this method and calculate the brittleness index. However, three problems exist in this methodology. First, the confirmation of brittle minerals fails to reach a consensus. Apart from quartz, it is controversial whether carbonate minerals, pyrite, and feldspar are “brittle” minerals. Therefore, the calculation formulas vary in different study areas. As a result, outcomes calculated by various formulas may be extremely different. Second, each mineral is assigned the same weight coefficient, which means that every mineral has the same contribution to rock brittleness. This lacks a sufficient scientific basis because there are apparent mechanical differences for various minerals [22]. Third, this method does not take other affecting factors into account, such as rock porosity and rock texture. In this formulation, the brittleness indices of rocks with the same mineral composition but different porosity are consistent. This contradicts the fact that brittleness decreases with increasing porosity [23]. Moreover, rock texture is primarily responsible for brittleness characteristics, such as the laminar structure of shales and the fine-grained micritic textures of carbonate rocks [17,24]. This implies that mineralogical compositions cannot solely be used to accurately estimate rock brittleness.

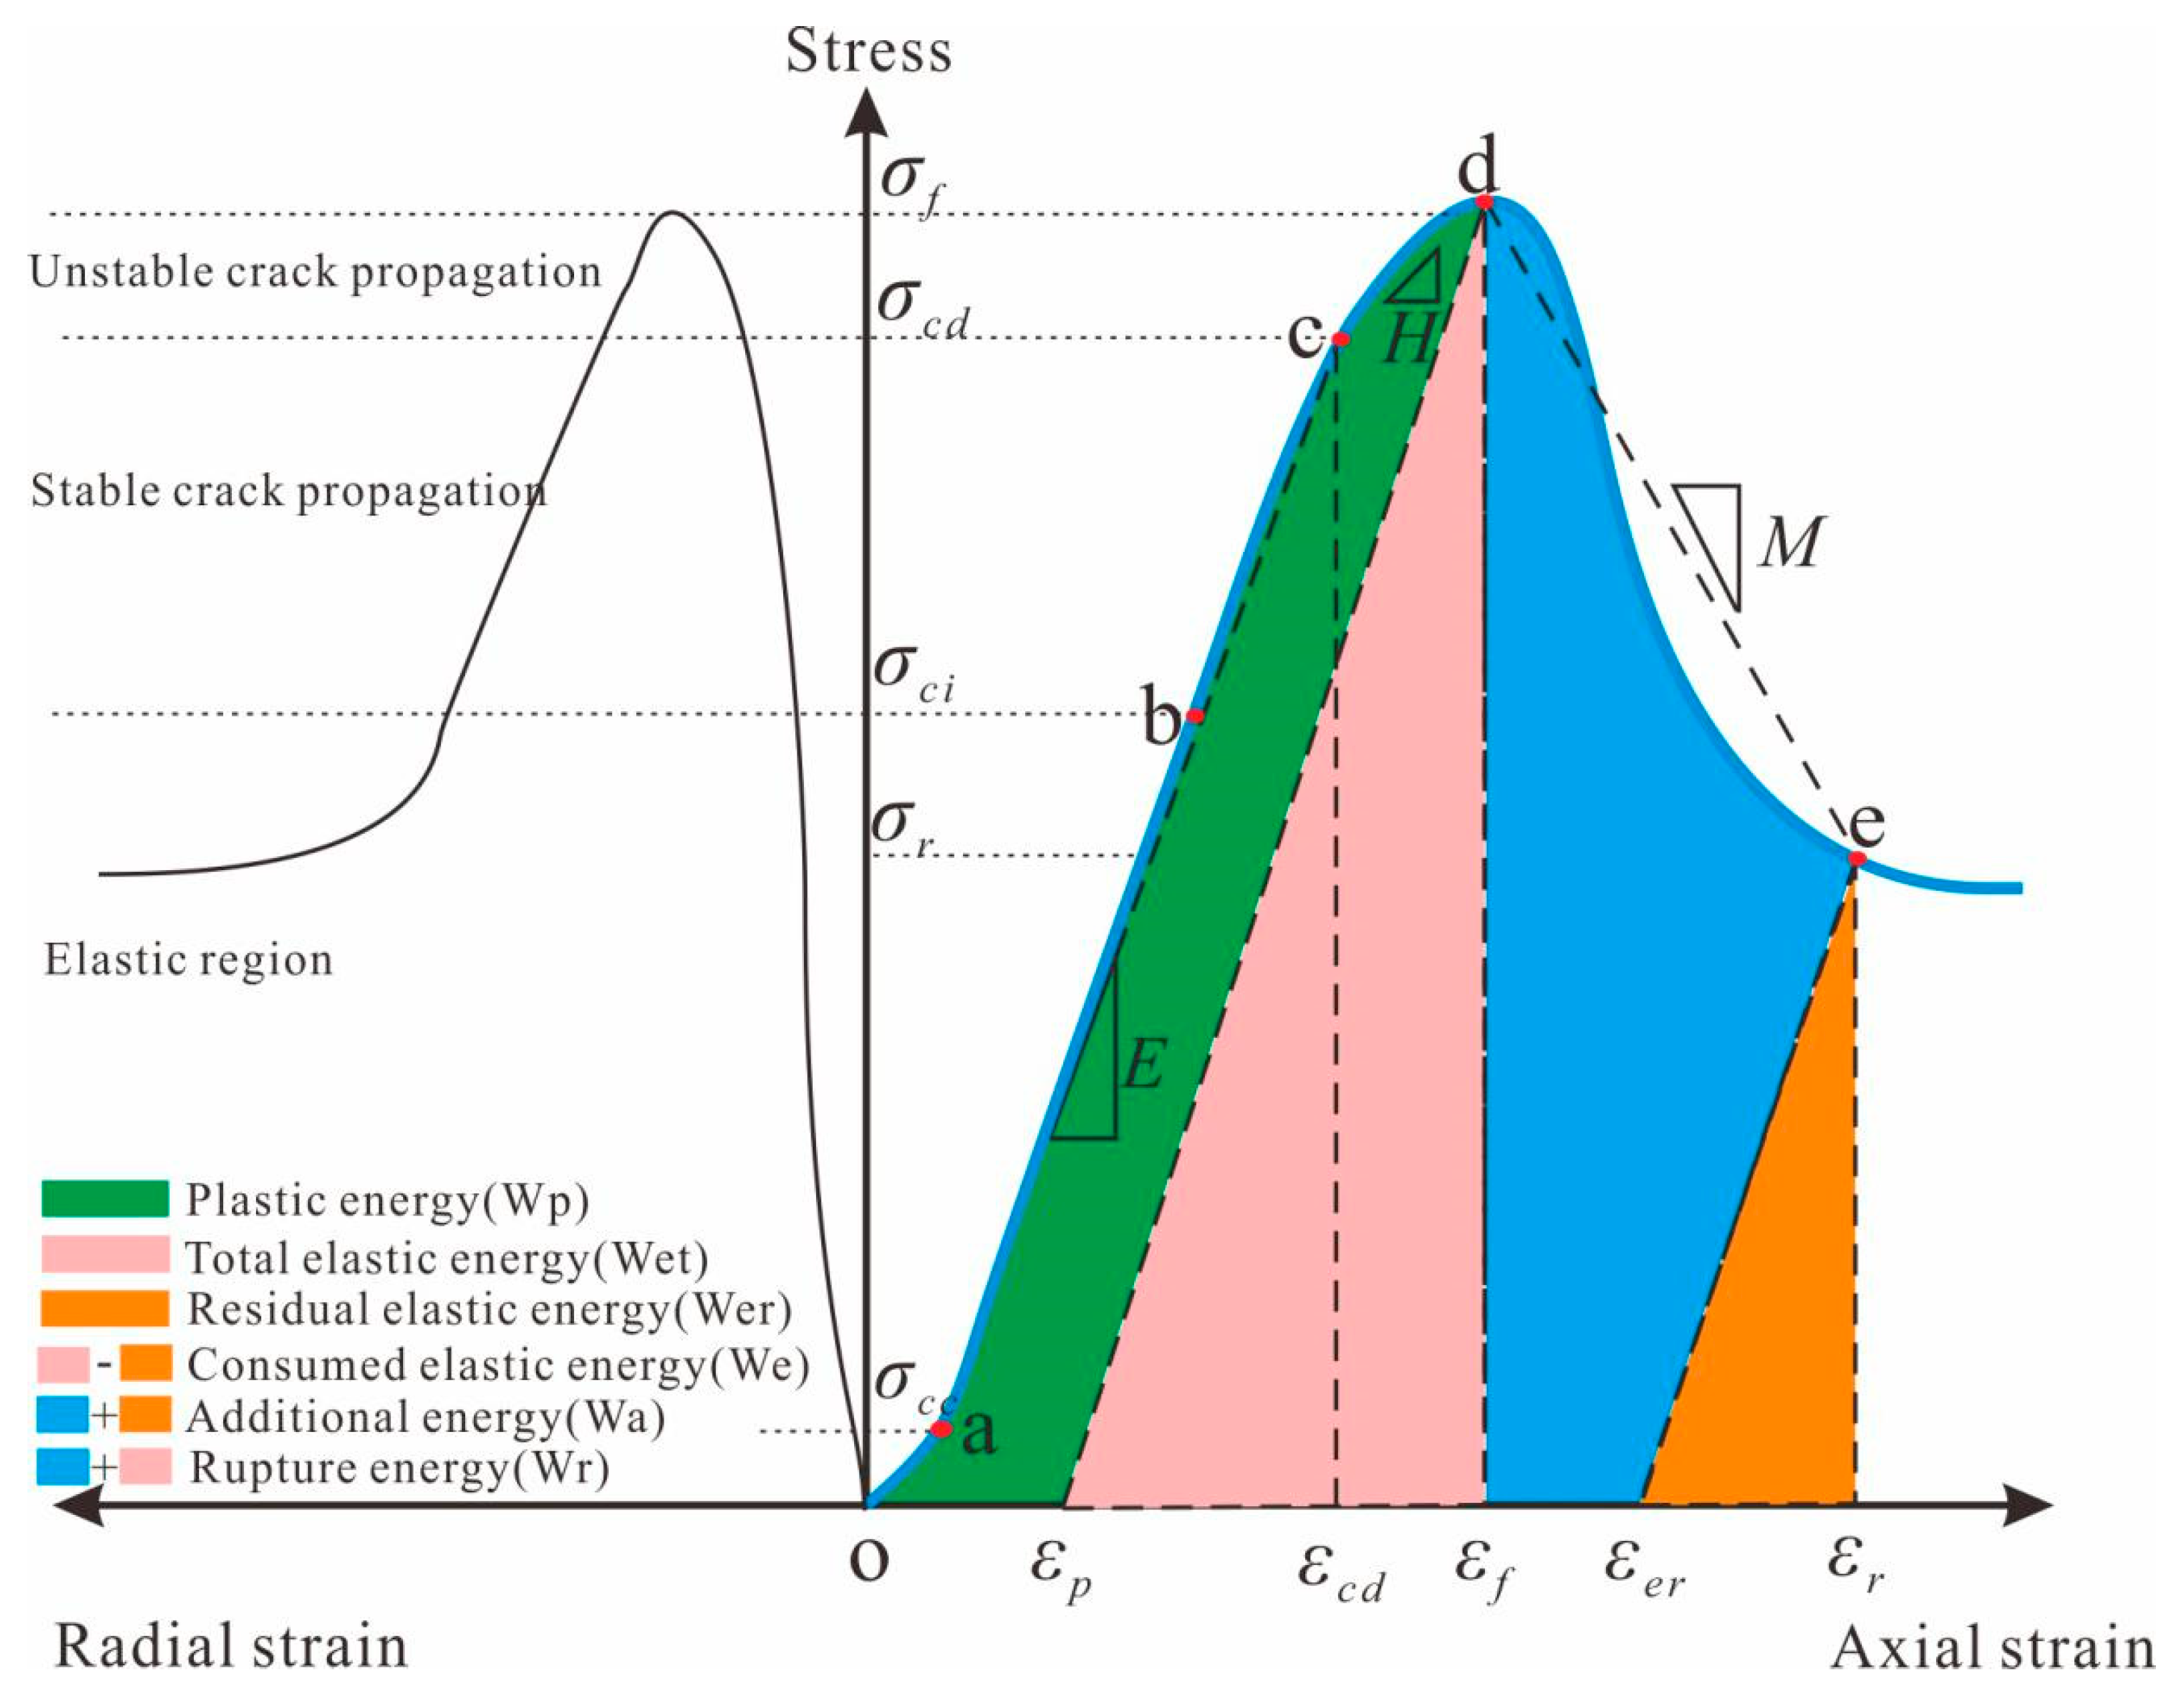
2.3. Energy-Based Brittleness Indices Derived from Rock Stress-Strain Curves

The complete stress-strain curves of a rock sample under external loads show the deformation and rupture characteristics of the sample. Figure 1 illustrates the internal micromechanical mechanisms of rock deformation and failure behaviors under compression loading. The entire failure process can be divided into five stages: (1) oa: Pre-existing micro-cracks and micro-pores close; this stage is terminated at crack closure stress (σcc). (2) ab: Linear elastic deformation of rock occurs with the tangent modulus of Young’s modulus until the crack initiation stress (σci) is reached. σci is the turning point of the rock from elasticity to plasticity, also known as the yield point. (3) bc: Micro-cracks stably propagate before crack damage stress (σcd). (4) cd: Cracks propagate in an unstable manner until the limit strength of the rock is reached at a stress level known as failure stress (σf). (5) de: At the peak stress (σf), the rock is in an unsteady state with high energy. The internal cracked surfaces of the rock intersect then form one or several macro-fracture surfaces. Subsequently, the rock mass slides along the macro-fracture surfaces, and the bearing capacity of the sample rapidly decreases until reaching the residual strength (σr).
The process of rock failure is essentially a balancing process of energy absorption and release [17,25,26,27,28,29]. During the pre-peak stage, the rock undergoes elastic and plastic deformation. The total elastic energy (Wet) accumulated during elastic deformation increases the internal energy of rock. Also, plastic energy (Wp) dissipates during plastic deformation due to crack closure and frictional sliding. A more brittle rock can turn more the absorbed external energy into elastic energy instead of plastic energy, and the more elastic energy accumulated during loading favors rock rupture and fracture extension.
According to the characteristics of rock behavior in the post-peak region, the failure modes were classified into two types [30]. As Figure 2 illustrates, the negative drop modulus (M < 0) corresponds to Class I behavior, which means that additional energy is required to support rock failure as the amount of elastic energy from material is not sufficient. The positive drop modulus (M > 0) corresponds to Class II behavior, which means that rock failure can be self-sustained and fully developed. The excess energy (the yellow area in Figure 2) in Class II failure is consumed to overcome the confinement pressure and transformed into the failure process dynamics [8]. Hydrocarbon-bearing reservoirs are generally characterized by Class I behavior; therefore, Class II behavior is not discussed in this research.
After the peak, the accumulated elastic energy is gradually released to form macro-fractures. However, because of the plasticity of materials and the effect of confining pressure, the elastic energy stored before the peak is not enough for complete self-sustaining rock failure. Therefore, additional energy (the blue area in Figure 2) provided by loading is needed. Compared to brittle rocks, ductile rocks require more additional energy to maintain rupture. At the end of the compression experiment, there is still some energy known as the residual elastic energy (Wer) existing in the rocks.
Overall, the stress-strain curves provide a comprehensive insight into rock deformation and brittle failure mechanisms under various loading conditions. Under certain ambient conditions, all of the internal factors affecting brittleness can be considered in this process. An accurate brittleness evaluation method based on energy balance rule can be obtained through analyzing the entire stress-strain curve. The BI is defined as follows [17]:
B I = 1 2 ( B I 1 + B I 2 ) = 1 2 ( W e W r + W e W e t + W p ) ,
W e t = 1 2 E σ f 2 ,
W e = W e t W e r = 1 2 E ( σ f 2 σ r 2 ) ,
W r = W e t + W a W e r = 1 2 E ( σ f 2 σ r 2 ) + ε f ε r σ d ε ,
W p = W t W e t = 0 ε f σ d ε 1 2 E σ f 2 ,
The corresponding definitions of the calculation parameters are presented in Figure 1. We is the consumed elastic energy, which is the difference between the total elastic energy (Wet) and the residual elastic energy (Wer); Wt is the total consumed energy during the pre-peak stage; Wr represents the rupture energy, which is the sum of the total elastic energy (Wet) and additional energy consumed by rock failure from loading the system (the blue area in Figure 1); and Wp represents the dissipated plastic energy during the pre-peak region.
In this model, BI1 determines the extent to which the fracturing process occurs in a self-sustaining manner. BI2 represents the fraction of the total absorbed energy during the pre-peak region released in the post-peak rupture process. These two values vary in the range from 0 to 1. Accordingly, the value of BI changes continuously from 0 to 1, and the degree of brittleness transforms from full ductility to absolute brittleness.

3. Materials and Measurements

3.1. Materials

Nine drill core samples from well SY3 underwent a series of laboratory tests (Figure 3). Two of the samples are from the Upper Ordovician Baota Formation. The remaining seven are from the Upper Ordovician Wufeng Formation and Lower Silurian Longmaxi Formation, which are important shale gas-bearing layers in the Sichuan Basin and its peripheral regions in southwest China. The paleogeographic settings of these formations in the study area have been reported in previous works [31,32]. Briefly, the upper member of the Baota Formation mainly consists of limestone with polygonal reticulate structures developed in a platform environment. The Wufeng-Longmaxi Formation can be divided into two sections according to their sedimentary facies. The Lower Member of the Wufeng-Longmaxi Formations is dominantly made up of deep black siliceous shale, carbonaceous shale, and gray-black shale [33], indicating a deep-water shelf sedimentary environment. The primary lithology of the Upper Member of the Longmaxi Formation is gray, silty mudstone, and argillaceous siltstone, deposited in a shallow-water shelf sedimentary environment.

3.2. Measurements

Triaxial compression tests were used to evaluate the failure characteristics of the rock samples. The external loading can be described as follows:
σ 1 = σ c + σ a ;   σ 2 = σ 3 = σ c
where σ1, σ2, σ3 are the principal stresses; σa is the axial deviatoric stress; σc is the confining stress.
A TAW-1000 stiff autonomous triaxial compression experimental machine (Aojin industry, Guangdong, China) with a loading capacity of 1000 KN and a maximum confining pressure up to 80 MPa is adopted as the testing apparatus. In this study, confining pressures of 30 MPa were designated for simulating true in-situ stress, and cylindrical samples were cored to 25 mm in diameter and 60 mm in length. Defective rock samples caused during sample preparation were removed. To avoid the influence of the bedding planes and loading rate on rock failure behavior, all specimens were loaded at a strain rate of 0.12 mm/min, and bedding planes were perpendicular to the axis of the cylinders.
After triaxial compression tests, the microstructures of the rock samples were also studied through various analytical methods such as optical microscopy, scanning electron microscopy (SEM). Also, the mineral compositions of the samples were determined by X-ray diffraction analysis (XRD), and the specific method of XRD analysis was consistent with that in reference [34]. The experimental results were shown in Table 1.

4. Results

4.1. The Difference of Mechanism between Diverse Brittleness Indices

The energy-based brittleness indices derived from rock stress-strain curves of the rock samples vary from 0.18 to 0.78 (Table 2). The post-peak curves of samples 1 and 4 sharply dropped from the peak stress (σf) to a low residual stress (σr) (Figure 4). The residual elastic energy (Wer) and post-peak fracture energy (Wr) of samples 1 and 4 are small, indicating that the total elastic energy (Wet) accumulated in pre-peak stage is mostly used for the fracture of samples, and less additional energy (Wa) is needed to maintain the fracture extension during the failure process. This type of rock is conducive to the formation of fractures. Consequently, samples 1 and 4 have high brittleness indices of 0.63 and 0.78, respectively. The post-peak curves of samples 7 and 9 smoothly dropped from the peak stress (σf) to a high residual stress (σr), and the residual elastic energy (Wer) and rupture energy (Wr) are relatively large. This indicates that the consumed elastic energy (We) is insufficient to maintain fractures propagation, and additional (Wa) is necessary, so this type of rock is hard to form fractures. Therefore, samples 7 and 9 have low brittleness indices of 0.28 and 0.18, respectively.

4.2. The Effect of Confining Pressure on Brittleness

According to the classification method of brittle and plastic minerals proposed in [13], sample 3 has a large weight fraction of clay minerals (30%). Sample 8 has a significant weight fraction of brittle minerals (17.8% quartz, 4.3% feldspar, 75.5% carbonate minerals) and low weight fraction of clay minerals (2.2%). However, these two samples both exhibit obvious plastic deformation before the peak, and the plastic energy of samples 3 and 8 are high, 147 and 98, respectively (Table 2). Hence, rock plasticity is not only affected by clay mineral content but also high confining stress. This is consistent with the well-established fact that rocks tend to show higher plastic characteristics at elevated confining stresses [7,21].
In addition, the post-peak curves for all rock samples except for samples 1 and 4 slowly decreased from the peak stress (σf) to residual stress (σr) (Figure 4). The applied confining pressure hinders the radial dilation followed by further blocking the development of the macrocracks during the post-peak region, thus leading to decreased brittleness [35].

5. Discussion

5.1. Correlations of Brittleness and Elastic Parameters

The brittleness index based on elastic parameters are calculated by Equation (1) and compared with the energy-based brittleness indices derived from rock stress-strain curves. There is a negative correlation between these two types of calculations (Figure 5). In order to explain this phenomenon, the relationship between the elastic parameters (Young’s modulus and Poisson’s ratio) and the energy-based brittleness index derived from rock stress-strain curves are analyzed.
The relationship between Young’s modulus and brittleness has been discussed by many scholars. The brittleness evaluation method proposed in [10] supposes that a higher Young’s modulus results in a more brittle rock. In [33], it is believed that a formation with higher Young’s modulus values induces more microcracks, which shows a strong brittleness inducing a more complex hydraulic fracture system. On the contrary, the paper [36] proposes that rocks with a high Young’s modulus only create shorter fracture apertures for their limited deformation ability. In contrast, rocks with a low Young’s modulus tend to form fractures with larger average apertures. This leads to fracturing fluids penetrating the fracture tips quickly, resulting in a greater fracture conductivity. The experimental data in this study indicates that Young’s modulus is negatively correlated with energy-based brittleness indices (Figure 6a). As shown in Figure 6b, samples 5, 7, 8, and 9, which have higher Young’s modulus values, consume less elastic energy (We). Specifically, the stored elastic energy in rocks with higher Young’s modulus values is not enough to self-sustain the development of cracks, leading to the reduction of the brittleness index. The relationship between the stress-strain curve and Young’s modulus also further proves this conclusion (Figure 6c,d). Young’s modulus (E) of the specimens tend to increase with the increasing peak strength (σf) (Figure 7), which is also verified by others [37,38]. Therefore, assuming other parameters remain constant, an increase of Young’s modulus (E) and peak strength (σf) results in decreased the consumed elastic energy (the difference between total elastic energy (Wet) and residual elastic energy (Wer)), and additional energy (the sum of blue area and orange area as shown in Figure 6c,d) is necessary to maintain the development of cracks. This results in the decreased brittleness of the rocks.
The results do not indicate that all materials with a lower Young’s modulus are more brittle. Young’s modulus measures a rock’s hardness rather than brittleness, so materials with higher Young’s modulus are difficult to break down simply due to the higher fracture initiation stress state needed, for example, diamond and granite [39]. On the other hand, complicated networks of fractures are difficult to generate in materials with low Young’s modulus, such as rubber and wax. Therefore, Young’s modulus should have a reasonable range of values for ideal brittle materials. The relationship between Young’s modulus and brittleness can be determined by Equation. (10). When the energy absorbed per unit surface area attains its critical value (GC), fractures propagate along the pre-existing fractures. Materials with lower Gc will generate more fractures, supposing the given energy is kept constant. The critical value (Gc) is defined below [13]:
G c = ( 1 ν 2 ) ( 0.313 + 0.027 × E ) 2 E × 10 3
When Poisson’s ratio (ν) remains constant, the change in Young’s modulus can then analyze the relationship between Gc and E. As Young’s modulus increases, Gc first decreases then increases. When Young’s modulus is 11.6 GPa, Gc has reached its minimum value. However, the value of Young’s modulus is generally greater than 11.6 GPa under in-situ stress for most sedimentary rocks [13], hence rocks with a higher Young’s modulus are difficult to fracture.
Energy-based brittleness indices do not correlate with Poisson’s ratio (Figure 8). Under triaxial compression, the applied confining pressure tends to hinder the radial dilation during the post-peak region. Consequently, most Poisson’s ratio values fluctuate in a small range of 0.2 to 0.3, leading to the weak correlation between Poisson’s ratio and brittleness. This observation is also confirmed by others [17,35].
Because the energy-based brittleness index of rock negatively correlates with Young’s modulus and weakly related to Poisson’s ratio, the brittleness index calculated by elastic parameters is vastly different from the actual brittleness value, that is, the energy-based brittleness index in this study. Therefore, the brittleness evaluation method based on elastic parameters has severe theoretical defects that limit its application.

5.2. Correlations of Brittleness with Mineral Composition

The brittleness index of samples based on mineral composition are calculated following the formula proposed by [13,40]:
B I m i = ( W Q z + W F s p + W C b + W P y ) / W T o t
where BImi is the mineral BI and is dimensionless; WQz is the weight fraction of quartz, %; WFsp is the weight fraction of feldspar, %; WCb is the weight fraction of carbonate minerals, %; WPy is the weight fraction of pyrite, %; and WTot is the weight fraction of total minerals, %.
In this formula, quartz, feldspar, carbonate minerals, and pyrite are regarded as brittle minerals, while clays are regarded as plastic minerals. For the method based on mineral compositions, a higher content of brittle minerals and lower content of plastic minerals leads to a more brittle rock (higher BI). The calculated brittleness indices attained from rock mineral compositions are vastly higher than the energy-based brittleness index (Figure 9). The mineral BI of samples 1, 2, 3, 4 and 6 are in the range of 0.70–0.84, with an average of 0.8. The energy-based brittleness indices of these five samples are in the range of 0.45–0.78, with an average of 0.6. Although there is not a strong positive correlation between these two calculations for these five samples, generally speaking, the differences between these two BI are still within a reasonable range. The minor difference may be influenced by other factors, such as rock texture, the content of organic matter and porosity. However, it is worth noting that the mineral BI of samples 5, 7, 8, and 9 are high, in the range of 0.81–0.98, with an average of 0.89, but their energy-based brittleness indices are low, in a range of 0.18–0.45, with an average of 0.28. There is a considerable difference between the two calculation methods for these four samples (marked by a red dotted line in Figure 9).
The quartz and carbonate contents in samples 5, 7, 8, and 9 are high, exceeding 70% (Table 2). The Young’s modulus of these four samples is also relatively high, with an average of 48 GPa. This indicates that they have a stronger cohesive strength. Based on the SEM results (Figure 10), the minerals in these four samples are tightly structured and cemented, and there are few weak mechanical interfaces in these rocks (Figure 10a). The cracks that do exist terminate into the uniform and compact rock texture (Figure 10b). This indicates why the four specimens are so hard to be fractured, which is a result of their excessive amount of single brittle mineral (quartz or carbonate minerals). By contrast, although the sample 1, 2, 4, and 6 mainly consist of quartz, the content of quartz is less than 70%. In addition, appropriate content of various brittle minerals and clay minerals in these four samples form many weak mechanical planes existing at the boundaries of different grains (Figure 10c). These weak structural surfaces are conducive to crack initiation, then the generated cracks bypass mineral particles and extend to interact with other cracks, leading to the formation of a complex network cracking system (Figure 10d). Overall, the excessive content of quartz or carbonate minerals hinder fracture initiation and propagation.
Because an excessive amount of single brittle minerals (quartz or carbonate minerals) diminishes rock brittleness, the relationship between the brittleness and various minerals (quartz, carbonate minerals, feldspar and clay minerals) are further analyzed. As Figure 11a illustrates, when the quartz content is less than 70%, the rock brittleness increases with the increase of the quartz content. However, when quartz content is greater than 70%, rock brittleness suddenly decreases. The variation tendency of Young’s modulus of a rock with increasing quartz contents is the opposite of the brittleness index. This is consistent with the results discussed in Section 5.1 (Figure 11b). In general, the content of terrigenous minerals (quartz, feldspar, and clay minerals) in sedimentary rocks is positively correlated with each other. Furthermore, the excessive amount of quartz is mainly authigenic quartz (Figure 12a) [41], and the content of authigenic quartz is unrelated to the content of terrigenous minerals [42]. Therefore, when the content of quartz is low (<20%), such as samples 8 and 9 (Figure 12b), the content of other terrigenous minerals (feldspar and clay minerals) are also low. This indicates that the rock consists of carbonate minerals, and the compact texture of this type of rock leads to poor rock brittleness. When the quartz content is 20–70%, the existence of terrigenous quartz indicates that the rocks also contain a moderate amount of other terrigenous minerals (feldspar and clay) (Figure 12c), along with variable amounts of carbonate minerals. In this case, the rock contains many weak mechanical structural surfaces, hence brittleness increases with the increase of quartz content. When quartz content exceeds 70% in rocks, such as samples 5 and 7 (Figure 12d), the excessive amount of quartz can enhance Young’s modulus, leading to decreased rock brittleness.
As Figure 13a illustrates, when the carbonate mineral content is low (<15%), there is no significant correlation between the brittleness index and carbonate mineral content. In this case, when the rocks are mainly composed of quartz, they show poor brittleness, such as samples 5 and 7. By contrast, when the quartz content of rocks is in an appropriate range of 20–70%, the rocks show good brittleness, such as samples 1 and 4. For sample 2, the carbonate mineral content was 40%, and rock brittleness was 0.58, indicating that an appropriate amount of carbonate minerals benefit rock brittleness. For samples 8 and 9, which both have a high content of carbonate minerals (>70%), the brittleness coefficients suddenly decrease. Similarly, the Young’s modulus of samples 8 and 9 are also relatively high (Figure 13b).
Feldspar content is positively correlated with the energy-based brittleness index (Figure 14). When the content of feldspar is low (<10%), such as samples 5, 7, 8, and 9, because a large proportion of feldspar is of terrigenous origin, the content of clay minerals from the same terrigenous source is also relatively low (Figure 15). This indicates that the rock contains an excessive amount of quartz or carbonate minerals, resulting in poor brittleness of the rock. With the increase of feldspar content (>10%), the content of terrigenous clay minerals and quartz in rocks also increases. In this case, the rocks are no longer dominated by a single mineral, and many weak mechanical structural surfaces exist between different mineral boundaries in the rocks. This leads to the enhancement of rock brittleness.
As Figure 16 illustrates, when the clay mineral content is low (<20%), rock brittleness indices increase with the increase of clay mineral content. It should be noted that this phenomenon is mainly caused by the existence of quartz or carbonate minerals, instead of the increase of clay mineral content. This variation tendency and its reasons are the same as that of feldspar. However, when the content of clay minerals exceeds 20%, such as in sample 3, the brittleness suddenly decreases, which indicates that clay minerals decrease the brittleness of rocks.
It is concluded that quartz can appropriately characterize the shale brittleness among all minerals. Shale brittleness increases with the increase of quartz content, but an excessive amount of quartz (>70%) decreases shale brittleness.

5.3. Correlation of Brittleness and Fracability

As research continues, some have argued that it is not enough to merely use the brittleness index to select fracturing layers [15,16,17]. The ‘fracability index (FI)’ is a new term that can evaluate the degree to which shale gas and oil reservoirs can be fractured [18]. In recent years, numerous quantification methods for evaluating the fracability of unconventional oil and gas reservoirs have been proposed [43,44,45]. In these methods, apart from BI, other main factors controlling fracability are selected to calculate formation fracability, such as fracture toughness, diagenesis, natural crack density, differential horizontal stress, and so on. However, it should be noted that there are several problems with these methods. First, the BI derived from rock mineral compositions or elastic parameters are utilized to calculate FI in these methods, yet this has been proven to be incorrect in previous sections of this paper. Second, it is hard to develop an effective quantification method of fracability by randomly selecting the parameters. Formation fracability is a complicated function of various rock compositional, textural, physical, and mechanical properties under specific in-situ temperatures and pressures. Other dominant factors may be neglected in these methods. Third, these fracability-related factors are not independent and can have a similar impact on fracturing behavior. For example, rock elastic parameters are closely correlated with the mineral composition and subjected to in-situ stress. Consequently, in these methods, the effect of rock mineral content on fracability is calculated repeatedly, which is not reasonable. Hence, to determine the correlation of brittleness and fracability, we need to assess formation fracability on the premise of evaluating the brittleness index scientifically, rather than randomly.
It can be stated that scientific fracability evaluation needs to comprehensively combine all affecting factors according to rock failure mechanisms. Fracability is determined by not only the petrophysical properties of rock but also geological conditions, including ambient pressure, temperature, and pre-existing (natural) fractures. The influence of petrophysical properties on fracability can be expressed by energy-based BI, which has been proven correct in this paper. The next step is to discuss the impact of geological conditions on fracability.

5.3.1. In-Situ Earth Stresses

In the principal stress of three directions, the minimum horizontal stress (Sh) is extremely significant when designing fracturing treatments [46]. The simulated fractures will grow perpendicular to Sh, which urges the induced fracture to close. In addition, as the Sh increases, the rock failure mode changes from tensile failure to shear failure (Figure 17), limiting the vertical growth of fractures [47]. Therefore, for formations with higher Sh, it is difficult for fractures to extend vertically to connect other pre-existing fractures [48].
The minimum horizontal stresses can be estimated using the following equation [49,50]:
S h = ν 1 ν × ( S V α P P ) + α P P + E ν ε 1 ν 2
where ν is Poisson’s ratio; SV is the vertical stress, psi; α is the Biot’s constant and is a dimensionless value; ε is the tectonic strain parameter, psi; PP is pore pressure, psi.

5.3.2. Temperature Effects

Due to thermally activated deformation mechanisms, for instance, the dislocation slide of clay minerals, temperature influences the brittleness of shales. Typically, shales show a transition from brittle to more ductile only when temperature increases by several tens of degrees [3,20]. However, the vertical thickness of the target interval in a region is typically not large enough (<100 m). Assuming a geothermal gradient of 25 °C/km (uncertainty <30%), temperature varies only slightly in the objective layers, which yields no significant change of rock mechanics. Accordingly, the effect of temperature on formation fracturing can be neglected.

5.3.3. Natural Fractures

During hydraulic fracturing treatment, natural fractures can facilitate the leakage of fracturing fluid into reservoirs to generate complex hydraulic fractures network, constituting the high-speed path of shale gas output [51,52]. Therefore, to some extent, formations with denser natural fractures are equivalent to a higher fracability. Natural cracks are not taken into consideration in the fracability quantification model in this study. That does not mean that pre-existing fractures are neglected during the process of hydraulic fracturing; rather, formations with denser natural fractures are considered separately. The reasons are as follows. First, the crack density and its effect on fracability is extremely difficult to be quantitatively evaluated [13,53]. Second, fractured strata can be detected by engineering techniques, such as tiltmeters, well logging, and micro-seismic events. These formations should not simply be considered as good fractured layers but should be judged whether they intersect aquifer formations and faults to prevent the upward migration of shale gas. Third, under the same crustal stress state, brittle rocks may contain more abundant fractures compared to ductile rocks [54]. In the history of structural geology, if there is no substantial difference in the tectonic stress between different strata, the degree of fracture development depends on the brittleness characteristic of the rock. In this regard, to some extent, the brittleness of the rock represents the degree of development of natural fractures. Overall, natural cracks are no longer considered as a separate factor in our analysis.
In conclusion, the energy-based brittleness index derived from stress-strain curves and minimum horizontal stress are the essential parameters for fracability. Therefore, a new method of fracability evaluation is proposed as follows:
F I = B I n + S h _ n 2 ,
B I n = B I B I min B I max B I min ,
S h _ n = S h _ max S h S h _ max S h _ min ,
where BIn and Sh_n are normalized brittleness and normalized minimum horizontal stresses. Max and min are the maximum and minimum values of corresponding variables for the investigated formation, respectively.
FI is in the range of 0 to 1.0. A formation with FI = 1.0 is the best candidate for hydraulic fracturing, and a formation with FI = 0 is the worst candidate for hydraulic fracturing. In this framework, the most suitable fracturing layers possess a high brittleness index and low minimum horizontal stress. The formation with lower BI and higher Sh compared to the adjacent formations is regarded as a fracture barrier. The main purpose of fracture design is not only the detection of potential layers but also fracture barriers [47]. Fracture barriers not only limit the vertical growth of hydraulic fractures but can also prohibit hydraulic fractures from invading water-bearing layers or fault zones.
The minimum horizontal stress and fracability index of the formations in which the nine samples located are calculated and summarized in Table 3. Additionally, according to the formula for Sh (Equation (12)), the minimum horizontal stress increases with the increased Poisson’s ratio which ranges between 0.1 and 0.45. The Poisson’s ratio of the nine samples are positively correlated with the minimum horizontal stress of the formations in which the samples are located (Figure 18). Small fluctuation in Poisson’s ratio can also cause substantial changes in the minimum horizontal stress. Therefore, Poisson’s ratio indirectly affects the fracability through controlling the minimum horizontal stress, and the fracability index decreases with an increasing Poisson’s ratio (Figure 19).

6. Conclusions

The following conclusions are drawn from this study:
  • The brittleness index assessment methods based on rock elastic parameters and mineral compositions lack a scientific theory basis. The brittleness index derived from stress-strain curves according to energy conservation law is reliable because it can comprehensively reflect the deformation and rupture characteristic of rock.
  • For rocks with a higher Young’s modulus, the consumed elastic energy (We) is insufficient to generate a complex fracture network, leading to the reduced rock brittleness index. Because the surrounding stress limits the radial dilation of rocks, there are weak correlations between Poisson’s ratio and brittleness.
  • When a rock is composed of a variety of brittle minerals of moderate content, many weak structural planes exist between different mineral particles, which contributes to the development of cracks. Therefore, this type of rock is more brittle. By contrast, rocks which mainly consist of excessive amount of quartz or carbonate minerals are characterized by high cohesiveness. There are few weak structural planes in this type of rock, which leads to poor brittleness.
  • The premise of fracability evaluation is to accurately assess rock brittleness. Apart from the brittleness index, the minimum horizontal principal stress should also be regarded as an essential parameter in selecting potential fracturing layers. The most suitable fracturing layers possess a high brittleness index and low minimum horizontal stress. Poisson’s ratio positively correlates with the minimum horizontal stress. Therefore, with the increased Poisson’s ratio, the minimum horizontal stress increases, resulting in a reduced fracability index.

Author Contributions

Y.Y. conceived and designed the experiments; Y.Y. and Z.X. performed the experiments; Y.Y. wrote the paper; S.T. and Z.X. revised the paper. All authors have read and agreed to the published version of the manuscript.

Funding

The authors would like to thank National Science and Technology Major Project of China (grant no. 2017ZX05035) and Project funded by China Postdoctoral Science Foundation (grant no. 2019M660737).

Acknowledgments

The authors gratefully acknowledge the China National Administration of Coal Geology for sample support and their permission to publish the results of this study. We also greatly thank the anonymous reviewers and editors for their critical comments and valuable suggestions, which were very helpful to improve the manuscript.

Conflicts of Interest

The authors declare no conflict of interest.

References

  1. King, G. Thirty years of gas shale fracturing: What have we learned? In Proceedings of the Society of Petroleum Engineers (SPE) Annual Technical Conference and Exhibition, Florence, Italy, 19–22 September 2010. [Google Scholar]
  2. Zhou, J.; Huang, H.; Milind, D. A new physics-based modeling of multiple non-planar hydraulic fractures propagation. In Proceedings of the Unconventional Resources Technology Conference, San Antonio, TX, USA, 20–22 July 2015. [Google Scholar]
  3. Rybacki, E.; Meier, T.; Dresen, G. What controls the mechanical properties of shale rocks? Part II: Brittleness. J. Pet. Sci. Eng. 2016, 144, 39–58. [Google Scholar] [CrossRef] [Green Version]
  4. Hetenyi, M. Handbook of Experimental Stress Analysis; John Wiley & Sons Press: New York, NY, USA, 1950; ISSN 0016-0032. [Google Scholar]
  5. Ramsay, J.G. Folding and Fracturing of Rocks; McGraw-Hill Press: London, UK, 1967; pp. 44–47. [Google Scholar]
  6. Andreev, G.E. Brittle Failure of Rock Materials: Test Results and Constitutive Models; Brookfield Press: Rotterdam, The Netherlands, 1995; p. 446. [Google Scholar]
  7. Jaeger, J.C.; Cook, N.G.W.; Zimmerman, R.W. Fundamentals of Rock Mechanics; Blackwell Press: Oxford, UK, 2007. [Google Scholar]
  8. Tarasov, B.; Potvin, Y. Universal criteria for rock brittleness estimation under triaxial compression. Int. J. Rock Mech. Min. Sci. 2013, 59, 57–69. [Google Scholar] [CrossRef]
  9. Jahandideh, A.; Jafarpour, B. Optimization of hydraulic fracturing design under spatially variable shale fracability. J. Pet. Sci. Eng. 2016, 138, 174–188. [Google Scholar] [CrossRef]
  10. Rickman, R.; Mullen, M.J.; Petre, J.E.; Grieser, W.V.; Kundert, D. A practical use of shale petrophysics for stimulation design optimization: All shale plays are not clones of the Barnett Shale. In Proceedings of the Society of Petroleum Engineers (SPE) Annual Technical Conference and Exhibition, Denver, CO, USA, 21–24 September 2008. [Google Scholar]
  11. Jarvie, D.M.; Hill, R.J.; Ruble, T.E.; Pollastro, R.M. Unconventional shale-gas systems: The Mississippian Barnett shale of north-central Texas as one model for thermogenic shale-gas assessment. AAPG Bull. 2007, 91, 475–499. [Google Scholar] [CrossRef]
  12. Wang, F.P.; Gale, J.F. Screening criteria for shale-gas systems. Gulf Coast Assoc. Geol. Soc. 2009, 59, 779–793. [Google Scholar]
  13. Jin, X.; Shah, S.N.; Roegiers, J.C.; Zhang, B. An integrated petrophysics and geomechanics approach for fracability evaluation in shale reservoirs. Soc. Pet. Eng. J. 2015, 20, 518–526. [Google Scholar] [CrossRef]
  14. Hajiabdolmajid, V.; Kaiser, P. Brittleness of rock and stability assessment in hard rock tunneling. Tunn. Undergr. Space Technol. 2003, 18, 35–48. [Google Scholar] [CrossRef]
  15. Holt, R.M.; Fjar, E. Brittleness of shales: Relevance to borehole collapse and hydraulic fracturing. J. Pet. Sci. Eng. 2015, 131, 200–209. [Google Scholar] [CrossRef]
  16. Bai, M. Why are Brittleness and Fracability not Equivalent in Designing Hydraulic Fracturing in Tight Shale Gas Reservoirs. Petroleum 2016, 2, 1–19. [Google Scholar] [CrossRef] [Green Version]
  17. Rahimzadeh, K.I.; Ameri, M.; Molladavoodi, H. Shale brittleness evaluation based on energy balance analysis of stress-strain curves. J. Pet. Sci. Eng. 2018, 167, 1–19. [Google Scholar] [CrossRef]
  18. Jin, X.; Shah, S.N.; Roegiers, J.-C.; Zhang, B. Fracability evaluation in shale reservoirs—An integrated petrophysics and geomechanics approach. In Proceedings of the Society of Petroleum Engineers (SPE) Annual Technical Conference and Exhibition, The Woodlands, TX, USA, 4–6 February 2014. [Google Scholar]
  19. Altamar, R.; Marfurt, K. Mineralogy-based brittleness prediction from surface seismic data: Application to the Barnett Shale. Interpretation 2014, 2, T1–T17. [Google Scholar]
  20. Rybacki, E.; Reinicke, A.; Meier, T.; Makasi, M.; Dresen, G. What controls the mechanical properties of shale rocks?—Part I: Strength and Young’s modulus. J. Pet. Sci. Eng. 2015, 135, 702–722. [Google Scholar] [CrossRef]
  21. Fjæret, E.; Holt, R.M.; Horsrud, P.; Raaen, A.M.; Risnes, R. Petroleum Related Rock Mechanics, 2nd ed.; Elsevier Press: Amsterdam, The Netherlands, 2008; p. 491. ISBN 978-0-444-50260-5. [Google Scholar]
  22. Gholami, R.; Rasouli, V.; Sarmadivaleh, M.; Minaeian, V.; Fakhari, N. Brittleness of gas shale reservoirs: A case study from the north Perth basin, Australia. J. Nat. Gas Sci. Eng. 2016, 33, 1244–1259. [Google Scholar] [CrossRef] [Green Version]
  23. Heidari, M.; Khanlari, G.R.; Torabi, K. Effect of Porosity on Rock Brittleness. Rock Mech. Rock Eng. 2014, 47, 785–790. [Google Scholar] [CrossRef]
  24. Zhou, H.X.; Wang, G.M.; Cao, Y.C. Controlling effect of texture on fracability in lacustrine fine-grained sedimentary rocks. Mar. Pet. Geol. 2019, 101, 195–210. [Google Scholar]
  25. Brace, W.F.; Paulding, B.R.; Scholz, C. Dilatancy in fracture of crystalline rocks. J. Geophys. Res. 1966, 71, 3939–3953. [Google Scholar] [CrossRef]
  26. Goodman, R.E. Introduction to Rock Mechanics, 2nd ed.; John Wiley & Sons Press: New York, NY, USA, 1989. [Google Scholar]
  27. Ranjith, P.G.; Jasinge, D.; Song, J.Y.; Choi, S.K. A study of the effect of displacement rate and moisture content on the mechanical properties of concrete: Use of acoustic emission. Mech. Mater. 2008, 40, 453–469. [Google Scholar] [CrossRef]
  28. Ai, C.; Zhang, J.; Li, Y.W.; Zeng, J.; Yang, X.L.; Wang, J.G. Estimation criteria for rock brittleness based on energy analysis during the rupture process. Rock Mech. Rock Eng. 2016, 49, 4681–4698. [Google Scholar] [CrossRef]
  29. Kumari, W.G.P.; Ranjith, P.G.; Perera, M.S.A.; Shao, S.; Chen, B.K.; Lashin, A.; Rathnaweera, T.D. Mechanical behaviour of Australian Strathbogie granite under in-situ stress and temperature conditions: An application to geothermal energy extraction. Geothermics 2017, 65, 44–59. [Google Scholar] [CrossRef]
  30. Wawersik, W.R.; Fairhurst, C. A study of brittle rock fracture in laboratory compression experiments. Int. J. Rock. Mech. Min. Sci. 1970, 7, 561–575. [Google Scholar] [CrossRef]
  31. Yan, D.T.; Chen, D.Z.; Wang, Q.C.; Wang, J.G. Geochemical changes across the ordovician-silurian transition on the yangtze platform, South China. Sci. China Ser. D Earth Sci. 2009, 1, 40–56. [Google Scholar] [CrossRef]
  32. Huang, L.Q.; Liu, W.; Bo, D.Y. Characteristics, Petrogenesis and Resource Significance of the Limestone with Polygonal Reticulate Structure of Pagoda Formation, in Northwestern Hunan Province. Earth Sci. 2019, 44, 399–414. [Google Scholar]
  33. Liu, S.; Deng, B.; Zhong, Y.; Ran, B.; Yong, Z.; Sun, W. Unique geological features of burial and superimposition of the Lower Paleozoic shale gas across the Sichuan Basin and its periphery. Earth Sci Front. 2016, 23, 11–28. [Google Scholar]
  34. Xi, Z.D.; Tang, S.H.; Wang, J. The reservoir characterization and shale gas potential of the Niutitang formation: Case study of the SY well in northwest Hunan Province, South China. J. Pet. Sci. Eng. 2018, 171, 687–703. [Google Scholar] [CrossRef]
  35. Shimizu, H.; Ito, T. A study of the effect of brittleness on hydraulic fracture complexity using a flow-coupled discrete element method. J. Pet. Sci. Eng. 2018, 160, 372–383. [Google Scholar] [CrossRef]
  36. Hiyama, M.; Shimizu, H.; Ito, T.; Tamagawa, T.; Tezuka, K. Distinct Element Analysis for hydraulic fracturing in shale-effect of brittleness on the fracture propagation. In Proceedings of the 47th US Rock Mechanics/Geomechanics Symposium, American Rock Mechanics Association, San Francisco, CA, USA, 23–26 June 2013. [Google Scholar]
  37. Akinbinu, V.A. Relationship of brittleness and fragmentation in brittle compression. Eng. Geol. 2017, 221, 82–90. [Google Scholar] [CrossRef]
  38. Zhou, X.P.; Lian, Y.J.; Wong, L.N. Understanding the fracture behavior of brittle and ductile multi-flawed rocks by uniaxial loading by digital image correlation. Eng. Fract. Mech. 2018, 199, 438–460. [Google Scholar] [CrossRef]
  39. Schuyler, J.N.; Mclennan, J.D. Interaction of geology, mechanical properties and in-situ stresses in hydraulic fracturing: Rock Mechanics in Productivity and Protection. Int. J. Rock Mech. Min. Sci. 1985, 22, 145–156. [Google Scholar] [CrossRef]
  40. Moghadam, A.; Harris, N.B.; Ayranci, K. Brittleness in the Devonian Horn River shale, British Columbia, Canada. J. Nat. Gas Sci. Eng. 2019, 62, 247–258. [Google Scholar] [CrossRef]
  41. Xi, Z.D.; Tang, S.H.; Zhang, S.H. Characterization of quartz in the Wufeng Formation in northwest Hunan Province, south China and its implications for reservoir quality. J. Pet. Sci. Eng. 2019, 179, 979–996. [Google Scholar] [CrossRef]
  42. Xi, Z.D.; Tang, S.H.; Li, J. Pore characterization and the controls of organic matter and quartz on pore structure: Case study of the Niutitang Formation of northern Guizhou Province, South China. J. Nat. Gas Sci. Eng. 2019, 61, 18–31. [Google Scholar] [CrossRef]
  43. Wu, J.J.; Zhang, S.H.; Cao, H. Fracability evaluation of shale gas reservoir-A case study in the Lower Cambrian Niutitang formation, northwestern Hunan, China. J. Pet. Sci. Eng. 2018, 164, 675–684. [Google Scholar] [CrossRef]
  44. Wang, D.B. A novel experimental approach for fracability evaluation in tight-gas reservoirs. J. Nat. Gas Sci. Eng. 2015, 23, 239–249. [Google Scholar] [CrossRef]
  45. Fu, H.J.; Wang, X.Z.; Zhang, L.X. Geological controls on artificial fracture networks in continental shale and its fracability evaluation: A case study in the Yanchang Formation, Ordos Basin, China. J. Nat. Gas Sci. Eng. 2015, 26, 1285–1293. [Google Scholar] [CrossRef]
  46. Willis, R.B.; Fontaine, J.S.; Owlen, P.L. Geology and geometry: A review of factors affecting the effectiveness of hydraulic fracturing. In Proceedings of the Society of Petroleum Engineers (SPE) Annual Technical Conference and Exhibition, Dallas, TX, USA, 9–12 October 2005; pp. 1–8. [Google Scholar]
  47. Economides, M.J.; Nolte, K.G. Reservoir Stimulation, 3rd ed.; John Wiley & Sons Press: New York, NY, USA, 2000. [Google Scholar]
  48. David, J.; Breig, J.; LeCompte, B.; Kopal, M. Effective geochemical and geomechanical characterization of shale gas reservoirs from the wellbore environment: Caney and the woodford shale. In Proceedings of the Society of Petroleum Engineers (SPE) Annual Technical Conference and Exhibition, The Woodlands, TX, USA, 31 March–1 April 2009; pp. 1–20. [Google Scholar]
  49. Biot, M.A. General theory of three-dimensional consolidation. J. Appl. Phys. 1941, 12, 155–164. [Google Scholar] [CrossRef]
  50. Engelder, T.; Fischer, M.P. Influence of poroelastic behavior on the magnitude of minimum horizontal stress, Sh in overpressured parts of sedimentary basins. Geology 1994, 22, 949–952. [Google Scholar] [CrossRef]
  51. Ni, X.M.; Wang, Y.B.; Jie, M.X. Stress influence in different tectonic positions on fracturing interstitial morphology. J. China Coal Soc. 2008, 33, 505–508. [Google Scholar]
  52. Tang, S.H.; Zhu, B.C.; Yan, Z.F. Effect of crustal stress on hydraulic fracturing in coalbed methane wells. J. China Coal Soc. 2011, 36, 65–69. [Google Scholar]
  53. Tang, H.; Li, S.; Zhang, D. The effect of heterogeneity on hydraulic fracturing in shale. J. Pet. Sci. Eng. 2017, 162, 292–308. [Google Scholar] [CrossRef]
  54. Li, Z.; Li, L.; Li, M. A numerical investigation on the effects of rock brittleness on the hydraulic fractures in the shale reservoir. J. Nat. Gas Sci. Eng. 2018, 50, 22–32. [Google Scholar] [CrossRef]
Figure 1. Typical compression stress-strain curve and associated deformation and failure characteristics for brittle rocks. σcc: crack closure stress; σci: crack initiation stress; σcd: crack damage stress; σf: failure stress; σr: residual stress; εp: plastic strain; εcd: strain at crack damage threshold; εf: failure strain; εr: residual strain; E: Young’s modulus; H: hardening modulus and M: drop modulus (modified from [17]).
Energies 13 00388 g001
Figure 2. Post-peak energy balance for rocks of class I and class II, E: Young’s modulus; M: drop modulus (modified from [8]).
Energies 13 00388 g002
Figure 3. Geological drilling histograms of the Wufeng-Longmaxi Formations from well SY3.
Energies 13 00388 g003
Figure 4. Stress-strain curves of different samples under triaxial compression.
Energies 13 00388 g004
Figure 5. Comparison between the energy-based BI and elastic BI.
Energies 13 00388 g005
Figure 6. The relationship between brittleness index and Young’s modulus. (a) A negative correlation of Young’s modulus and energy-based BI; (b) Samples 5, 7, 8, and 9 with higher Young’s modulus consume less elastic energy (We, the difference between Wet and Wer); (c,d). The change of energy with the increase of Young’s modulus and peak strength (σf). Wp (plastic energy), Wet (total elastic energy), Wer (residual elastic energy).
Energies 13 00388 g006
Figure 7. The relationship between Young’s modulus and peak strength.
Energies 13 00388 g007
Figure 8. The relationship between brittleness index and Poisson’s ratio.
Energies 13 00388 g008
Figure 9. Comparison between the energy-based BI and the mineral BI.
Energies 13 00388 g009
Figure 10. Microstructural characteristics of rock samples in SEM. (a) Sample 5 mainly consists of one brittle mineral, and there are few weak structural planes; (b) A crack bypasses a particle and extends a short distance around the grain, and then is terminated due to the uniform and compact rock texture in sample 5; (c) Sample 4 is made up of appropriate content of various brittle minerals, so there are many weak structural planes between different mineral particles; (d) When the crack propagates, it connects the weak structural surface existing along the edge of the grains, leading to a longer distance extension in sample 4.
Energies 13 00388 g010
Figure 11. (a) Relationship between energy-based BI and quartz content; (b) Relationship between Young’s modulus and quartz content.
Energies 13 00388 g011
Figure 12. Microstructural characteristics of rock samples under an optical microscope and SEM; Qz (quartz); Fsp (feldspar); Cb (carbonate minerals). (a) Amount of authigenic quartz developed in sample 5; (b) Sample 9 mainly consists of carbonate minerals (75.7%), leading to high cohesion, and the rhombic cleavage of calcite is visible; (c) Microstructural characteristics of sample 3 in SEM, sample 3 is made up of the ideal content of various minerals (45% quartz, 16% feldspar, and 30% clay minerals), and the amount of weak mechanical structural surfaces in the rock is conducive to the development of fractures. (d). Under SEM, an excessive amount of quartz (72%) in sample 5 makes it hard to form fractures.
Energies 13 00388 g012
Figure 13. (a) Relationship between energy-based BI and carbonate mineral content; (b) Relationship between Young’s modulus and carbonate minerals content.
Energies 13 00388 g013
Figure 14. The relationship between energy-based BI and feldspar content.
Energies 13 00388 g014
Figure 15. The relationship between the content of clay minerals and feldspar content.
Energies 13 00388 g015
Figure 16. The relationship between energy-based BI and the content of clay minerals.
Energies 13 00388 g016
Figure 17. Influence of minimum horizontal stress (Sh) on failure mode.
Energies 13 00388 g017
Figure 18. The relationship between minimum horizontal stress and Poisson’s ratio.
Energies 13 00388 g018
Figure 19. The relationship between fracability index and Poisson’s ratio.
Energies 13 00388 g019
Table 1. Summary of measured compositional properties of tested samples. Qz (quartz), Fsp (feldspar), Py (pyrite), Cb (carbonate minerals), TOC (total organic carbon).
SamplesFormationQz (wt%)Fsp (wt%)Cb (wt%)Clay (wt%)Py (wt%)TOC (wt%)
1Longmaxi48.020.011.019.02.00.22
230.010.040.016.04.01.92
345.016.04.030.05.01.65
4Wufeng62.016.02.018.02.02.27
572.09.05.014.001.75
653.013.016.017.01.06.48
775.02.04.019.002.31
8Baota15.63.871.29.400.34
917.84.375.72.201.02
Table 2. Summary of mechanical parameters obtained from complete stress-strain curves of tested samples. E (Young’s modulus), ν (Poisson’s ratio), σf (failure stress), σr (residual stress), Wet (total elastic energy), Wer (residual elastic energy), We (consumed elastic energy), Wr (rupture energy), Wp (plastic energy), Wa (additional energy), BI1(We/Wr), BI2 (We/(Wet+Wp)), BI (brittleness index).
SamplesFormationE (Gpa)ν σ f   ( Mpa ) σ r   ( Mpa ) WetWerWeWrWpWaBI1BI2BI
1Longmaxi22.40.211236031723331290.720.550.63
231.70.3024215010239631140510.550.620.58
335.30.2826690140161242661471420.460.430.45
4Wufeng26.90.192281059119727248171.000.550.78
542.10.32262100522131740430.430.480.45
635.10.1626417317274981850870.500.560.53
756.70.22275200965145188391430.240.320.28
8Baota37.80.232441706130317398410.430.190.31
955.50.2326922574542018201620.100.260.18
Table 3. The value of Sh and fracability index of nine samples.
SampleSh (Mpa)Sh_nBIBInFI
123 0.72 0.63 0.76 0.74
236 0.32 0.58 0.67 0.50
332 0.43 0.45 0.45 0.44
421 0.79 0.78 1.00 0.89
546 0.00 0.45 0.45 0.22
614 0.99 0.53 0.58 0.79
724 0.68 0.28 0.17 0.42
828 0.56 0.31 0.22 0.39
932 0.45 0.18 0.00 0.22

