Article

Deep Learning Image-Based Defect Detection in High Voltage Electrical Equipment

1
Smart Wireless Communication Ecosystem Research Group, Department of Electrical Engineering, Chulalongkorn University, Bangkok 10330, Thailand
2
State Key Laboratory of Power Transmission Equipment & System Security and New Technology, School of Electrical Engineering, Chongqing University, Chongqing 400044, China
3
Department of Information Technology, College of Computer, Qassim University, Al-Mulida 52571, Saudi Arabia
4
Intelligent Analytics Group (IAG), College of Computer, Qassim University, Al-Mulida 52571, Saudi Arabia
*
Author to whom correspondence should be addressed.
Energies 2020, 13(2), 392; https://doi.org/10.3390/en13020392
Submission received: 18 November 2019 / Revised: 3 January 2020 / Accepted: 9 January 2020 / Published: 13 January 2020

Abstract

:
The increase in the internal temperature of high voltage electrical instruments is due to a variety of factors, particularly, contact problems; environmental factors; unbalanced loads; and cracks in the high voltage current transformers, voltage transformers, insulators, or terminal junctions. This increase in the internal temperature can cause unusual disturbances and damage to high voltage electrical equipment. Therefore, early prevention measures of thermal anomalies in equipment are necessary to prevent high voltage equipment failure that might shut down the whole grid system. In this article, we propose a novel non-destructive approach to defect analysis in high voltage equipment by taking advantage of the infrared thermography and the deep learning (DL) approach from the machine learning paradigm. The infrared images of the components were captured using the FLIR T630 without disturbing the operations of the power grid. In the first stage, rich features maps from the convolutional layers of the AlexNet pretrained model were extracted. After feature extraction, the random forest (RF) and support vector machines (SVM) were trained for learning of the defective and non-defective high voltage electrical equipment. In an experimental analysis, the RF optimally learned the separation between defective and non-defective equipment with greater than 96% accuracy, outperforming all the other comparative approaches for deep and nondeep features. The proposed approach based on the RF is reliable and shows its efficacy for fault detection in high voltage electrical equipment.

1. Introduction

Infrared imaging technology can play a significant role in diagnosing defects in initial phases of high voltage electrical devices before significant breakdown occurs. The use of image-based diagnosis enhances the working and safety lifecycle of power substation components. All electrical equipment with a temperature above the 0 °C, releasing thermal radiation, can increase the interior temperature of high voltage electrical equipment. The current passing through an electrical component causes heat in power substation equipment such as current transformers (CT), potential transformers (PT), insulators, breakers, arresters, and disconnectors. The human eye cannot see the infrared patterns of thermal radiation, which is transmitted as heat energy in the target obstacles. The heat pattern of any components exterior is only visible by infrared imagery devices in which heat radiation is transformed into visible radiation energy, representing the heat patterns of any object. With an increase in heat, the resistance inside the electrical components increases. As such, with the aging of high voltage components, the devices begin to degrade due to various factors, for example, cheap quality material, uncleaned joints, an overload of current, unstable voltage load, and corrosion over time by moisture in the air [1]. Thus, the equipment causes an increase in electrical resistance, which increases the heat dissipation of the equipment. The overheating can cause electrical equipment failure and a shutdown of electricity, leading to the breakdown of the whole electrical system of a particular setup. If the heat dissipation is diagnosed in the early stages by efficient screening, and the essential measures are considered immediately, the major breakdown and failures can be prevented.
Thermal imaging technology can recognize heat dissipation in high voltage electrical equipment. Infrared thermal imaging (IRT) obtains the thermal characteristics of the high voltage electrical devices by using advanced infrared (IR) cameras. The infrared image retains the temperature profile and the temperature range of the electrical components. Color tones of various scales describe separate temperature ranges in the electrical equipment. With the heat profile, the infrared image models can be interpreted by the thermographs, which divide the rank of the faulty components by the seriousness measures of maintenance of the components. Eventually, this leads to the examination of the heated components and fixing of the components according to the priority of the electrical equipment. Currently, the IR imaging strategy is an essential technique for predicting and preventing the defects of different substances in different fields due to its non-intrusive, fast, and economical approach. Hence, in a literature review, the infrared imaging approach offers a diverse use of applications and beneficial procedures for the operational functionality of electric equipment without disturbing the working process of the system [2,3,4,5,6,7,8,9,10,11,12].
As high voltage electrical devices become old, their internal resistance increases, and thus, they generate extra internal heat during operation. The rise in internal heating can cause the breakdown of high voltage equipment and set the electrical devices on fire, which may lead to the shutdown of the whole system. It can also be a risk to the lives of the workers in the power substations. By using the IR-based approach for examining the high voltage equipment in peak load times, the damaged components can be easily distinguished and the seriousness of the defects recognized [12].
The maintenance costs of high voltage equipment play a vital role in determining the operating expenses of electrical power grids in a specific country. The maintenance expenses of high voltage equipment can vary depending upon the deficiency of the electrical components and the types of devices needed to perform repairs to the electrical power grids. Usually, the operating performance of high voltage components is not regularly monitored. The regular monitoring of these components can play an essential role in the initial prevention of a fault and the improvement of the operating lifecycle of high voltage equipment. In many cases, a specific scheduled plan for monitoring is designed by using the faulty-device records of the electrical power grids. The IR imaging approach is used in a wide range machines for the monitoring of the performance of high voltage devices in power substations. This IR monitoring approach thus provides comprehensive information about operating conditions of the high voltage devices, allowing for improvement of their working life, removing unnecessary steps, preventing potential breakdowns, and managing the maintenance costs of high voltage components. IR usage has thus increased the effectiveness of high voltage electrical component fault-diagnosis and expanded the prevalent applications.
Usually, the infrared thermography approach applied to the electrical components for the detection of faults in devices is analyzed with the delta temperature ( Δ T ) rules [4]. This method is commonly called a qualitative-based temperature predicting system [13]. The Δ T rules of a specified region of the device are a rise in the range of the temperature relative to the temperature of a specified range. This relative temperature is generally the surrounding environmental temperature and the temperature of the same part of an electrical device under similar conditions [14]. The National Electrical Testing Association (NETA) [14], National Fire Protection Association (NFPA) [15], and American Society for Testing and Materials (ASTM) [16] are various standards for the delta temperature ( Δ T ). Infrared thermal imaging contributes to high-quality ideas for the investigation and monitoring of various physiological methods. Recently, many researchers have used thermography imaging to monitor and map the temperature pattern over the human body. This approach may offer an alternative method, in the near future, to the current technologies for neonatal temperature monitoring. Temperature and thermal nature are essential parts of the reliability of any process [17].
Since the conventional techniques of diagnosing the status of electrical equipment require expert and well-experienced personnel, the process of electrical equipment status evaluation is a time-consuming process due to the large amount of electrical equipment in power substations. In recent years, research has been based on the automatic thermal-status analysis of electrical components. The method of components examination is separated into various stages. At the first stage, a portion of the component inside the thermal image is found. The second stage extracts the statistical features and other related data of the thermal status of the corresponding portion. At the final stage, the calculated statistical features are analyzed for the decision process. In this setup, the detection of the exact portion of the IR image is important for accurate decision making [18].
Several approaches have been suggested for locating the specific portion of components in infrared thermal images. The authors of [19] propose a technique only for insulators that fuses the features of infrared and ultraviolet image segmentation based on the Otsu and PSO-BPNN approach. The research presented in [20] utilizes a neuro-fuzzy method for the recognition of defects in arresters, while the inputs of the artificial neural network (ANN) are infrared images and specific identified features. The watershed technique is sensitive to noise in images and non-uniform to colors in complex scenes. Although such an approach requires the starting points to be well projected, and the components must be positioned in the center of the thermal image to be detected. The authors of [21] use a color-built segmentation technique to extract hot points from the thermal images. They use the color segmentation approach applied to a specific portion of the IR image and modeled on the temperature distribution pattern. Thus, the fault detection in electrical equipment can be merged with other components in a substation. The color segmentation techniques are solely based on the clustering of pixel values, and thresholding of infrared images could lead to overfitting in the segmentation approach [22]. The authors of [23] use convolutional neural networks (CNNs) for the detection of insulators using infrared thermography by the vector of locally aggregated descriptors (VLAD) approach for two categories, in other words, insulator and non-insulator equipment. Many researchers use the feature extraction algorithm of scale-invariant feature transform (SIFT) to fuse the thermal and visible electrical component images [24]. Also, the authors in [25] propose a feature approach for matching the template to recognize power transformer bushes. Texture features can be calculated by the gray-level value of the infrared images, and thus the consistency of such features can be utilized to predict the isolator condition [26]. The authors in [27] used 11 statistical features of the first and second orders from infrared thermal images to train the multi-layer perceptron (MLP) and then integrated the graph-cut to determine whether the power equipment was defective or non-defective. The automatic diagnosis of infrared images using an intelligent system is still in its early stages. The authors of [28] represent images by a combination of local descriptors for different vision tasks. The bag of features (BoF) approach uses local features and SIFT features for compressed-representation image-based recognition [29,30,31]. However, these types of early feature extraction techniques misplace useful information from the images due to their focus on global objects in the images. These approaches have minimal descriptive capacity in producing contour data from an object based on its surrounding environment. Therefore, to produce accurate data from images, the authors in [32,33] present the VLAD method in which the local features are used in a global descriptor on the locality benchmark.
The CNNs have achieved enormous recognition for pattern recognition and use in computer vision fields [34]. The authors in [35] use the dataset of the 2012 ImageNet ILSVRC [36] and achieve a state-of-the-art performance in visual image recognition. Various object recognition techniques such as the faster R-CNN [37], single shot multi-box detector (SSMBD) [38], and region-based fully convolutional Siamese network (R-FCSN) [39] have accomplished significant improvement in object recognition problems. The CCN technique can acquire a human-level recognition from the raw input image pixel data by enhancing classification performance. In the first stage, the input images are passed through the various convolutional layers, where each layer is composed of feature maps. Then, max-pooling filters the output inside neighborhoods. A sequence of filtering and the subsampling processes are then applied. The processes are then repeated multiple times based on the problem domain. In the final stage, a depiction of the fully connected layers discriminates the classes of the data. The authors in [40] use the 5th layer for reconstructed visualization matching to the given input test image. Thus, the max-pooling filter inside every feature map can present an invariance to the minor scale distortions.

2. Defects in High Voltage Electrical Equipment

High voltage equipment installations in power grids, such as CT, voltage transformers, insulators, breakers, arresters, and disconnectors, suffer severe failures when the internal temperature of the components increases above a threshold peak. The principal anomalies increase because of unbalanced voltage/current, breaks in electrical components, contact issues, fluctuations of voltage level, and other similar related issues. IRT can be very useful for analyzing the overall temperature of the high voltage equipment. Figure 1 shows an original image and its zoomed-in infrared thermal image.

2.1. Defects in a High Voltage Power Transformer

High temperature causes heat fluctuations and, therefore, may damage the internal structure of transformers by augmenting the temperature inside the coils and windings. The transformers are generally cooled down by oil or air, and their operating temperature is higher than the surrounding temperature of the environment. The cooling systems are used for maintaining the internal temperature within an acceptable range. Typically, IRT examination is used for thermal investigation of oil transformer defects. Figure 2 shows a heat map of a high voltage power transformer in a typical substation. Since the temperature of dry transformers is usually much higher than that of oil transformers, typically, it is challenging to determine the location of the fault using thermal techniques only. Hence, a different estimation apparatus, which is a built-in heat and pressure measurement device, achieves an accurate estimation of the dry transformer in power generation. In oil transformers, the thermal investigation usually identifies faults in primary and secondary joints, cooling devices, extra cooling fans, inner bushing parts, etc.

2.2. Defects in Circuit Breakers

The flow of current through the circuit breakers increases their internal temperature. To protect the circuit breakers from severe damage, the circuit breaker instantly initiates an open state if there is an abnormality, especially if there are temperature fluctuations. Figure 3 shows a thermal image of circuit breakers. IRT has the benefit of estimating the irregularities by examining the temperature changes of circuit breakers and thus can avoid a shortfall in the early stages.

2.3. Defects in Surge Arresters

Issues related to surge safety, arresters leaking, and tracking current on insulators can be traced and identified using the infrared thermography approach. However, the complications in this regard need a lot of subtle heat transformations, which are frequently hard to supervise. Figure 4 shows a heat map of the surge arrester.

2.4. Defect in Cutout Switch Bus Fuse Connections

In high voltage electrical equipment, the cutout switch bus fuses are used to protect the power systems equipment against overloading situations. Overloading conditions in power substation equipment increases the temperature of the fuse junction. Thus, the fuse pin inflames due to the weak and loose connections. Figure 5 shows a thermal map of the cutout switch fuse connection.

2.5. Defect of Insulation in Power Substation

Insulation in electrical components is the basis of the short-circuit between two electrical conductors. An excess of current produces overheating, which causes the cutout switches bus fuse or circuit breakers to open. However, overheating can also be caused by poor insulation. Figure 6 shows a thermal map of the insulator in a particular power substation.

3. Proposed Approach for High Voltage Electrical Equipment Using Deep Learning

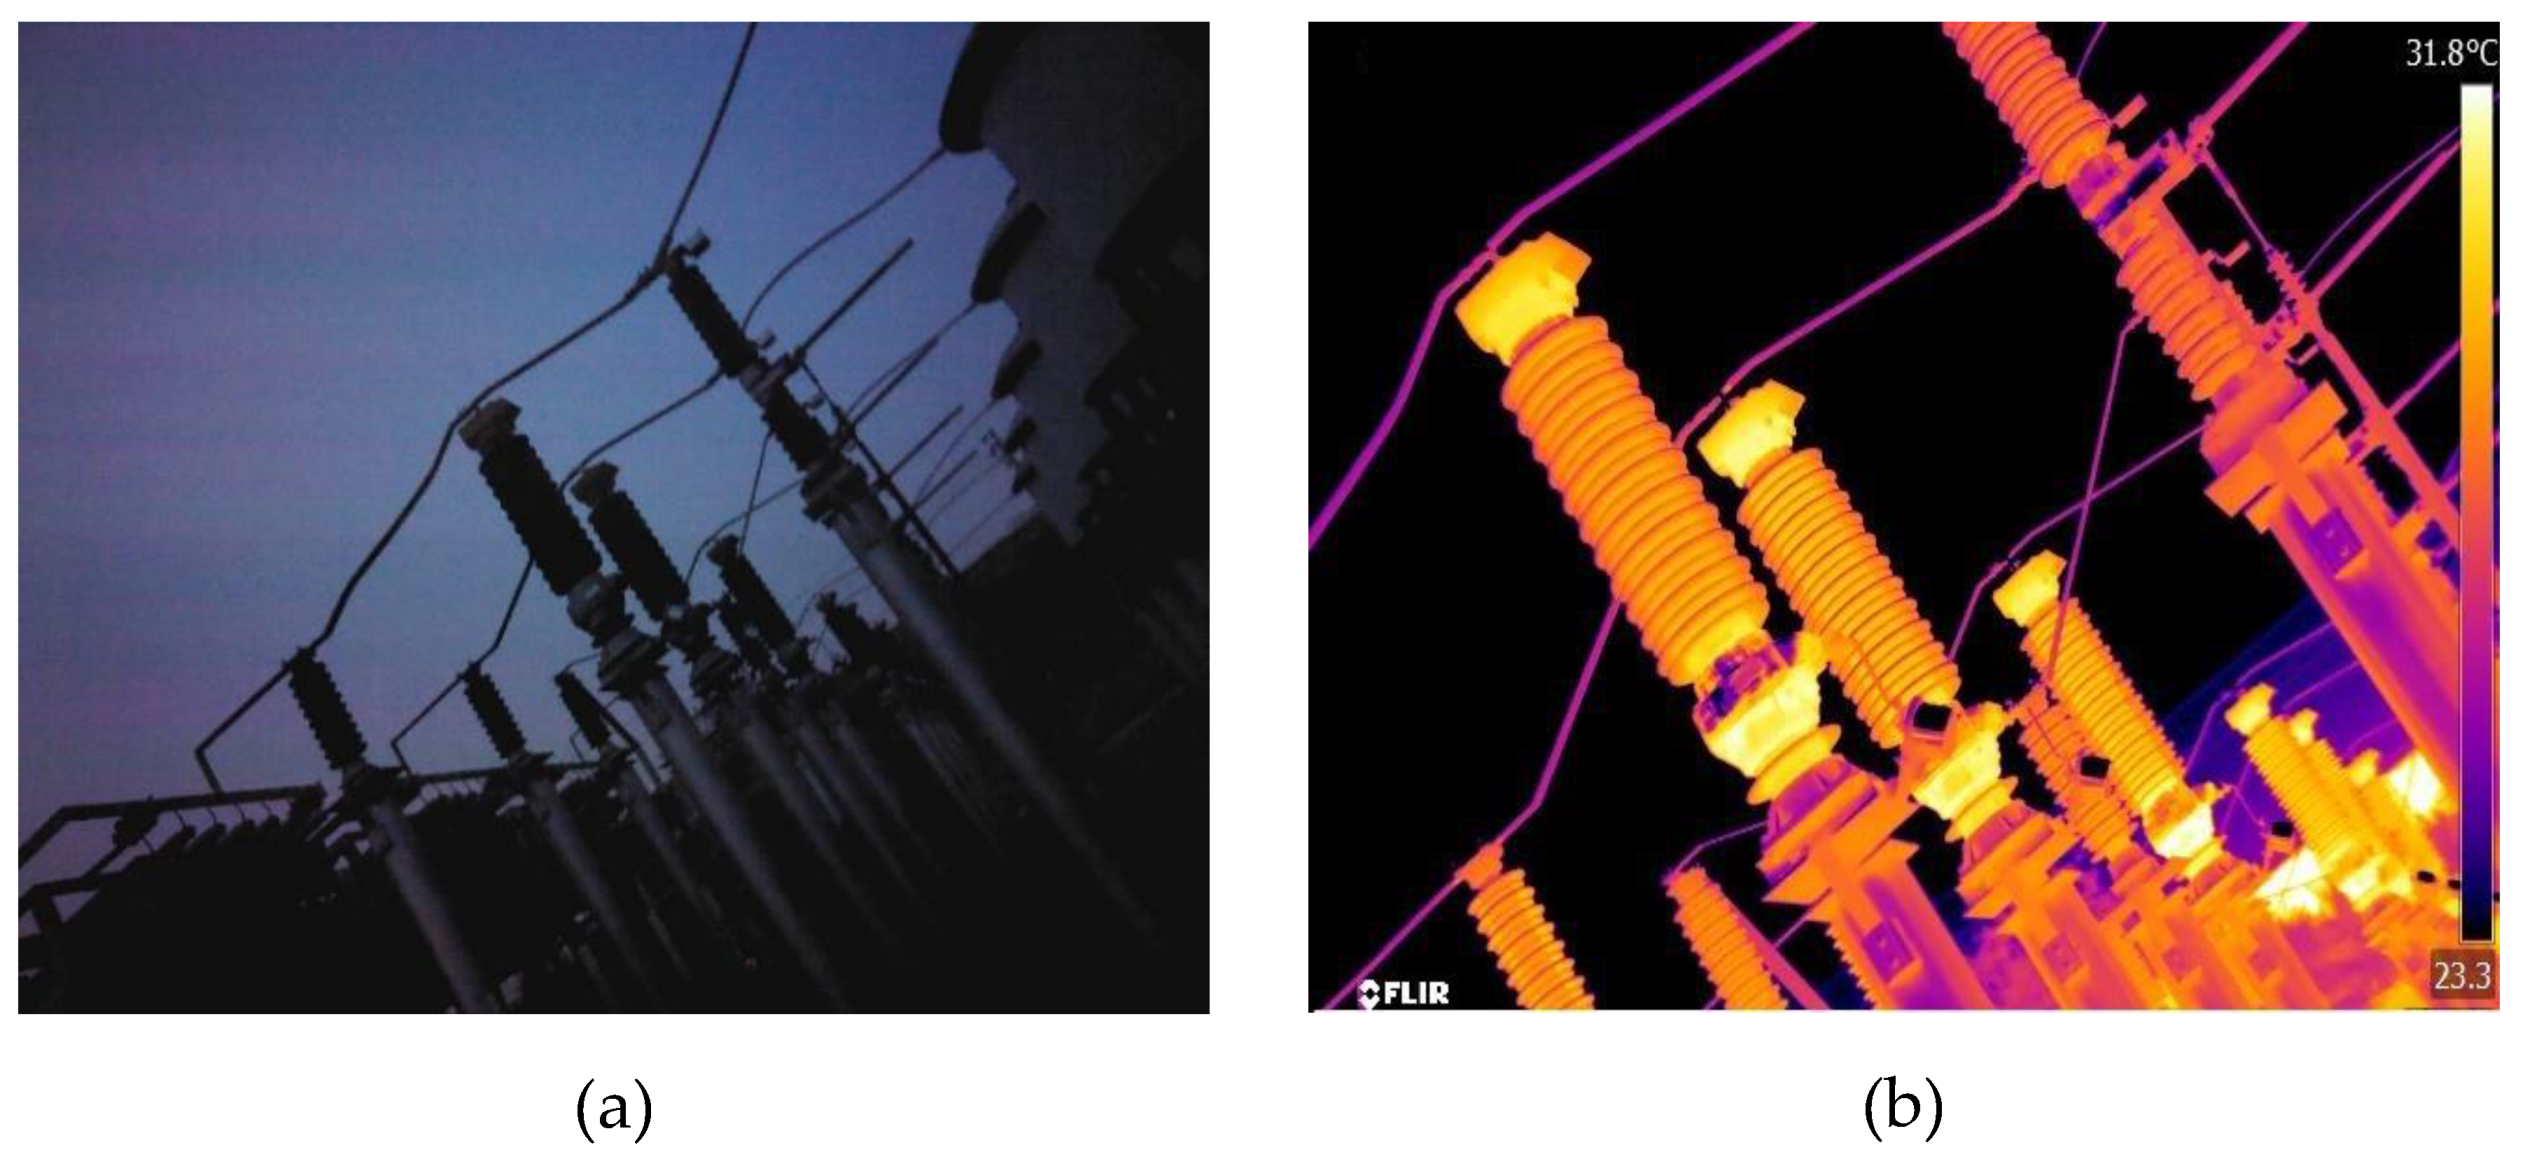
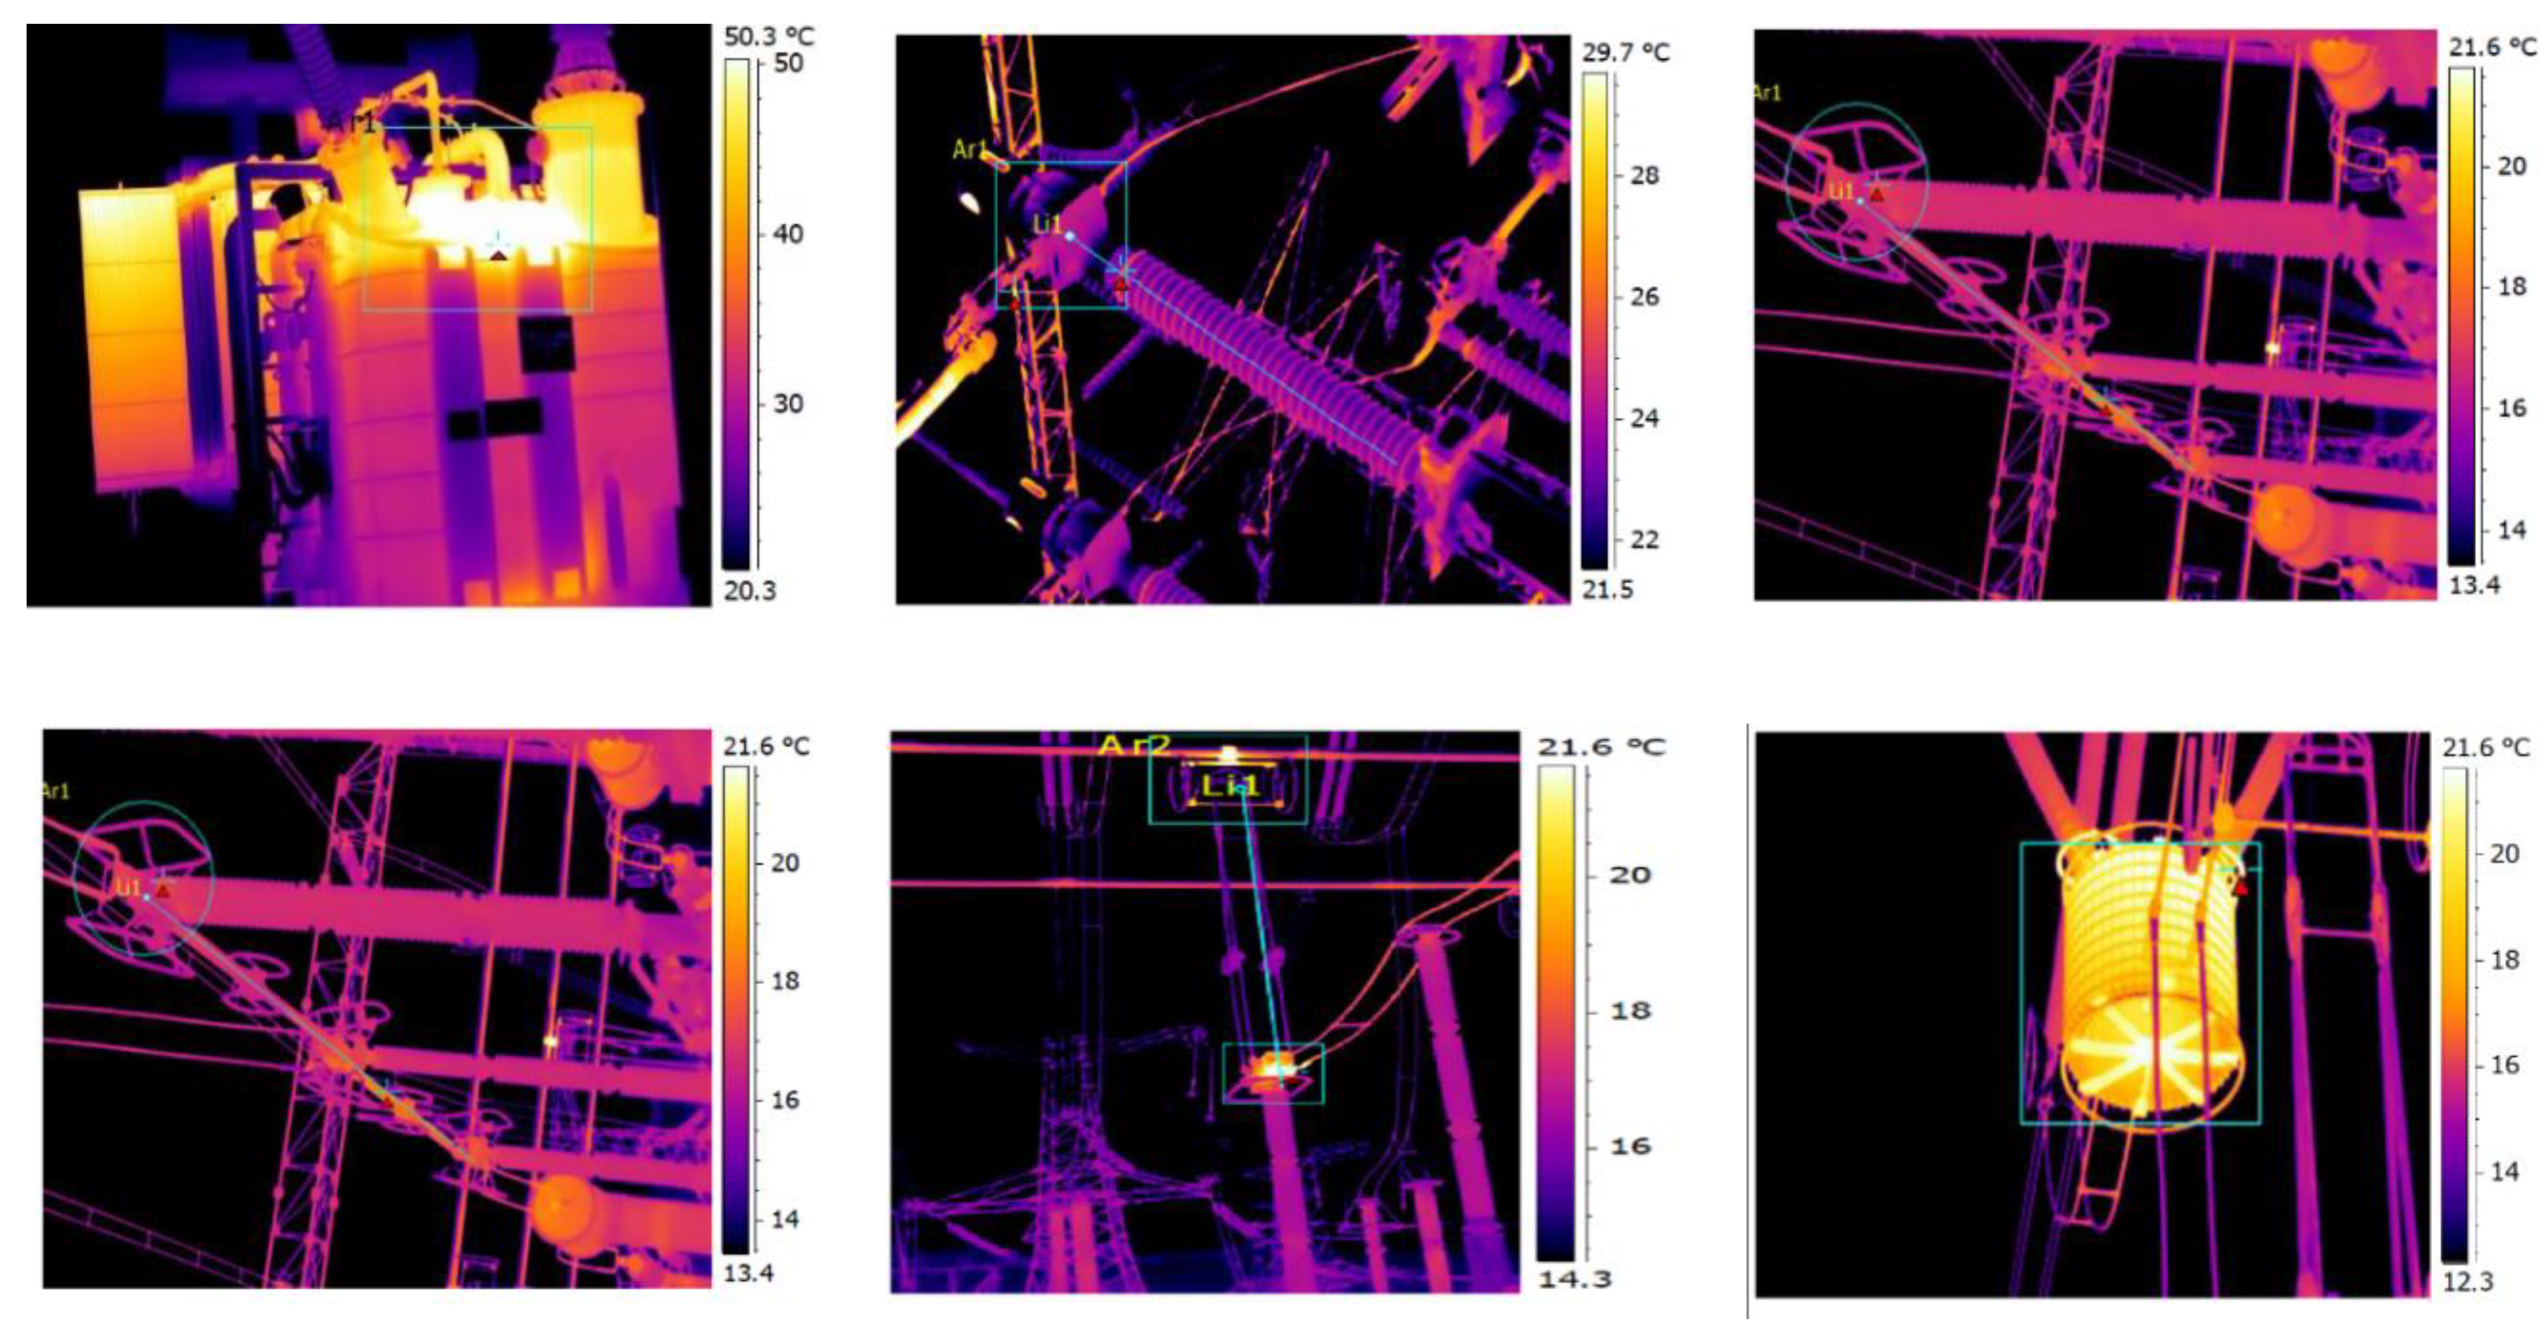
3.1. Infrared Imaging and Temperature Criteria Approach

We propose to use the innovative capabilities of deep learning for defect prediction. Deep learning learns the features of the thermal images and classifies them accordingly. For the proposed approach, an IR thermal camera, FLIR T630, was used to record the infrared thermal images of high voltage electrical components of different substations in the different areas of Chongqing, China. The temperature around the devices was approximately −4–4 °C during the capturing of the thermal images in different substations in cold weather. Infrared images were recorded from different high voltage equipment in different power substations in working operation. In this proposed research work, high voltage electrical devices were categorized depending on the equipment operating temperature. The thermal condition of the electrical components was classified into two main classes, depending on the impact from level 1 to 2 using Δ T conditions, as in Table 1. These classes were defective high voltage equipment and non-defective high voltage equipment.

3.2. Deep Thermal Features

The proposed approach for thermal defect prediction was based on feature learning from the thermal images. The features were learned using the innovative deep learning approach. From the deep learning paradigm, we selected the convolutional neural networks (CNN). CNN was selected due to its remarkable achievements in every field of computer vision. CNN is a human-based biologically-motivated model that generates a human-matching cortex. CNN can extract vibrant features/information from data that are spatially correlated. The image domain is one example where the CNN extracts rich features that can then be learned by classifiers.
A convolutional neural network consists of a sequence of various convolutional layers and max-pooling layers, depending on the nature of the model. Every layer connects with the previous layers in the network. Every parameter is modifiable with the help of optimization, which reduces the loss of the training database. In the proposed approach, we utilized the AlexNet architecture proposed by Krizhevsky et al. [34]. It achieved the optimal accuracy on an extensive database, ILSVRC-2010, for a classification problem. The AlexNet architecture consists of five convolutional layers and three fully connected layers. Convolutional layers are composed of 3 × 3 filters augmenting the three max-pooling layers in the model. Let us suppose on every convolutional layer n, that a convolution action of z n 1 is the input feature that maps from the preceding layer n 1 , and u n × u n is the filter size of the network. The final network output is the summation of the responses with a nonlinear function as given in Equation (1) below,
W x n = σ ( r = 1 z n 1 W r n 1 T r j n + b x n ) .
In Equation (1), n represent the layers, W x n and W x n 1 are the network feature maps from different layers n and n 1 , T r j n is a size of the filter, b x n represents the bias in the network, and sigma σ is the activation function, which is the rectified linear unite (ReLU), given in Equation (2) as,
σ ( j r ) = { j r , i f   j r > 0 0 , i f   j r   0   .
The AlexNet architecture has about 60 million parameters, and therefore it is time-consuming to train the AlexNet Model. Instead of training the complete model on the new image database, in the defect detection problem, we utilized an ImageNet pretrained CNN model to extract deep features from infrared thermal images. This is called inception learning. One of the benefits of this approach is to get faster training times with high accuracy.

3.3. Random Forest Classification

After the features of the thermal images were extracted by the CNN, the random forest (RF) approach was used for classification. The RF approach is inspired by the initial research work by the authors of [41] on the geometric feature selection method, the random subspace technique of [42], and the randomly divided selection procedure of [43]. The RF approach is an opponent to state-of-the-art techniques, which include boosting algorithms [44] and support vector machines (SVM) [45]. The RF approach is speedy and easy to implement; it provides profoundly precise predictions and can handle a vast number of input data variables without overfitting. In general, it is supposed to be an accurate general-purpose training method for a large number of problems.
In the RF method, every tree in the group is determined by initially choosing at random, at every node, a small collection of input features, followed by identifying the most suitable split based on the features in the training dataset. The tree is developed using the CART approach [46] to the maximum size of the tree without pruning. This subspace randomization method is combined with resampling of the data using the with-replacement approach [47,48,49,50]. Thus, a random forest is defined by Equation (3) as:
f ( x ) = arg max y ϒ j = 1 J I ( y = h j ( x ) ) ,
where j t h is a base learner of a tree represented by h i ( x , Θ j ) , Θ j is a combination of random variables, and combinations of possible values of y are represented by ϒ in the classification problem, where j = 1 , , J , f ( x ) represents the predicated class.

3.4. Support Vector Machine (SVM)

The SVM classifier is supposed to be the most reliable classifier. The primary reason is the capacity of SVM to resolve problems of linear and nonlinear natures by obtaining the highest boundary to separate the classes. In our experimental analysis, we evaluated the SVM for the defect prediction for comparison with RF as a base model. The SVM can be described as:
min α 1 2 x = 1 n y r y x α r α x K ( z , z x ) x = 1 n α x r = 1 n y r α r = 0 , 0 α r M , r = 1 , , n .
In Equation (4), M denotes the constant in the classifier, which manages the misclassified samples, where α r is the LaGrange Multiplier, and the nonlinear classification function is:
f ( z ) = s i g n ( r = 1 l a i y r K ( z , z r ) + b ) ,
where z r is considered to be the support vector and z be the deep features extracted by CNN. The K ( z , z r ) is the kernel function. It can be expressed as:
K ( z , z r ) = exp ( z , z r 2 2 σ 2 ) ,
where the σ 2 is the constant, which controls the width of the kernel.

4. Experimental Evaluation

For an evaluation of the proposed approach, the thermal imaging dataset was used. The infrared thermal high voltage electrical equipment dataset consists of 1075 defective thermal instances and 925 non-defective thermal instances for a total of two thousand sampled instances. In an evaluation by 10-fold cross-validation, the dataset was divided into training thermal images and testing thermal images. Training thermal image samples were labeled as defective electrical equipment and non-defective electrical equipment. Sample thermal images of high voltage electrical equipment are shown in Figure 7.
For the thermal imaging-based model building and model testing, the 10-fold cross-validation approach was used. The 10-fold cross-validation learns the model based on training data and then tests the performance of the model. We selected this approach because it is a standard approach for checking the performance of model building and prediction based on the learned model. The 10-fold cross-validation uses 90% of the data for model learning. For the learned model, the model is tested on the 10% remaining data and the performance is noted. This training and testing approach is repeated 10 times, taking 90% training and 10% testing, with a guarantee of non-inclusion of the test set in each of the training sets. Finally, the average performance of these ten rounds is calculated. This approach thus removes the bias of results, and the performance can be generalized for practical applications.
Figure 8 shows the evaluation model for the defect prediction based on the thermal images. The infrared thermal images were used as training images by the CNN for features learning. The thermal images were fed to the first layer of the network and a feature vector was generated from the seventh layer of the network. In the last layer of the CNN, we used RF, SVM, J48, NB, and BayesNet classifiers. These classifiers were selected to compare the performance of the model building and testing scenarios. For the testing stage, the RF, SVM, J48, NB, and BayesNet output binary classes, in other words, defective and non-defective.
For performance evaluation, we used accuracy, sensitivity, specificity, precision, and F-measure. These parameters were selected based on their preferred usage for similar problems. These parameters are defined as:
A c c u r a c y = ( D + N D N u m b e r   o f   t o t a l   d a t a ) × 100 % ,
S e n s i t v i t y = ( D D + l ) × 100 % ,
S p e c i f i c i t y = ( N D N D + m ) × 100 % ,
P r e c i s i o n = ( D D + m ) × 100 % ,   and
F M e a s u r e = 2 × ( Precision × Sensitivity Precision + Sensitivity ) ,
where D = Total Defective Equipment correctly classified,
  • N D = Total Non-Defective Equipment correctly classified,
  • l = Total Defective Equipment classified as Non-Defective Equipment, and
  • m = Total Non-Defective Equipment classified as Defective Equipment.
Figure 9 and Figure 10 show the performance analysis of the defect prediction approaches. In Figure 9 we show the comparison between the SVM and the RF, whereas Figure 10 shows the comparison of the RF with the naïve Bayes (NB), Bayesian network (BayesNet), and the J48. In Figure 9, the accuracy of the RF is 96. That means that out of 100 test cases, the RF accurately identified the defects with 96% accuracy. The accuracy of the SVM was comparatively low at 90. Thus, SVM can correctly identify 90 instances out of 100 cases. In terms of the accuracy of the model, the random forest was 6% more accurate than the SVM. In Figure 9, the sensitivity of the RF and SVM almost follow the same trend as the accuracy. The specificity of the RF, however, is slightly less than that of the SVM with a 1.3% difference, which is not large. We also included an evaluation in terms of precision. Though accuracy is enough, if the data has un-balanced classes, then the precision is a more reliable parameter. The precision in Figure 9 for the RF was 97 and for the SVM it was 96.8. The F-measure is an evaluation parameter that takes into account both the precision and sensitivity, as in Equation (11). This means that the F-measure is a more reliable parameter for model-based prediction approaches. In Figure 9, the F-measure of the RF is 96.8, whereas the F-measure of the SVM is 92.7. The F-measure of 96.8 means that the thermal-based images are identified with 96.8% confidence. In other words, out of 100 cases, the proposed CNN model based on the RF classifier detects almost 97 instances accurately. We believe that this is a very good percentage of detections.
For the comparative analysis with other approaches using the deep features, we selected the RF approach as our proposed approach due to its increased performance in Figure 9. Figure 10 shows the comparison of the RF with the NB, BayesNet, and the J48. In Figure 10, the evaluation is based on F-measure only. As the F-measure includes precision and sensitivity, Figure 10 uses only F-measure, which is also a standard evaluation parameter. The features for the NB, BayesNet, and the J48 were calculated by deep learning as was done for the RF. This was done to justify the comparison of the NB, BayesNet, and J48 with the RF approach. Figure 10 shows that NB has an F-measure of 89.2. The F-measure of the RF is 96.8. The RF thus provides almost 8% accurate modeling of the classes. The F-measure of the BayesNet is 90. The model of the RF is almost 7% more accurate as compared to the BayesNet. The J48 shows an F-measure of almost 87. In this case, the RF model is 10% more accurate than the J48. Figure 10 shows that when using the same experimental and feature settings, the RF outperforms all the other classifiers.
Figure 11 shows the comparison of the proposed RF model with the other approaches for defective and non-defective classes based on the nondeep features. The nondeep feature approach represents the features that are extracted by the classical feature extraction methods. There are several feature extractions approaches. For defect and non-defect images, we used the autocorrelograms approach of [51] for feature extraction. Autocorrelograms has shown excellent performance for retrievability and generalization of image-based retrieval [51]. Also, the Autocorrelogram of the image captures the spatial correlation between similar intensities in the corresponding images. Figure 11 shows the comparative analysis based on the classical features. For comparison in Figure 11, identical to the previous comparison in Figure 10, we selected the RF approach as our proposed approach due to its increased performance in Figure 9. In Figure 11, the comparison is based on the F-measure due to the inclusion of precision and sensitivity in the F-measure calculation. The F-measure for classical evaluation in Figure 11 is 87. The F-measure for the BayesNet is 82. The RF outperforms the BayesNet by 5%. The NB has an F-measure of 80 and the J48 achieves an F-measure of 76. The RF outperforms NB and J48 by 7% and 11%, respectively. The results of Figure 11 show that using the classical features, the RF classifier still outperforms the other approaches. We believe that the generalization capabilities of the RF contribute to better discrimination between the binary classes of defective and non-defective.
Figure 12 shows a comparison of the proposed RF deep learning approach with the other deep learning models. The three comparative methods are LeNet [52], VGG16 [35], and VGG19 [53]. The LeNet in Figure 12 is the most straightforward possible deep learning network. The VGG16 [35] and VGG19 [53] provide very deep architecture. For comparison, the features were extracted by the proposed approach, LeNet, VGG16, and the VGG19. These extracted deep features were then classified by the RF. This setup justifies the comparison of the four approaches for a similar scenario. The evaluation was based on the F-measure. Figure 12 shows that the proposed RF approach has an F-measure of 96.8. The LeNet has an F-measure of 95. The VGG16 has an F-measure of 93.5. The VGG19 has an F-measure of 93. The proposed approach outperforms LeNet, VGG16, and VGG19 by almost 2%, 3%, and 4%, respectively. Though the proposed approach outperforms the other methods, the difference is not large. The network of the proposed approach is slightly deeper than that of the LeNet. However, the proposed approach is less deep than those of the VGG16 and the VGG19. The LeNet is considered the most straightforward network for image features learning and classification. We note that its performance is closer to our approach, though slightly reduced. The performance of the VGG16 and VGG19 is considerably less due to the networks’ use of a large number of layers.
With the extensive experimentation setup, we achieve an accurate model using the proposed RF model for autonomous fault detection. The autonomous detections can then be visualized for confirmation by the admin or supervisor. We argue that with the successful development and deployment, our strategy can perform a vital part in the quick and reliable inspection of high voltage electrical equipment in power substations. This can potentially limit high voltage components failures, thus saving exponential costs. Therefore, the proposed approach of defect detection shows its efficacy for practical applications. Figure 10 shows that using the same experimental and features settings, the RF outperforms all the other classifiers. The results of Figure 11 show that the generalization capabilities of the RF also contributes to better discrimination between the binary classes of the defective and non-defective using deep and nondeep features. From Figure 12, we believe that the large networks of the VGG16 and VGG19 are good for multiclass complex image categories. However, since the defect images are mostly related to color recognition, which is a simple and straightforward task, the performance of a very deep complex network is not as robust as the proposed deep network.

5. Conclusions and Future Work

For autonomous and non-destructive defect detection in high voltage electrical equipment, we have demonstrated the application of deep learning and machine learning to identify the faults in initial stages of component failure. For this purpose, we have used the infrared images produced by a professional infrared thermal camera. Therefore, our technique and contribution augment the non-destructive techniques for defect analysis in high voltage electrical substations. A total of two thousand sampled thermal instances of high voltage electrical equipment were used in the experimentation setup. From the experimental setup, we observed that the RF classifier outperforms all the other classifiers. The results of Figure 11 show that the generalization capabilities of the RF also contributes to better discrimination between the binary classes of defective and non-defective using deep and nondeep features. From Figure 12, we observed that since the defect images are mostly related to color recognition, which is a simple and straightforward task, the performance of a very deep complex network is not as robust as the proposed deep network. The autonomous detections by our proposed approach can then be visualized for confirmation by the admin or supervisor. This new approach can potentially limit the high voltage components failures and hence save the exponential costs in repairs. Therefore, the proposed approach of defect detection shows its efficacy for practical applications. In the future, we plan to introduce different machine learning and computer vision techniques for the defect analysis of high voltage components using a non-destructive approach. One of the main problems is the low number of infrared images of defective and non-defective high voltage components, and we plan to increase the number of infrared images by visiting and analyzing other substations in the future to collect more data.

Author Contributions

This paper is a result of the collaboration of all co-authors. I.U. was responsible for the modeling results and wrote most of the article. R.U.K., F.Y. and L.W. conceived the experiment, revised the manuscript, and helped in related experiments, revisions, and corrections. All authors have read and agreed to the published version of the manuscript.

Funding

This research project is supported by Second Century Fund (C2F), Chulalongkorn University. This work was also support by the STATE GRID of China corporation headquarters’ science and technology project (Study on infrared image intelligent diagnosis of substation equipment, grant number 5200-201915256A).

Conflicts of Interest

The authors declare no conflict of interest.

Abbreviations

DLDeep Learning
RFRandom Forest
SVMSupport Vector Machine
CTCurrent Transformer
CNNConvolutional Neural Networks
NFPANational Fire Protection Association
ANNArtificial Neural Network
ASTMAmerican Society for Testing and Materials
MLPMulti-Layer Perceptron
R-FCSNRegion-Based Fully Convolutional Siamese Network
VLADVector of Locally Aggregated Descriptors
NETANational Electrical Testing Association
NBNaïve Bayes
BayesNetBayesian Network

References

  1. Korendo, Z.; Florkowski, M. Thermography-Based Diagnostics of Power Equipment. Power Eng. J. 2001, 15, 33–42. [Google Scholar] [CrossRef]
  2. Ge, Z.; Du, X.; Yang, L.; Yang, Y.; Li, Y.; Jin, Y. Performance Monitoring of Direct Air-Cooled Power Generating Unit with Infrared Thermography. Appl. Therm. Eng. 2011, 31, 418–424. [Google Scholar] [CrossRef]
  3. Lahiri, B.B.; Bagavathiappan, S.; Jayakumar, T.; Philip, J. Medical Applications of Infrared Thermography: A Review. Infrared Phys. Technol. 2012, 55, 221–235. [Google Scholar] [CrossRef]
  4. Gill, P. Electrical Power Equipment Maintenance and Testing; CRC Press: Boca Raton, FL, USA, 2009. [Google Scholar]
  5. Bougriou, C.; Bessaïh, R.; Le Gall, R.; Solecki, J. Measurement of the Temperature Distribution on a Circular Plane Fin by Infrared Thermography Technique. Appl. Therm. Eng. 2004, 24, 813–825. [Google Scholar] [CrossRef]
  6. Balaras, C.A.; Argiriou, A.A. Infrared Thermography for Building Diagnostics. Energy Build. 2002, 34, 171–183. [Google Scholar] [CrossRef]
  7. Royo, R.; Albertos-Arranz, M.A.; Cárcel-Cubas, J.A.; Payá, J. Thermographic Study of the Preheating Plugs in Diesel Engines. Appl. Therm. Eng. 2012, 37, 412–419. [Google Scholar] [CrossRef]
  8. Manana, M.; Arroyo, A.; Ortiz, A.; Renedo, C.J.; Perez, S.; Delgado, F. Field Winding Fault Diagnosis in DC Motors during Manufacturing Using Thermal Monitoring. Appl. Therm. Eng. 2011, 31, 978–983. [Google Scholar] [CrossRef]
  9. Titman, D.J. Applications of Thermography in Non-Destructive Testing of Structures. NDT E Int. 2001, 34, 149–154. [Google Scholar] [CrossRef]
  10. Al-Kassir, A.R.; Fernandez, J.; Tinaut, F.V.; Castro, F. Thermographic Study of Energetic Installations. Appl. Therm. Eng. 2005, 25, 183–190. [Google Scholar] [CrossRef]
  11. Jadin, M.S.; Taib, S. Recent Progress in Diagnosing the Reliability of Electrical Equipment by Using Infrared Thermography. Infrared Phys. Technol. 2012, 55, 236–245. [Google Scholar] [CrossRef] [Green Version]
  12. Improving Electrical System Reliability with Infrared Thermography Source. Available online: http://www.Infraredelectrical.Com/Index.Html (accessed on 2 October 2019).
  13. Chou, Y.C.; Yao, L. Automatic Diagnosis System of Electrical Equipment Using Infrared Thermography. In Proceedings of the 2009 International Conference of Soft Computing and Pattern Recognition, Malacca, Malaysia, 4–7 December 2009; pp. 155–160. [Google Scholar]
  14. Infraspection Institute. Standard for Infrared Inspection of Electrical Systems & Rotating Equipment; Infraspection Institute: Burlington, NJ, USA, 2008; pp. 1–18. [Google Scholar]
  15. Fire, N.; Association, P.; Park, B.; Box, P.O. NFPA 750 Standard on Water Mist Fire Protection Systems 2000 Edition; National Fire Protection Association: Quincy, MA, USA, 2000. [Google Scholar]
  16. ASTM International. Standard Guide for Examining Electrical and Mechanical Equipment with Infrared Thermography; ASTM International: West Conshohocken, PA, USA, 2014. [Google Scholar]
  17. Abbas, A.K.; Heimann, K.; Blazek, V.; Orlikowsky, T.; Leonhardt, S. Neonatal Infrared Thermography Imaging: Analysis of Heat Flux during Different Clinical Scenarios. Infrared Phys. Technol. 2012, 55, 538–548. [Google Scholar] [CrossRef]
  18. Jadin, M.S.; Taib, S.; Ghazali, K.H. Finding Region of Interest in the Infrared Image of Electrical Installation. Infrared Phys. Technol. 2015, 71, 329–338. [Google Scholar] [CrossRef] [Green Version]
  19. Jin, L.; Zhang, D. Contamination Grades Recognition of Ceramic Insulators Using Fused Features of Infrared and Ultraviolet Images. Energies 2015, 8, 837–858. [Google Scholar] [CrossRef] [Green Version]
  20. Almeida, C.A.L.; Braga, A.P.; Nascimento, S.; Paiva, V.; Martins, H.J.A.; Torres, R.; Caminhas, W.M. Intelligent Thermographic Diagnostic Applied to Surge Arresters: A New Approach. IEEE Trans. Power Deliv. 2009, 24, 751–757. [Google Scholar] [CrossRef]
  21. Jaffery, Z.A.; Dubey, A.K. Design of Early Fault Detection Technique for Electrical Assets Using Infrared Thermograms. Int. J. Electr. Power Energy Syst. 2014, 63, 753–759. [Google Scholar] [CrossRef]
  22. Zou, H.; Huang, F. An Intelligent Fault Diagnosis Method for Electrical Equipment Using Infrared Images. In Proceedings of the Chinese Control Conference (CCC), Hangzhou, China, 28–30 July 2015; pp. 6372–6376. [Google Scholar]
  23. Zhao, Z.; Fan, X.; Xu, G.; Zhang, L.; Qi, Y.; Zhang, K. Aggregating Deep Convolutional Feature Maps for Insulator Detection in Infrared Images. IEEE Access 2017, 5, 21831–21839. [Google Scholar] [CrossRef]
  24. Li, H.; Wang, B.; Li, L. Research on the Infrared and Visible Power-Equipment Image Fusion for Inspection Robots. In Proceedings of the 2010 1st International Conference on Applied Robotics for the Power Industry, CARPI 2010, Montreal, QC, Canada, 5–7 October 2010. [Google Scholar]
  25. Zhou, Q.; Zhao, Z. Substation Equipment Image Recognition Based on SIFT Feature Matching. In Proceedings of the 2012 5th International Congress on Image and Signal Processing, CISP 2012, Chongqing, China, 16–18 October 2012; pp. 1344–1347. [Google Scholar]
  26. Zhao, Z.; Fan, X.; Qi, Y.; Zhai, Y. Multi-Angle Insulator Recognition Method in Infrared Image Based on Parallel Deep Convolutional Neural Networks. In Communications in Computer and Information Science; Springer: Berlin, Germany, 2017; Volume 773, pp. 303–314. [Google Scholar]
  27. Ullah, I.; Yang, F.; Khan, R.; Liu, L.; Yang, H.; Gao, B.; Sun, K. Predictive Maintenance of Power Substation Equipment by Infrared Thermography Using a Machine-Learning Approach. Energies 2017, 10, 1987. [Google Scholar] [CrossRef] [Green Version]
  28. Mopuri, K.R.; Babu, R.V. Object Level Deep Feature Pooling for Compact Image Representation. In Proceedings of the IEEE Computer Society Conference on Computer Vision and Pattern Recognition Workshops, IEEE Computer Society, Boston, MA, USA, 7–12 June 2015; pp. 62–70. [Google Scholar]
  29. Fei-Fei, L.; Perona, P. A Bayesian Hierarchical Model for Learning Natural Scene Categories. In Proceedings of the 2005 IEEE Computer Society Conference on Computer Vision and Pattern Recognition (CVPR 2005), San Diego, CA, USA, 20–25 June 2005. [Google Scholar]
  30. Lowe, D.G. Distinctive Image Features from Scale-Invariant Keypoints. Int. J. Comput. Vis. 2004, 60, 91–110. [Google Scholar] [CrossRef]
  31. Bay, H.; Tuytelaars, T.; Van Gool, L. SURF: Speeded up Robust Features. In Lecture Notes in Computer Science (Including Subseries Lecture Notes in Artificial Intelligence and Lecture Notes in Bioinformatics); Springer: Berlin, Germany, 2006. [Google Scholar]
  32. Jégou, H.; Douze, M.; Schmid, C.; Pérez, P. Aggregating Local Descriptors into a Compact Image Representation. In Proceedings of the IEEE Computer Society Conference on Computer Vision and Pattern Recognition, San Francisco, CA, USA, 13–18 June 2010; pp. 3304–3311. [Google Scholar]
  33. Jégou, H.; Perronnin, F.; Douze, M.; Sánchez, J.; Pérez, P.; Schmid, C. Aggregating Local Image Descriptors into Compact Codes. IEEE Trans. Pattern Anal. Mach. Intell. 2012, 34, 1704–1716. [Google Scholar] [CrossRef] [Green Version]
  34. Krizhevsky, A.; Sutskever, I.; Hinton, G.E. ImageNet Classification with Deep Convolutional Neural Networks. In Advances in Neural Information Processing Systems; MIT Press: Cambridge, MA, USA, 2012; pp. 84–90. [Google Scholar]
  35. Simonyan, K.; Zisserman, A. Very Deep Convolutional Networks for Large-Scale Image Recognition. arXiv 2014, arXiv:1409.1556. [Google Scholar]
  36. Oquab, M.; Bottou, L.; Laptev, I.; Sivic, J. Learning and Transferring Mid-Level Image Representations Using Convolutional Neural Networks. In Proceedings of the IEEE Computer Society Conference on Computer Vision and Pattern Recognition, Columbus, OH, USA, 24–27 June 2014; pp. 1717–1724. [Google Scholar]
  37. Ren, S.; He, K.; Girshick, R.; Sun, J. Faster R-CNN: Towards Real-Time Object Detection with Region Proposal Networks. IEEE Trans. Pattern Anal. Mach. Intell. 2017, 39, 1137–1149. [Google Scholar] [CrossRef] [PubMed] [Green Version]
  38. Liu, W.; Anguelov, D.; Erhan, D.; Szegedy, C.; Reed, S.; Fu, C.Y.; Berg, A.C. SSD: Single Shot Multibox Detector. In Proceedings of the European Conference on Computer Vision, Amsterdam, The Netherlands, 11–14 October 2016; Volume 9905, pp. 21–37. [Google Scholar]
  39. Dai, J.; Li, Y.; He, K.; Sun, J. R-FCN: Object Detection via Region-Based Fully Convolutional Networks. arXiv 2016, arXiv:1605.06409v2. [Google Scholar]
  40. Zeiler, M.D.; Fergus, R. Visualizing and Understanding Convolutional Networks. In Lecture Notes in Computer Science (including subseries Lecture Notes in Artificial Intelligence and Lecture Notes in Bioinformatics); Springer: Cham, Switzerland, 2014; Volume 868, pp. 818–833. [Google Scholar]
  41. Amit, Y.; Geman, D. Shape Quantization and Recognition with Randomized Trees. Neural Comput. 1997, 9, 1545–1588. [Google Scholar] [CrossRef] [Green Version]
  42. Ho, T.K. The Random Subspace Method for Constructing Decision Forests. IEEE Trans. Pattern Anal. Mach. Intell. 1998, 20, 832–844. [Google Scholar]
  43. Dietterich, T.G. Experimental Comparison of Three Methods for Constructing Ensembles of Decision Trees: Bagging, Boosting, and Randomization. Mach. Learn. 2000, 40, 139–157. [Google Scholar] [CrossRef]
  44. Freund, Y.; Schapire, R.E. Experiments with a New Boosting Algorithm. In Proceedings of the 13th International Conference Machine Learning, Bari, Italy, 3–6 July 1996. [Google Scholar]
  45. Shawe-Taylor, J.; Cristianini, N. Kernel Methods for Pattern Analysis; Cambridge University Press: New York, NY, USA, 2004. [Google Scholar]
  46. Breiman, L.; Friedman, J.H.; Olshen, R.A.; Stone, C.J. Classification and Regression Trees; Routledge: Abingdon, UK, 2017. [Google Scholar]
  47. Breiman, L. Bagging Predictors. Mach. Learn. 1996, 24, 123–140. [Google Scholar] [CrossRef] [Green Version]
  48. Bühlmann, P.; Yu, B. Analyzing Bagging. Ann. Stat. 2002, 30, 927–961. [Google Scholar] [CrossRef]
  49. Buja, A.; Stuetzle, W. Observations on Bagging. Stat. Sin. 2006, 16, 323. [Google Scholar]
  50. Biau, G.; Devroye, L. On the Layered Nearest Neighbour Estimate, the Bagged Nearest Neighbour Estimate and the Random Forest Method in Regression and Classification. J. Multivar. Anal. 2010, 101, 2499–2518. [Google Scholar] [CrossRef] [Green Version]
  51. Huang, J.; Kumar, S.R.; Mitra, M.; Zhu, W.J.; Zabih, R. Image indexing using color correlograms. In Proceedings of the IEEE Computer Society Conference on Computer Vision and Pattern Recognition, San Juan, PR, USA, 17–19 June 1997. [Google Scholar]
  52. LeNet-5—A Classic CNN Architecture—engMRK. Available online: https://engmrk.com/lenet-5-a-classic-cnn-architecture/ (accessed on 15 December 2019).
  53. Russakovsky, O.; Deng, J.; Su, H. ImageNet Large Scale Visual Recognition Challenge. Int. J. Comput. Vis. 2015, 115, 211–252. [Google Scholar] [CrossRef] [Green Version]
Figure 1. Thermal images of power substation equipment: (a) Visible light image. (b) Zoomed in infrared thermal image.
Energies 13 00392 g001
Figure 2. Infrared thermal image of a power transformer in the substation.
Energies 13 00392 g002
Figure 3. Infrared thermal image of circuit breakers.
Energies 13 00392 g003
Figure 4. Thermal image of the surge arrester in the power substation.
Energies 13 00392 g004
Figure 5. Infrared thermal image of cutout switch fuse connection.
Energies 13 00392 g005
Figure 6. Infrared thermal image of an insulator in a power substation.
Energies 13 00392 g006
Figure 7. Database of original infrared images of high voltage electrical equipment.
Energies 13 00392 g007
Figure 8. Proposed defective equipment prediction model for high voltage electrical devices. DL: deep learning; NB: naïve Bayes; SVM: support vector machine.
Energies 13 00392 g008
Figure 9. Comparison of random forest (RF) and SVM using deep learned features.
Energies 13 00392 g009
Figure 10. Comparison of the deep features-based RF, naïve Bayesian, Bayesian network, and the J48. Y-Axis shows the F-measure.
Energies 13 00392 g010
Figure 11. Comparison of classical machine learning approaches. Y-axis shows the F-measure.
Energies 13 00392 g011
Figure 12. Comparison of the proposed approach with the LeNet [52], VGG16 [35], and VGG19 [53]. Y-axis shows the F-measure.
Energies 13 00392 g012
Table 1. Two classes of equipment with the recommendation.
Class of High Voltage EquipmentΔT (°C)Recommended Suggestion
Non-Defective High Voltage Equipment<21Normal working equipment
Defective High Voltage Equipment≥21Defective equipment, high priority equipment

