Article

Control Strategy of the Pumped Storage Unit to Deal with the Fluctuation of Wind and Photovoltaic Power in Microgrid

1
College of Electrical and Electronics Engineering, Changchun University of Technology, Changchun 130000, China
2
State Grid Dandong Power Supply Company, Dandong 118000, China
3
State Grid JiLin Construction Company, Changchun 130000, China
4
The Third Harbin Power Plant with Huadian Energy Power Source, Harbin 150024, China
*
Author to whom correspondence should be addressed.
Energies 2020, 13(2), 415; https://doi.org/10.3390/en13020415
Submission received: 11 November 2019 / Revised: 22 December 2019 / Accepted: 8 January 2020 / Published: 15 January 2020

Abstract

:
With the development and utilization of distributed energy and microgrid, distributed energy storage has become a new development trend. However, small pumped storage units have the advantages of flexible engineering location, low investment, quick effect, low requirements on transmission lines, and a better solution to the peak load demand of the system. Therefore, it is more and more used in the microgrid, and it conducts joint dispatching with wind power, photovoltaic, and other clean energies. To solve the capacity problem of small pumped storage units within the microgrid, a new control strategy is proposed in this paper. Two pumped storage units are used for joint operations. Taking the smoothed combined output power of wind power, photovoltaic power, and pumped storage power as the target, and considering the limitations of transmission lines, the constraints of wind power and photovoltaic power fields as well as the restrictions of pumped storage power units and corresponding reservoirs are taken into account. In this paper, social particle swarm optimization (SPSO) with improved weight is used to calculate and solve the model. The effectiveness of the new control strategy is verified.

Graphical Abstract

1. Introduction

In order to implement the construction of green and low-carbon ecological civilization, increasing the proportion of investment in renewable energy has been a key factor in the development of energy science. Therefore, in the future, the investment scale of low-carbon and clean energy will continue to vigorously promote [1,2,3], and many scholars have proposed and implemented a variety of methods [4,5,6]. However, due to the impact of environmental uncertainty, renewable energy cannot be viewed in isolation. For example, wind [7,8] and solar [9,10] technologies based on renewable energy are affected by uncertain loads, and the specific power output depends on environmental conditions. The application of pumped storage unit [11,12] absorbs the excess electricity of wind and photovoltaic power in the form of water storage, so as to release the output at the peak of price, so as to obtain higher income to offset the higher upfront investment cost. At the same time, it also provides an ideal way for the absorption of wind power, photovoltaic, and other renewable energies. As an emerging form of network structure, the microgrid can realize joint dispatching between energy sources, and it also complements the characteristics of different energy sources. In addition, the surplus wind power and photovoltaic power can be absorbed and reused, greatly reducing the waste of wind and photovoltaic power, and alleviating the current situation of environmental pollution. In [13], Duque et al. considered that deviation from the initial output plan due to prediction errors may cause large output fluctuations. In order to ensure steady output, a joint operation between wind farms and hydropower stations was proposed. The uncertainty of wind prediction was modeled and quantified to optimize the joint model. The test results showed that the regulating capacity of wind power output can be improved according to the good peak-valley clipping performance of the pumped storage power station. In [14], Fei et al. established an optimal model for joint operation by considering the intermittency and volatility of wind power. The feasibility and benefit of joint operation were also illustrated by simulation. During the winter heating season, pumped storage plants adjust peak loads and help the grid accommodate more wind power. In other off-heating seasons, pumped storage stations balance the fluctuations of wind power. In [15], Helseth et al. established the optimal operation model of wind power and pumped storage system with multiple reservoirs. Taking the price of hydropower and wind power as random variables, the output cost of units in the dispatching model was linearized based on the power constraint. Taking Iceland power system as an example, the simulation test results showed that the model was very suitable for medium- and long-term hydropower dispatching and can perform more accurate constraint adjustment through improving the time resolution. In [16], Manolakos et al. took Donoussa island in the Aegean Sea of Greece as an example and studied and established the model of independent photovoltaic and pumped storage power station to meet the basic load needs of remote villages. After a month of operation, it was concluded that during the daytime, the output of the photovoltaic generator directly met the load through the inverter, and any possible surplus energy was directed to the pump to pump water out of the low-water reservoir. At night, the water flowed from a low-water reservoir to a hydraulic turbine, powering the load. It was verified that this model had strong practicability. However, for areas with limited space, the literature [15,16] has not considered the influence of unit capacity on stabilizing wind power fluctuations. In [17], Zhu et al. proposed a combined and complementary model of PV power, wind power, and pumped storage energy on dispatching days, and took the uncertainty of photovoltaic power and wind power output into account. Under the condition that photovoltaic and wind output and load demand were known during dispatching, the hydropower output was calculated. Thus, the operation of hydropower units in the dispatching process can be grasped more intuitively, which verified that hydropower units have good performance in power fluctuation suppression. In [18], Liu et al. entrusted the output of wind power with a confidence level to constrain and establish a model. At the same time, it also tried to establish a certain relationship between the operation economy and reliability of power system and the capacity of pumped storage units and explored the correlation between them. Finally, it was concluded that when the installed proportion of pumped storage energy met the specific conditions, it had a good performance on the dispatching cost of the system and the absorption of renewable energy. In [19], Zare et al. proposed the scheduling strategy of microgrid connected pumped storage energy, photovoltaic, and wind farm hybrid system. Due to the uncertainty of renewable energy power generation and the market price, the stochastic optimization model of power generation scheduling was established. The uncertainty of parameters was constrained by the scenario generation and reduction methods. The effectiveness of this method was fully verified in different cases. In [20], Yi et al. constructed a hybrid output system including wind power, photovoltaic power, and hydroelectric power. The purpose of this model was to minimize the initial investment cost and improved the reliability and power complementarity characteristics of the power supply. The results showed that the scheduling model had obvious advantages under multiple criteria. Similarly, literature [18,19,20] failed to consider the influence of the limited capacity of pumped storage units on the flattening of power fluctuations and whether it will cause the waste of renewable energy. In [21], Mohsen et al. proposed the control method maximum power point tracking (MPPT) to optimize the efficiency and performance of PV power generation. On the basis of the traditional method, it was optimized by means of square sum decomposition, polynomial fuzzy modeling, and polynomial parallel distribution compensation (PDC). Through a large number of simulation experiments, it was proved that this method has better performance in both calculation speed and efficiency improvement of PV system. In [22], Akagi et al. proposed a multipurpose control and the planning method in order to improve the efficiency of the battery itself and the input scale of PV power generation. This method had a good smoothing effect on PV power fluctuation. By solving the model, the effectiveness and superiority of the method were verified, and the optimal site and type of battery were determined. In [23], Jabir et al. conducted an in-depth study on wind power generation, one of the most widely used clean energy sources, and elaborated on its advantages and disadvantages when integrated into the power grid. The paper also verified that the battery energy storage system can smooth the wind power fluctuation under the reasonable and effective control strategy. Its valuable academic achievements had greatly inspired the follow-up research of wind power and other clean energy for the majority of scholars. Most of the above literature use the optimized PSO algorithm [24,25,26] to solve the model.
In summary, adopting appropriate strategy to operation and control in joint dispatching can effectively guarantee the stability and reliability of joint output’s power. Traditional control strategies will be adopted in the joint operation of units [27,28,29]. However, considering the capacity problem of small pumped storage units within the scope of microgrid [30,31], in order to ensure that large fluctuations of wind power and photovoltaic power can be effectively suppressed within the dispatching cycle, and to avoid the occurrence of large amounts of wind and light abandoning, this paper formulated a new control strategy. Two pumped storage units are used to work with wind power and photovoltaic units. According to the prediction of wind power and photovoltaic power during the dispatching cycle, the power fluctuation trend can be accurately judged. Considering that there may be power fluctuations that cannot be suppressed due to capacity limitations, the two pumped storage units complete the arrangement of scheduling in advance according to the new control strategy, so as to achieve better stabilization effect for large fluctuations of wind power and photovoltaic power and stability of joint output.
This paper is organized as follows: Section 2 establishes the model of combined scheduling, which consists of wind power, photovoltaic power, and pumped storage power, and gives the target function and constraint conditions, respectively. Section 3 proposes a new control strategy based on the traditional strategy and gives the evaluation index of the new control strategy. Section 4 introduces the social particle swarm optimization (SPSO) and improves the inertia weight. Section 5 compares and analyzes the results of the model. Finally, Section 6 summarizes the conclusions.

2. The Model Construction of Units Combined Operation in Microgrid

In this paper, the microgrid structure is referred to [32] and improved on this basis, as shown in Figure 1, which consists of wind power units, one photovoltaic power generation equipment, and two pumped storage units. The pumped storage unit is connected to the microgrid through the converter and operates in the microgrid jointly with the wind power unit and photovoltaic unit. The units in the network are uniformly controlled by the microgrid central controller (MGCC).
Pumped storage has the characteristics of bi-directional regulation: The storage and power generation are completed by the pump station and the hydrogenerator, respectively. In the scheduling cycle, the demand for load is different in different time periods. When the load demand is high, the unit completes the conversion of potential energy to electric energy through the hydro-generator, while the pump in the low-load period saves the surplus electric energy. The characteristics of pumped storage units fit the intermittent fluctuation characteristics of photovoltaic and wind power output to a certain extent. Therefore, it is reasonable and feasible for pumped storage energy to play a role in stabilizing the output fluctuation of photovoltaic and wind power, and it is also of great value for the grid-connected investment of clean energy, maintaining the daily balance of the power system and scheduling optimization.

2.1. The Objective Function

In order to optimize the combined output power of photovoltaic, wind power, and pumped storage energy, so as to ensure the smoothest daily output power, the mean square error (MSE) of combined output power of wind power, photovoltaic power, and pumped storage power is introduced as an indicator to measure the fluctuation of output:
m i n f = 1 T 1 t = 1 T ( P w t + P v t + P g t P ¯ ) 2
where Pwt represents the online wind power in the period t within the dispatching cycle; Pvt represents the online photovoltaic power in the period t within the dispatching cycle; Pgt represents the online power of pumped storage unit in the period t within the dispatching cycle; and P ¯ represents the average of combined output of wind power, photovoltaic power, and pumped storage power. In this paper, T is a 24-h scheduling cycle, and each hour is a time period.

2.2. Operating Constraints of Various Types of Units in Microgrid

Wind farm constraint:
P 1 , w t + P 2 , w t = P w t
where P1,wt is the proposed output of the wind farm during t period the following day; P2,wt is the proposed wind abandoning power of the wind farm during t period the following day; and P w t is the predicted power value of the wind farm during t period the following day.
Photovoltaic power station constraint:
P 1 , v t + P 2 , v t = P v t
where P1,vt is the proposed output of the photovoltaic power station during t period the following day; P2,vt is the proposed photovoltaic abandoning power of the photovoltaic power station during t period the following day; and P v t is the predicted power value of the photovoltaic power station during t period the following day.
Combined units power output constraint within microgrid:
P m i n ( P w t + P v t + P g t ) P m a x
where Pmax is the maximum allowable joint output of microgrid and Pmin is the minimum allowable joint output of microgrid.
Constraint on pumping output of pumped storage unit:
u t · P p , m i n P p , t m i n ( u t · P p , m a x , E m a x E t Δ t η p )
where Pp,max is the maximum output of a single pumping unit; Pp,min is the minimum output of a single pumping unit; Pp,t is the unit pumping output during t period; ut refers to the number of pumping units put into use during t period of the pumped storage unit; Et is the total reservoir energy storage of the pumped storage unit during t period; Emax is the maximum allowable total storage capacity of the upper reservoir of the pumped storage unit; and ηp is the pumped storage unit pump pumping efficiency.
As we can see from Formula (5), considering the constraints of the rated power of the generating set and the minimum allowable operating value of the upper reservoir capacity, within any period t of the dispatching cycle, the total output of the pumped storage power station shall not exceed the maximum capacity output value of the unit or the maximum output value of the unit put into the power generation in the pumped storage power station.
Constraint of pumped storage unit power generation output:
k t · P g , m i n P g , t m i n ( k t · P g , m a x , ( E t E m i n ) η g Δ t )
where Pg,max is the maximum output of a single generator set; Pg,min is the minimum output of a single generator set; Pg,t refers to unit power generation output in during t period; kt refers to the number of generating units being put into the pumped storage power station during t period; Et is the total storage energy of the reservoir during t period of the pumped storage power station; Emin is the minimum allowable total energy storage of the upper reservoir of the pumped storage power station; and ηg is the pumped storage generator power generation efficiency.
The generator and pump of the pumped storage unit cannot generate electricity and pump water at the same time. Mutual exclusion constraints are set up:
P p , t · P g , t = 0 .
Constraint of pumping and generator starting and stopping times:
t = 1 24 ( n t s u + n t s d ) N u d .
Since the total number of units in a pumped storage power station is fixed, the number of starting units and the number of shutdown units in any time period t can be determined according to the number of shutdown units in each time period Nt0 in the dispatching cycle:
N g = k t + u t + N t 0 ,
n t s u = m a x ( N t 1 0 N t 0 , 0 ) ,
n t s d = m a x ( N t 0 N t 1 0 , 0 ) ,
where ut is the number of units in pumping state during t period; kt is the number of generating units in the generating state during t period; ntsu is the number of starting units during t period; ntsd is the number of shutdown units during t period; Nt0 refers to the number of shutdown units during t period within the dispatching cycle; Ng is the total number of units in the pumped storage power station; and Nud is the maximum allowable start and stop times of the total pumped storage unit.
The variation of upper reservoir capacity between t1 and t2 at any time during the operation period should meet the following constraint:
E 2 = E 1 + η p P p , t Δ t P g , t η g Δ t
where E1 is the upper reservoir energy storage at time t1 and E2 is the upper reservoir energy storage at time t2.
The upper reservoir energy storage should meet the following safety constraint:
E m i n E t E m a x
where Emax is the maximum allowable storage capacity of upper reservoir and Emin is the minimum allowable storage capacity of upper reservoir.
The storage and consumption of pumped storage units are required to meet the following constraint within a dispatching cycle:
| E 24 E 0 | ε E
where E0 is the initial energy storage value of the scheduling cycle; E24 is the energy storage value at the end of the dispatching cycle; and εE is the maximum allowable difference between the initial and final storage capacity of the pumped storage unit, providing a powerful guarantee for the efficient and economic operation of the reservoir.

3. New Control Strategy for Combined Operation of Units in Microgrid

Small pumped storage units in the microgrid have the advantages of flexible engineering location, low investment, quick response, low requirement on transmission lines, and smooth power fluctuation of renewable energies. In view of the capacity problem of small pumped storage units, a new control strategy is proposed, which uses two pumped storage units to operate together to obtain better power fluctuation smoothing effect. It is of great significance to the large-scale use of clean energies and the convenience of system dispatching.

3.1. Evaluation Index of the Effect of the New Control Strategy on the Stabilization of Fluctuation

Based on the objective function built in the previous section, two indexes are introduced: The total electric energy Wpass whose output power exceeds the fluctuation limit and the ratio Ppass of the total time when the output fluctuation exceeds the maximum deviation to the dispatching cycle. The two indexes are used to evaluate the effectiveness of the new control strategy. The smaller the index value of Wpass and Ppass is, the more effective the strategy is.
The combined dispatching output power of wind power, photovoltaic power, and pumped storage power during t period is defined as Pyt:
P y t = P w t + P v t + P g , t + P p , t
where Pwt is the output power of wind farm during t period, Pvt is the output power of photovoltaic power station during t period, Pg,t is the generated power of pumped storage power station during t period, and Pp,t is the pumping power of pumped storage power station during t period.
(1)
Time predicts period T0: It can be seen from the forecast of wind-solar power that there are certain deviations in the forecast results, which is the forecast accuracy. In order to better verify the feasibility of the proposed strategy, we assume that the prediction accuracy of wind-solar power is a fixed value within the prediction period.
(2)
Fluctuation of unit combined output power ΔPyt: The difference between combined units output power at any time t1 and t2.
Δ P y t = P y t 1 P y t 2
where Pyt is the combined output power value within the prediction period. t1 and t2 are any two time points in the scheduling cycle. Let Δt = t2t1, and Equation (16) can be expressed as:
Δ P y t = P y t + Δ t P y t
(3)
Maximum allowable deviation for power fluctuation Dt: Refers to the maximum limit of allowable fluctuation of wind-solar power. Through the combined operation of the pumped storage power station, the wind and photovoltaic output power is smoothed so that the power change is controlled within the set range. That is:
| P y t 1 P y t 2 | D t
Due to the different scale of microgrid system, the acceptable range of wind power and photovoltaic power fluctuation is also different. Therefore, the setting of Dt value should be determined according to the actual situation of microgrid.
(4)
The total amount of electrical energy in excess of the fluctuation limit Wpass: That is, in the prediction period, the power fluctuation at all adjacent moments exceeds the sum of the differences of the maximum allowable deviation.
W p a s s = k = 1 T Δ t f ( | Δ P y t + k Δ t | D t )
f ( a ) = ( a , a > 0 0 , a 0
(5)
The ratio of the total time when the output fluctuation exceeds the maximum deviation to the dispatching cycle Ppass: That is, the percentage of the total time when the power fluctuation difference of any two moments exceeds the maximum allowable deviation in the prediction period.
P p a s s = k = 1 T Δ t S ( | Δ P y t + k Δ t | D t ) T Δ t
S ( a ) = ( 1 , a > 0 0 , a 0

3.2. Traditional Combined Unit Scheduling Strategy

The traditional control strategy is to compare the wind output fluctuation with the maximum allowable deviation at each moment in the dispatching cycle to determine whether the pumped storage unit’s output can stabilize the fluctuation. For this strategy, there are some areas for the further improvement. Due to the upper reservoir’s limited storage capacity of the small pumped storage power station in the microgrid, the water stored value of the reservoir is not zero at the beginning of each dispatching cycle. After the pumped storage power station is put into operation of the microgrid, the water amount of the upstream reservoir satisfies the dispatching arrangement, which is the result of a series of superimposition of storage and power generation. For the pumped storage power station, it is assumed that the upper water storage capacity of the power station at a certain moment is the minimum capacity to operate (0.2Emax) or the maximum capacity state (Emax). If a power station operates alone, the fluctuations of wind power and photovoltaic power will not be able to be suppressed, and the combined operation of the two power stations will be coordinated with each other to calm down. However, when the capacity of the pumped storage power reservoir at a certain moment is 0.3Emax or 0.9Emax, and the power fluctuation value at this moment is greater than 0.1Emax, then neither single pumped storage power station nor two combined operation can completely control the power fluctuation. Based on the above factors, furthermore, it is envisaged that two pumped storage units are used in the microgrid to operate in conjunction with the wind-solar units. By obtaining the power prediction curve within the dispatching cycle, power fluctuation can be roughly determined. When wind and photovoltaic output power meet the current maximum allowable deviation range and a series of operating constraints, the two pumped storage units will operate together, so as to better cope with the power’s large fluctuations in a certain period of time in the future, without being affected by the small capacity of their own; so that the overall output of the power curve more closely with the trend of load, for system operation also provides a great convenience. Therefore, a new control strategy is proposed based on the existing control strategy of tradition.

3.3. New Combined Unit Scheduling Strategy

The new control strategy proposed in this paper has a good calming effect on the fluctuation of wind power and photovoltaic power, and also takes into accounts the problem that it is not enough to have a good calming effect on the fluctuation of the higher power at a certain moment in the future due to the capacity limitation. Next, we will elaborate on the pumped storage unit pumped-power strategy.
Formula (16) shows that:
Δ P y t = P y t 1 P y t 2 = P y ( t + Δ t ) P y t = P y ( t + Δ t ) [ P w t + P v t + P p , t + P g , t ] = P y ( t + Δ t ) P w t P v t [ P p , t + P g , t ]
Let
Δ P t = P y ( t + Δ t ) P w t P v t .
So
Δ P y t = Δ P t [ P p , t + P g , t ] .
In the above equation, ΔPt is the difference between wind and photovoltaic power and the combined output of wind, photovoltaic, and pumped storage energy at the next moment; that is, the fluctuation situation. Therefore, it is mainly to formulate the specific output of Pp,t and Pg,t through the mutual coordination and adjustment of ΔPt and the new control strategy. We formulate the following control criterion: Normally, when the pumped storage unit is required to stabilize the power, let unit 1 carry out power generation operation, namely Pg,t, and unit 2 reservoir carry out pumped storage, namely Pp,t. When the following conditions occur, we make the following changes:
(1)
Maintain the same state: That is, in the forecast period, the fluctuation of wind-solar power at any time conforms to the specified allowable deviation Dt, and then the output of unit 1 and 2 is not required to stabilize the fluctuation, which is satisfied:
P p , t = P g , t = 0 , Δ P y t = Δ P t < D t .
(2)
Unit generation regulation: When ΔPt = Py(t+Δt)PwtPvt > Dt, which means the next moment the wind-solar power will drop dramatically and cause a large deviation, the need for unit 1 reservoir sluice generation regulation, at this time Pg,t > 0, or when the wind-solar power meets the deviation allowable constraint −Dt < ΔPt < Dt at this time, but within the prediction period, it is predicted that there will be ΔPt+kΔt = Py(t+kΔt)PwtPvt < −Dt at a certain time k in the future. That is, there will be a large number of wind-solar power abandonment. Therefore, unit 2 reservoir is required to conduct pumped storage operation for regulation, but due to the limitation of reservoir capacity, wind and solar electricity cannot be completely absorbed. Therefore, in order to better stabilize the power fluctuation, unit 2 needs to generate part of the electric energy appropriately on the basis of meeting the operating constraints, so as to give consideration to the problem of insufficient capacity at time t + kΔt. The specific expression is:
P g , t = Δ P t D t , ( Δ P t > D t ) P p , t = D t Δ P t + k Δ t , ( Δ P t + k Δ t < D t )
where: k = 1, 2, 3, ..., T/Δt.
(3)
Unit energy storage regulation: Similarly, when ΔPt = Py(t+Δt)PwtPvt < −Dt, a large amount of wind-solar power abandoning is generated, and unit 2 is required to conduct energy storage regulation, at this time Pp,t < 0. Or, when the wind-solar power meets the deviation allowable constraint −Dt < ΔPt < Dt at this time, but within the prediction period, something is predicted to happen ΔPt+kΔt = Py(t+kΔt)PwtPvt > Dt at a certain time k in the future. That is, the wind-solar output power will decrease sharply. Unit 1 reservoir is required to conduct power generation operation to control, but at this time, there is not enough water in the upstream reservoir of unit 1 to generate power and maintain; on the basis of unit 1 meeting operating constraints, it is necessary to store part of the water appropriately, so as to take into account the stability of the combined output of wind power, photovoltaic power, and pumped storage power at time t + kΔt. The specific expression is:
P p , t = Δ P t + D t , ( Δ P t < D t ) P g , t = D t Δ P t + k Δ t , ( Δ P t + k Δ t > D t )
where: k = 1, 2, 3, ..., T/Δt.
It can be seen from the new control strategy that the cooperation of two pumped storage units in accordance with the given criteria can well solve the problem of insufficient capacity of a single pumped storage unit in the microgrid, and it has good performance in smoothing the fluctuation of wind-power. In unit joint dispatching, this paper adopts social particle swarm optimization algorithm to solve the problem. The operation period is 24 h and Formulas (26)–(28) are the core condition of the control strategy; the specific flow chart is shown as Figure 2.

4. Improved Social Particle Swarm Optimization

The SPSO algorithm is widely used to solve the calculation of economic dispatching of power system and to predict the intermittent fluctuation of wind power and photovoltaic power. The SPSO algorithm not only has strong global searching ability and fast convergence speed for solving nonlinear problems, but also has the advantages of having less configuration parameters and being easy to understand and implement. Therefore, the SPSO algorithm is adopted in this paper to solve the established microgrid model, but the standard algorithm has the defect of falling into the local optimum too early. These defects cause errors to the calculation results, so this paper improves the weights in the algorithm to improve the calculation accuracy.

4.1. Social Particle Swarm Optimization

The SPSO algorithm is based on the standard PSO algorithm. In order to determine the diversity of the individual, that is whether it is in free motion, or whether it remains in the present state or whether it follows other individuals, generally, the following threshold is designed for all individuals to make the particles escape from the local optimal and avoid the prematurity of the algorithm.
The SPSO algorithm includes the following particles and free particles. The following particle is a non-zero threshold particle, which is more susceptible to the influence of other particles. The number of following particles of other particles determines the motion state of this particle. A particle with a threshold of 0 is a free particle, which cannot be affected by the behavior of other particles, and its position state is random. The SPSO algorithm can be expressed by the following formula:
v i j ( t + 1 ) = ω v i j ( t ) + c 1 r 1 ( p b e s t i j ( t ) x i j ( t ) ) + c 2 r 2 ( a t t r a c t i j ( t ) x i j ( t ) )
x i j ( t + 1 ) = x i j ( t ) + v i j ( t + 1 )
where ω is the inertia weight, reflecting the particle inheriting the previous velocity ability; c1 and c2 are learning factors; and r1 and r2 are random numbers evenly distributed in the interval [0, 1].
As shown in Formula (29), the third item in the standard particle swarm optimization formula is replaced by attraction point attractij instead of gbestij. Similar to the standard PSO algorithm, in the initial operation phase, the individual with the optimal adaptive value is usually targeted when following the particle to select the initial attraction point. In the subsequent search, if the fitness value of one of the free particles i is optimal, then i will be regarded as the new attraction point. In the iteration stage, the new attraction point attractij tend to attract particles with a follow value of 1. As the particle group gets closer, the number of follow particles at the attraction point attractij increases so that particles with a higher follow value also get closer to it. At this time, for individuals with high following value, because the new attraction point did not reach their established standard, they continued to search for the global optimal in the original way, which greatly enriched the diversity of the population search.

4.2. The Improvement Strategy of Inertia Weight ω

The inertia weight ω reflects the particle inheriting the previous velocity ability. Larger inertia weight value is beneficial to global search, while smaller inertia weight value is more beneficial to local accurate search. In general, the weight ω decreases linearly according to Formula (31):
ω = ω m a x x ( ω m a x ω m i n ) T m a x
where Tmax is the maximum number of iterations, ωmax and ωmin are the maximum and minimum inertia weight values, and x is the current number of iterations.
Through the analysis of Formulas (29) and (31), it can be seen that the inertia weight value in the iteration process is linearly decreasing. In the initial stage, the inertia weight value is large, and the global search ability is good, which meets the requirements of particle exploration ability in the early stage. In the later stage, the inertia weight value is small, which is conducive to the particle convergence to the global optimal value. However, there are several problems with this approach. First, if the particle swarm searches for better particles at the initial stage, it is expected that the particles will converge to the global optimum rapidly, but the initial inertia weight value is large, which slows down the convergence rate of the particles. Second, at the later stage of iteration, the global search ability is reduced because the inertia weight value gradually decreases, and the particle swarm lacks diversity, so it is easy to fall into the local optimal. To sum up, the method of improving the inertial weight strategy is proposed. Some particles near the optimal point are allowed to search around the optimal point and are endowed with a small inertia weight, instead of being searched in a large range. However, particles far away from the optimal point are allowed to undertake a wide range of searches and are endowed with a large inertia weight. Therefore, the value of ω will not only change with the number of iterations, but also change with the distance between different particles and the optimal point. Therefore, the design idea is as follows: On the one hand, ω value of particle inertia weight will decrease with the increase of iteration number; on the other hand, ω value will dynamically change due to the distance between particle and global optimal point.
Let Dxi represent the distance between particle i and the current optimal particle after the xth iteration (except the globally optimal particle). Dximax represents the maximum Dxi after xth iterations of particle i, and Dximin represents the minimum Dxi after xth iterations of particle i.
The relationship between the inertia weight ωd of particles and the distance is shown in the Formula (32):
ω d = ω m i n + ( D x i D x i m i n ) ( ω m a x ω m i n ) D x i m a x D x i m i n .
The relation of particle inertia weight ωx decreasing with iteration number is Formula (33):
ω x = ω m a x x ( ω m a x ω m i n ) T m a x
where Tmax is the maximum number of iterations, ωmax and ωmin for maximum and minimum inertia weight value, x is the current number of iterations.
Combining the above two factors, Formulas (32) and (33) can be used to obtain the Formula (34) of inertia weight ω:
( ω = a ω d + b ω x a + b = 1
where in Formula (34), a and b are constants.
The flowchart of the algorithm is shown in Figure 3.

5. Example Analysis

In order to verify the rationality and effectiveness of the new control strategy proposed in this paper, it is necessary to analyze the examples. Four representative wind power forecast days A, B, C, D, and photovoltaic power typical forecast days E are selected. The improved particle swarm optimization (PSO) algorithm is used to solve the model, and the smoothing effect of the strategy on power fluctuation is compared and analyzed.

5.1. System Example Summarize

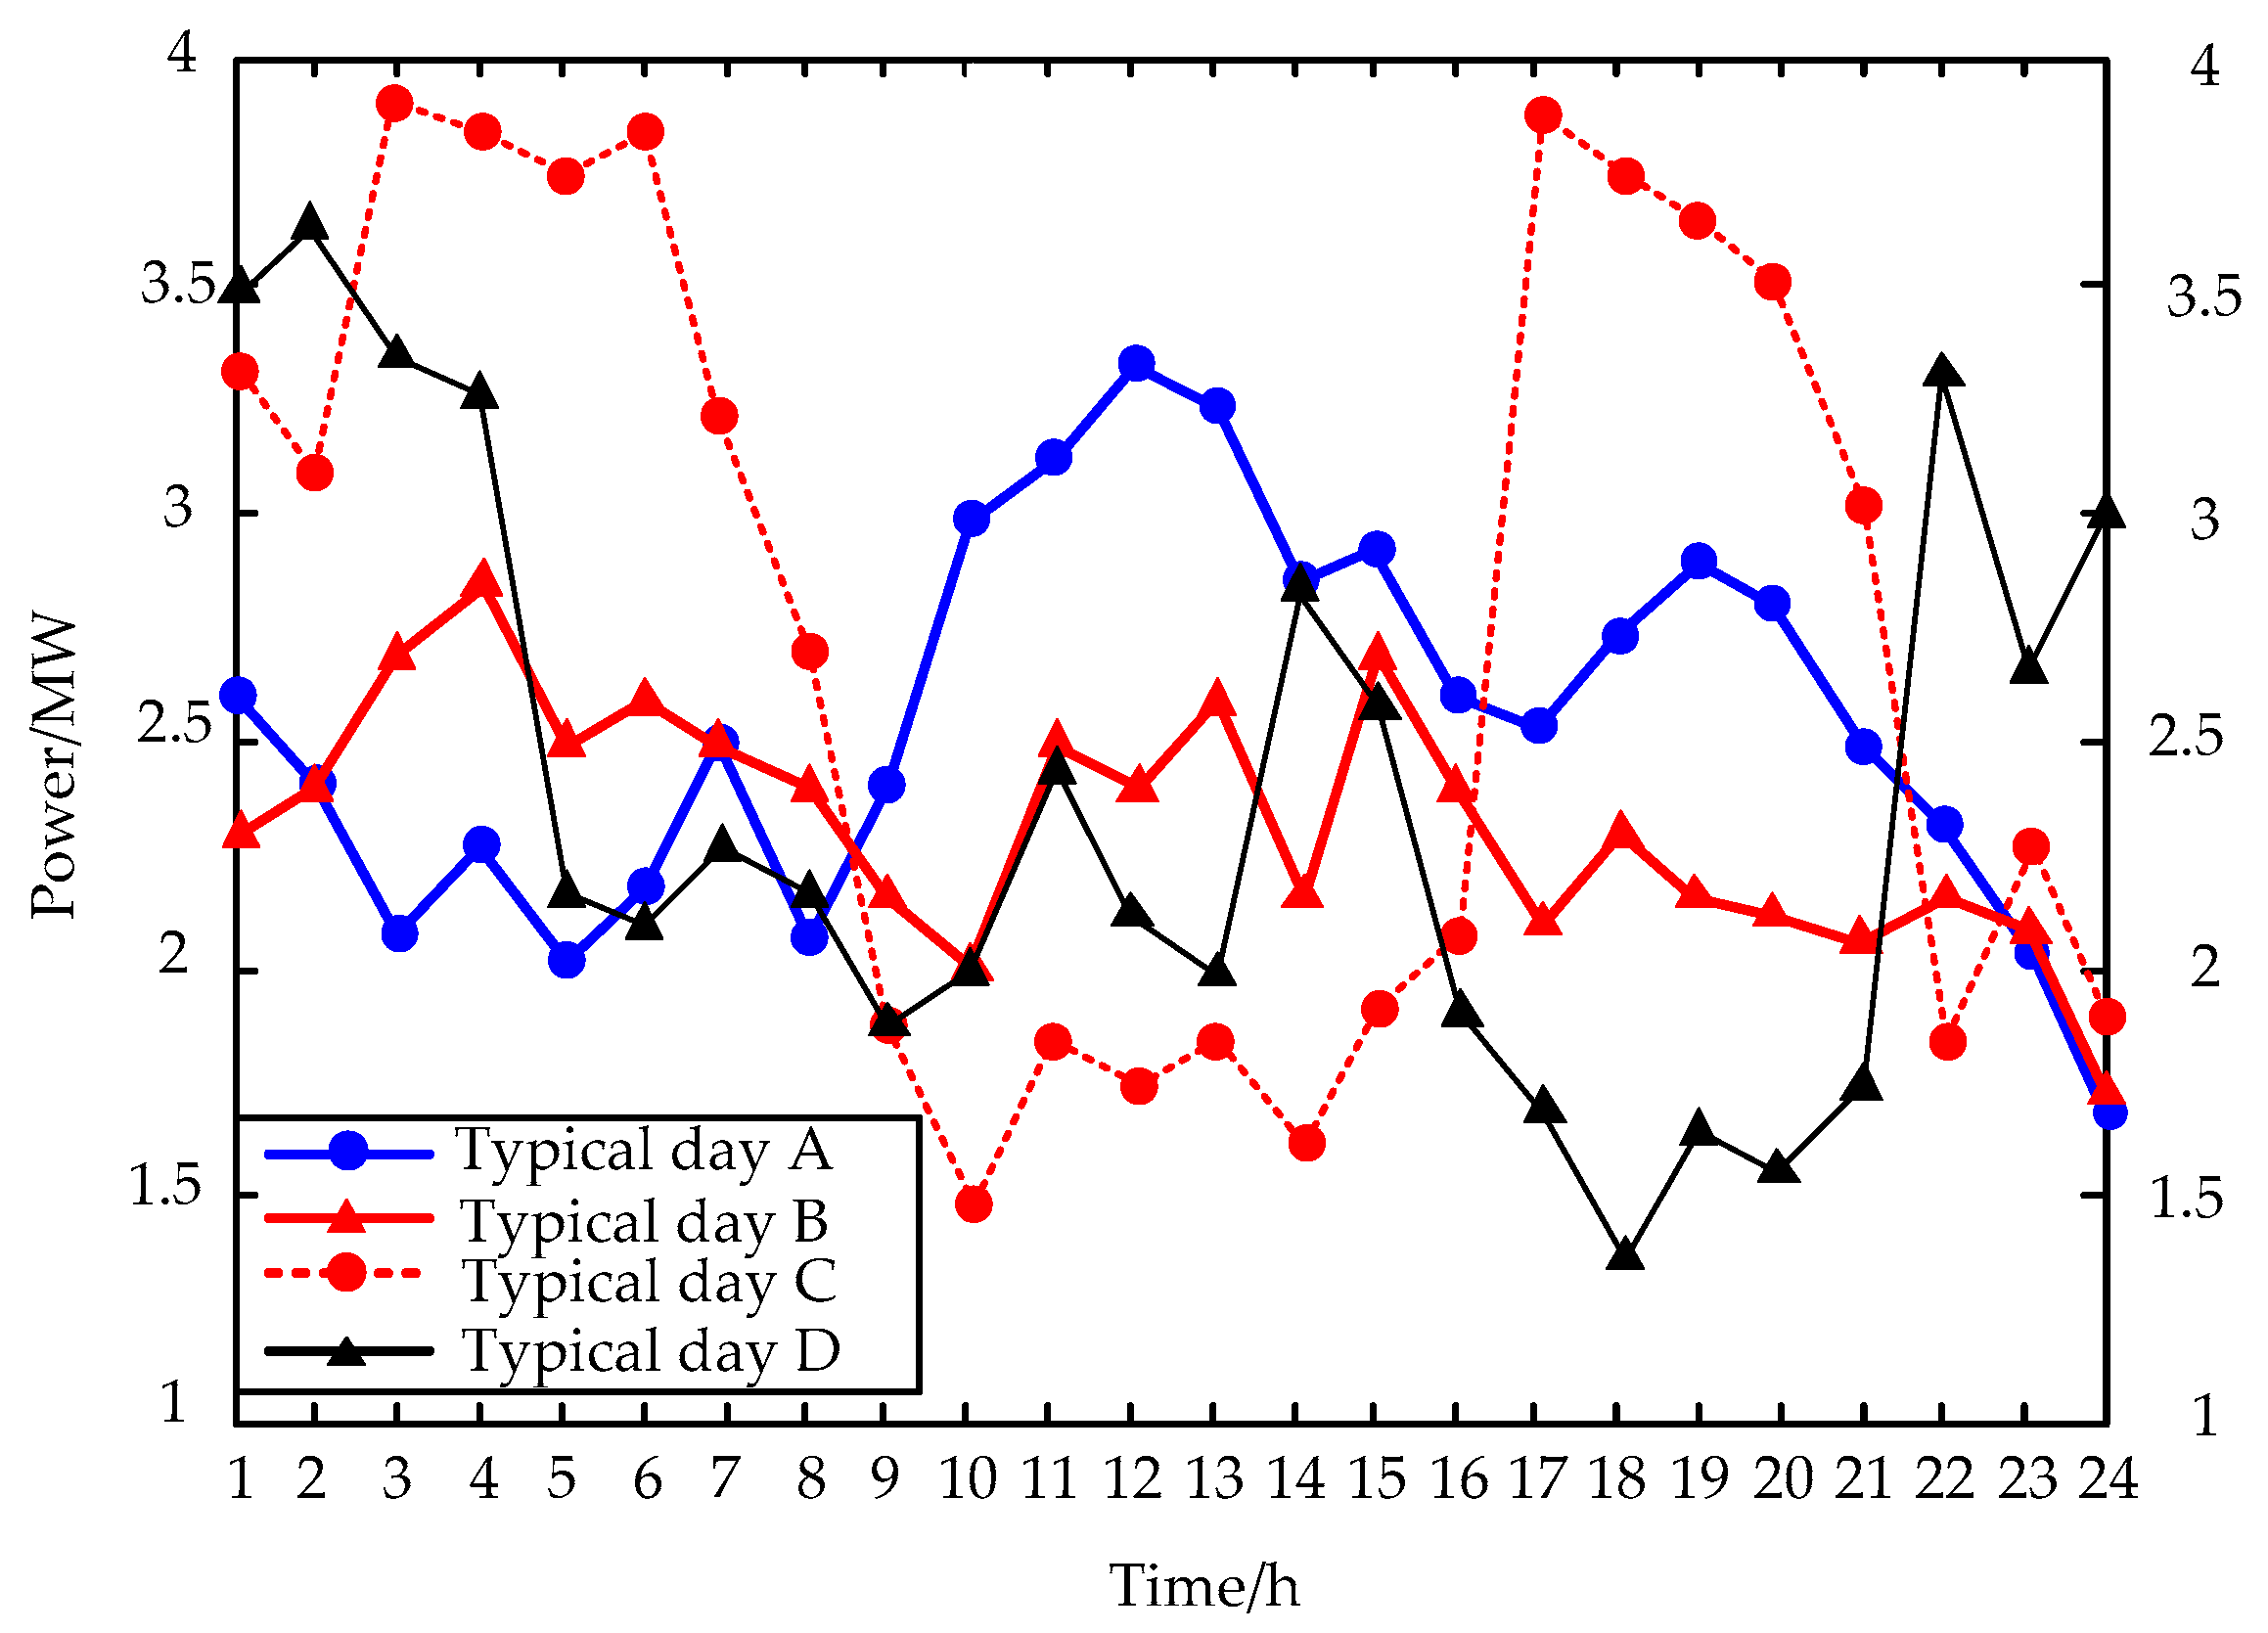
The microgrid model constructed in this paper is improved on the basis of Reference [32], as shown in Figure 1. The parameters and specific data of each unit in the microgrid are as follows: The prediction data of wind power units are provided by a regional microgrid, which is composed of four 1 MW variable speed constant frequency doubly fed wind turbines. The prediction data of photovoltaic power stations are also provided by a regional microgrid. Dt is 0.45 MW in proportion to capacity. The operation cycle of pumped storage units 1 and 2 is synchronized with that of wind and photovoltaic units. In SPSO, the population number of particles is 60 and the maximum number of iterations is 600. ωmax and ωmin are 0.9 and 0.4, respectively. c1 and c2 are both 2, and a and b are both 0.5. The upstream and downstream water storage capacity of the pumped storage unit is 5 MW h and 2 MW h, respectively. The upper and lower limits of the pumped storage power and water discharge power of the pumped storage power station are respectively 1.2 MW and 0.1 MW, and their pumping efficiency and power generation efficiency are both 0.8. In Figure 4, the four most representative wind power forecasting typical days A, B, C, and D are selected. Among them, typical day A belongs to the example of wind power climbing output, which is consistent with the trend of load; typical day B is an example with small fluctuations, and its power does not fluctuate greatly during the dispatching cycle. Typical day C is an example where wind power fluctuates violently in the dispatching cycle, while typical day D is an example of downhill climbing, which well reflects the reverse peak regulation characteristic of wind power. The predicted wind power is shown in Figure 4, respectively. The output curve of photovoltaic output is obtained by typical forecast day E, as shown in Figure 5.

5.2. Example Result

In Figure 6, it can be seen that the addition of pumped storage unit plays an obvious smoothing role in the fluctuation of photovoltaic and wind power. The maximum difference between peak and trough output power of wind power and photovoltaic power was reduced from 2.072 MW to 1.421 MW, decreasing by 31.5% under the regulation of pumped storage unit. The MSE of output power decreased from 0.734 MW to 0.477 MW, decreasing by 35.12%. Meanwhile, the average wind-solar output power decreased from 2.83 MW to 2.71 MW, decreasing by 4.6%. The grid-connected electricity quantity of photovoltaic and wind power decreased from 67.93 MW h to 64.87 MW h, decreasing by 4.5%. Through calculation, it is found that the pumped storage unit has a good improvement on the fluctuation of wind-solar output. However, from the electricity grid connection, it can be seen that the pumped storage unit does not restrict the input and operation of wind and photovoltaic energy. On the contrary, the unit’s output stability and dispatch optimization convenience of clean energy are greatly improved. The combined output power of wind power, photovoltaic power, and pumped storage power reached a maximum of 3.712 MW at the 14th moment. It reaches the minimum value of 2.305 MW at moment 6. The average output power of unit combined operation is 2.71 MW, and the cumulative power generation is 64.87 MW h, and its output MSE is 0.477 MW. Because of the introduction of pumped storage units, there is no wind and photovoltaic energy abandoned.
It can be seen from Figure 7 that the wind power output is relatively stable on the typical dispatching day B, and the pumped storage power station is basically to stabilize the photovoltaic output. Under the regulation of pumped storage unit, the maximum difference between peak and trough of wind-solar output power decreased from 1.825 MW to 1.012 MW, decreasing by 44.9%. The MSE of wind-solar output power decreased from 0.536 MW to 0.241 MW, decreasing by 55.1%. Although the wind power output on dispatching day B is relatively stable, it does not meet the change trend of load. Through the horizontal comparison of the improvement of output mean square error, it can be found that the pumped storage unit has the most obvious effect on improving the smooth wind-solar output. Meanwhile, the average wind-solar output power decreased from 2.808 MW to 2.783 MW, decreasing by 0.95%. The grid-connected electricity quantity of photovoltaic and wind power decreased from 67.392 MW h to 66.792 MW h, decreasing by 0.9%. The combined output power of wind-solar storage reaches a maximum of 3.411 MW at the 14th moment. It reaches the minimum value of 2.49 MW at moment 6. The average output power of wind power, photovoltaic power, and pumped storage power combined operation is 2.783 MW, and the cumulative power generation is 66.792 MW h, and the MSE of output is 0.241 MW. Moreover, due to the introduction of pumped storage units, there is no wind and photovoltaic energy abandoned.
The smoothness of the wind-solar output of the pumped storage unit at a typical day C is shown in Figure 8. It can be seen from the figure that the wind power output fluctuates greatly at C on a typical dispatching day, and the maximum difference between peak and trough peak of wind-solar power output decreases from 2.213 MW to 1.056 MW under the regulation of pumped storage unit, decreasing by 52.43%. The comparison of calculation shows that the pumped storage unit has the most obvious benefits in improving the fluctuation of photovoltaic and wind power under this scenario. The MSE of wind-solar output power decreased from 0.823 MW to 0.428 MW, decreasing by 48.17%. Meanwhile, the average wind-solar output power decreased from 2.907 MW to 2.808 MW, decreasing by 3.38%. The grid-connected electricity of photovoltaic and wind power decreased from 69.772 MW h to 67.392 MW h, decreasing by 3.38%. The combined output power of wind power, photovoltaic power, and pumped storage power reached a maximum of 3.551 MW at the fifth moment. At the 12th moment, the minimum value is 2.189 MW, and the average output power of units in joint operation is 2.808 MW. The cumulative power generation is 67.392 MW h, and its output MSE is 0.428 MW. In addition, there is no wind and photovoltaic energy abandoned under this extremely unstable condition. The reasonable effectiveness of the pumped storage unit and the superiority of the new control strategy have been well verified.
It can be seen from Figure 9 that the reverse peak regulation characteristic of wind power is fully reflected on the typical dispatching day D, and its output is basically opposite to the load demand. Under the regulation of pumped storage unit, the maximum difference between peak and trough of wind-solar output power decreases from 2.311 MW to 1.196 MW, decreasing by 47.96%. The MSE of wind-solar output power decreased from 0.578 MW to 0.277 MW, decreasing by 52.11%. Meanwhile, the average wind-solar output power decreased from 2.64 MW to 2.591 MW, decreasing by 1.85%. The grid-connected electricity of photovoltaic and wind power decreased from 63.451 MW h to 62.182 MW h, decreasing by 1.91%. The combined output power of wind power, photovoltaic power, and pumped storage power reached a maximum of 3.05 MW at the first moment. It reaches the minimum value of 2.133 MW at the 16th moment. The average output power of unit combined operation is 2.591 MW, the cumulative power generation is 62.182 MW h, and its output MSE is 0.277 MW. Through calculation and comparison, it is found that the pumped storage unit has a good effect in improving the wind-solar output power fluctuation and the smoothness of the wind-solar output when dispatching day D.
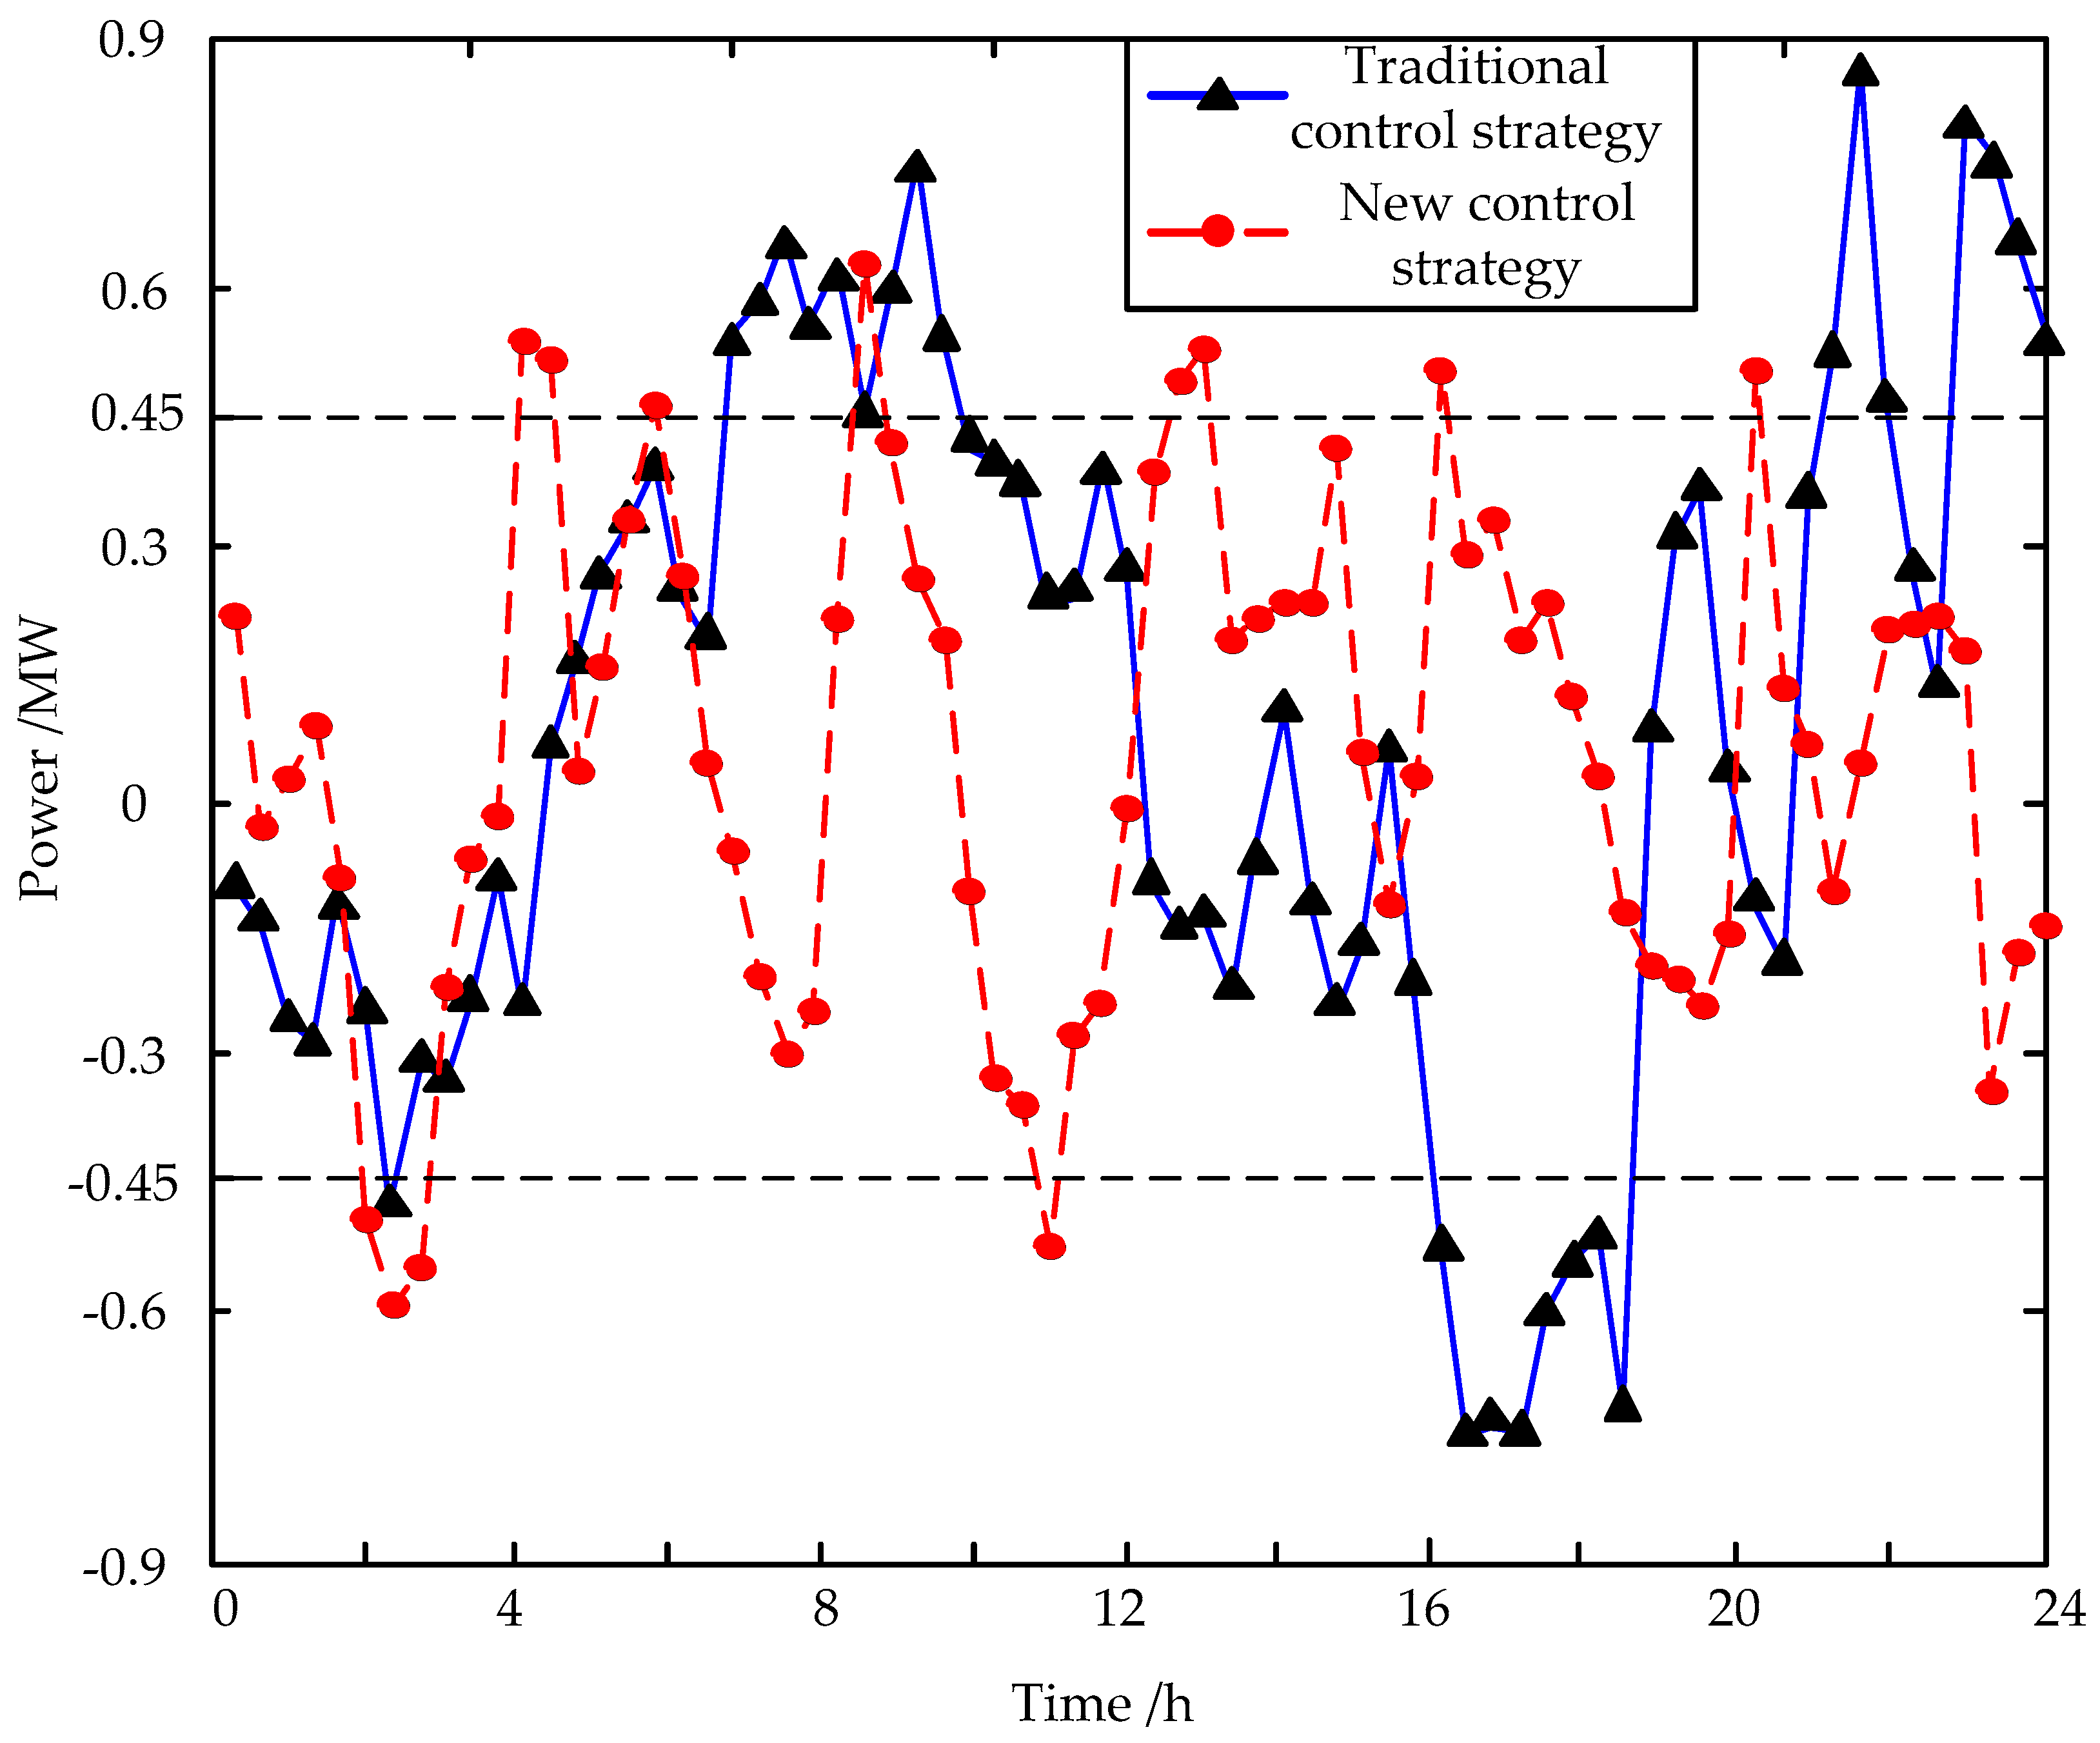
In order to further verify the effectiveness of the new control strategy, it is assumed that at the initial moment, the pumped storage unit 2 pump is in the state of pumped energy storage, the initial energy storage of the upper reservoir is 0.2Emax, the unit 1 is in the state of power generation, and the initial energy storage of the upper reservoir is Emax. The root mean square difference of wind power prediction is 14%. The wind-solar power fluctuations of the two control strategies under typical day C are shown in Figure 10.
It can be seen from Figure 10 that the fluctuation of wind-solar output is extremely severe on the typical dispatching day C, which is more representative and convincing. The traditional control strategy and the new control strategy can basically calm the wind-solar fluctuation well within the set maximum allowable deviation Dt, but the traditional strategy will break the limit at some time. For the traditional control strategy, the new control strategy can only occur in some moments when the wind-solar power exceeds the limit with a small amplitude. In Figure 9, it can be seen at some moments that the power fluctuation with large deviation occurs under the traditional control strategy, which is caused by the insufficient capacity to operate a single unit in the microgrid. The fluctuation with large deviation will undoubtedly have a serious impact on the safe and stable operation of the power system. However, the new control strategy is adopted, and there is basically no large fluctuation of wind-solar power beyond the limit after the fluctuation flattens at C of the typical dispatching day.
Table 1 shows the numerical comparison of Wpass and Ppass under four typical scheduling days. As can be seen from the following table, typical day C has the largest output variation range, so its power fluctuation off-limit value Wpass and off-limit probability Ppass has the largest value, while the two indexes of typical day B has the smallest value. The numerical value of the two indexes is partly related to the output characteristics of a typical day. In addition, the comparison of two control strategies adopted on four typical days and the two indicators shows that the new control strategy has better performance and smoother effect on wind-solar power fluctuation.
As can be seen from Figure 11, compared with the single pumped storage unit, the switching frequency of adjusting the state of the unit with two units is reduced. As can be seen from Figure 11, compared with the single pumped storage unit used to calm wind-solar fluctuations, the switching times of adjusting the state with the coordination of two units are reduced. Because the two sets of units are independent of each other, when a single set of units is transferred to a new state, it will inevitably lead to the shutdown of another state, which will greatly increase the frequency of unit state switching. Through calculation, it can be known that under the joint control of two units, the switching times decreased from 58 times to 11 times for a single unit. It can also be found that regardless of whether for single or two units, the use of the new control strategy will lead to a certain increase in the frequency of unit switching. This is because the new control strategy should not only smooth wind-solar power fluctuations in the current state, but also consider the influence of future fluctuations of wind-solar power in the dispatching cycle on capacity, so as to make the adjustment in advance, and the number of unit switching will increase correspondingly. However, it will undoubtedly have a better effect on wind-solar power fluctuations.

5.3. Different Algorithm Results Comparison

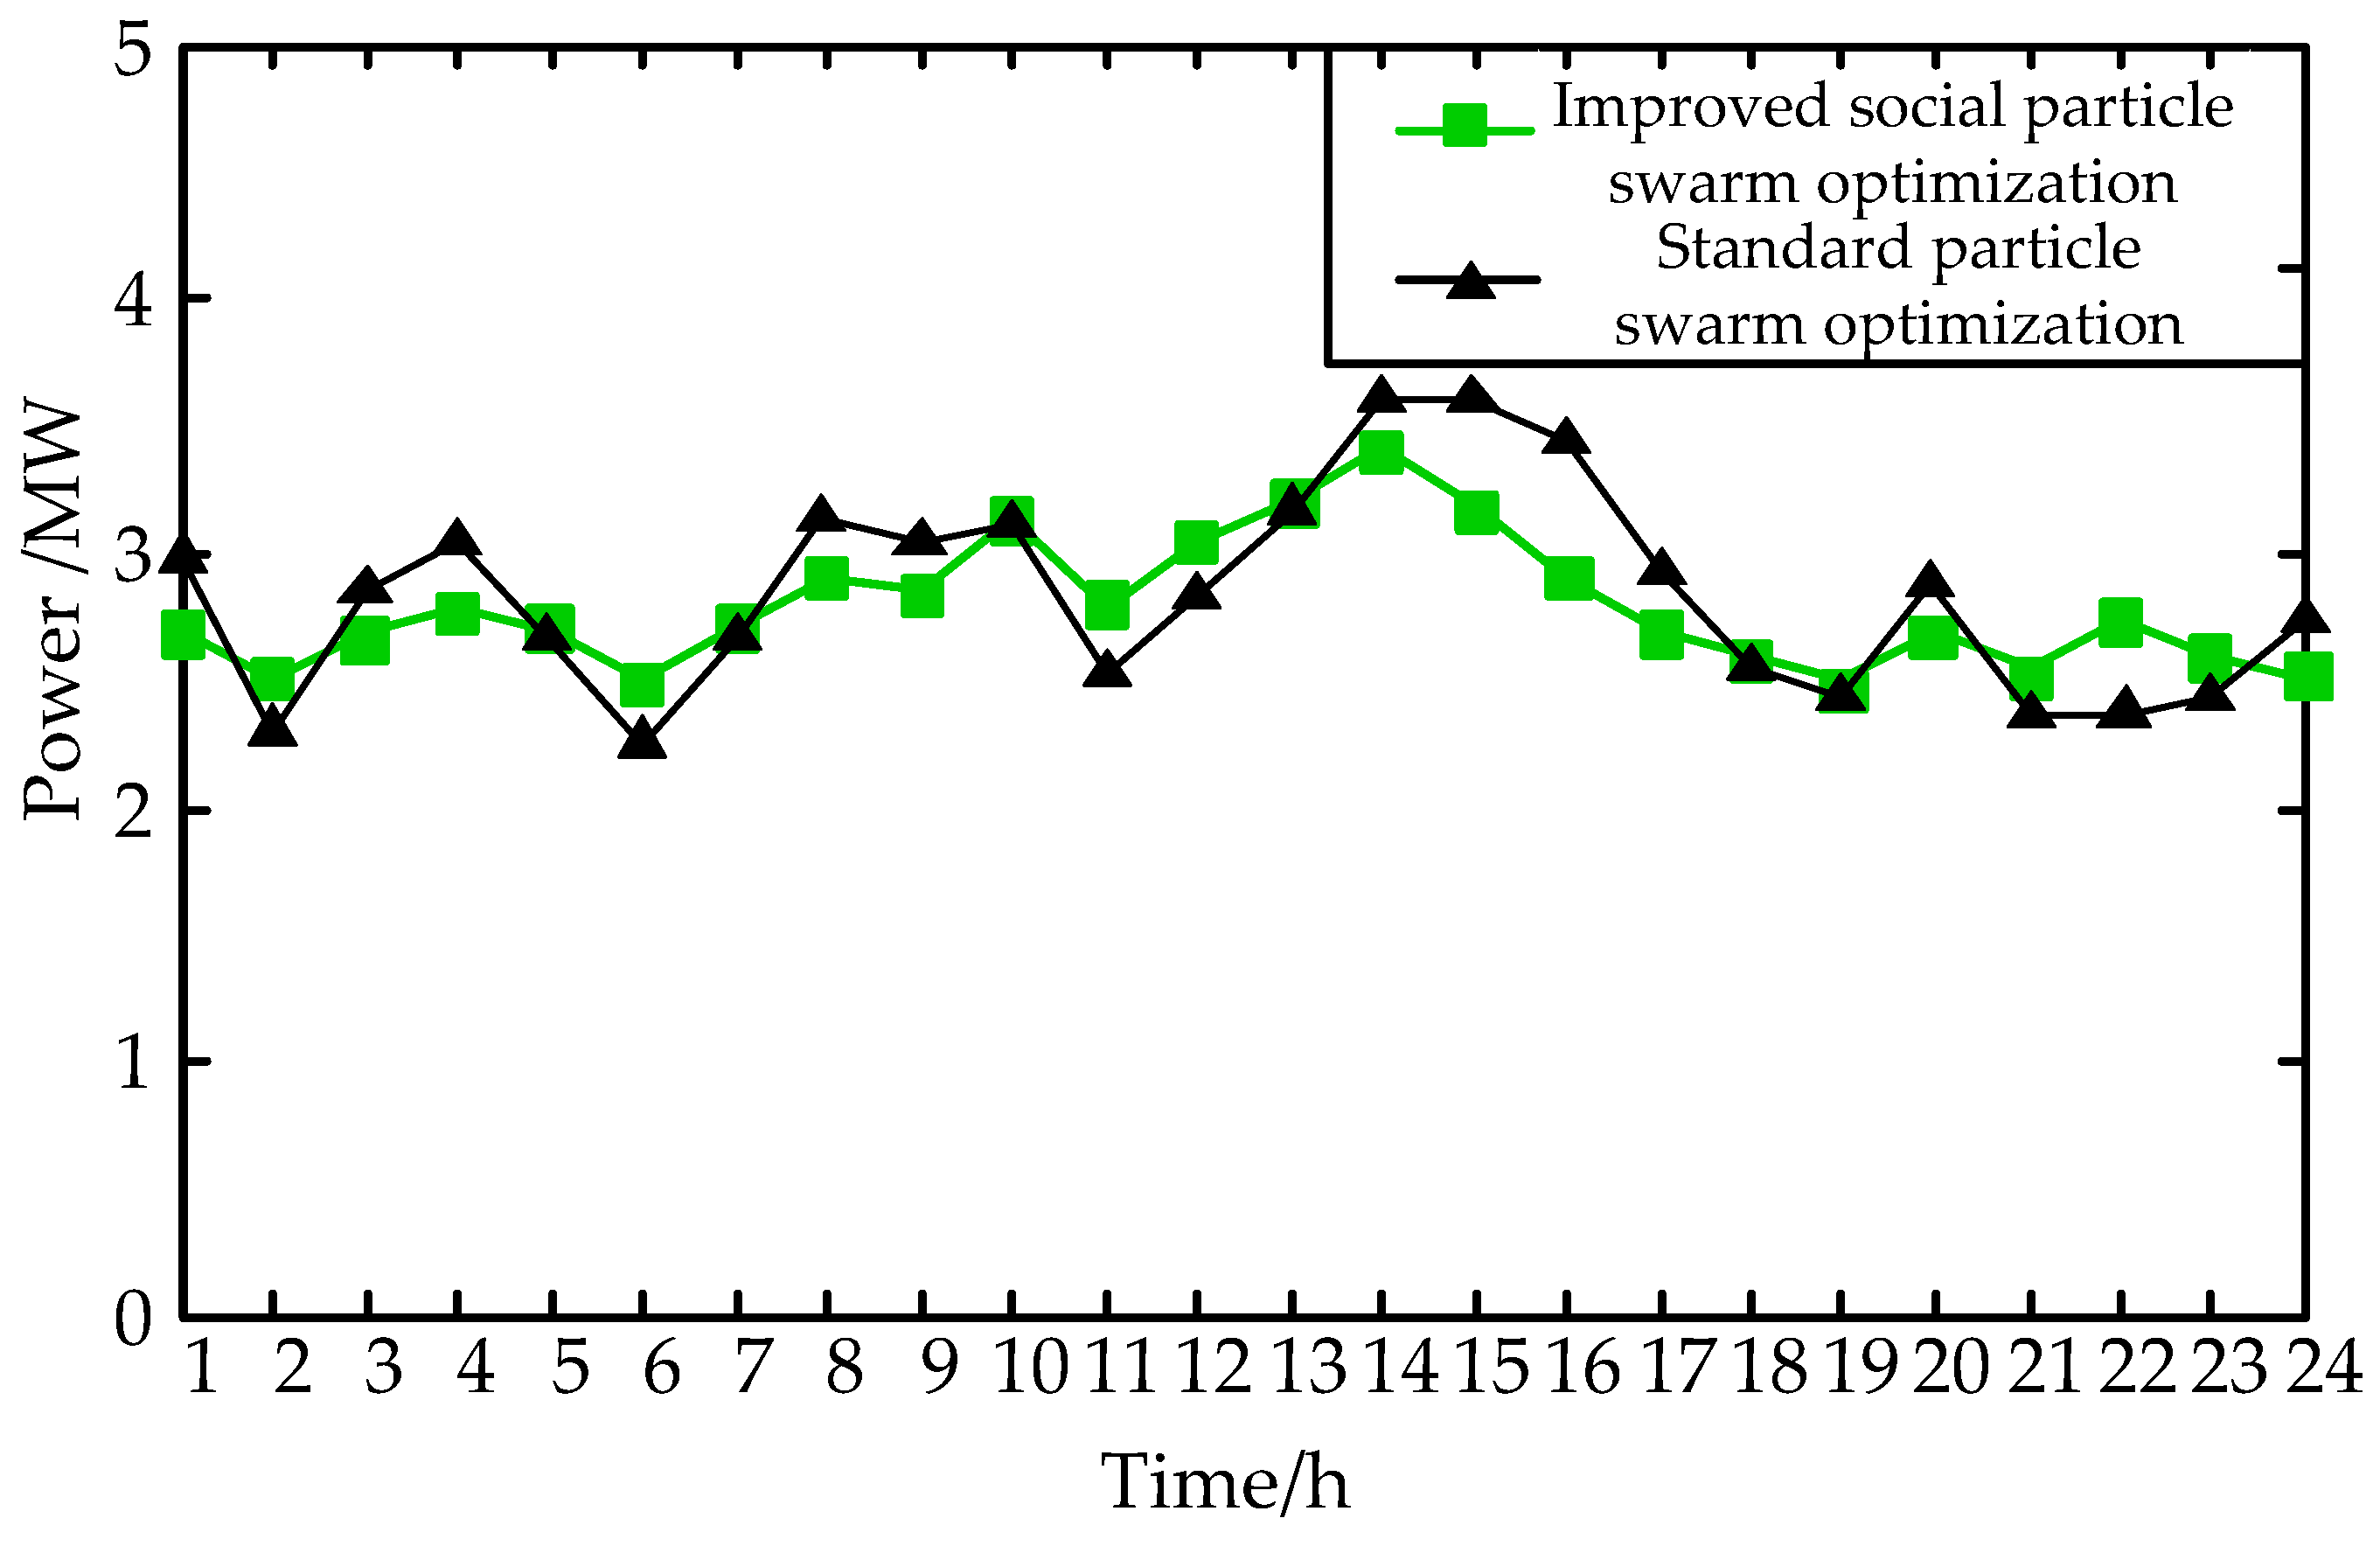
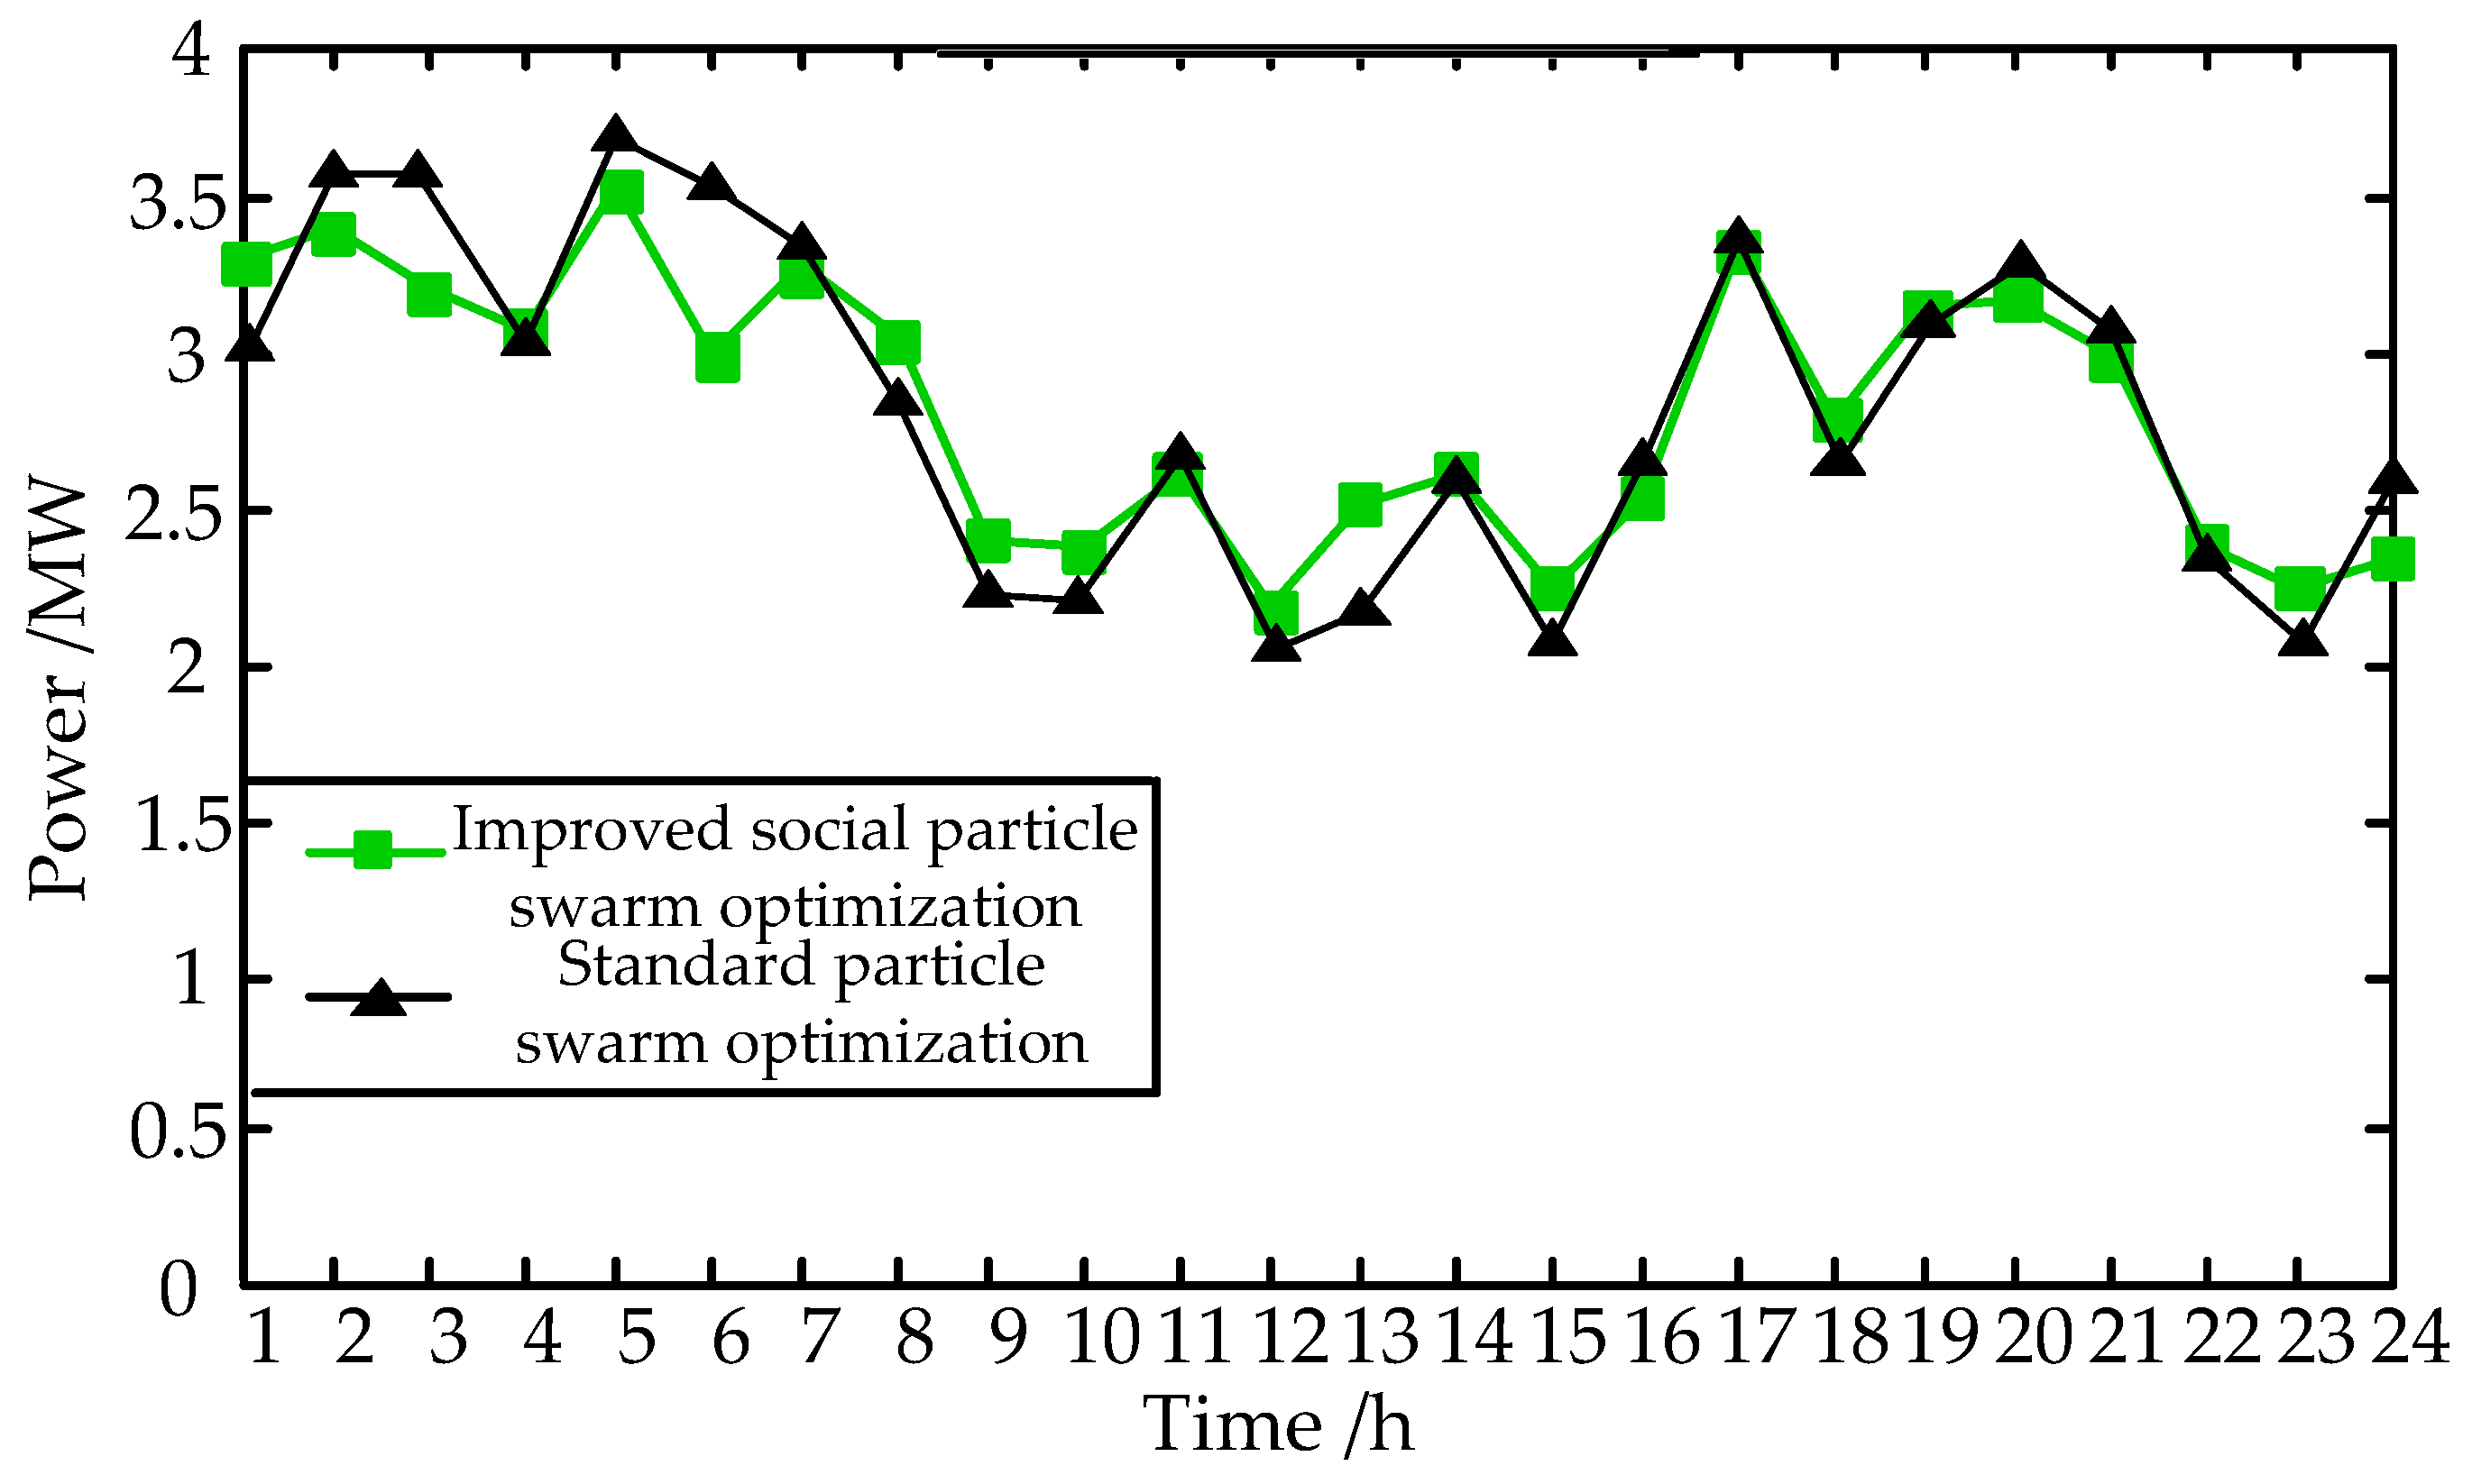
In this paper, the advantages of the improved social particle swarm optimization algorithm for model solving are verified by comparing the computational accuracy and iterative speed, and the results of two algorithms are compared and analyzed. Figure 12, Figure 13, Figure 14 and Figure 15 show the comparison diagrams of combined output of wind power, photovoltaic, and pumped storage power units calculated by standard PSO and improved weighted SPSO under four typical days of A, B, C, and D, respectively. Table 2 shows the comparison of the convergence rate when the two algorithms process model in four typical days A, B, C, and D.
From Figure 12, Figure 13, Figure 14 and Figure 15, the comparison charts of combined output of units obtained on four typical days show that the output curves obtained by the two algorithms are all within the allowable deviation range, and the value difference is not very large. The results show that the improved SPSO algorithm is effective and feasible. By observing Figure 12, Figure 13, Figure 14 and Figure 15, more comparisons show that, compared with the standard PSO, the output curve obtained by the improved SPSO has a significantly smaller difference between the maximum output and the minimum output (peak and trough difference) in the dispatching cycle. Therefore, in the dispatching cycle for the system’s units, operation economy and convenience will have better performance. It can be seen from Table 2 that in four typical days, the improved SPSO algorithm has a faster convergence speed and obvious advantages. Through comparative analysis, the advantages of the improved SPSO compared with the standard PSO in calculation accuracy and convergence speed have been well verified.

6. Conclusions

This paper is based on wind and photovoltaic power fluctuation, intermittence, and the inverse peak regulation characteristics of wind power units. The pumped storage units are introduced into the microgrid to control the power fluctuation, and considering that the small pumped storage units in the microgrid cannot achieve the control effect, which is expected due to the limitation of the capacity, a new control strategy based on the traditional control strategy is proposed that the two units coordinate with each other. Taking the minimum MSE of combined output of wind power, photovoltaic, and pumped storage units as the objective function, the control effect of pumped storage units is measured, and the operating constraints of each unit are taken into account. Finally, the improved SPSO algorithm was used to solve the model and the results were compared and analyzed. Through the comparison and verification of the improved SPSO algorithm, it is found that the improved algorithm has better performance in calculation accuracy and calculation speed. It was verified that the combined output of the unit using the new control strategy was smoother and also avoided the large instantaneous power fluctuation due to the unit’s capacity problem. There is no wind and photovoltaic energy abandoned in the dispatching cycle, which further verified the effectiveness of the new control strategy, provided a reliable guarantee for the increase of the investment proportion of wind power, photovoltaic, and other green renewable energy in the grid, and had far-reaching significance for the convenience of dispatching optimization and the improvement of social’s production efficiency.
This paper considers that the pumped storage unit has the advantages of flexible engineering location, low investment, quick response, and low requirement for transmission lines. For future research, in addition to pumped storage units, other units with energy storage properties such as batteries, ultracapacitors, flywheels, or hydrogen can also be considered. The new control strategy proposed in this paper can be adjusted and applied to these units, in order to smooth the output fluctuation of wind power and PV units, and then carry out a comparative analysis of the smoothing effect.

Author Contributions

G.W., X.S., and H.J. conceived the theory and built the model; S.C., Y.Z., and H.X. performed the experiments and analyzed the data; G.W. and X.S. wrote the paper. All authors have read and agreed to the published version of the manuscript.

Funding

This research is funded by Science and Technology Development Program of Jilin Province under grant number 20190302085GX and State-Sponsored Senior Research Scholars, Visiting scholars, Postdoctoral programs under grant number 201908220033.

Conflicts of Interest

The authors declare no conflict of interest.

References

  1. Reddy, S.S.; Bijwe, P.R. Real time economic dispatch considering renewable energy resources. Renew. Energy 2015, 83, 1215–1226. [Google Scholar] [CrossRef]
  2. Kherfane, N.; Kherfane, R.L.; Younes, M.; Khodja, F. Economic and Emission Dispatch with Renewable Energy Using HSA. Energy Procedia 2014, 50, 970–979. [Google Scholar] [CrossRef] [Green Version]
  3. Yang, Y.; Zhai, R.; Duan, L.; Ondrej, M.; John, O. Study on multi-objective optimization of load dispatch including renewable energy and CCS technologies. Int. J. Energy Res. 2009, 34, 702–715. [Google Scholar]
  4. Castronuovo, E.D.; Usaola, J.; Bessa, R.; Matos, M.; Cost, I.C.; Bremermann, L.; Lugaro, J.; Kariniotakis, G. An integrated approach for optimal coordination of wind power and hydro pumping storage. Wind. Energy 2014, 17, 829–852. [Google Scholar] [CrossRef] [Green Version]
  5. Surender Reddy, S.; Bijwe, P.R.; Abhyankar, A.R. Real-Time Economic Dispatch Considering Renewable Power Generation Variability and Uncertainty Over Scheduling Period. IEEE Syst. J. 2014, 9, 1440–1451. [Google Scholar] [CrossRef]
  6. Osório, G.J.; Lujano-Rojas, J.M.; Matias, J.C.O.; Catalão, J.P.S. A probabilistic approach to solve the economic dispatch problem with intermittent renewable energy sources. Energy 2015, 82, 949–959. [Google Scholar] [CrossRef]
  7. Yuan, T.J.; Chao, Q.; Li, Y.-Y.; Toerxun, Y. Short-term Wind Power Output Forecasting Model for Economic Dispatch of Power System Incorporating Large-scale Wind Farm. Proc. CSEE 2010, 30, 23–27. [Google Scholar]
  8. Wang, X.; Wang, J.; Tian, B.; Cui, Y.; Zhao, Y. Economic Dispatch of the Low-Carbon Green Certificate with Wind Farms Based on Fuzzy Chance Constraints. Energies 2018, 11, 943. [Google Scholar] [CrossRef] [Green Version]
  9. Antonanzas, J.; Osorio, N.; Escobar, R.; Urraca, R.; Martinez-de-Pison, F.J.; Antonanzas-Torres, F. Review of photovoltaic power forecasting. Sol. Energy 2016, 136, 78–111. [Google Scholar] [CrossRef]
  10. Kuo, P.-H.; Huang, C.-J. A Green Energy Application in Energy Management Systems by an Artificial Intelligence-Based Solar Radiation Forecasting Model. Energies 2018, 11, 819. [Google Scholar] [CrossRef]
  11. Yao, W.; Deng, C.; Li, D.; Chen, M.; Peng, P.; Zhang, H. Optimal Sizing of Seawater Pumped Storage Plant with Variable-Speed Units Considering Offshore Wind Power Accommodation. Sustainability 2019, 11, 1939. [Google Scholar] [CrossRef] [Green Version]
  12. Nko, M.; Chowdhury, S.D.; Popoola, O. Application Assessment of Pumped Storage and Lithium-Ion Batteries on Electricity Supply Grid. Energies 2019, 12, 2855. [Google Scholar] [CrossRef] [Green Version]
  13. Duque, A.J.; Castronuovo, E.D.; Sánchez, I.; Usaola, J. Optimal operation of a pumped-storage hydro plant that compensates the imbalances of a wind power producer. Electr. Power Syst. Res. 2011, 81, 1767–1777. [Google Scholar] [CrossRef] [Green Version]
  14. Xu, F.; Chen, L.; Jin, H.; Liu, Z. Modeling and Application Analysis of Optimal Joint Operation of Pumped Storage Power Station and Wind Power. Autom. Electr. Power Syst. 2013, 37, 149–154. [Google Scholar]
  15. Helseth, A.; Gjelsvik, A.; Mo, B.; Linnet, Ú. A model for optimal scheduling of hydro thermal systems including pumped-storage and wind power. IET Gener. Transm. Distrib. 2013, 7, 1426–1434. [Google Scholar] [CrossRef]
  16. Manolakos, D.; Papadakis, G.; Papantonis, D.; Kyritsis, S. A stand-alone photovoltaic power system for remote villages using pumped water energy storage. Energy 2004, 29, 57–69. [Google Scholar] [CrossRef]
  17. Zhu, Y.; Zou, Z.; Huang, W.; Wang, L.; Ma, G. The water, Wind and Solar Power Complementary Operation Research for Typical Power Station in Upper Reaches of Jinsha River. J. Hydroelectr. Eng. 2017, 36, 78–85. [Google Scholar]
  18. Liu, F.; Pan, Y.; Yang, J.; Zhou, J.; Zhou, J.; Zhu, Z.; Li, Q. Unit Commitment Model for Combined Optimization of Wind Power-Thermal Power-Pumped Storage Hydro. Proc. CSEE 2015, 35, 766–775. [Google Scholar]
  19. Oskouei, M.Z.; Yazdankhah, A.S.A. Scenario-based stochastic optimal operation of wind, photovoltaic, pump-storage hybrid system in frequency- based pricing. Energy Convers. Manag. 2015, 105, 1105–1114. [Google Scholar] [CrossRef]
  20. Yi, P.F.; Zhang, J.; Zhang, Z.Y. Modeling and Practice of Wind/PV/Pumped-Storage Hybrid System. Appl. Mech. Mater. 2014, 541-542, 892–897. [Google Scholar] [CrossRef]
  21. Rakhshan, M.; Vafamand, N.; Khooban, M.-H.; Blaabjerg, F. Maximum Power Point Tracking Control of Photovoltaic Systems: A Polynomial Fuzzy Model-Based Approach. IEEE J. Emerg. Sel. Top. Power Electron. 2017, 6, 292–299. [Google Scholar] [CrossRef]
  22. Akagi, S.; Yoshizawa, S.; Ito, M.; Fujimoto, Y.; Miyazaki, T.; Hayashi, Y.; Tawa, K.; Hisada, T.; Yano, T. Multipurpose control and planning method for battery energy storage systems in distribution network with photovoltaic plant. Int. J. Electr. Power Energy Syst. 2020, 116, 105485. [Google Scholar] [CrossRef]
  23. Jabir, M.; Azil Illias, H.; Raza, S.; Mokhlis, H. Intermittent smoothing approaches for wind power output: A review. Energies 2017, 10, 1572. [Google Scholar] [CrossRef] [Green Version]
  24. Khare, A.; Rangnekar, S. A review of particle swarm optimization and its applications in Solar Photovoltaic system. Appl. Soft Comput. 2013, 13, 2997–3006. [Google Scholar] [CrossRef]
  25. Cai, J.; Ma, X.; Li, L.; Peng, H. Chaotic particle swarm optimization for economic dispatch considering the generator constraints. Energy Convers. Manag. 2007, 48, 645–653. [Google Scholar] [CrossRef]
  26. Wang, X.; Chen, S.; Zhou, Y.; Wang, J.; Cui, Y. Optimal Dispatch of Microgrid with Combined Heat and Power System Considering Environmental Cost. Energies 2018, 11, 2493. [Google Scholar] [CrossRef] [Green Version]
  27. Ren, Y.; Zheng, Y.; Li, Y.P.; Huang, J.J.; Zhang, D. Modeling and Optimization of Hybrid Wind/PV Pumped-Storage Power System. Appl. Mech. Mater. 2011, 48–49, 693–696. [Google Scholar] [CrossRef]
  28. Yan, R.; Yuan, Z. Optimal Design of PV/Wind/Pumped-Storage Hybrid System Based on Improved Particle Swarm Optimization. J. Comput. Theor. Nanosci. 2012, 6, 660–663. [Google Scholar] [CrossRef]
  29. Petrakopoulou, F.; Robinson, A.; Loizidou, M. Simulation and analysis of a stand-alone solar-wind and pumped-storage hydropower plant. Energy 2016, 96, 676–683. [Google Scholar] [CrossRef] [Green Version]
  30. Ghasemi, A.; Enayatzare, M. Optimal energy management of a renewable-based isolated microgrid with pumped-storage unit and demand response. Renew. Energy 2018, 123, 460–474. [Google Scholar] [CrossRef]
  31. González, I.; Calderón, A.J. Integration of open source hardware Arduino platform in automation systems applied to Smart Grids/Micro-Grids. Sustain. Energy Technol. Assess. 2019, 36, 100557. [Google Scholar] [CrossRef]
  32. Yunxin, Z.; Yunquan, S. Control strategy of a hybrid energy storage in wind-solar hybrid generation micro-grid. Power Syst. Prot. Control. 2015, 43, 93–98. [Google Scholar]
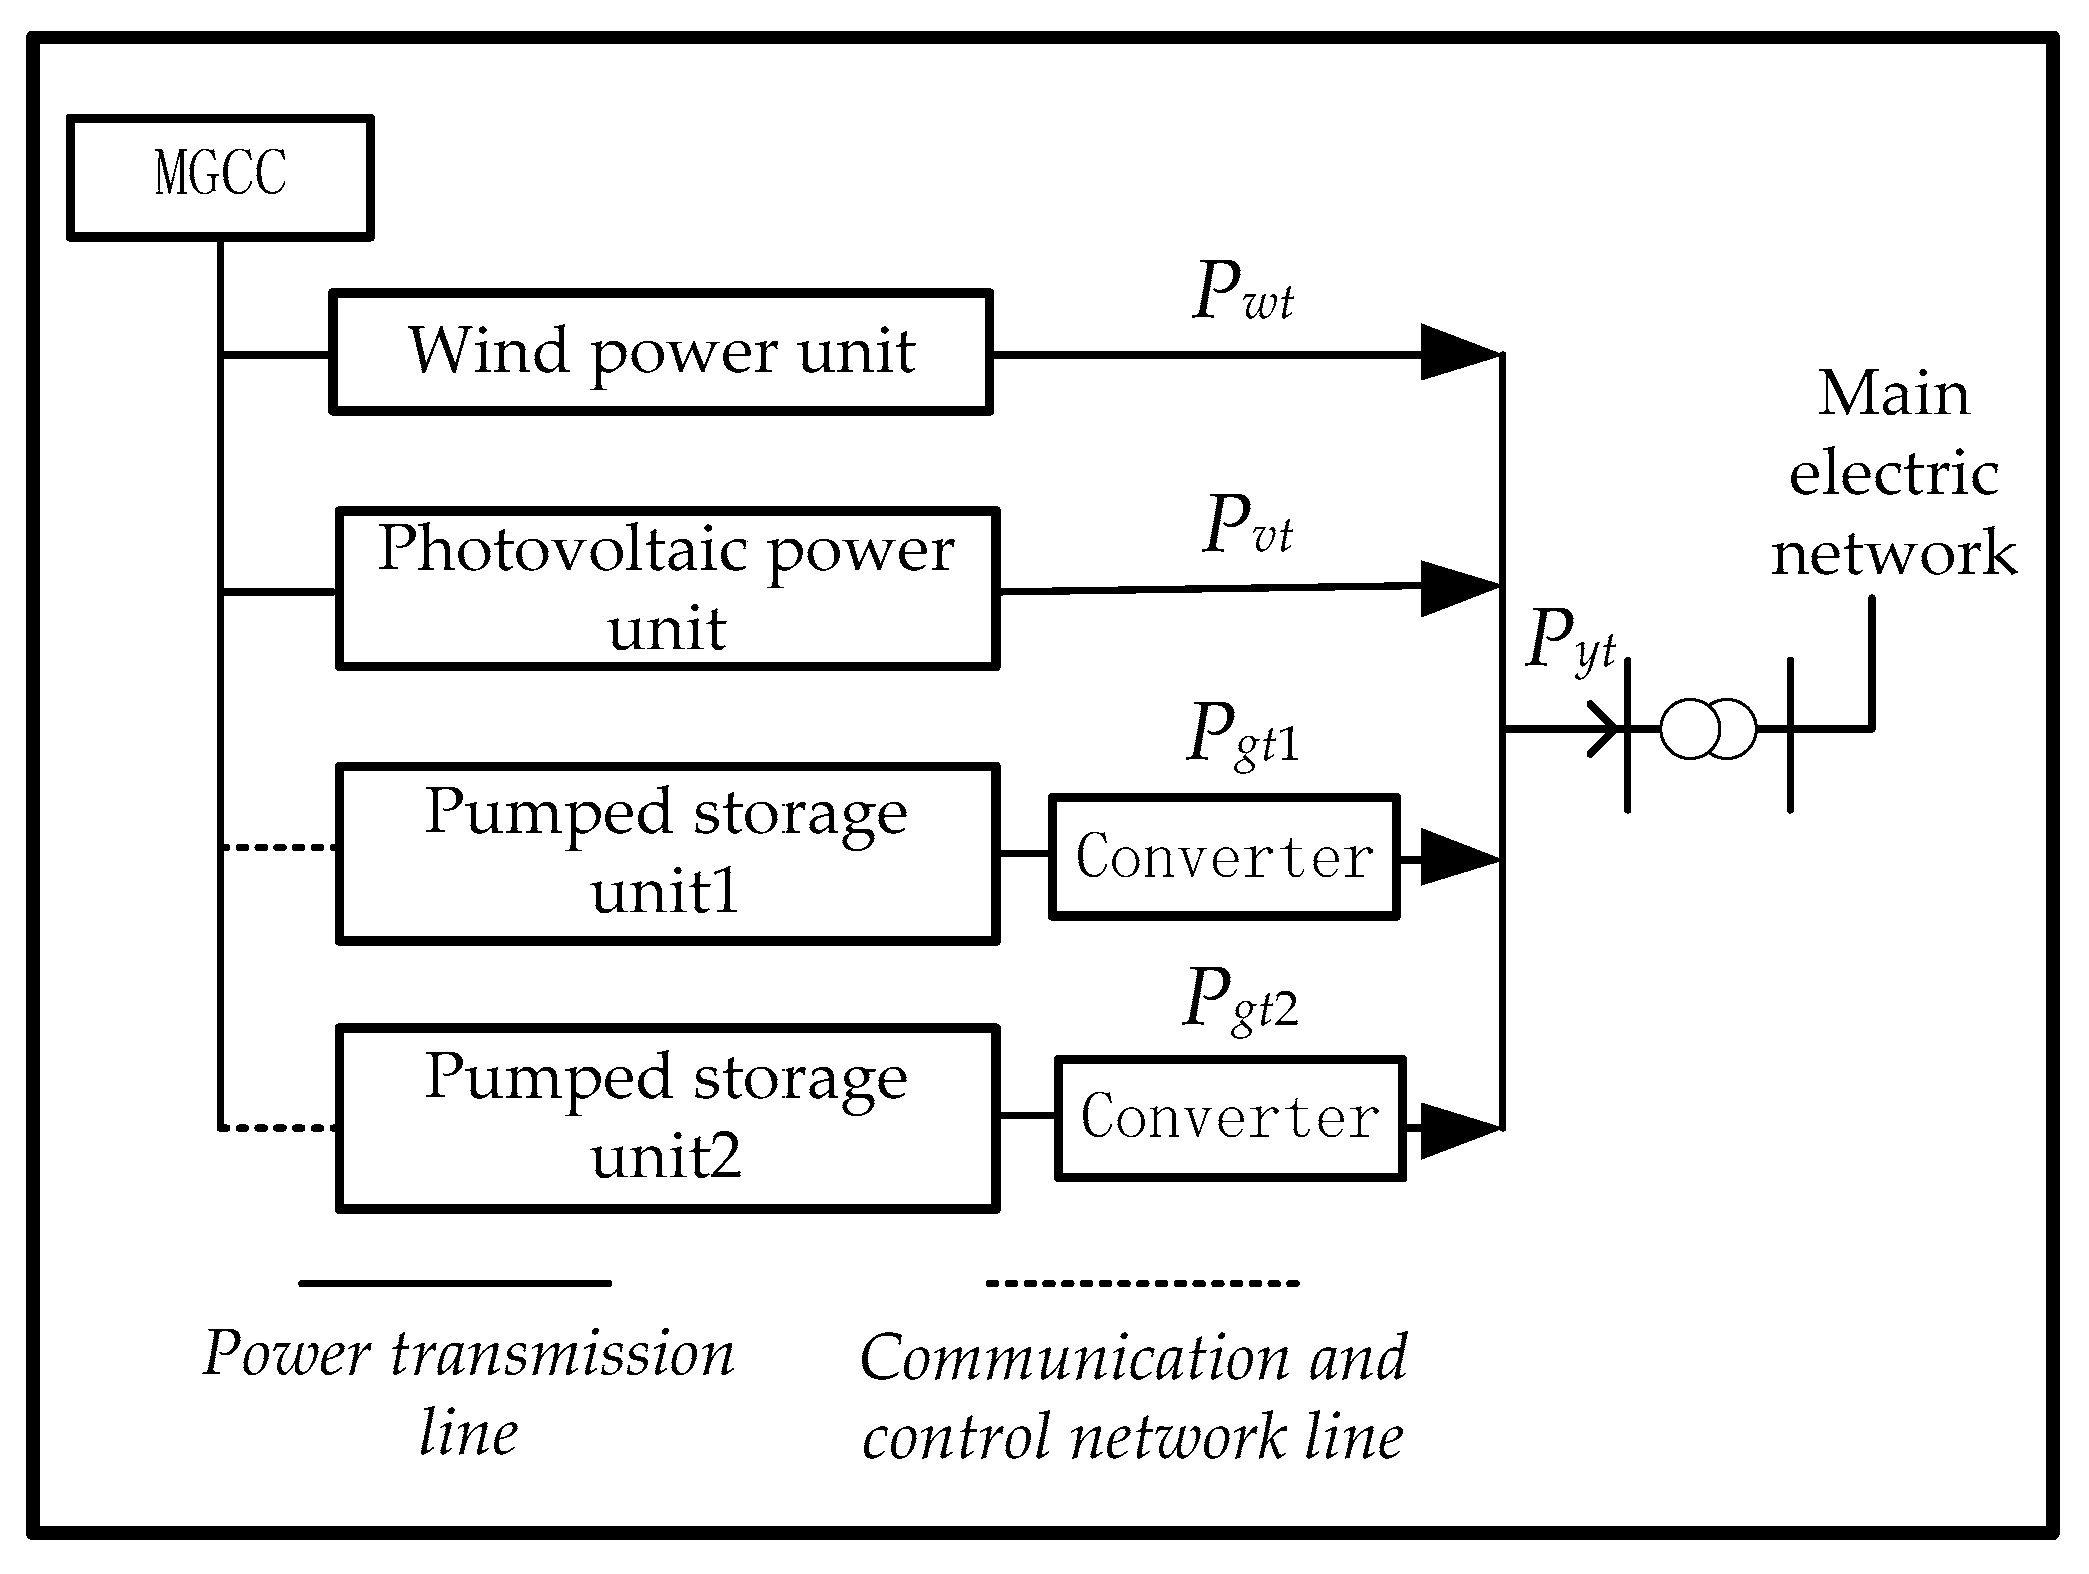
Figure 1. The structure of microgrid.
Energies 13 00415 g001
Figure 2. Flowchart of new control strategy.
Energies 13 00415 g002
Figure 3. Flowchart for improved social particle swarm optimization (SPSO).
Energies 13 00415 g003
Figure 4. Typical daily power curves of A, B, C, and D obtained by wind farm prediction.
Energies 13 00415 g004
Figure 5. Photovoltaic (PV) power prediction curve of typical daily E.
Energies 13 00415 g005
Figure 6. The output curve of each unit after the pumped storage energy flattens on typical day A.
Energies 13 00415 g006
Figure 7. The output curve of each unit after the pumped storage energy flattens on typical day B.
Energies 13 00415 g007
Figure 8. The output curve of each unit after the pumped storage energy flattens on typical day C.
Energies 13 00415 g008
Figure 9. The output curve of each unit after the pumped storage energy flattens on typical day D.
Energies 13 00415 g009
Figure 10. Unit combined power fluctuation under two control strategies.
Energies 13 00415 g010
Figure 11. Unit combined power fluctuation under two control strategies.
Energies 13 00415 g011
Figure 12. The comparison of the joint output curves between the two strategies on typical day A.
Energies 13 00415 g012
Figure 13. The comparison of the joint output curves between the two strategies on typical day B.
Energies 13 00415 g013
Figure 14. The comparison of the joint output curves between the two strategies on typical day C.
Energies 13 00415 g014
Figure 15. The comparison of the joint output curves between the two strategies on typical day D.
Energies 13 00415 g015
Table 1. Comparison of the moderating effects of the two strategies on wind-solar power fluctuation on typical days A, B, C, and D.
Comparison of ResultsTypical Day ATypical Day BTypical Day CTypical Day D
WpassPpass (%)WpassPpass (%)WpassPpass (%)WpassPpass (%)
Traditional strategy0.78 MW7.130.21 MW0.612.64 MW20.150.53 MW5.15
New strategy0.27 MW2.54000.94 MW9.120.15 MW1.23
Table 2. Comparison of two algorithm covergence rate.
Comparison of ResultsSPSOImproved SPSO
Typical day A/times515297
Typical day B/times510303
Typical day C/times508300
Typical day D/times512301