1. Introduction
Passenger mobility is one of the most significant contributors to global climate change, and its carbon emissions are still growing. Local air pollution limit values for PM
10 and NO
x are regularly exceeded at traffic monitoring sites across the European Union [
1]. Policy-makers have recognized these problems, which are associated with internal combustion engines (ICEs) and car mobility, and have implemented various policies, most notably regulations regarding vehicle emissions within the EU and also financial and other instruments to support low-carbon fuel and propulsion systems both within the EU and nationally, including electric mobility. Full battery-electric vehicles (FBEVs) have the potential to impose a much lower climate footprint, but this depends on the fraction of renewables in the electricity that fuels the FBEVs and the production of the batteries. In a country like Denmark, for instance, FBEVs currently have approximately half the climate footprint of plug-in hybrid electric vehicles (PHEVs) and efficient ICE vehicles that have approximately the same footprint during their life cycle [
2]. If the share of renewable grows in the future, then FBEVs will compare even more favourably with PHEVs.
A major objective of both the EU’s and most national transport policies in European states is to increase the penetration of FBEVs into existing vehicle mobility. The common challenge is to stimulate change in a market that has long been dominated by an incumbent technology, the internal combustion engine (ICE). The mobility system that has grown up around the ICE can be seen as a regime [
3,
4] that has proved remarkably resilient because of user preferences, sunk costs, infrastructure issues, engineering scepticism about alternatives, scale-economies and lobbying against the introduction of automobile emission regulations, which acted to ‘lock out’ alternatives [
5,
6]. The emergence of electric mobility therefore faces a ‘web of constraints’ [
7] that includes people’s preferences and practices, infrastructure, the character of established business models and the current policy contexts both nationally and within the EU. The emergence of electric mobility requires, among other things, the manufacture of affordable vehicles that are attractive to car drivers and are supported by a recharging infrastructure.
This paper evaluates how policy shaped the emergence of electric (e-)mobility in three countries, Norway, the Netherlands and Denmark, between 2010 and 2015, a period in which all three actively encouraged e-mobility. The countries are also of specific interest because they were the first to show this level of ambition in respect of e-mobility. Our evaluation is based on interviews with stakeholders and experts, supplemented with an analysis of relevant reports and data analysis of the diffusion of battery electric vehicles and relevant alternatives. We seek explanation for the differences in e-mobility use in the three countries in the first five years of policy support. Other studies have evaluated the effects of financial instruments and recharging infrastructure, but separately (e.g., [
8] through regression analysis; [
9]), but such studies neglect or even ignore the interaction effects of different types of policy. However, the performance of policy instruments depends on their interaction with other measures that may be in place. Instrument interaction effects on e-mobility have not yet been studied. Our aim is to highlight and understand the interaction effects of five policy domains and contribute an empirical, ex-post evaluation of electric mobility to the recent interest in and debate on policy mixes. It is increasingly recognized that a multiplicity of instruments is needed to understand such transitions (see e.g., [
10,
11,
12,
13]), but in the main only ex-ante analyses of instrument interaction have been produced so far; we offer an ex-post evaluation instead. Our research question is: how does the composition of the policy mix in each of the three countries explain the respective sales levels of full battery-electric vehicles (FBEVs)? Related to this, we discuss what policy lessons can be drawn regarding the transition to e-mobility.
The paper is organized as follows. The next section reviews the literature on policy mixes and describes our research methods.
Section 3 discusses similarities and differences in the national policy mixes of five groups of policy instruments in Norway, the Netherlands and Denmark, including FBEV demand-side (such as financial incentives for FBEV adoption), FBEV supply-side (i.e., FBEV industry policies), FBEV infrastructure, cleaner internal combustion engine (ICE) cars and renewable energy. In
Section 4, we analyse and discuss interaction effects within the policy mix in the three countries and their overall impact on electric vehicle (EV) sales. The last
Section 5 draws conclusions about the policy mixes we observed and makes recommendations on their use in national transitions to e-mobility and supporting infrastructure within a common EU policy context.
4. Policy Interaction Effects and Discussion
This section compares the composition of the policy mixes that affect e-mobility in the three countries in terms of policy synergies, contradictions and conditional effects to explain EV sales. We show in
Table 6 below how stakeholders evaluated the intensity of the five policy types that were reported to be relevant for e-mobility, as discussed in the previous section.
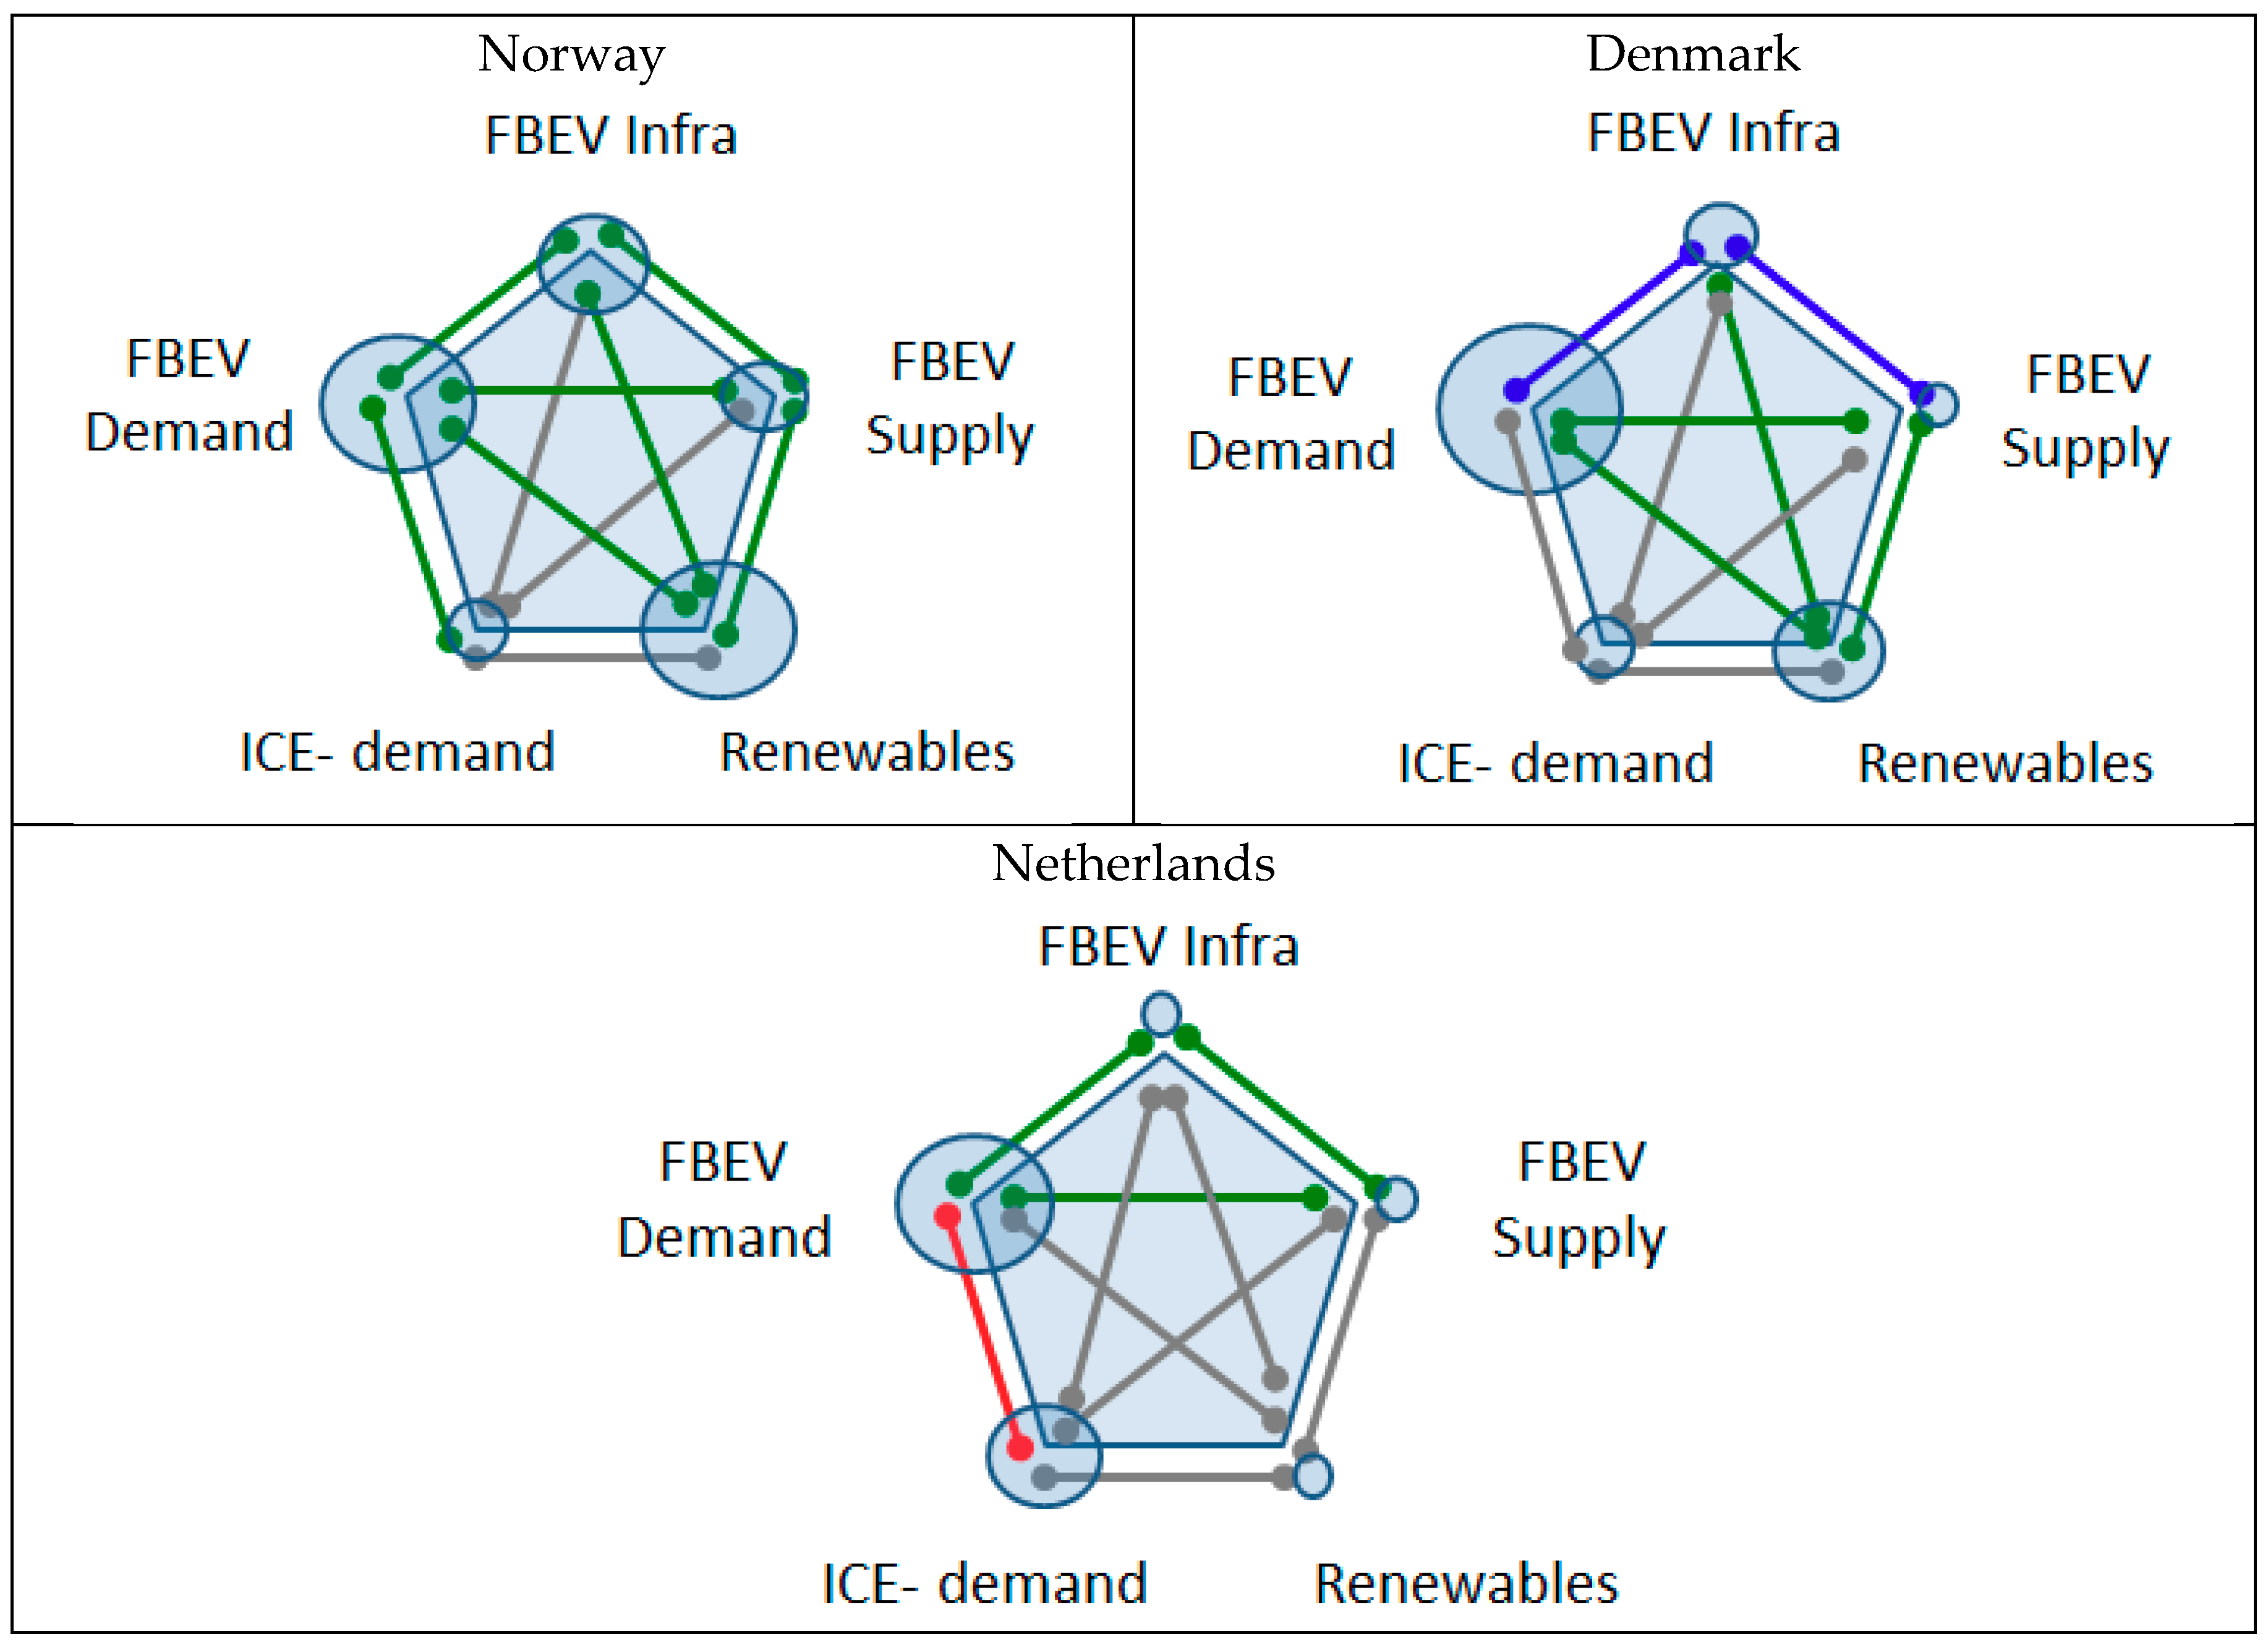
Figure 2 indicates these intensities through the size of the ‘bubbles’, as well as showing how, on average, stakeholders qualified the interactions between the five policy areas.
A key difference in the policy mixes of Norway and Denmark has been the relationship of infrastructure policy to demand and supply policies. In Denmark, it was generally left up to local actors to establish the infrastructure. An innovative battery-swapping system was introduced with so many promises that its success was effectively a pre-condition for demand and supply to remain confident in e-mobility as such (see relationship coloured blue in
Figure 2). This risky strategy turned out to be unfortunate because the system failed to deliver an affordable scheme and this affected suppliers and consumers negatively. In Norway, the recharging infrastructure (paid for with public money) was well aligned with demand measures and vehicle adoption levels (see relationship coloured green in
Figure 2). In the Netherlands, the building of infrastructure was a private-public matter with little oversight or planning. The Dutch government created an organization called the Formula E-team to stimulate others to build infrastructure. The philosophy was that ‘the recharging spots will follow when we stimulate the vehicle sales’. The team seems to have performed its coordination role well, and none of the experts suggested that this zero-budget infra-strategy delayed FBEV/PHEV adoption to any extent (see relationship coloured green in
Figure 2). There was an unplanned positive interaction with air-quality policy as national funds for improvements to air quality could be used by local governments to build recharging infrastructure. In sum, some central support (fiscal or organizational) for recharging infrastructure is an essential element of an effective policy mix promoting FBEVs.
The alignment of FBEV policies with those for PHEVs and ICEs also proved to be an important factor behind the observed differences. In the Netherlands, PHEVs were treated equally with FBEVs until 2014, and there were significant financial incentives, including tax exemptions, for the most efficient a-label ICE cars, which made these very attractive both for manufacturers in enabling them to offer more models, and for consumers, and sales levels were accordingly high. Cleaner ICEs (i.e., emitting 80–100 gr CO
2 per km) were financially most attractive, in the sense that the TCO was lowest, reducing the attraction of zero-emission FBEVs. The same was to some extent true in Denmark [
48]. In our scheme of policy interaction effects, the support policies for cleaner ICEs are an example of a clash with support of FBEV demand (as indicated in red in
Figure 2). In Norway, the high taxes for all ICE vehicles, although distributed according to CO
2 emissions, and fiscal stimulation policies for FBEVs meant that the TCO for FBEVs has been lower than for ICEs, giving FBEVs a competitive advantage, as indicated by the green relationship between FBEV demand and ICE demand policies. In sum, to be an effective element of the policy mix promoting FBEVs, financial incentives should mirror the life-cycle carbon footprint of the respective vehicles.
In all three countries, demand-side policies and supply-side innovation policies were pursued synergetically, at least to some extent (see
Figure 2, all green). In Norway, free municipal parking (since 1993), free toll roads (since 1996) and free access to bus lanes (2008) had great significance for early adopters [
49]. These policies resulted from a coming together of the industrial and climate rationales in Norway [
50], showing that non-fiscal incentives may be an important element in the policy mix promoting FBEVs.
Denmark and the Netherlands are both small, densely populated countries that tend to drive relatively small and fuel-efficient cars. The fact that supply-side support for e-mobility emerged only after 2009 meant that domestic businesses related to e-mobility were still in their infancy in our study period, while the associated public familiarity with FBEVs remained at an order of magnitude lower than in Norway. The strong demand-side financial instruments for e-mobility in Norway and Denmark were well aligned with their renewable energy policies (indicated in green in
Figure 2), and these synergies have also tended to strengthen the legitimation of e-mobility support. In the Netherlands such synergies were absent (indicated grey in
Figure 2), although more general arguments for lower oil dependency, green growth potential and environmental benefits (climate, air and noise) were highlighted as key reasons for the policy support.
Although it did not conduct an exhaustive analysis of the reasons for policy consistency or imperfections, ‘level of coordination’ comes out as a relevant factor here. The Dutch e-mobility strategy was introduced at a time when electric vehicles were ‘hot’ and every minister announced his own way of stimulating them. With the Ministry of Financial Affairs not being involved in the coordination, this resulted in a policy portfolio with much greater benefits for company car drivers than anticipated, leading to perverse effects on the consumer side (see above). As a positive example, in Norway there was strong alignment between national policies (purchase and annual tax exemptions) and local policies (toll-road and parking exemptions), which, in combination, acted as a significant pull for FBEV adopters.
Another important policy lesson is that over-stimulation of FBEVs leads to perverse effects. For adoption purposes, the TCO of FBEVs should be lower than that of ICEs in promoting uptake, but the difference should not be too great. The Dutch case offers evidence of PHEVs or FBEVs being bought as an additional vehicle instead of an ICEV replacement and of PHEVs being driven in gasoline mode. The case of Denmark also brings home another important lesson for policy, namely the danger of relying too much on a specific technology configuration, as was the case with the battery swapping model, where only one type of vehicle was available (the Renault Fluence Z.E.). Innovation experiments with infrastructure are generally useful unless they increase consumer uncertainty too much.
The reasons why the three countries introduced active support policies for FBEVs differ, being associated with differences in energy supply and ambitions for a domestic car industry. For Norway, with its endowment of large amounts of hydropower, electric cars were an attractive new market. Denmark, seeking to handle fluctuating electricity from its wind-power plants, envisaged FBEVs as a means to store electricity as a component in smart grids, although this has turned out to be more difficult than assumed. The main motivation for the Netherlands, at that time a natural gas producer with a fossil fuel-based electricity system, was to generate commercial opportunities in e-mobility. Cleaner air benefits in cities were an important motiving factor in all three countries too, supplementary to those already mentioned, and more important for local than for national authorities. In summary, the policy mix in Norway is rich in synergies and is very effective for broadly the same overall cost as in the Netherlands. It has a longer history of both supply-side support (primarily Pivco) and benefits for FBEV users (free parking and toll roads). As a result of the combination of high taxation of ICE vehicles with tax exemptions for FBEVs, an FBEV is financially the most attractive option for the Norwegian consumer as small car, primarily as a second car in early adopting households [
49].
The Danish policy mix has experienced synergies between the demand-side elements of the high tax benefits of FBEVs and use-oriented funding programmes. Synergies with smart grid efforts have so far been primarily on the strategic and experimental levels and have not yet been realized in practice. Relatively limited infrastructure compared to Norway and the Netherlands and the absence of additional user benefits, as in Norway, help to explain why FBEVs have not been adopted more widely, despite the strong financial demand-side measures.
The Dutch policy mix had various synergies between demand, supply and infrastructure policy, although most of the financial burden had been on the demand side. Little public money had been spent on recharging infrastructure, but the strategy to stimulate other parties to do this was very successful. The Achilles heel was the equal tax exemption for PHEVs until 2014 and also those for clean ICEs, which still left compact ICEs the most attractive option as a second household vehicle (a typical lead market for FBEVs), in spite of tax exemptions for FBEVs. We estimate that the total costs (or forgone tax revenues) of the Dutch policy mix have broadly been in line with those in the Norwegian case (about 400–500 million in 2014) [
51].
In terms of governance, Norway and the Netherlands have both relied on stakeholder platforms for e-mobility as a form of governance. The platforms brought together expertise and actors interested in electric driving. In the Dutch case, the important Formula E-team did not include representatives from the Ministry of Financial Affairs, which declined the invitation, nor external experts on innovation policy, who were not approached. The involvement in the team of these two actors (the first being responsible for taxation) might have improved the adaptation of the tax regime and the calibration of forgone taxes for electric vehicles and prevented similar ‘losses’ as for cleaner ICE taxes in 2007–2009. Nevertheless, keeping an arms-length relationship from parties interested in electric driving has proved useful. In general, it is desirable that policy choices should be critically scrutinized by independent experts in the sector (innovation field) in order to build in safeguards against cost inefficiencies. The Dutch experience illustrated the importance of embedding autonomy, discipline (the use of time-bound incentives and programme reviews) and accountability, as identified by industrial policy expert Dani Rodrik [
52]. Whereas strategic collaboration and coordination between the private sector and the government helps in learning about the most significant bottlenecks and in identifying and discussing useful interventions, discipline in the support, accountability and legitimacy of policy actions helps to secure the public interest.
5. Conclusions and Policy Implications
Despite apparent similarities in respect of various social aspects, Norway, the Netherlands and Denmark have pursued divergent policy paths in promoting the dissemination of FBEVs and rolling out FBEV infrastructure. These north-western European countries were all early adopters and active propagators of e-mobility. A comparison of their respective policy mixes in terms of the instrument interaction effects can explain to a significant extent the relative FBEV sales levels. What we found is that Norway was most effective due to synergies between sustained supply-side stimulation and comprehensive demand measures rather than tax exemptions. Denmark was least effective due to inconsistencies between its ‘double’ infrastructure strategy and the demand side, while The Netherlands was relatively ineffective due to inconsistencies between FBEVs’ and PHEVs’ demand benefits, which were similar, and to a lesser extent clean ICEs.
The first important policy conclusion of this paper thus is that, in adopting FBEVs, the policy mix is very important: The Norwegian policy mix was most effective, the Danish mix was least effective, while the Dutch mix achieved somewhat more than the Danish. The elements of an effective policy mix are:
Fiscal incentives that mirror the actual carbon footprint of the respective vehicles
Non-fiscal demand-side incentives, such as free use of toll roads, free parking or free use of bus lanes
Centrally financed and/or coordinated charging infrastructure
Clarity regarding the choice of technology that will be supported
Moreover, development of a domestic, e-mobility-related industry and a high share of renewable energy strengthens the legitimization of e-mobility support. Whether all these measures are necessary is difficult to say, but each element was positively appreciated by prospective adopters. Contradictory effects were observed in the Netherlands, where the support for cleaner, i.e., more fuel-efficient ICEVs encouraged many people to opt for a cleaner ICEV or PHEV rather than an FBEV. Undesirable synergetic effects were also observed in the Netherlands in the form of the existence of multiple subsidy schemes for company car users, which led them to buy electric vehicles for purely economic reasons, leading to the undesirable effect of cars being driven primarily (80%) in fossil-fuel mode, meaning that a good deal of the money that went on promoting electric mobility and cleaner air was being misspent. It is clear from the comparison of the policy mixes of the three countries that contradictory effects or negative synergies may have very significant effects on adoption. To attain complementarities between the different elements of the policy mix is crucial.
As for the costs incurred in the form of forgone tax revenues and direct expenditure, the total costs of E-mobility support in Norway and the Netherlands are broadly comparable, although the Dutch expenses were mainly on PHEVs. The cost of the Danish mix was lower because fewer vehicles were sold. In Denmark, a large share of the costs was covered by the energy industry.
Limitations and Future Research
The analysis offered in this paper has a number of limitations. We have highlighted the nature of the relationships between the five types of policy instrument, but in practice these are not homogenous. After all, every policy type consists of a few different instruments, so interrelations may be more multifaceted and the indicated nature should be seen as the primary but not necessarily the only one. Second, because of language issues and time limitations, only the researchers in the respective countries analysed the interviews and reports. Interview transcriptions were not translated into English, so the corroboration of the coding was only done in discussions between the researchers and not through reading each other’s interviews (or reports). Third, because we sought a country-level comparison, the level of empirical detail for each country is lower than if looking at only one country. Finally, our data do not include the most recent developments. However, we intend to explain the introductory period of e-mobility in different countries and therefore our policy conclusions are still relevant for countries that are still in an introductory phase. In addition to the policy insights, our qualitative, ex-post, country comparison offers a new direction to the policy-mix literature in terms of methodology. Future research should pursue more country comparisons and seek to integrate more quantitative analyses of particular effects into the qualitative approach that we followed. This may deliver a ‘best of both worlds’ in terms of insights into the socio-political complexities involved through the qualitative methods, combined with econometric insights into particular effects through quantitative analysis.

 ,
, 


