Article

Differences of Flow Patterns and Pressure Pulsations in Four Prototype Pump-Turbines during Runaway Transient Processes

1
State Key Laboratory of Water Resources and Hydropower Engineering Science, Wuhan University, Wuhan 430072, China
2
School of Environmental Science and Engineering, Xiamen University of Technology, Xiamen 361024, China
3
China Ship Development and Design Center, Wuhan 430064, China
*
Author to whom correspondence should be addressed.
Energies 2020, 13(20), 5269; https://doi.org/10.3390/en13205269
Submission received: 24 August 2020 / Revised: 29 September 2020 / Accepted: 5 October 2020 / Published: 11 October 2020
(This article belongs to the Special Issue Advanced Technologies in Hydropower Flow Systems)

Abstract

:
Frequent working condition conversions in pumped-storage power stations often induce stability problems, especially when the operating point enters the S-shaped region, during which flow transitions and pressure fluctuations are serious. The pump-turbines with different specific speed values show different characteristics, but their differences in stability features are still not clear. In this study, four different pump-turbines were selected to simulate the runaway processes from turbine modes. The similarities and differences of flow patterns and pressure fluctuations were analyzed. For the similarities, pressure pulsations increase gradually and fluctuate suddenly once the backflows occur at the runner inlets. For the differences, the evolutions of backflows and pressure pulsations are related to specific speeds and runner shapes. Firstly, it is easier for the lower specific speed turbines to enter the reverse pump mode. Secondly, the blade lean angle influences the position where backflows occur, because it determines the pressure gradient at the runner inlets. Thirdly, the runner inlet height influences pressure pulsations in the vaneless space, because the relative range of backflow transitions will be enlarged with the decrease of specific speed. Overall, investigating the mechanisms of flow pattern transitions and pressure variations is important for runner design and transient process control.

1. Introduction

With the substantial increase of electricity consumption and the rapid development of green sustainable energies, pumped-storage power undertakes the functions of peak load regulation, valley filling, frequency modulation, phase modulation, and emergency standby in the power grids [1,2]. Its match-up with nuclear power and complement with wind and solar powers make it an indispensable tool to ensure safety, stability, and efficiency of clean energies [3,4,5]. To undertake these important functions, the stability and safety of pumped-storage power systems are essential. However, some stability problems in operating pumped-storage power stations, such as violent vibration of pump-turbine units [6], grid connection failure [7,8], runner lifting-up [9], and rotor-stator crashing [10], were frequently reported. These problems were generally attributed to the frequent conversions of operating conditions, especially when the working points pass through the so-called S- and hump-shaped characteristics regions, in which intense flow and pressure fluctuations occur. To know the mechanism, solve the stability problems, and predict working conditions, many studies on the transient processes of pump-turbine generator units were conducted in recent years [11].
Among many transient processes, the runaway process is the most dangerous one. Even if this scenario, it is rarely seen in practical operation, predicting the risk in the design phase is always required. The runaway process happens if the generator is cut from the power grid but the guide-vanes fail to close. Without retarding torque, the runner will be driven only by the unceasing water power, and the unit will be accelerated to the runaway speed. During this process, the working point slides rapidly through the S-shaped characteristic region that is comprised of the high-speed turbine, turbine braking and reverse pump modes, and violent vibrations in the unit happen due to quick flow pattern transitions and strong pressure pulsations [1]. Therefore, it is very important to ensure the safety and stability of the unit by analyzing the laws of flow pattern transitions and pressure pulsation changes, and revealing the interrelations of these key factors.
The existing studies about the runaway instability of pump-turbines mainly focused on unsteady flow patterns and pressure pulsations in the runner and vaneless space [12,13]. Two main situations [11,12], working at a runaway point and running away from a turbine working point, were both investigated. They concluded that strong backflows and vortices in the runner and the vaneless space lead to large pressure pulsations, channel blockage, discharge decrease, and pressure increase [12]. As for the simulations about static working at a runaway point, Gentner et al. [14] found toroid-like vortex structures around the vaneless space, and claimed that the secondary vortex in each runner channel can cause negative head gradient and pressure rise. Wang et al. [15] captured the obviously detached vortexes on the pressure sides of blades near the crown and pointed out that they may be the very reason for huge pressure fluctuations. Widmer et al. [16] showed the flow separation, recirculation, and vortex formation in every runner channels of a pump-turbine operating at the speed-no-load conition, and observed the obvious backflows and pressure fluctuations. Hasmatuchi et al. [17] investigated the flow distribution near the runaway point through experiments and found that the low-frequency pressure components can be captured in the spiral-casing and the guide-vanes channel. Jacquet et al. [18] pointed out that the position of backflows at the runner inlet depended on the operating point, and the accompanying pressure fluctuations can reach the maximum at the speed-no-load condition.
As for transient process studies, Trivedi et al. [19,20,21,22] concluded that the highest amplitudes of pressure fluctuations in pump-turbine were under the running away condition, according to the measurement of pressure fluctuations in the speed-no-load, running away, total load rejection, start-up, and shut-down conditions. Yin et al. [23] showed that the vortex formation at the runner inlet severely blocks the runner passages periodically, inducing torque and rotational speed fluctuations. Zhang et al. [24] also simulated the runaway process by computational fluid dynamics (CFD) and found that the successive features of transient flow patterns may induce pressure differences between the similar dynamic operating points in different moving directions. Xia et al. [1] conducted simulations of runaway processes of a model pump-turbine with different guide-vane openings (GVOs), and found that the backflows at the runner inlet can lead to quite different pressure fluctuations. Other research investigating the runaway instability by specifying discharge oscillating boundary condition at the turbine inlet or draft-tube outlet were also conducted. For example, Widmer et al. [16] decreased the discharge at the boundary starting from the runaway point, and found that the pressure pulsations can generate abnormal low-frequency signals with the number of stalled channels increased, which was similar to those in the runaway process.
The research discussed above shows that whether at the runaway point or during runaway process, flow blockages and severe pressure fluctuations are strong in the runner and vaneless space, which are the common features in pump-turbines. However, in much reported research, the problems encountered by different pump-turbines are mostly different. For example, a runner lifting-up happened in Tianhuangping power station during a load increase process [9], many grid connecting failures occurred in Baoquan power station under low head conditions [8], and a rotor-stator collision happened in Huizhou power station during a load rejection process [25]. Besides these accidents, there are still many other accidents that need to be paid attention to. Although these accidents are related to many factors, it is undeniable that the characteristics of the pump-turbine itself have a great influence on them. Most obviously, different pump-turbines have different S-characteristics because of their rated output, head, discharge, rotational speed, along with their runner shapes being different. Therefore, the flow patterns and pressure pulsations may not be similar in local and detailed perspectives, which may be related to the different problems mentioned above. For example, the conclusions in Hasmatuchi [17] and Jacquet [18] are different. In Hasmatuchi’s paper, the low-frequency component will further increase in amplitude as the zero-discharge condition is approached, while those in Jacquet’s paper reach at the maximum at the no-load conditions. In addition, Zhou et al. [26] optimized the blade inlet and showed the different developing trends of flow patterns and pressure fluctuations of two turbines during the runaway processes, though other geometry features of turbines were kept unchanged.
Therefore, we should not only focus on the common phenomena, but also the differences in different pump-turbines, in order to better understand the mechanism and solve the problems. As a common convention, the characteristics of pump-turbines are always labelled by their specific speeds. However, no research shows whether runaway process characteristics are related to the specific speed. These characteristics include the attenuation of runaway, the transition of flow patterns, the fluctuations of pressure pulsations, and runner forces. In order to answer these questions, we selected four prototype pump-turbines with different water heads, and simulated their runaway transient processes from the turbine mode. The evolutions of pressure pulsations and flow patterns were analyzed, their similarities and differences were discussed, and the mechanism was revealed. The paper will be arranged as follows: the Section 2 describes the basic simulation model and parameters; the Section 3 shows the resulting histories of macro parameters, and the evolutions of flow structures and pressure pulsations, along with their relations with specific speeds; the Section 4 explains the influences of runner shapes for the differences in the evolutions of flow structures and pressure pulsations; and conclusions are drawn in the Section 5.

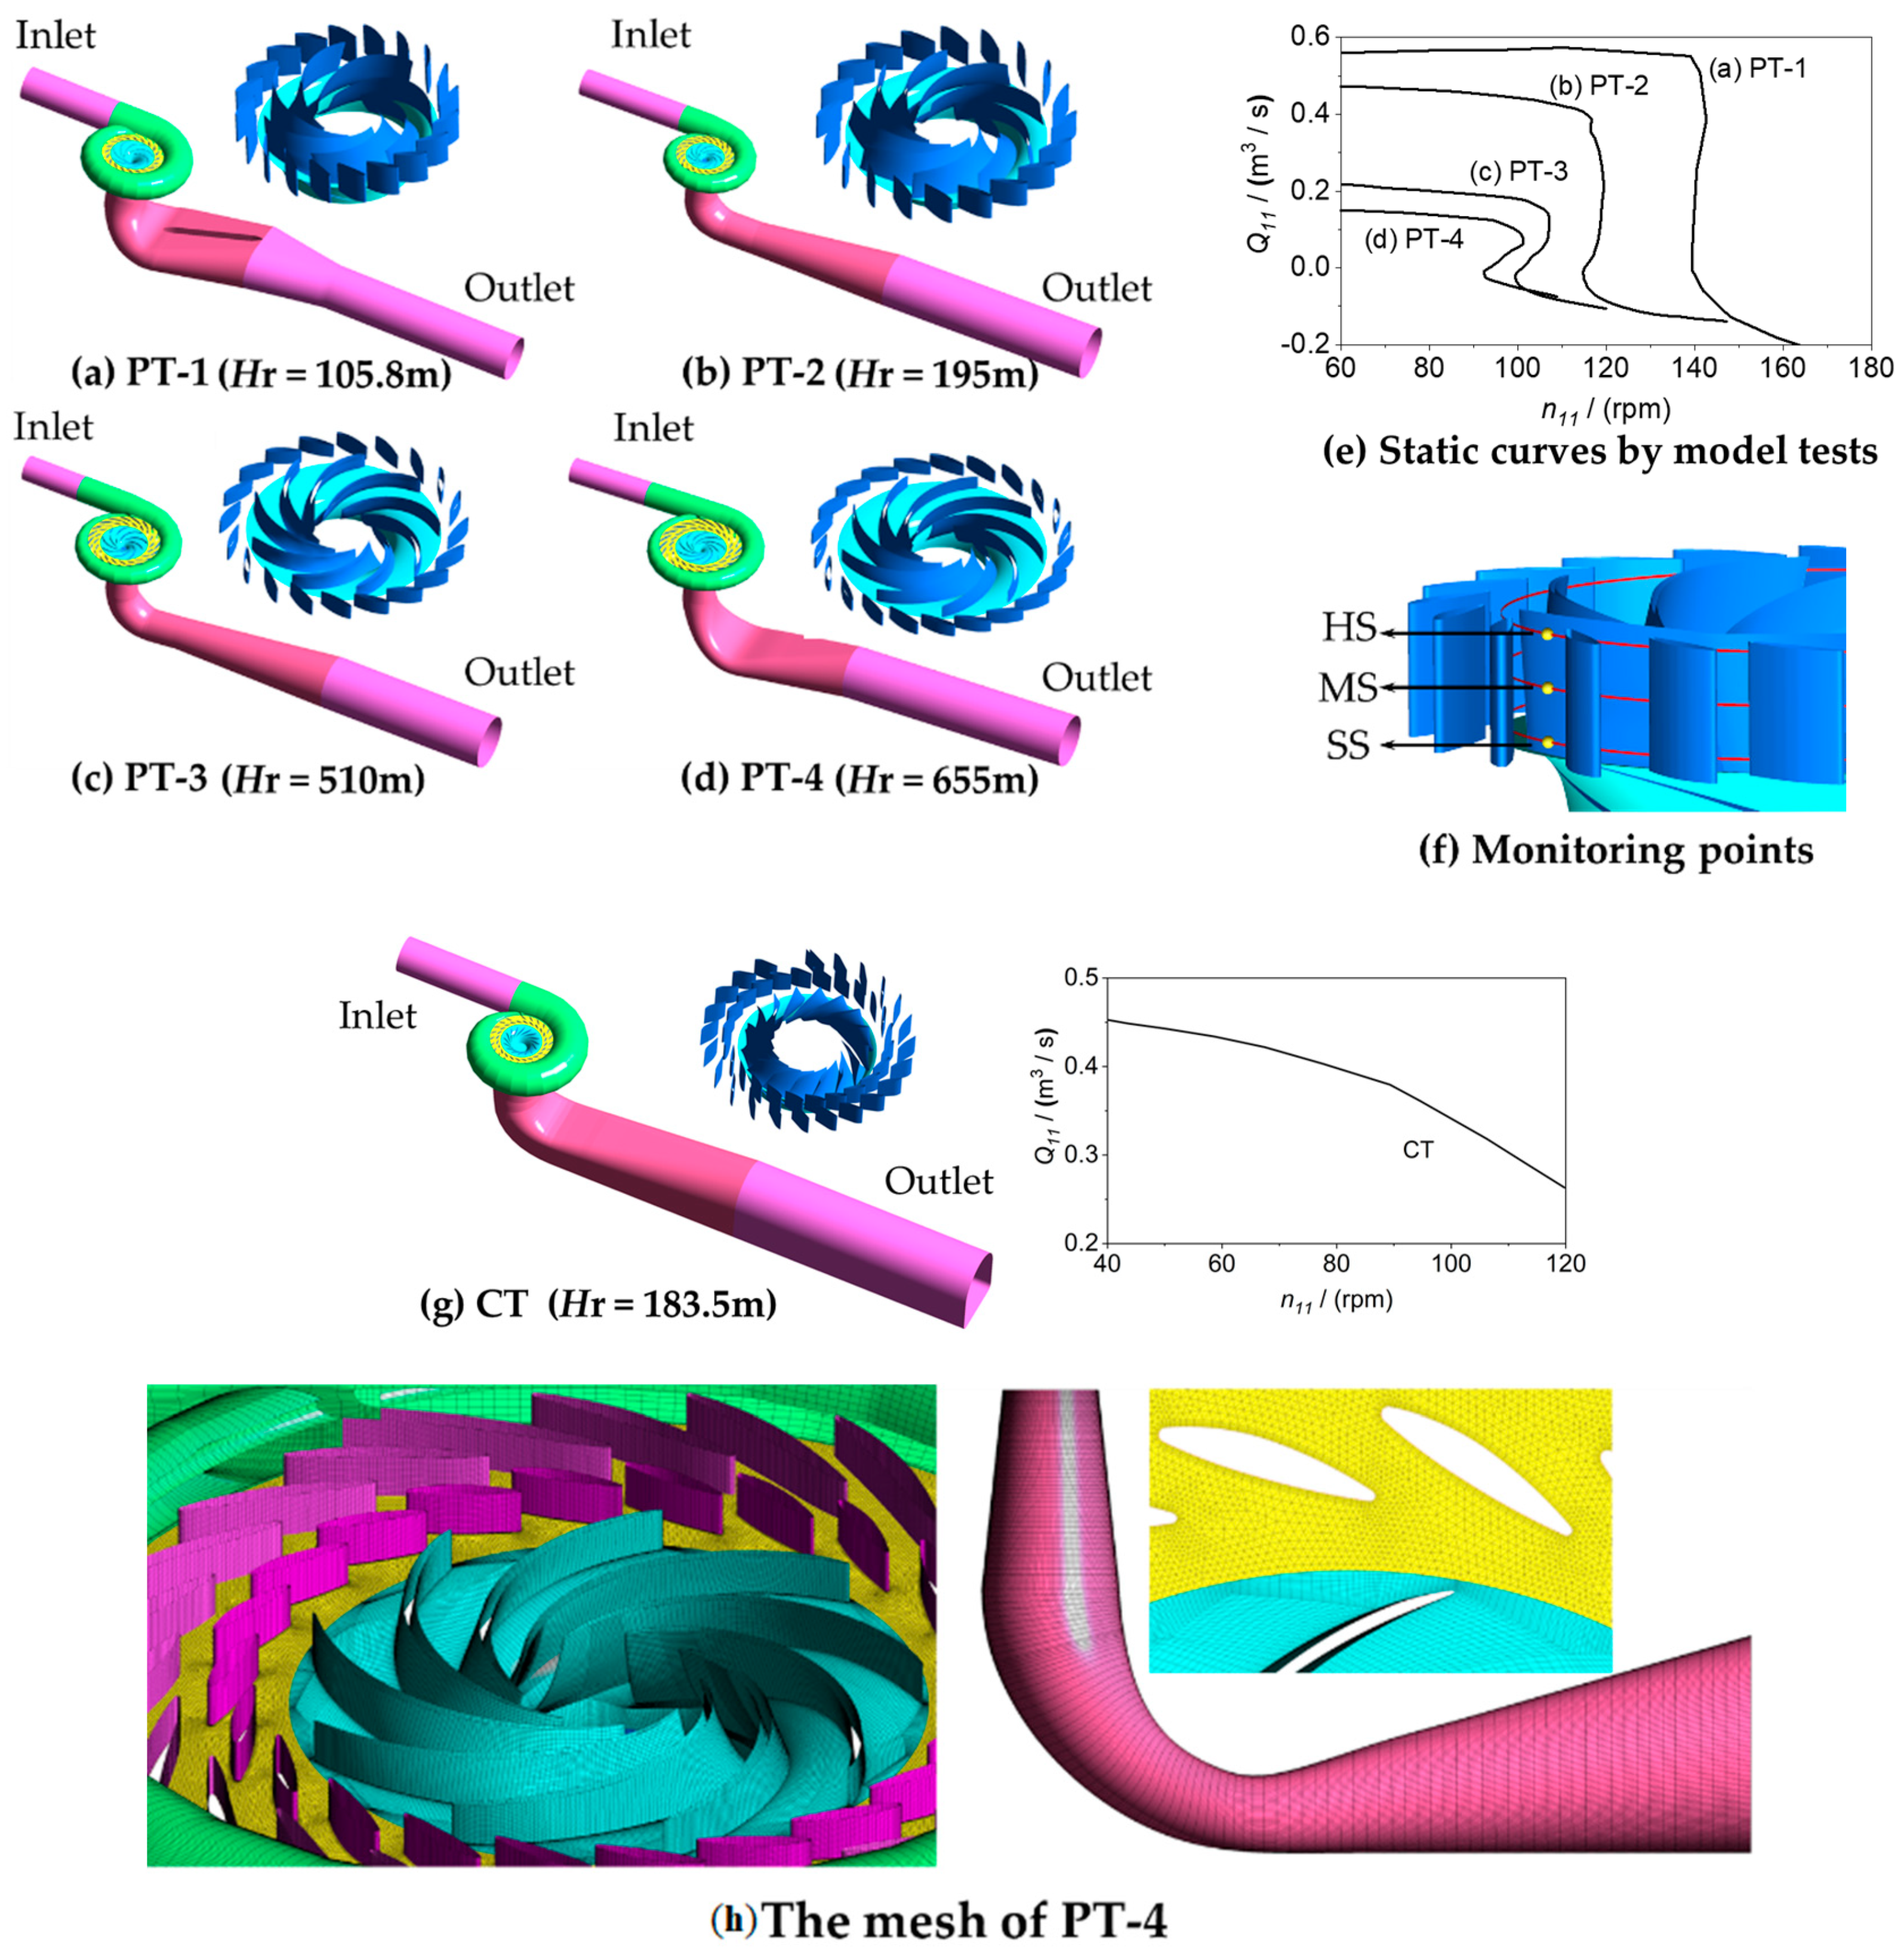
2. Three-Dimensional CFD Setups

Software for simulation: Three-dimensional (3D) CFD simulations were carried out by using commercial software ANSYS FLUENT 17.0 (ANSYS, Canonsburg, PA, USA).
Computational domain: four pump-turbines with different specific speeds were selected. Because of their main parameters, such as head, discharge, output, and layout out of water conveyance systems are different, it is difficult to ensure that all the settings in the simulations are the same, which is also unrealistic. Therefore, in order to fully reflect the characteristics of the pump-turbines during the transient process, the actual water conveyance systems were removed in the simulations to eliminate the impact of flow inertia in water conveyance systems [1]. This removal will affect the variation period and maximum value of macro parameters due to the flow inertia in pipelines, but we mainly focused on the evolutions of flow patterns and pressure pulsations, which are more affected by the pump-turbine unit. In addition, two extended tubes were added to the inlets of spiral-casings and the outlets of draft-tubes for setting boundary conditions at the locations with smooth flow patterns. Also, a conventional hydraulic turbine was chosen to compare with the above four pump-turbines. The 3D computational domains and monitoring points of the five turbines are shown in Figure 1, and the main parameters are listed in Table 1. The specific speed is defined by n s = n r N r / H r 1.25 , in which nr, Nr, and Hr are the rated rotational speed, output, and head, respectively. The flow patterns have a certain regularity in n11-Q11 plane under large guide vane opening conditions, especially at the runner inlets (in one pump-turbine) [1]. Therefore, the runaway processes of the four pump-turbines are all started near their corresponding rated turbine working conditions, while that of the conventional hydraulic turbine is started from a large guide vane opening condition, in which the runaway characteristics are similar to those in the rated one.
Mesh Generation: The upstream and downstream extended tubes, spiral-casings, runners, and draft-tubes were discretized by hexahedral structure grids, while the vane regions were discretized by wedge grids. Also, the areas near the blades and guide-vanes were locally refined. Grid refinement evaluations were performed for each pump-turbine and we found that when the grid number is more than 5.0 million, the relative differences in resulting macro parameters under steady conditions are negligible. Therefore, the cell numbers of the five turbines are 5.42 million, 5.58 million, 5.76 million, 5.97 million, and 5.54 million, respectively.
Numerical Scheme: After many comparisons, considering the calculation time and accuracy at the same time, we selected the timesteps for the five turbines as 0.00125, 0.001, 0.001, 0.001, and 0.00166667 s, corresponding to the times needed for the runner to rotate 1.5, 1.5, 3.0, 3.0, and 1.5 degrees, respectively. The SST-based scale-adaptive simulation model (SAS-SST) turbulence model [1] was adopted, and all the convergence criteria of residuals at each timestep were set to 1.0 × 10⁻⁴, including continuity, x-velocity, y-velocity, z-velocity, k, and omega. For both steady and unsteady simulations, the SIMPLEC algorithm was chosen to achieve the coupling solution of the velocity and pressure equations [1].
Boundary Conditions: The total pressure was defined at the inlet of the extended pipe of the spiral-casing, and the static pressure was defined at the outlet of the extended pipe of the draft-tube. The remaining solid walls were imposed with the no-slip wall condition.

3. Results of the Runaway Transient Processes

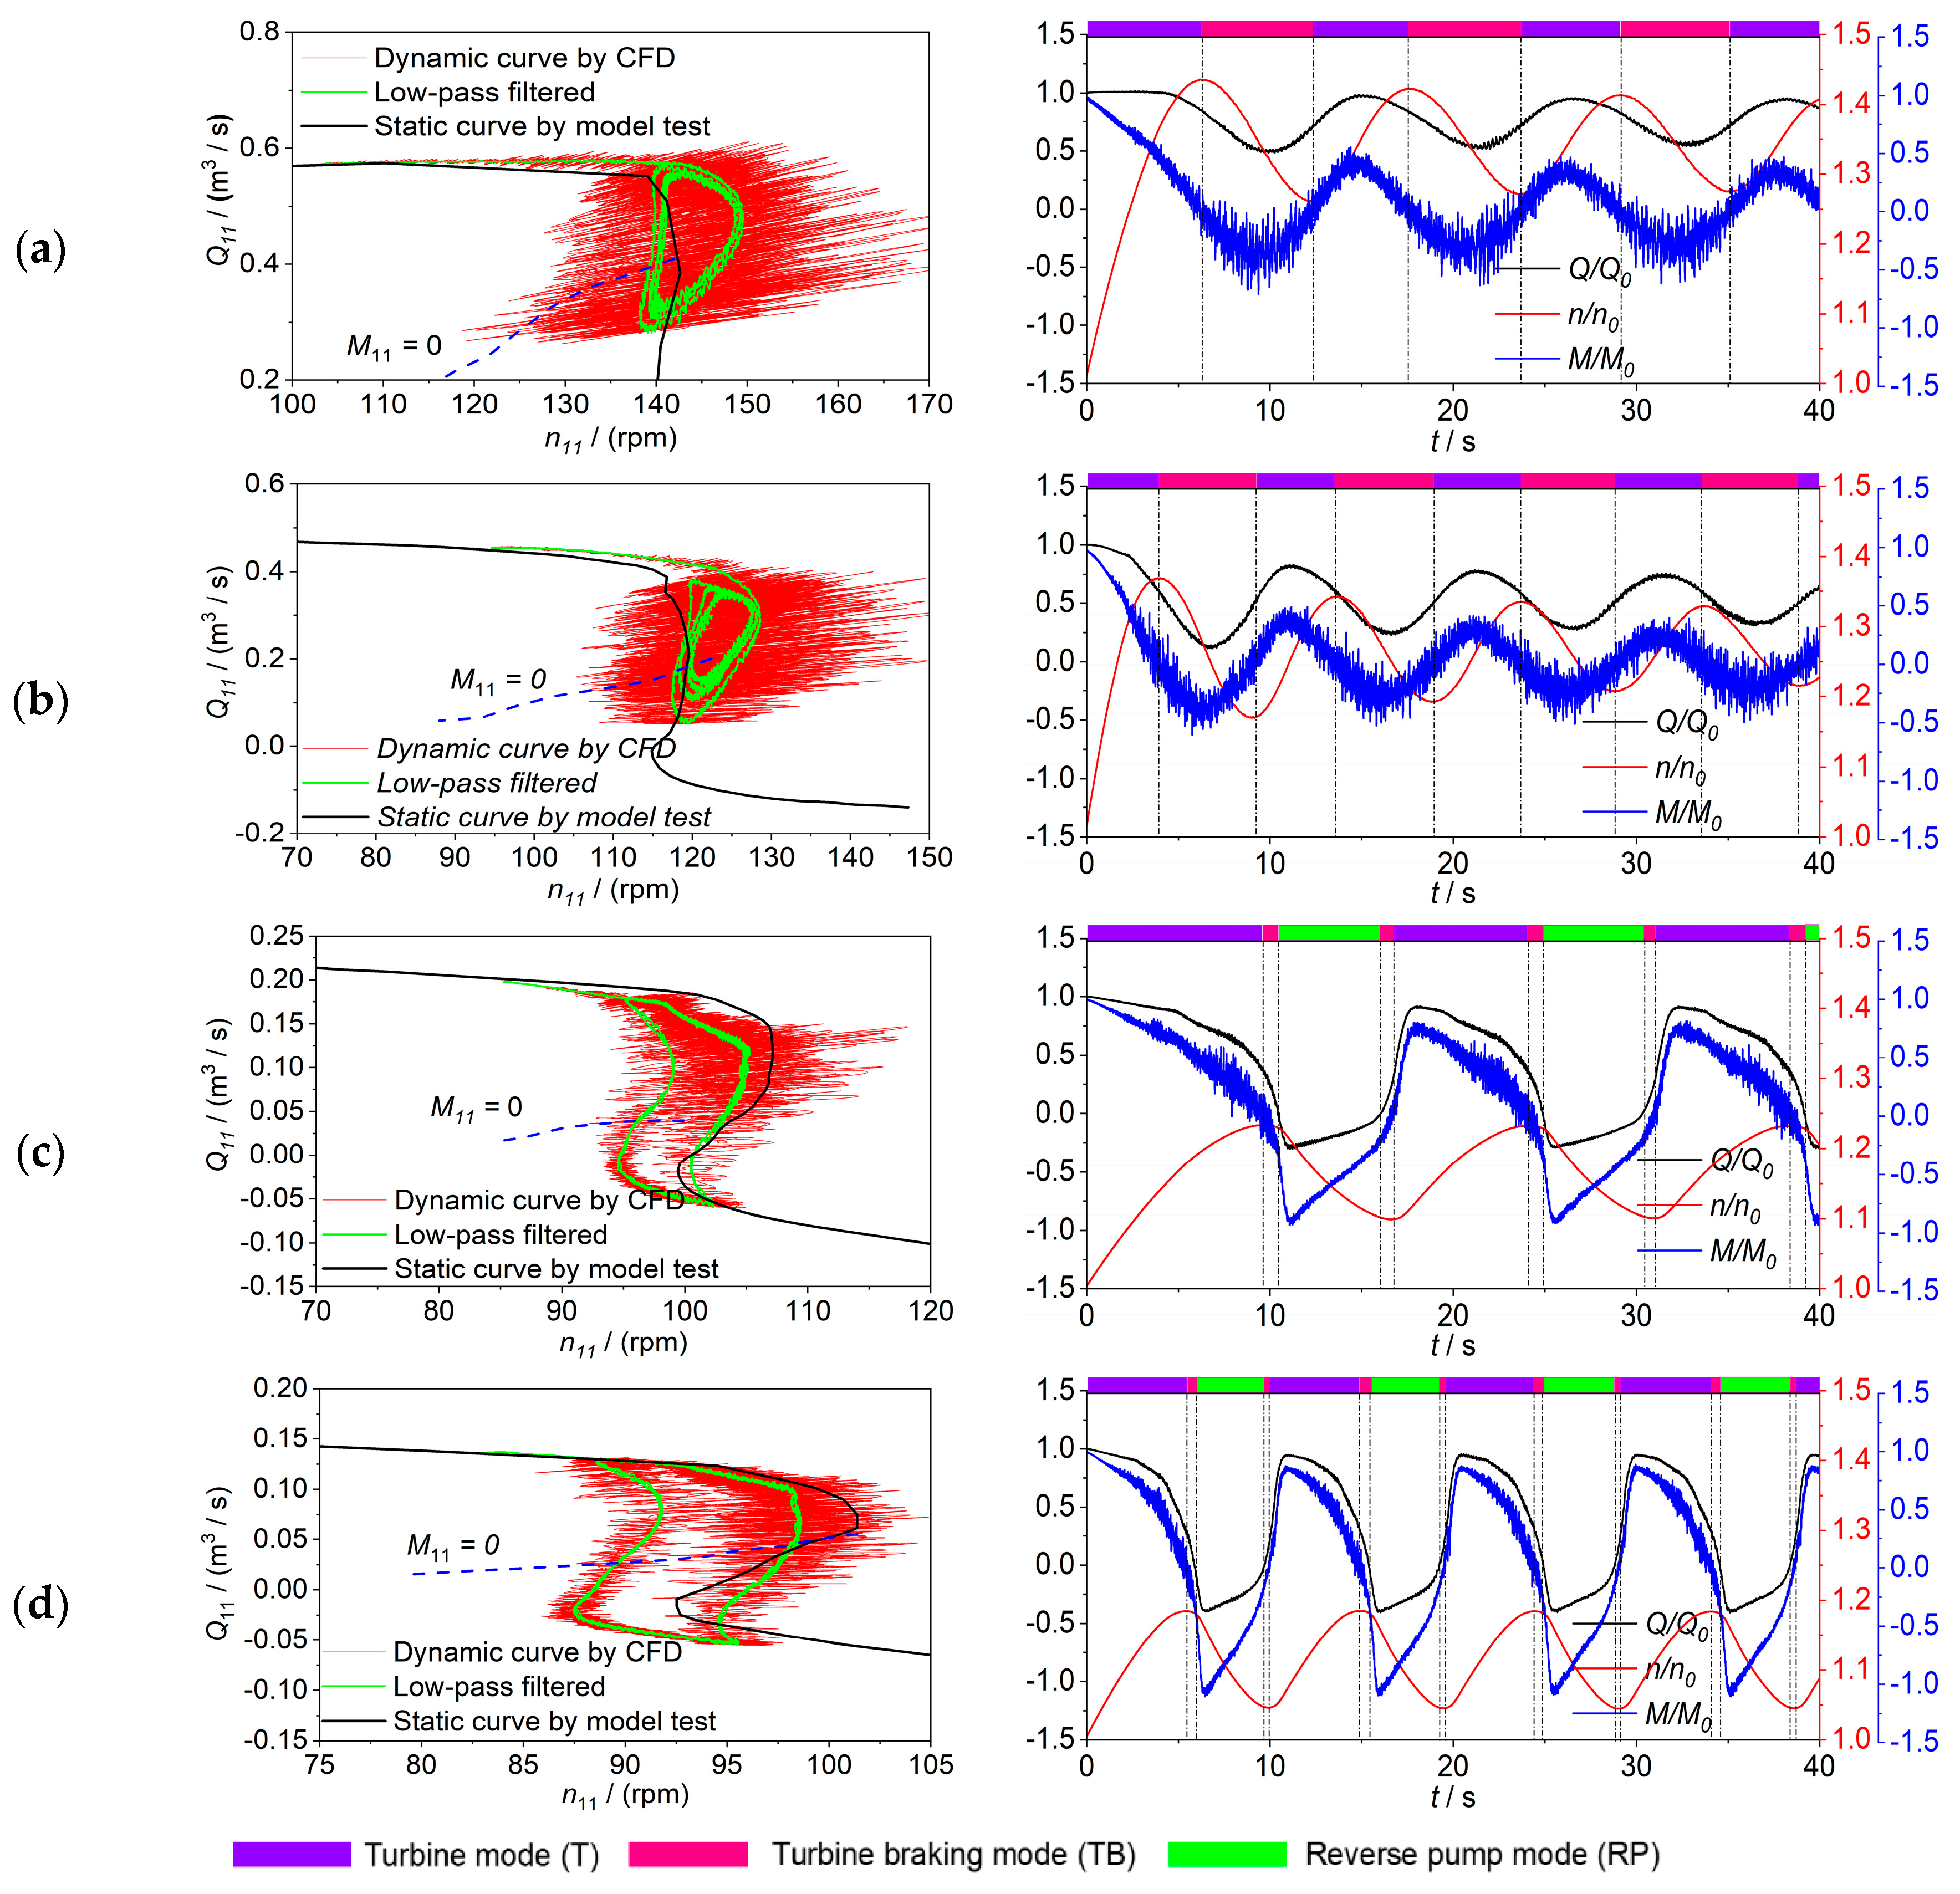
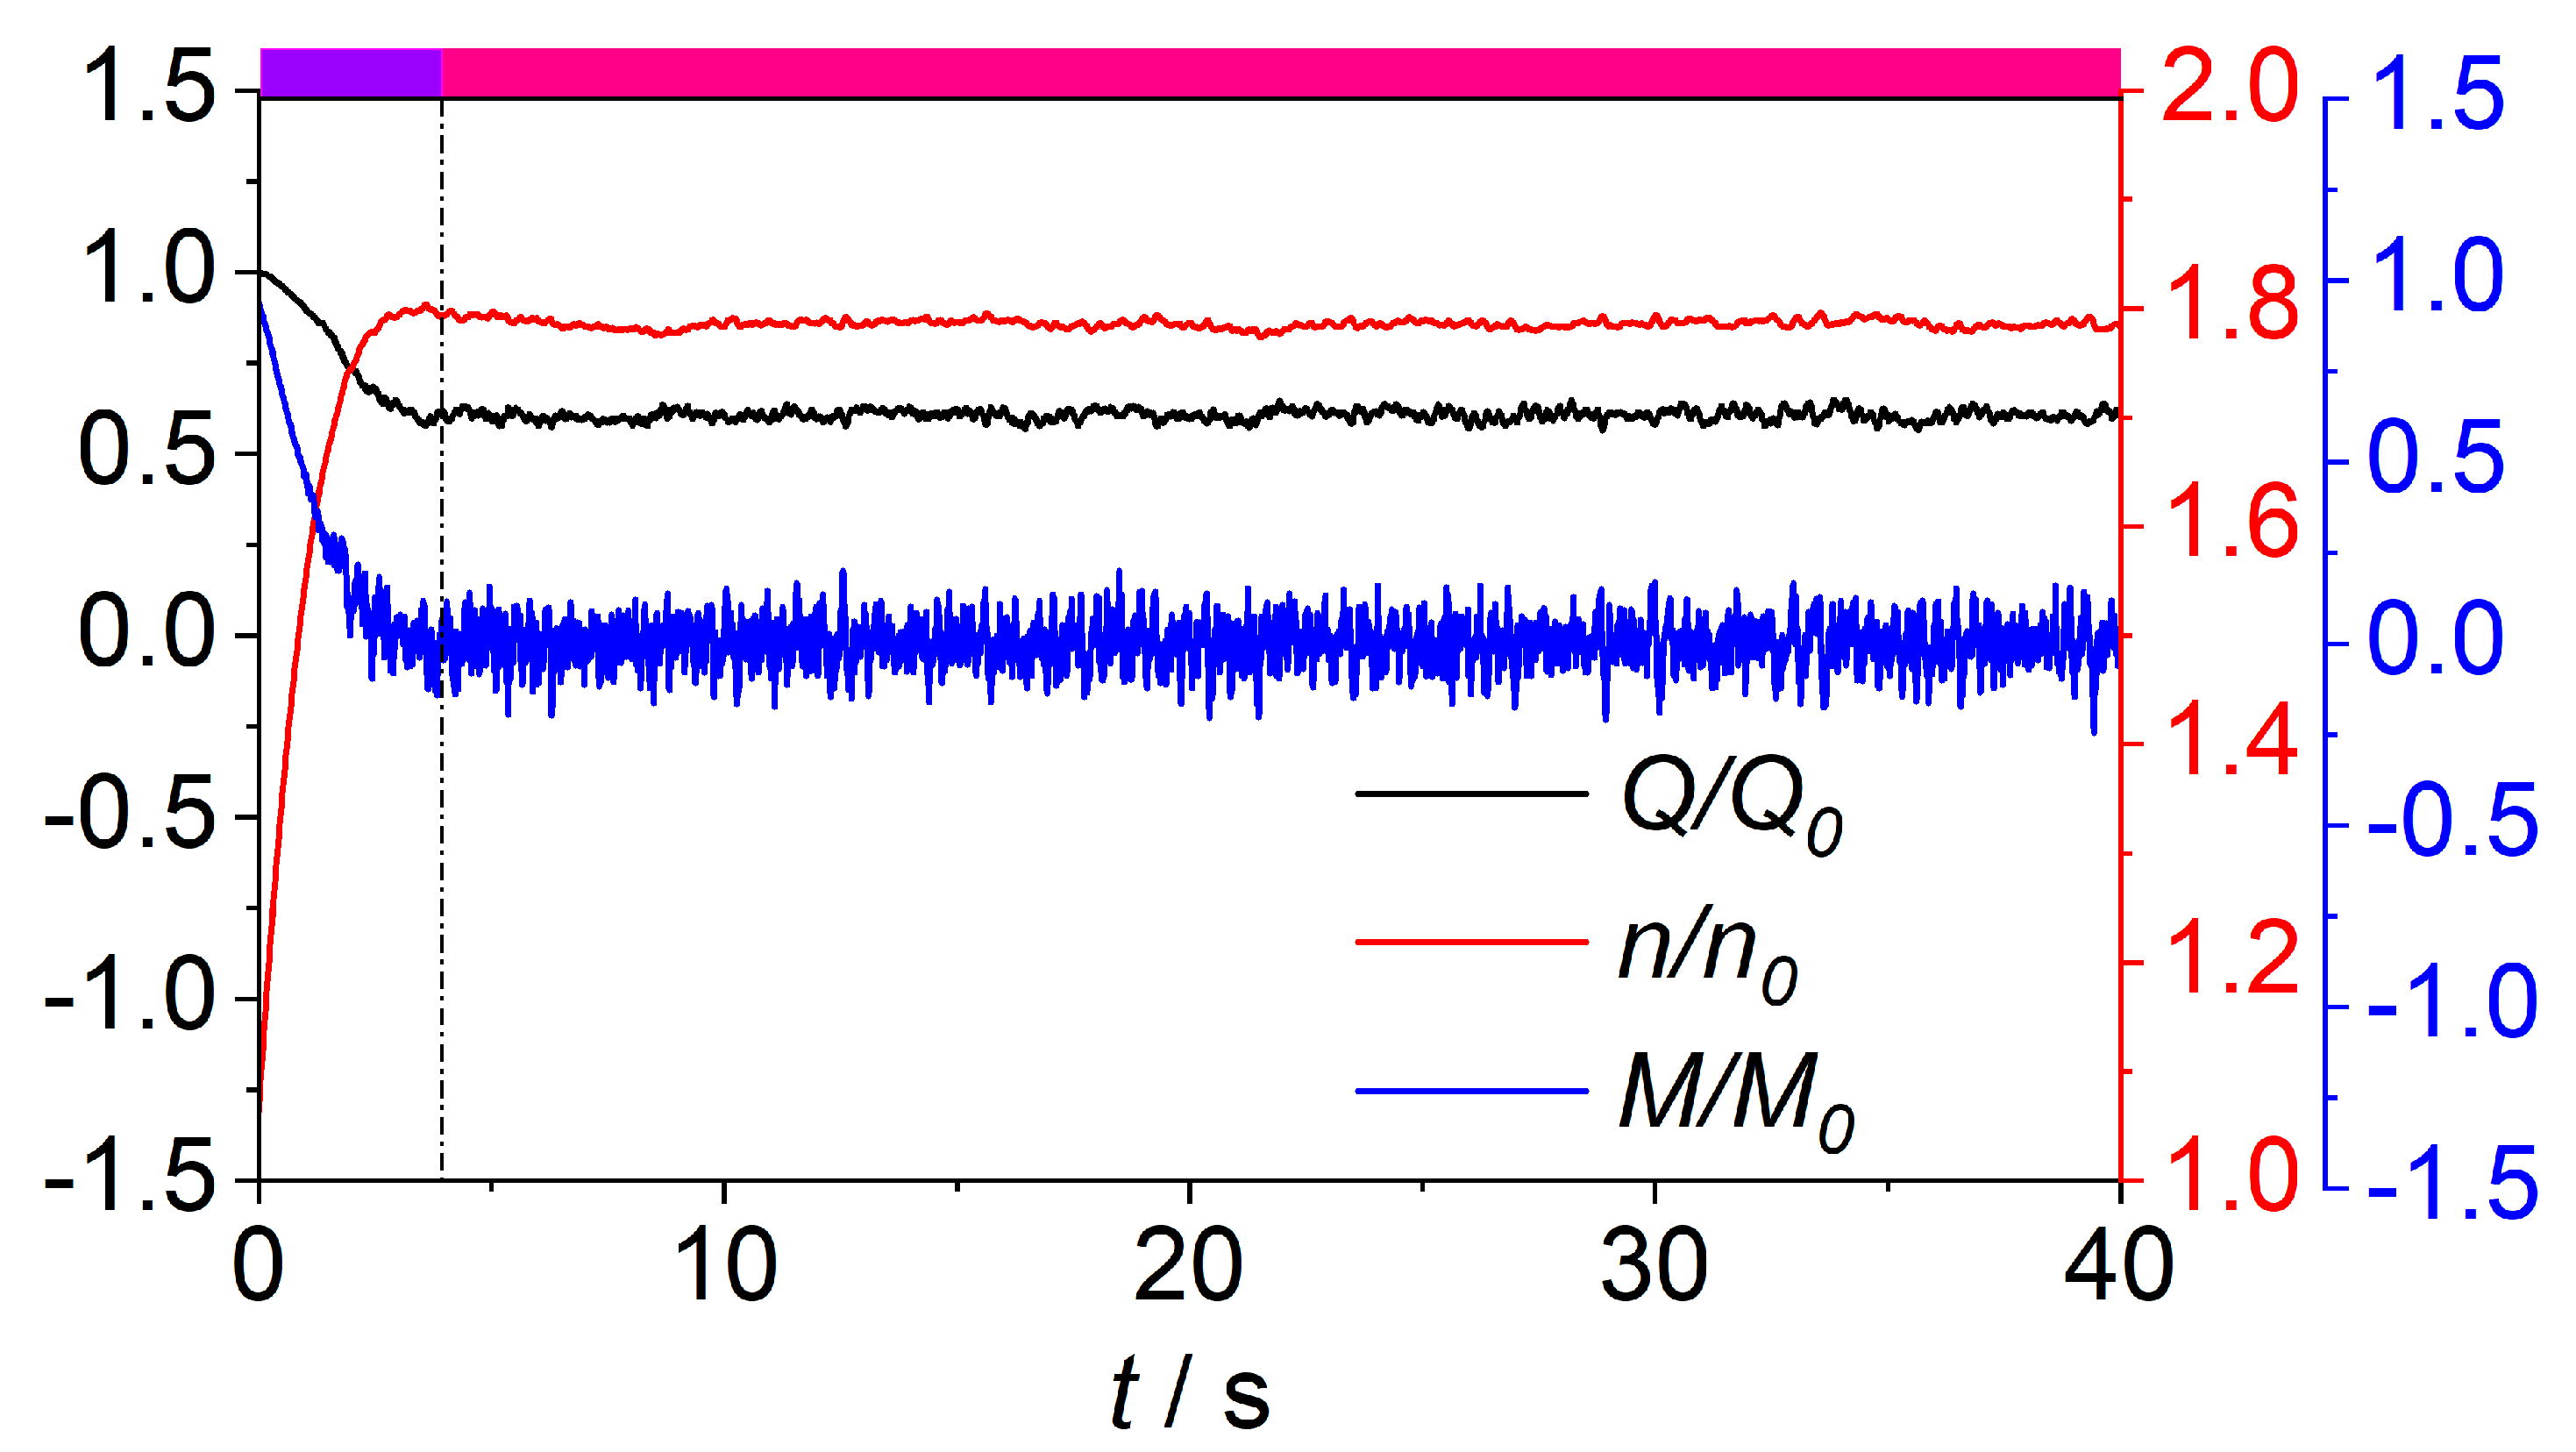
3.1. Macro Parameters Histories

The runaway dynamic characteristics of the four pump-turbines are shown in n11-Q11 plane in Figure 2, in which the unit parameters are defined as n 11 = n D 1 / H and Q 11 = Q / ( D 1 2 H ) , where H = E1–E2, with E1 and E2 the total energy values at the spiral-casing inlet and runner outlet, respectively. Comparing the computed results (red lines) of the four pump-turbines, we know that the dynamic trajectories of PT-1 and PT-2 have very high amplitudes in high frequency pulsation signals in the n11-Q11 plane, while those of PT-3 and PT-4 are relatively smaller and become obvious only near the runaway points. In addition, the low-pass filtered curves (green lines) of the original data do not go along the static characteristic curves (black lines) obtained from the model tests, however, they have good agreements before entering the S-shaped region. Once entering the S-shaped region, the dynamic curves deviate from the measured static ones. These deviations have been analyzed in [27], in which the influences of the sections for head definition, the water inertia in pipes and the rotational inertia of unit on the dynamic trajectory were discussed. In this paper, due to neglecting water inertia in pipes and choosing the same rotational inertias, the deviations are different. In fact, the simulating rotational inertia is based on the actual value of PT-1, therefore, the actual rotational inertia of PT-2 is much larger, and those of PT-3 and PT-4 are much smaller. For PT-2, small simulating rotational inertia will lead to large speed increasing rate, then the dynamic trajectory is on the right side of the static curve obviously, which is opposite to the phenomenon in PT-3 and PT-4. To verify the rationality of the above settings and results, we take reference [28] as an example, in which the influence of the inertia of rotating part has been well explained, and it shows that the dynamic trajectories affected by different rotating part inertia in n11-Q11 plane are very similar with those in this paper. In addition, there is no very large deviation in the dynamic trajectories, though the pulsations in the n11-Q11 plane and variation period of rotational speed are different. From the above analysis, we know that the results of transient process are quite different from the static ones and it is necessary to consider the dynamic effect in transient simulations.
The time histories of the main macro parameters during the runaway processes are also shown in Figure 2. Generally speaking, the dynamic histories of PT-1 and PT-2 show damped oscillations, while those of PT-3 and PT-4 demonstrate undamped oscillations. The working points of PT-1 and PT-2 go through the turbine (T) and turbine braking (TB) modes, but do not enter the reverse pump (RP) mode, and the macro parameters fluctuate in the T and TB regions with gradually decreasing amplitudes. On the other hand, the working points of PT-3 and PT-4 not only go across the T and TB modes, but also go down to the RP mode, and fluctuate periodically in these three modes. Overall, the fluctuation periods of the macro variables of the four pump-turbines are about 11.5, 10, 14.4, and 9.6 s, respectively, though the inertia values of rotating parts are the same (Table 1) in the simulations. The periods are also influenced by the rated rotating speed, discharge, and output. In addition, the maximum rotational speeds are heavily affected by the above factors [27,28], and can reach more than 1.4 times that of the initial value in PT-1 but less than 1.2 times in PT-4.

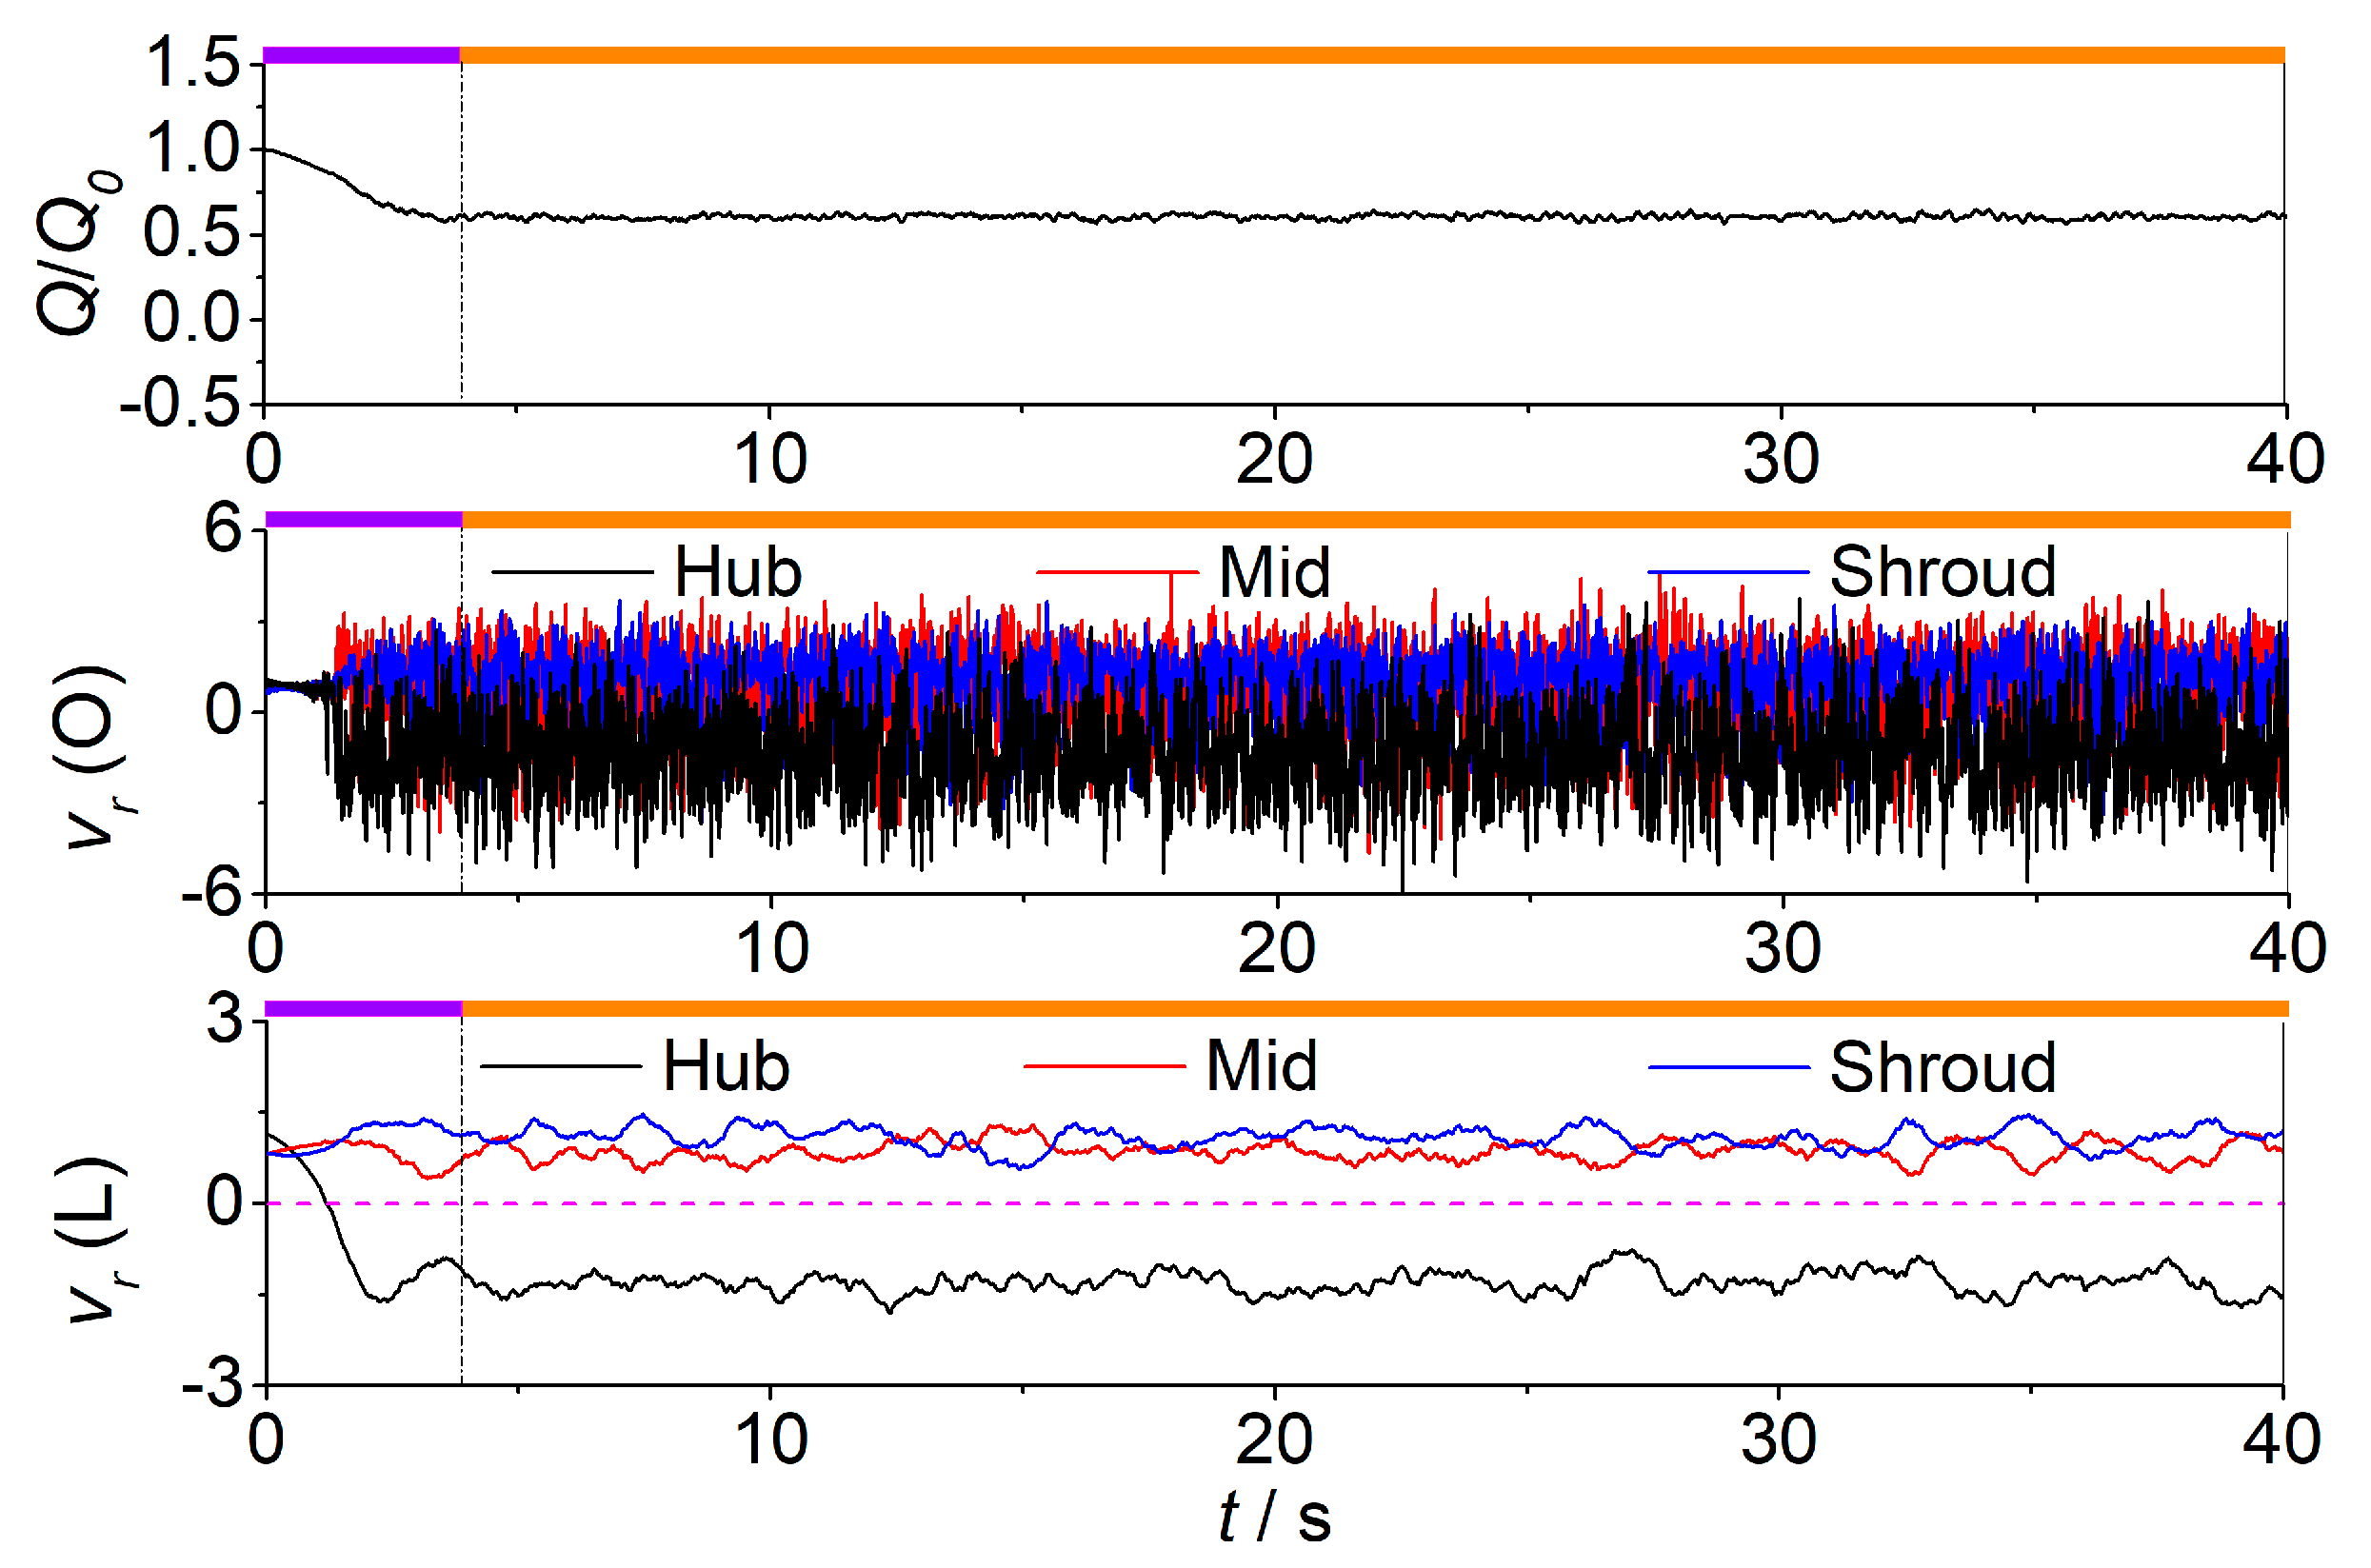
3.2. Radial Velocity Variations and Backflow Transitions at the Runner Inlets

The aforementioned fluctuations of dynamic trajectories are closely related to the unstable flow patterns near the runner inlets and outlets [29]. The variations of flow velocity at the runner inlet can reasonably demonstrate the characteristics of flow evolutions during the runaway processes. Figure 3 show the variations of normalized radial velocity vr at the three monitoring points (HS, MS, and SS shown in Figure 1f, namely hub side, mid span and shroud side, respectively) in the four runners. The normalized velocities were defined by:
v r = 60 U r π n 1 D 1
where Ur is the instantaneous radial velocity, n1 is the initial rotational speed, and D1 is the runner inlet diameter. Here, positive values of vr are defined as the direction of water flowing into the runner passages, while negative values of vr mean the backflows from the runner passages to the vaneless space. In addition, vr (O) and vr (L), in Figure 3, are the original and low-pass filtered data, respectively, and the upper frequency limit of low-pass filtered data is 2 Hz.
In general, during the beginning period of the runaway process, the rotational speed increases, the inflow attack angle decreases, and the velocity pulsations increase due to the growing impact at the runner inlet. When the backflows occur at the runner inlet (the reverse direction of vr), the velocity pulsations suddenly increase. Also, the velocity pulsations are almost the largest near this critical time. The lower the specific speed, the smaller the differences of velocity pulsations in different monitoring points. Consistent with the features in Figure 2, the velocity pulsations in PT-1 and PT-2 are the largest, and those in PT-4 is the smallest. In addition, though the discharge varies periodically, the variations of radial velocity in PT-1 and PT-2 are not obviously, especially at the location where the backflows occur, which are affected by the absence of flow transitions. But for PT-3 and PT-4, the variation period of radial velocity is corresponding to that of discharge. Overall, with the changes of flow rate, there are significant differences in flow features at the runner inlets.
1. PT-1: The dynamic trajectory of PT-1 only goes through the turbine (T) and turbine braking (TB) modes, and the macro parameters only fluctuate in relatively small amplitudes, therefore, the radial velocity (low-pass filtered data) cannot vary violently. At around t = 3.6 s (in the T mode), the radial velocity direction at the shroud side alters, indicating the appearance of backflows. At the same time, the velocity fluctuations increase significantly, namely the flow instability is intensified. However, the radial velocity directions on the hub side and mid span keep unchanged, and the increased values (high-frequency data) indicate that the water flow can rush into the blade passages more easily. Although the rotational speed and flow rate fluctuate greatly, the radial velocity direction at the runner inlet remains unchanged after t = 3.6 s (Figure 3a).
2. PT-2: Though the working modes experienced are the same as those of PT-1, the developments of backflows show different characteristics because the backflows start from the hub side (t = 2.1 s) in the turbine mode and have transitions. At the early stage of backflow generations, the radial velocity at the mid span increases briefly and then decreases gradually, while that on the shroud side increases rapidly. At about t = 8–10 s (in the TB mode), there are significant transitions of radial velocity directions, namely the backflows occur suddenly at the mid span and shroud side at the same time, while those at the hub side disappear for a short time. After a short stay, backflows return to the hub side again. Similar to the phenomenon in PT-1, although the speed and discharge still fluctuate afterward, backflows keep staying at one location, and there is no transition (Figure 3b).
3. PT-3 and PT-4: Besides the turbine and turbine modes, the dynamic trajectories of these two pump-turbines also go through the reverse pump mode and the backflow transitions are basically similar. All of them generate from the hub side (in the T mode), then turn to the mid span and shroud side (in the TB mode). However, the only difference is that when the working point enters the reverse pump mode, the backflows in PT-3 mainly alternate between the hub side and mid span, while those in PT-4 also spread to the shroud side (Figure 3c,d).
In order to further explore the flow patterns at the runner inlets, Figure 4, Figure 5, Figure 6 and Figure 7 show backflows at typical times in a single passage. Generally speaking, when the working points leave from the optimal ones, the water will impact on the blades and form backflows, making some water returning to the vaneless space and some water jumping over and impacting the next blade.
1. PT-1: The backflows generate from the shroud side, while the water flows into the blade passage easily on the hub side. Because the inlet height of PT-1 is relatively large, the backflows are mainly maintained near the shroud over the entire runaway process, and just influence the normal inflow at the mid span (Figure 4a).
2. PT-2: Backflows generate from the hub side and gradually evaluate to other locations. Compared with those in PT-1, the inlet height of PT-2 is smaller, and the backflows are easy to expand to the whole inlet. There is an obvious transition in the flow patterns, and the backflows suddenly occur on the shroud side and at the mid span (Figure 5b, t = 8.0 s), which is consistent with the transition of vr in Figure 3b. But with the speed and discharge tending to steady, the backflows keep stay on the hub side.
3. PT-3 and PT-4: The inflow attacks on the blades at the mid span, leading to the upward deviation of the normal inflow on the hub side, then backflows generate and evaluate to other locations. Once entering the reverse pump mode, the backflows at the mid span in PT-3 have less influence to the hub and shroud sides, while those in PT-4 affect the shroud side obviously (Figure 7c).

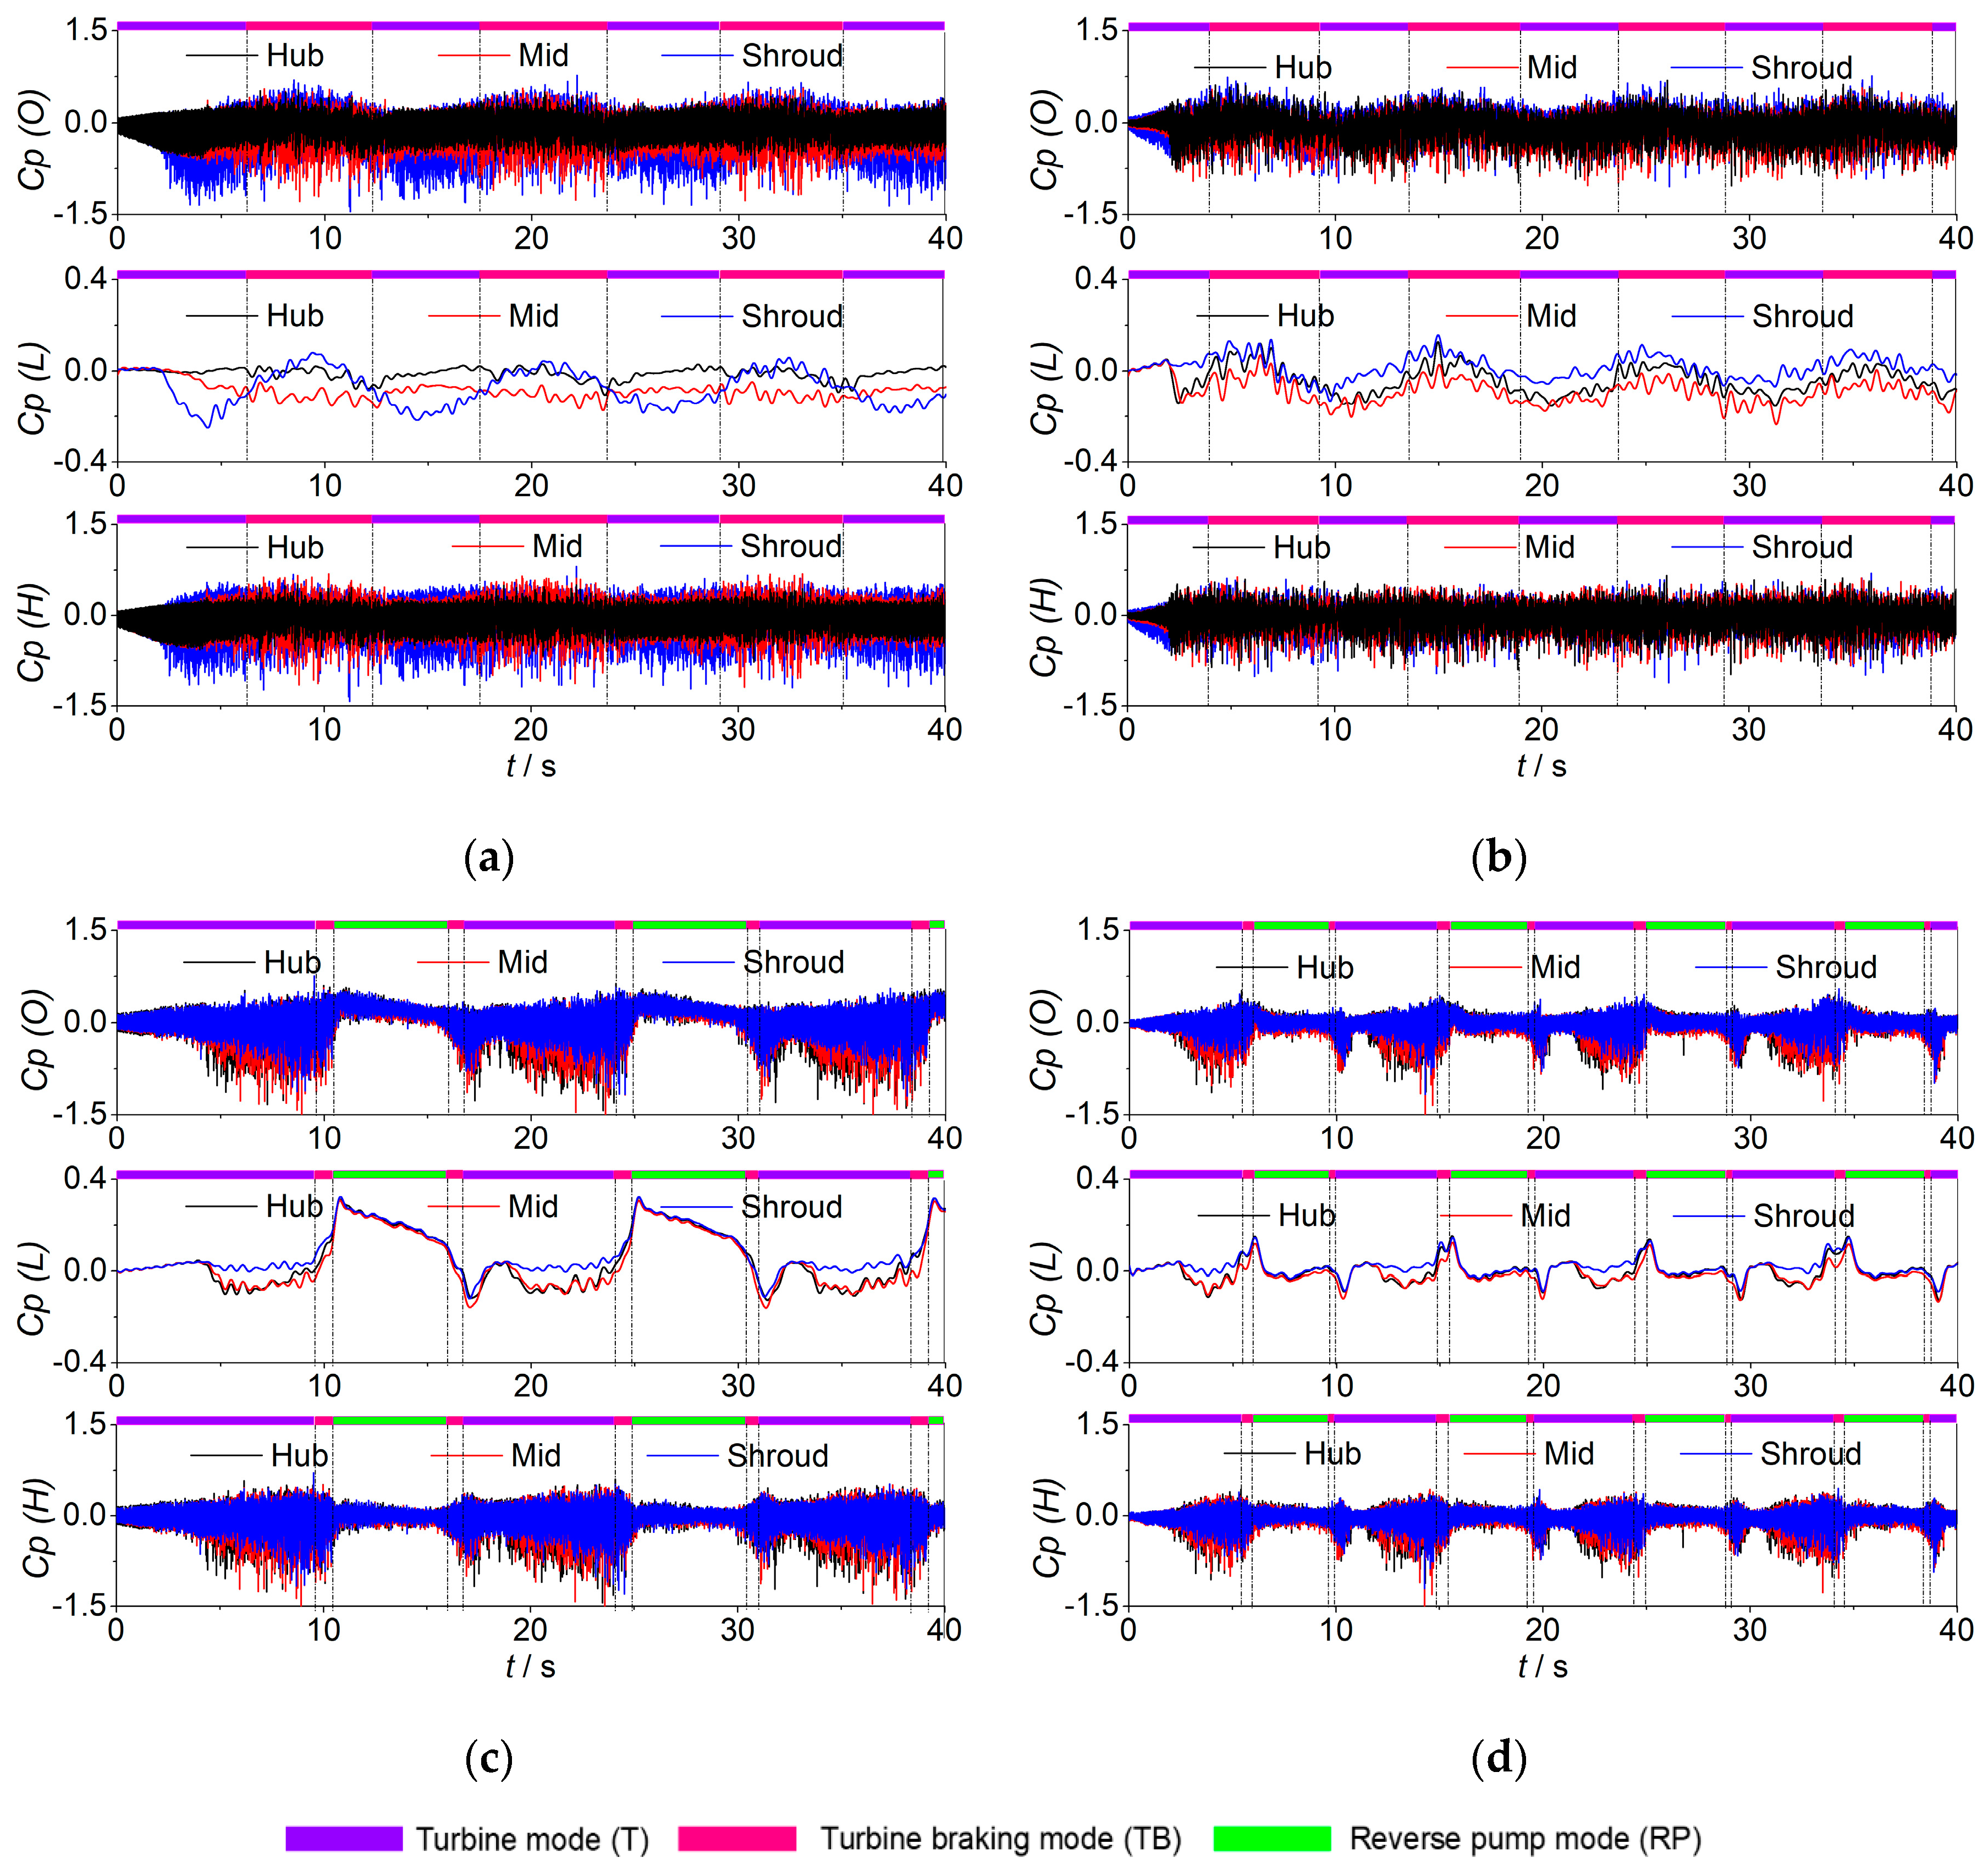
3.3. Pressure Fluctuations in the Time Domain at the Runner Inlets

The dimensionless pressure fluctuations at each monitoring point in the vaneless space are analyzed by comparing with the pressures at the initial time. The normalized pressure was calculated by equation:
C p = p - p initial 0.5 ρ u 1 2
where p is the instantaneous pressure signals, pinitial is mean initial pressure values at the initial time, ρ is the water density, and u1 is the tip velocity of the runner blade leading edge. In addition, Cp (O) and Cp (L) in Figure 8 are the original and low-pass filtered data, respectively, and the upper frequency limit of the low-pass filtered data is 2 Hz.
Previous research has shown that after runaway, backflows will enhance the rotor–stator interactions and greatly increase the amplitudes of pressure pulsations [1]. Figure 8 shows the pressure pulsations in the time domain at the runner inlets of the four pump-turbines. On the whole, under the same total rotational inertia of runner and generator, the amplitudes in PT-1 and PT-3 are relatively large, while those in PT-2 and PT-4 are relatively small. It is found that the longer fluctuation periods of PT-1 and PT-3 mean the longer residence time in the S-shaped region and larger pressure pulsations. In addition, with the variations of rotational speed and discharge, the pressure pulsations present regular changes, with the amplitudes reach the maximum near the runaway point. Due to the different working conditions, there are obvious different characteristics of pressure pulsations.
1. PT-1 and PT-2: The working points only go through the T and TB modes, and the filtered data only slightly vary with the changes of rotational speed and discharge, while the amplitudes of high-frequency signals have no obvious change.
2. PT-3 and PT-4: The trends of pressure pulsations in these two pump-turbines are basically the same, and before the RP mode, they are all similar to those in PT-1 and PT-2 because the low-pass filtered pressure has a shut down when the backflow occurs. However, with the conversion from the TB mode to the RP mode, the low-frequency signals have a significant increase. And when the reverse discharge increases to the maximum value, the low-frequency signals also reach at the maximum. This is because the rotating energy of the runner and rotor is converted to the water head of the pump-turbine. In addition, the pressure variations in PT-3 and PT-4 in the RP mode are still quite different. In particular, the low-frequency signals decrease slowly in PT-3, while those in PT-4 decrease rapidly. The reason is that the backflows at the runner inlet are quite different during this period. In PT-3, backflows are mainly at the mid span, contributing to poor flow capacity to get water out of the blade passages, forming flow blockage at the inlet and increasing pressure [1]. However, in PT-4, backflows occur at the mid span and on the shroud side at the same time, with strong flow capacity and rapid pressure reduction. For the high-frequency signals, the amplitudes of those in the T mode gradually increase, while those in the TB and RP modes decrease.
Compared with the velocity pulsations in Figure 3, it is found that when the working points of PT-3 and PT-4 enter the RP mode, the velocity pulsation always keeps high amplitude characteristics, while the amplitude of pressure pulsations decreases rapidly, which means the unsteady development of the flow patterns cannot accurately reflect the true values of the pressure pulsations. Figure 4, Figure 5, Figure 6 and Figure 7 not only show the flow pattern development at the runner inlets, but also show the magnitude of turbulent kinetic energy. It can be seen that the turbulent kinetic energy at the runner inlet is relatively low after entering the RP mode, indicating that pressure pulsations will decrease rapidly when the turbulent kinetic energy becomes small.

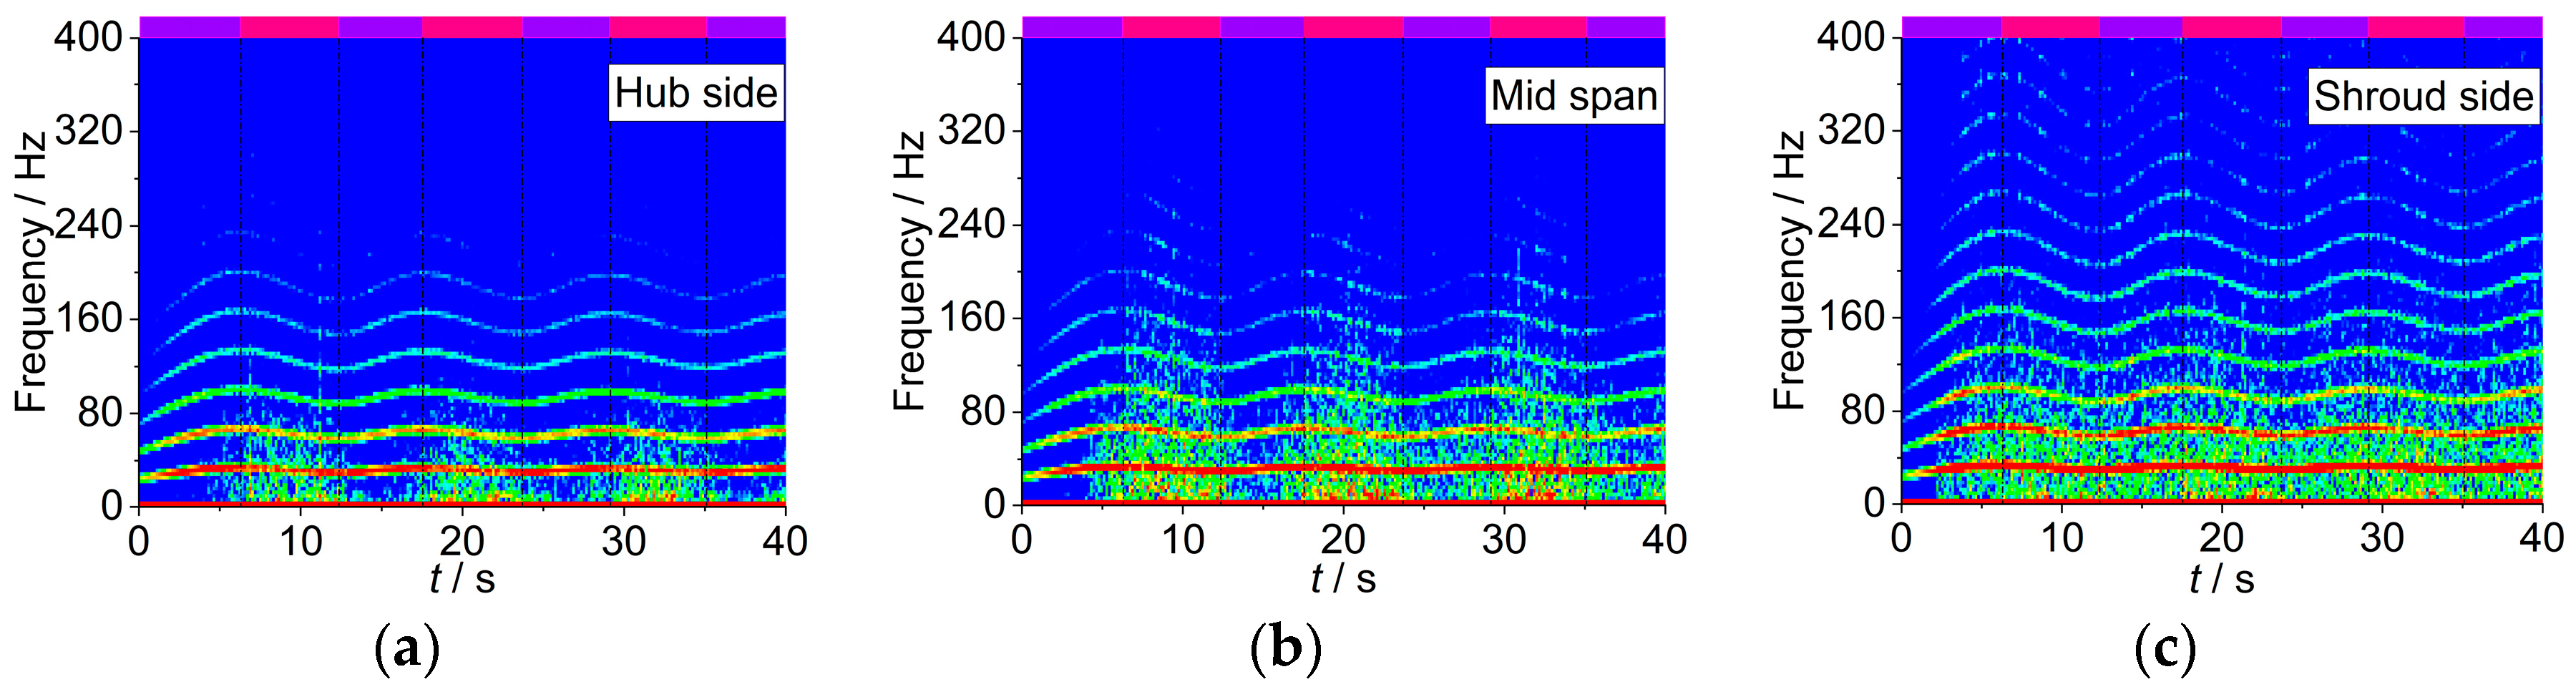
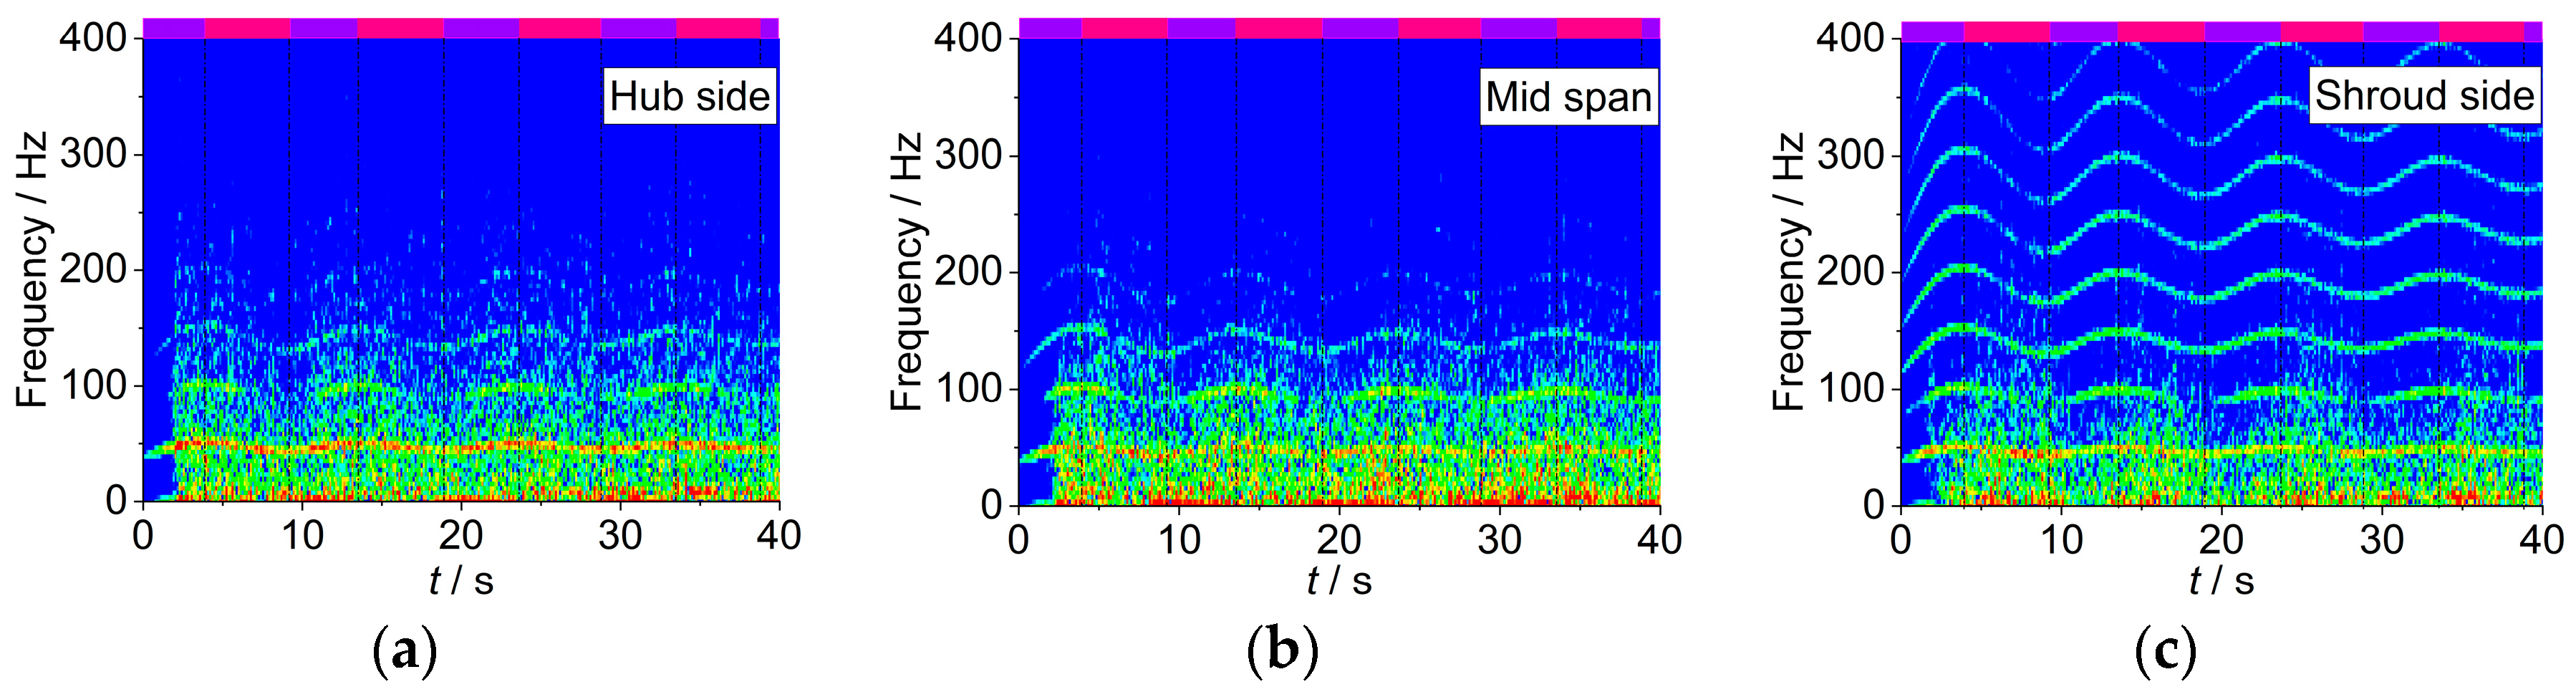
3.4. Pressure Fluctuations in Time–Frequency Domain at the Runner Inlets

A time–frequency analysis of the transient pressure pulsations at the monitoring points was performed by using the Short Time Fourier Transform (STFT) method [30,31,32]. From Figure 9, Figure 10, Figure 11 and Figure 12, at the beginning of the runaway process, the characteristics of pressure pulsations are mainly influenced by the runner. The dominant frequency in the spectrogram is the blade passing frequency (BPF) (7f0 for PT-1; 9f0 for PT-2, PT-3, and PT-4, where f0 is the rotating frequency of the runner rotation), and the rest high frequencies are the integer multiples of the BPF.
In the runaway process, each outstanding frequency varies with the change of rotational speed. As a whole, the amplitude of each frequency increases obviously once the working point enters the S-shaped region, which is due to the enhancement of impact at the runner inlet and rotor-stator interaction. In addition, the high-amplitude low-frequency signals occur obviously, and their occurrence time is consistent with the reduction of inlet radial velocity. Once the backflows generate, the amplitude increases rapidly and reaches at the maximum near the runaway point. Previous studies shown that the high-amplitude low-frequency signals are mainly caused by rotating stalls [1].
In contrast, in PT-1 and PT-2, the durations of the maximum amplitude are mainly after the runaway point, while those in PT-3 and PT-4 are before the runaway point, indicating that the evolutions of unstable flow patterns are affected quite differently by the S-shaped characteristics. Because the working points of PT-3 and PT-4 have gone through the RP mode, the amplitudes suddenly decrease obviously at t = 10 s (PT-3) and t = 5 s (PT-4), and increase at t = 16 s (PT-3) and t = 10 s (PT-4), respectively. All of these phenomena are caused by the backflow transitions, consistent with the changes of pressure fluctuations in the time domain spectrum in Figure 8.
For each runner, the amplitudes of pressure pulsations in different locations at the runner inlet are also different. In PT-1 and PT-2, the differences of pressure pulsation characteristics at the three monitoring points Figure 8 are quite large, while those in PT-3 and PT-4 are smaller. Taking PT-1 as an example, with the runaway beginning, the radial velocity at the inlet decreases obviously, and the low-frequency signals gradually generate at each monitoring point. Once the backflows occur on the shroud side, the amplitudes increase rapidly. Compared with pressure fluctuations at the three locations, the duration of the low-frequency signals is the longest on the shroud side, and they exist in the whole S-shaped region, because the backflows keep staying at this location all of the time. However, the highest amplitudes of low-frequency signals are at the mid span, while the lowest ones are on the hub side, and there are only low-frequency signals at the runaway point. In PT-2, the same phenomenon as in PT-1 is that the location with the highest amplitudes is also at the mid span, though the backflows occur on the hub side. In PT-3 and PT-4, there are no significant differences in the frequency of pulsations in different locations.
From the analysis mentioned above, we know that the high-amplitude low-frequency signals will generate at the location where backflows occur, which is the most obvious in PT-1 because its inlet height is the largest. These phenomena also have the same laws in PT-3 and PT-4, but the difference is not obvious because their inlet heights are smaller. However, the pressure characteristics in PT-2 is an exception Figure 10, which will be discussed in the later chapter.

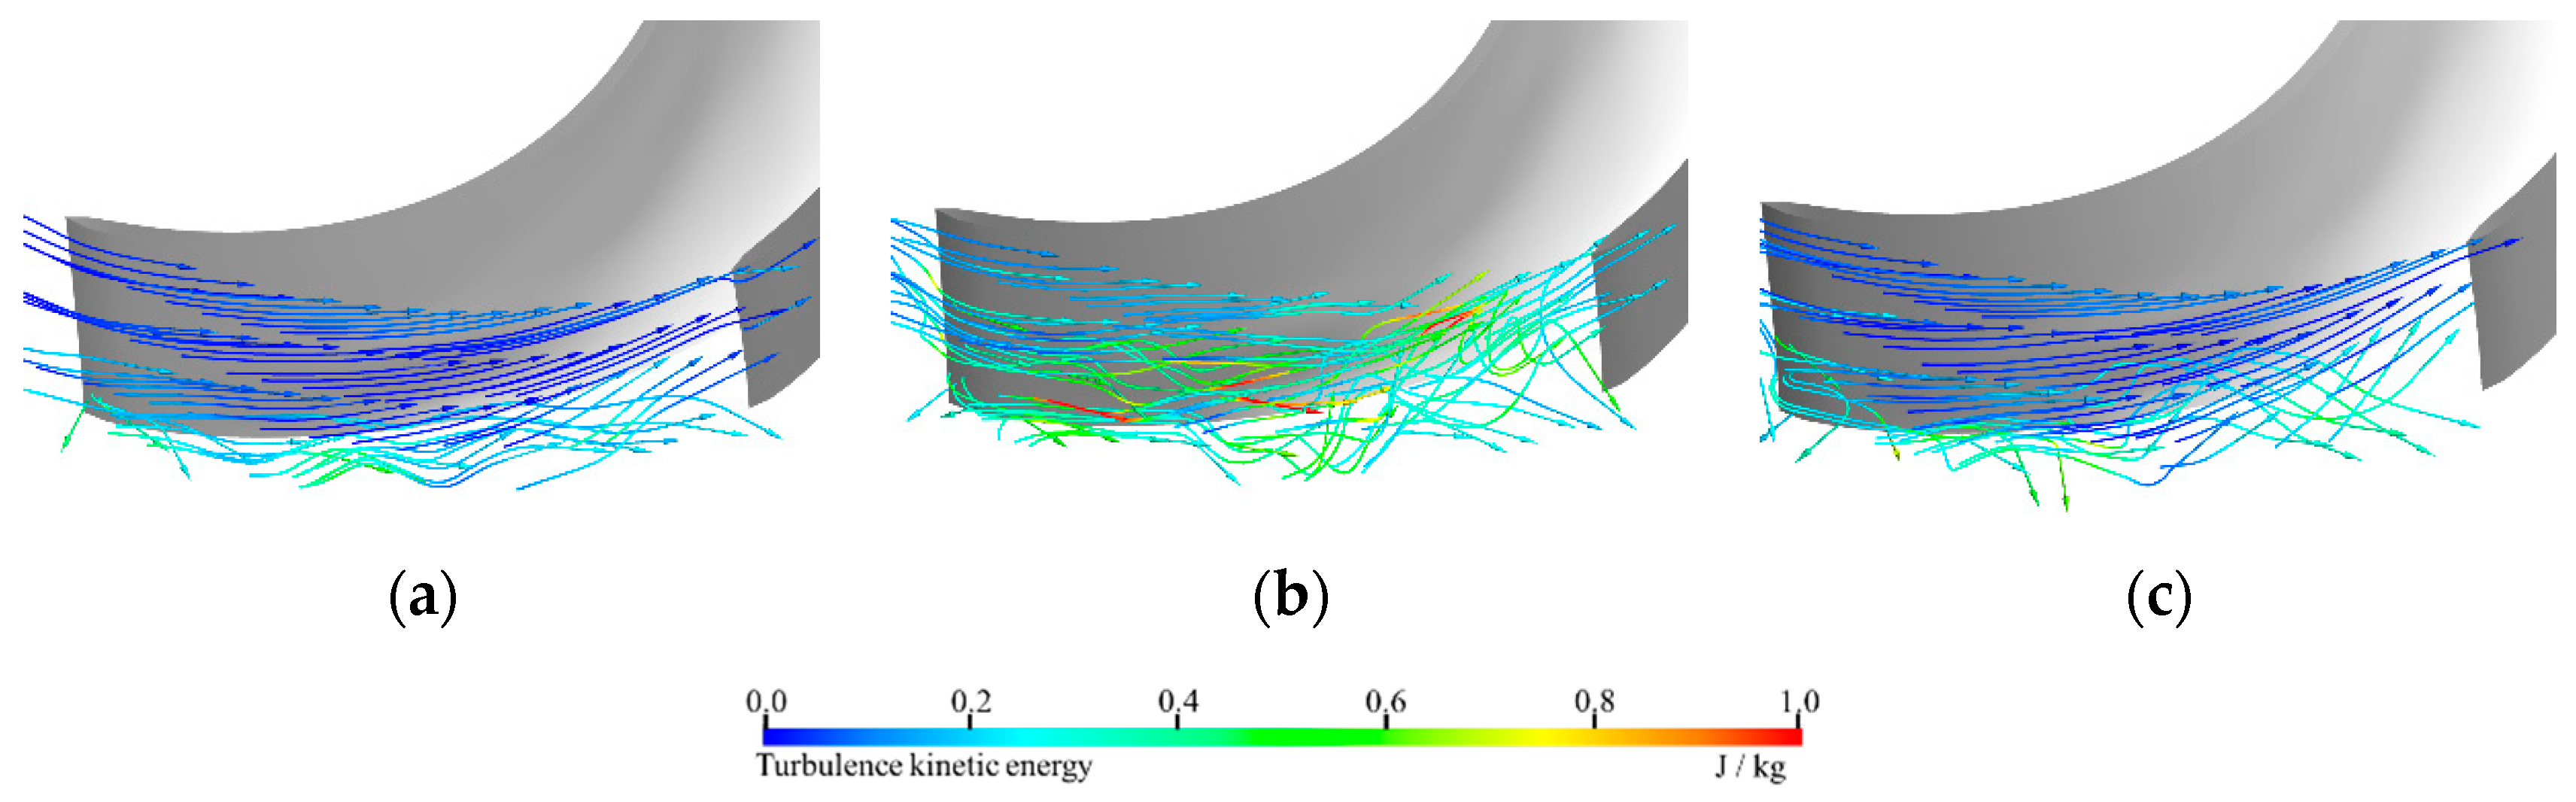
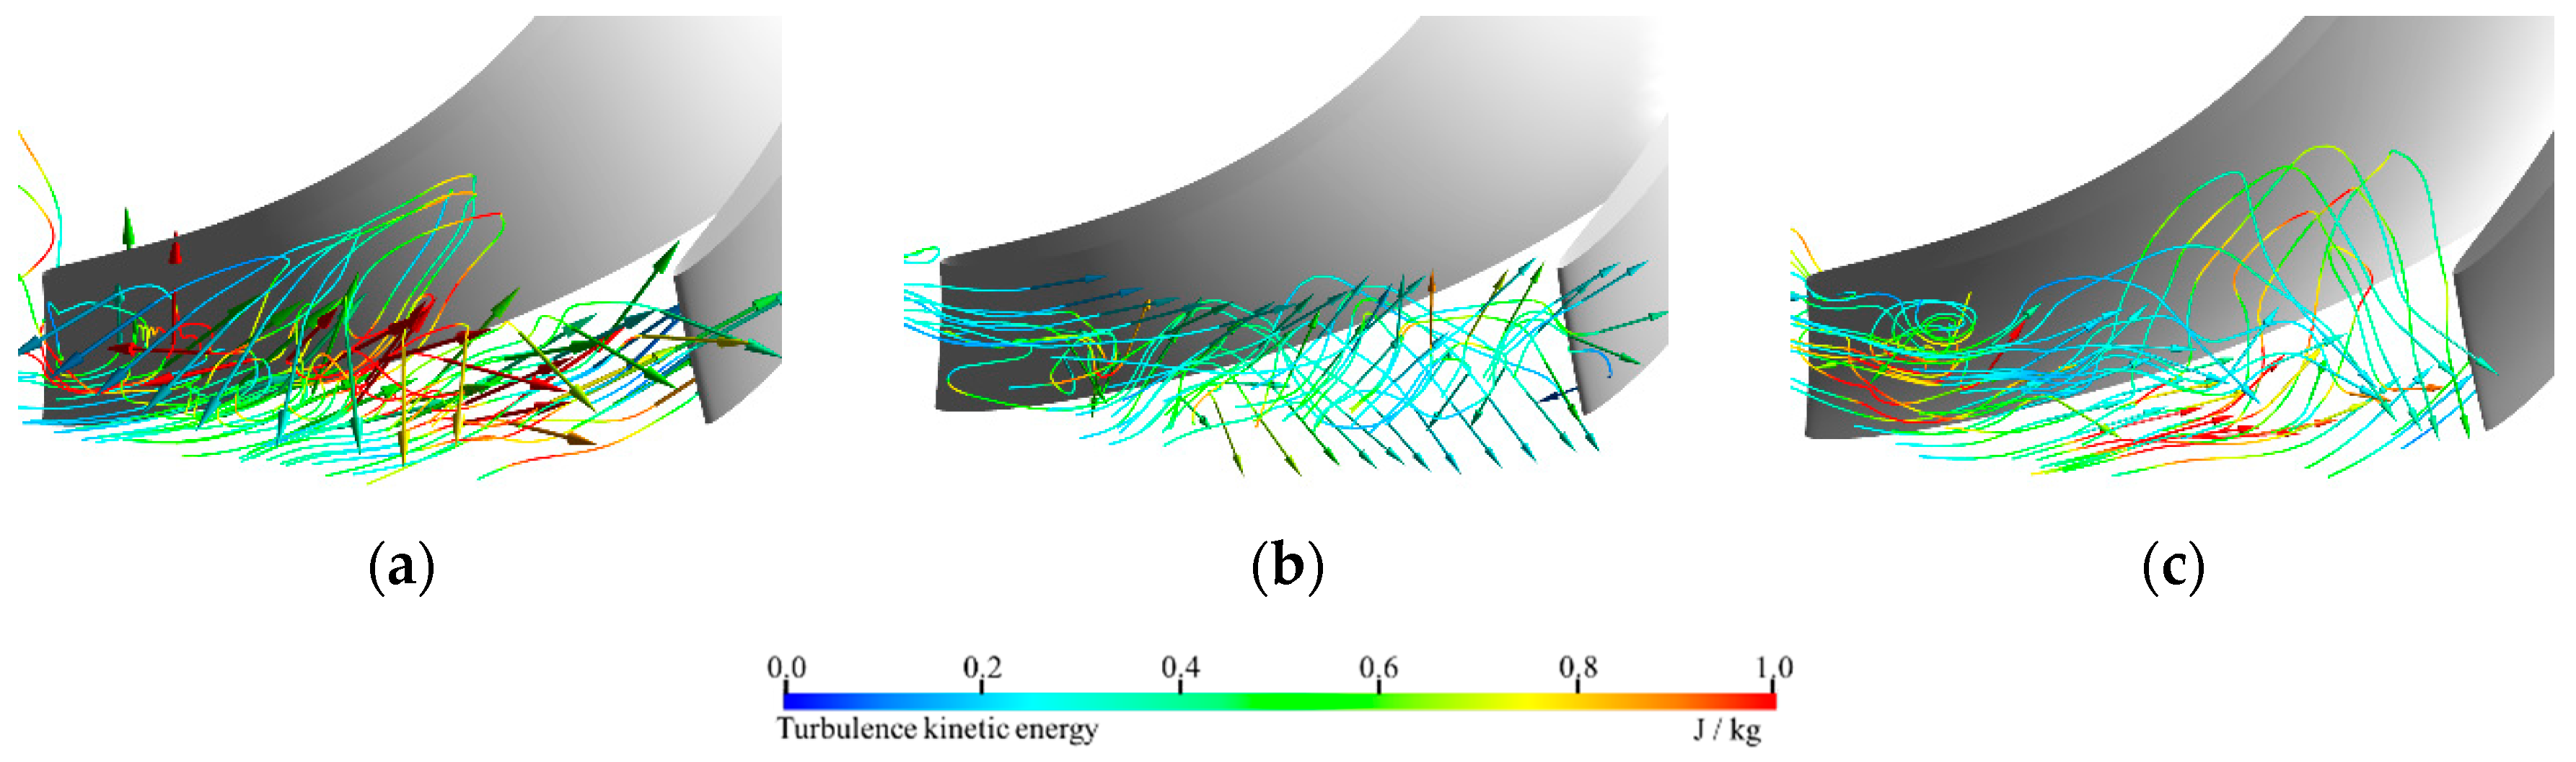
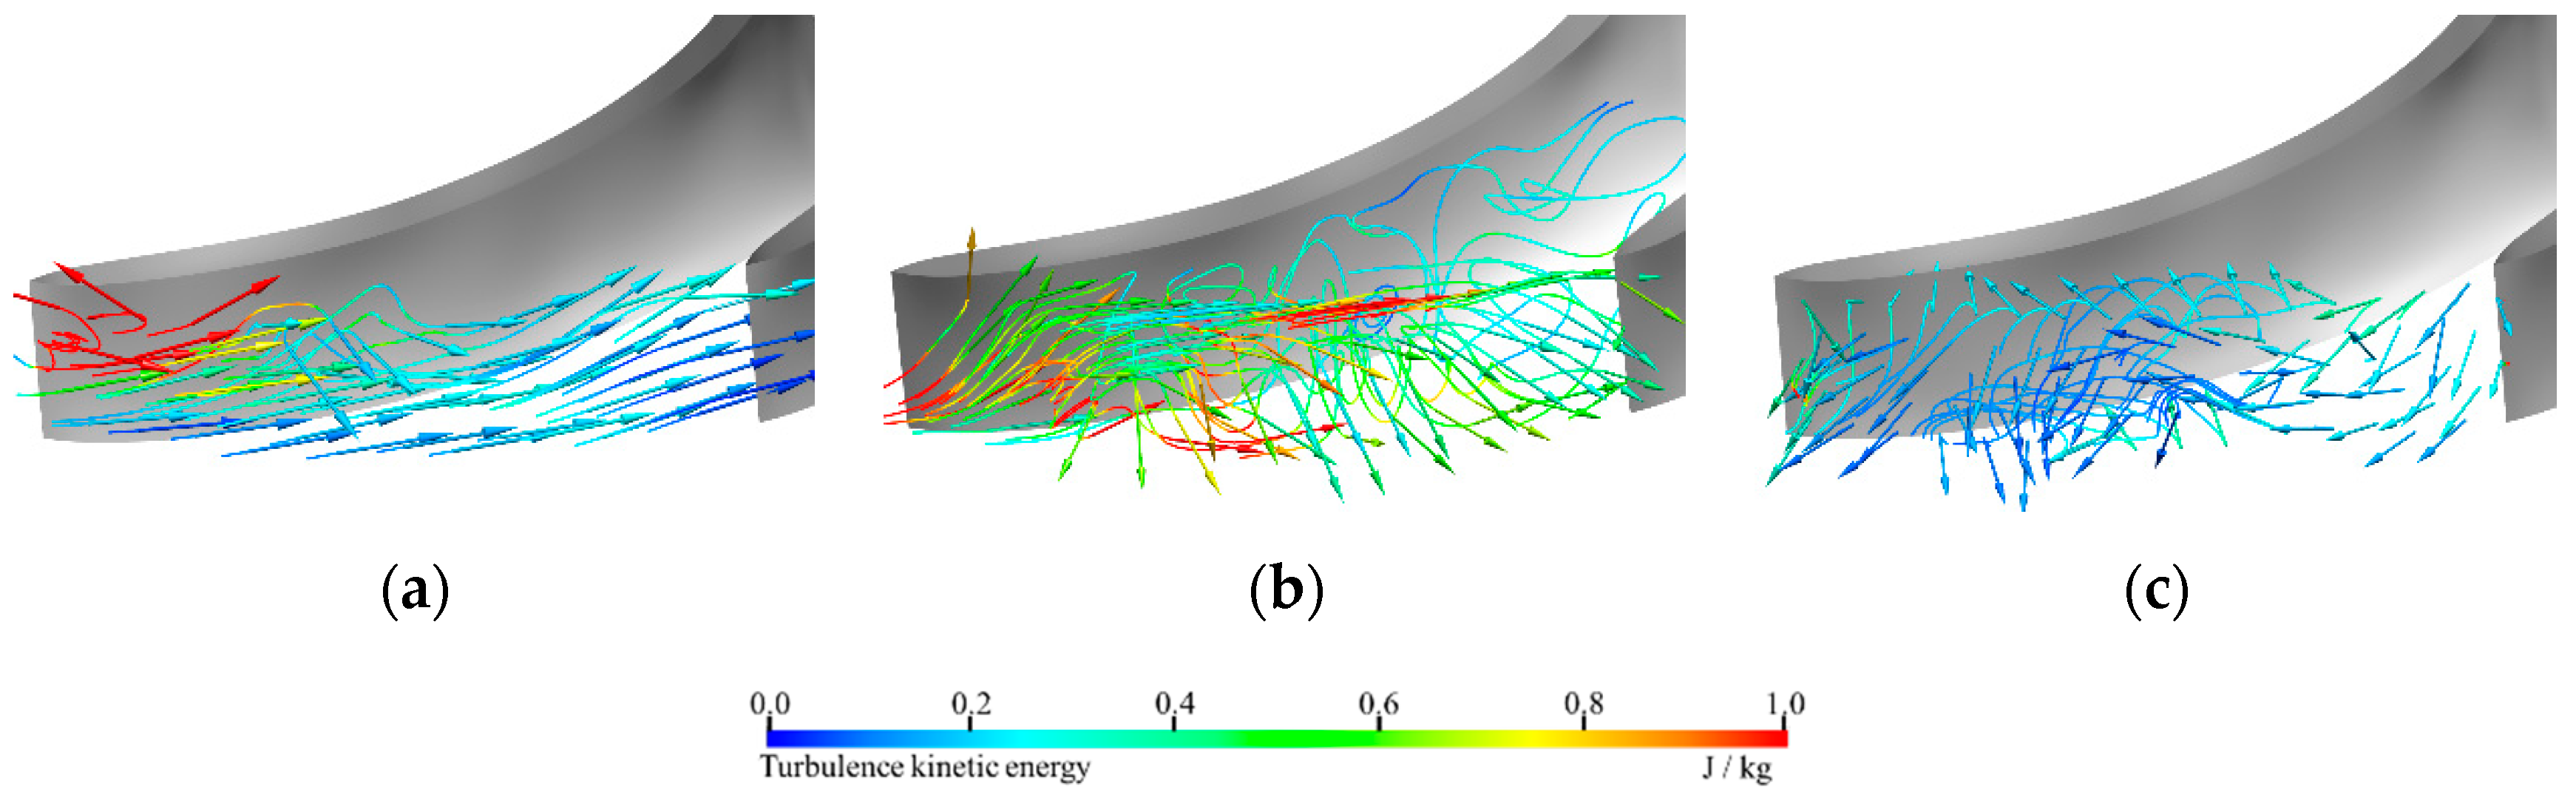
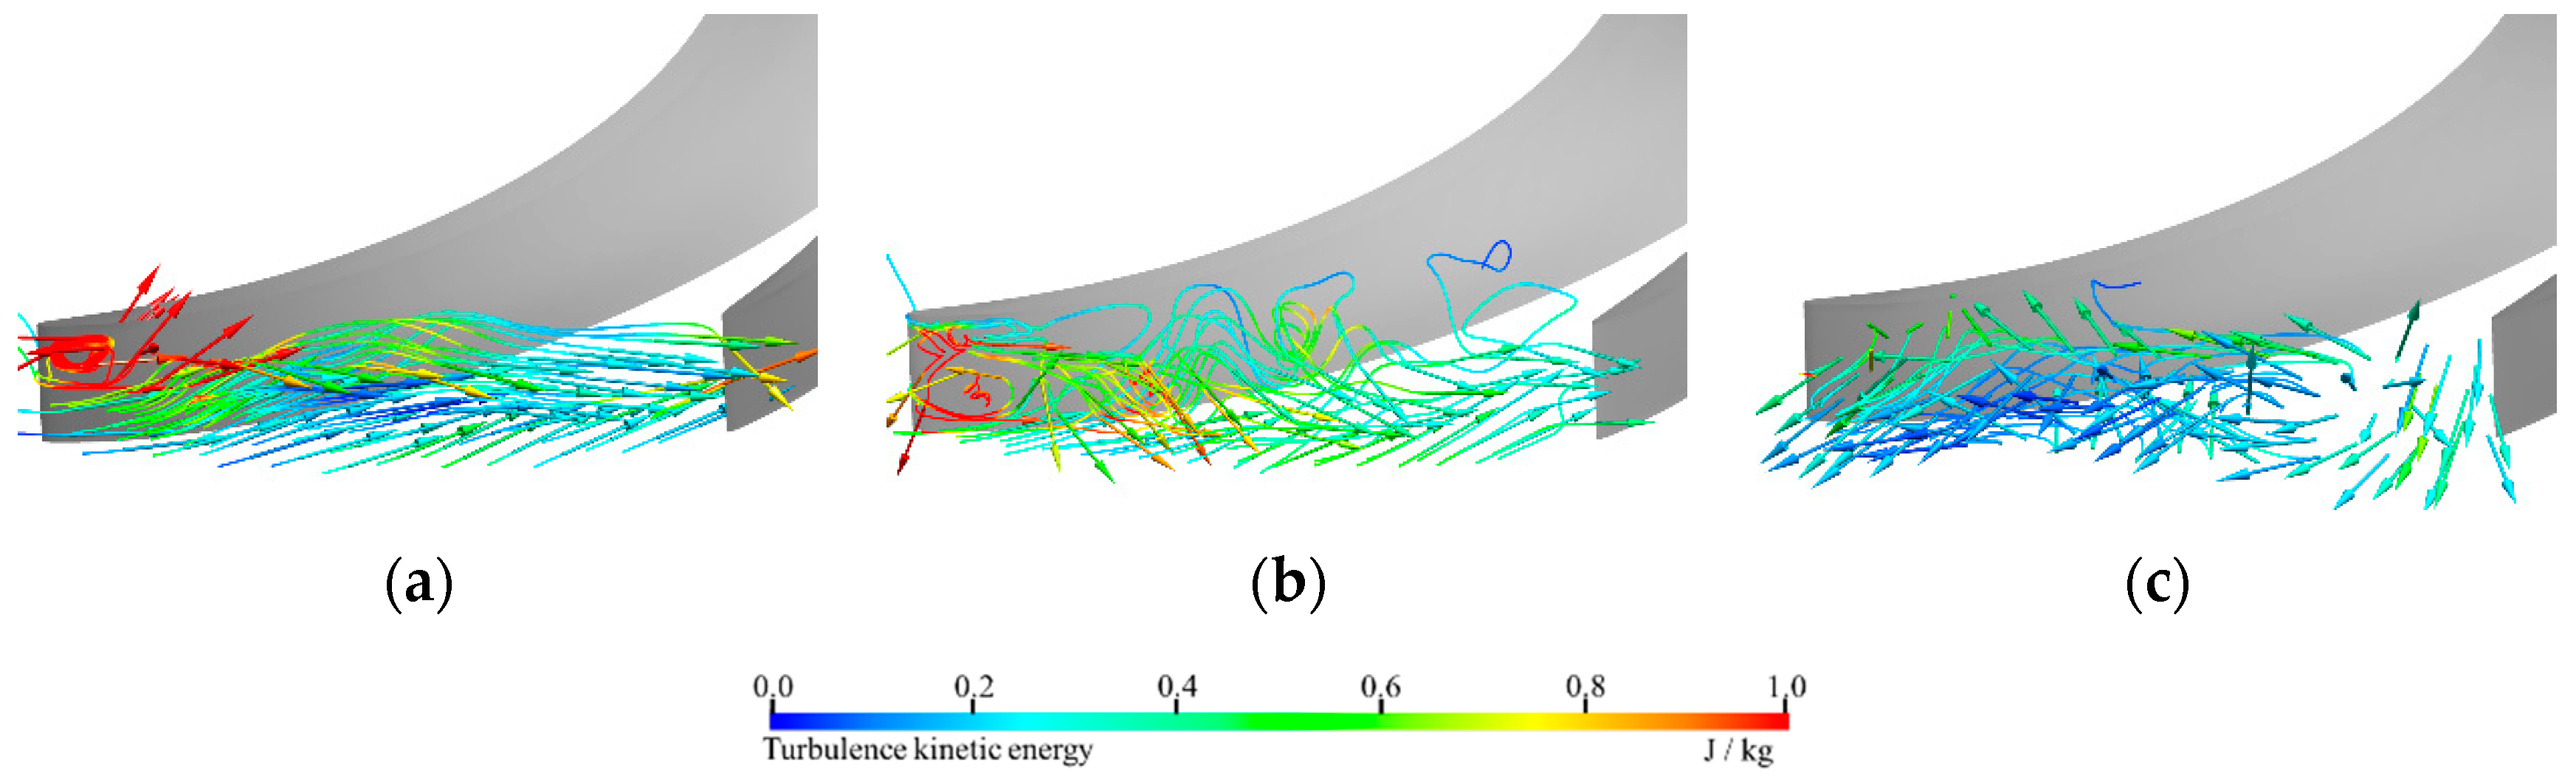
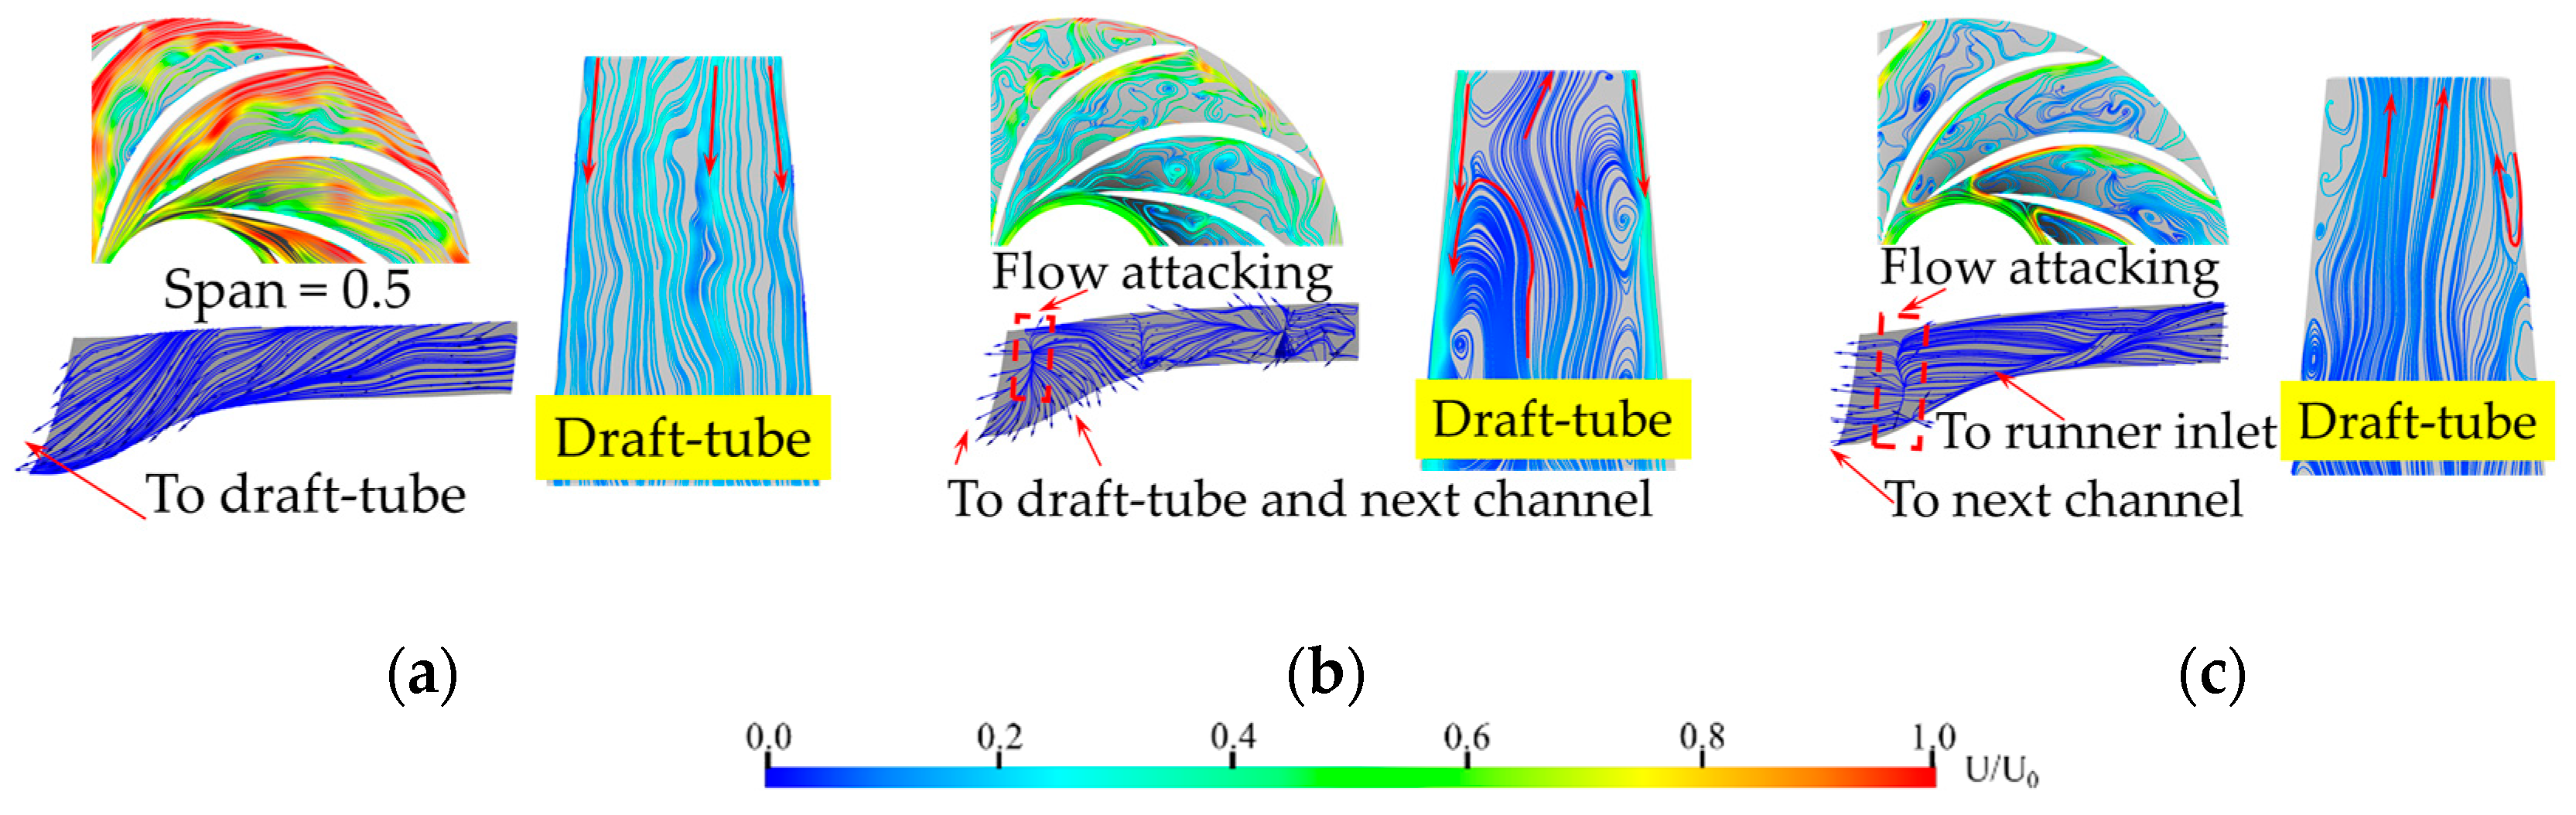
3.5. Flow Patterns in Blade Passage and Draft Tube

Even if the radial velocity at the runner outlet cannot be exactly monitored like that at the inlet, the outlet backflows can be observed clearly from the flow patterns in the draft-tube and near the blade suction side as seen in Figure 13, Figure 14, Figure 15 and Figure 16. After the working point enters the S-shaped region, the streamlines in the blade channels are no longer as smooth as before. The main flow will enter the draft-tube along the side wall, or return to the runner from the draft-tube center, due to the changes in rotational speed and discharge [31]. As mentioned before, whether or not the working point enters the RP mode can lead to large differences in flow patterns, which has no exception at the runner outlet. For PT-1 and PT-2 (Figure 13 and Figure 14), although the total flow rate is mainly in the turbine direction, the main stream water flow attacks the blade suction side from the draft-tube center, because of the increase of the pumping effect. Some water jumps into the nearby runner channel, and some go back to the draft-tube. Also, this phenomenon will be very obvious when the minimum discharge condition is approached. But in PT-3 and PT-4 Figure 15 and Figure 16, the working points also enter the RP mode, and the flowing directions reverse to the pump direction. At this time, a part of water flow enters the upstream along the suction surface, and a part escapes to the next blade channel, and a little water returns to the draft-tube.

4. Discussions of Influences of Runner Shapes

It can be seen from the above analysis that the starting and staying locations of backflows at the runner inlets are different during the runaway processes in the pump-turbines with different specific speeds. Xia [33] pointed out that the backflow structures are mainly affected by the shape of the blade inlet and centrifugal force, which can change the pressure gradient. Similarly, the initial position of backflows is related to this factor. Figure 17 shows the different blade lean angles of the four pump-turbines, which mean the inclination angles of blade leading edges at the runner inlets. The blade lean angle of PT-1 is negative, and its backflows generate from the shroud side. The blade lean angle PT-2 is positive, and its backflows generate from the hub side. Interestingly, the inlets of PT-3 and PT-4 have no blade lean, but the backflows also generate from the hub side.
As shown in Figure 8, it can be seen from the filtered-data that in the early stage of runaway, the pressures at the monitoring points are approximately the same and there is no backflow. With the increase in rotating speed, the centrifugal force increases but the discharge decreases, then the pressure gradient between the hub and shroud sides becomes larger, resulting in water flows from the higher-pressure side to the lower one. Here, the blade lean angle affects the distribution of pressure gradient and leads to the different initial position of backflows. The negative lean angle of PT-1 forces the pressure to increase on the hub side, which makes the water turn from the hub side to middle and shroud ones, leading to backflows on the shroud side Figure 18a. On the contrary, the backflows in PT-2 generate from the hub side due to the existence of a positive lean angle Figure 18b. Although there is no lean angle in PT-3 and PT-4, the pressure gradient distribution in them is consistent with that in PT-2, therefore the backflows all generate from the hub side Figure 18c.
Secondly, the different heights of runner inlets affect the development of backflows. The smaller the height of runner inlet, the easier the backflows change location. The inlet height of PT-1 is the largest, therefore the backflows can only exist on the shroud side all the time, and the influence range of backflows is relatively small. Therefore, due to the lowest height of PT-4, in the RP mode, the relative backflow region can be larger than that in PT-3 Figure 3. Because of these differences in backflow transitions, pressure pulsation evolutions get large differences. With the decrease of the inlet height, the differences of the pressure fluctuations between three locations decrease. Hence, the difference of the pressure fluctuations at each location in PT-1 is the largest, while that in PT-4 is the smallest. In the above four runners, except for PT-2, the location where the backflows occur, the pressure amplitudes are the largest. As a special case, the blade inlet design of PT-2 is the main reason that the blade leading edge diameters at the three locations are quite different Figure 19b. Due to the difference of blade leading edge diameters at the three locations, the pressure characteristics in PT-2 is an exception. Therefore, besides the backflows, the size of the vaneless space and distance to the blade should be considered.
In order to further verify the analysis mentioned above, the runaway process of a conventional turbine was also simulated, and the detailed information including the lean angle of blade leading edge and inlet diameter was shown in Figure 20. Though the starting working condition of runaway is not the rated one, it is a large guide-vane opening case, which is near the rated working point and can reflect the main characteristics of backflows and pressure pulsations.
The results show that the macro parameters nearly maintain constant values after t = 4 s due to the absence of the S-shaped characteristics, and the period during this time is defined as the no-load mode (Figure 21). The radial velocity and flow patterns are selected (Figure 22 and Figure 23), and it can be seen that the backflows only generate on the hub side, which is similar to those in PT-2 because these two turbines have the same blade lean angle (Figure 17b and Figure 20a) and the same pressure gradient (Figure 18b). Also, the backflows keep staying on the hub side because the runner inlet height is relatively large, which is similar to those in PT-1.

5. Conclusions

The transient processes of the four pump-turbines with different specific speeds from turbine mode were simulated, and the macro parameter variations, flow pattern evolutions, as well as pressure fluctuations were analyzed. The working conditions, the transitions of backflows at the runner inlet and outlet, and the pressure pulsations at different locations ware compared, and the following conclusions were drawn.
1. The lower specific speed of the pump-turbine, the easier the chance for pump-turbines to enter into the reverse pump mode, generating undamped runaway oscillations. During these runaway processes, backflows and violent pressure pulsations occur in all turbines, and similarities and differences are obvious.
2. The position where the backflows generate at the runner inlet is related to the blade lean angle, which can affect the distribution of pressure gradient. As a result, the water turns from the higher-pressure side to the lower one, then the backflows generate at the lower pressure side. In addition, because lower specific speed turbine has smaller inlet height, the backflows occupy relatively larger range at the runner inlet and are easier to have transitions.
3. The pressure pulsations at different locations are influenced by the relative runner inlet height, distance to runner blades and flow pattern transitions. The smaller the runner inlet height, the smaller the differences in the pressure signals at three locations. The smaller the distance to the runner blades, the larger the pressure pulsations. Furthermore, flow pattern transitions and the turbulent kinetic energy distribution are important and should be considered.
4. S-characteristics in different pump-turbines are quite different, therefore, besides the four pump-turbines in this paper, more pump-turbines should be chosen to investigate the evolutions of pressure pulsation and flow patterns during the runaway process. Also, more factors including water conveyance systems, inertia of rotating parts, and guide vane openings should be considered to study the flow patterns and pressure pulsations in practical power stations. In addition, control methods should be investigated in the design stage by 3D simulations of transient processes.

Author Contributions

Data curation, Z.L. and Z.Y.; formal analysis, Z.Y. and Z.L.; investigation, Z.Y. and L.X.; validation, X.Z.; writing—original draft, Z.Y. and Y.C.; writing—review & editing, K.L. and X.Z. All authors have read and agreed to the published version of the manuscript.

Funding

This work was supported by the National Natural Science Foundation of China (NSFC) (Grant Nos. 51839008 and 51579187), the Natural Science Foundation of Hubei Province (Grant No. 2018CFA010), the National Natural Science Foundation of China (Grant No. 51909226), and the Natural Science Foundation of Fujian Province, China (Grant No. 2018J01525).

Acknowledgments

The numerical simulations were conducted on the supercomputing system in the Supercomputing Center of Wuhan University.

Conflicts of Interest

The authors declare no conflict of interest.

Nomenclature

b0height of runner inlet (m)
Cpnormalized pressure at the runner inlets (-)
Cp (O)original data of normalized pressure at the runner inlets (-)
Cp (L)low-pass filtered data of normalized pressure at the runner inlets (-)
Cp (H)Cp (O) − Cp (L), high frequency data of normalized pressure at the runner inlets (-)
Ddiameter of the runner inlet (m)
E1total energy values at the spiral-casing inlet (m)
E2total energy values at the runner outlet (m)
GD2Inertia of rotating parts (107 kg · m2)
Hrrated head (m)
Hhead during the runaway process (m)
Mmoment during the runaway process (N·m)
M0moment at the initial time (N·m)
M11unit torque (N·m)
nrotational speed during the runaway process (rpm)
n0rotational speed at the initial time (rpm)
n1rotational speed at the initial time (rad/s)
n11unit speed (rpm)
nsspecific speed (m · kW)
nrrated rotational speed (rpm)
Nrrated output (MW)
pinstantaneous pressure (Pa)
pinitialmean initial pressure values at the initial time (Pa)
Qdischarge during the runaway process (m3/s)
Q0discharge at the initial time (m3/s)
Q11unit discharge (m3/s)
ttimes (s)
u1tip velocity of runner blade leading edge (m/s)
Urthe instantaneous radial velocity (m/s)
vrnormalized radial velocity at the runner inlets (-)
vr (O)original data of normalized radial velocity at the runner inlets (-)
vr (L)low-pass filtered data of normalized radial velocity at the runner inlets (-)
ρwater density (kg/m3)

References

  1. Xia, L.; Cheng, Y.; Yang, Z.; You, J.; Yang, J.; Qian, Z. Evolutions of Pressure Fluctuations and Runner Loads during Runaway Processes of a Pump-Turbine. J. Fluids Eng. Trans. ASME 2017, 139, 091101. [Google Scholar] [CrossRef]
  2. Fu, X.; Li, D.; Wang, H.; Zhang, G.; Li, Z.; Wei, X. Numerical simulation of the transient flow in a pump-turbine during load rejection process with special emphasis on hydraulic acoustic effect. Renew. Energy 2020, 155, 1127–1138. [Google Scholar] [CrossRef]
  3. Li, D.; Wang, H.; Xiang, G.; Gong, R.; Wei, X.; Liu, Z. Unsteady simulation and analysis for hump characteristics of a pump turbine model. Renew. Energy 2015, 77, 32–42. [Google Scholar]
  4. Barbour, E.; Wilson, I.; Radcliffe, J.; Ding, Y.; Li, Y. A review of pumped hydro energy storage development in significant international electricity markets. Renew. Sustain. Energy Rev. 2016, 61, 421–432. [Google Scholar] [CrossRef] [Green Version]
  5. Durga Hari Kiran, B.; Sailaja Kumari, M. Demand response and pumped hydro storage scheduling for balancing wind power uncertainties: A probabilistic unit commitment approach. Int. J. Electr. Power Energy Syst. 2016, 81, 114–122. [Google Scholar] [CrossRef]
  6. Cai, J.; Zhou, X.; Deng, L. The research of the abnormal water hammer phenomenon based on the unit 3 over speed test of Jiangsu. Water Power 2009, 35, 87–90. (In Chinese) [Google Scholar]
  7. Li, Q.; Li, J.; Hu, Q.; Yu, J. Site test on S-shape characteristics of large-sized mixed flow reversible turbine-generator unit. Northwest Hydropower 2012, S1, 81–85. (In Chinese) [Google Scholar]
  8. Ma, M. Analysis and solution of grid connection failure under low head condition. Mech. Electr. Tech. Hydropower Stn. 2002, 2, 37–39. (In Chinese) [Google Scholar]
  9. Le, Z.; Kong, L. Cause analysis on rotating part lifting of unit 2 in Tianhuangping pumped storage plant. Mech. Electr. Tech. Hydropower Stn. 2005, 28, 11–13. (In Chinese) [Google Scholar]
  10. Yang, Z.; Cheng, Y.; Xia, L.; Meng, W.; Gao, L.; Dai, X. Evolutions of guide vane moment of a pump-turbine during runaway transient process after pump trip. IOP Conf. Ser. Earth Environ. Sci. 2019, 240, 072033. [Google Scholar] [CrossRef]
  11. Li, D.; Fu, X.; Zuo, Z.; Wang, H.; Li, Z.; Liu, S.; Wei, X. Investigation methods for analysis of transient phenomena concerning design and operation of hydraulic-machine systems—A review. Renew. Sustain. Energy Rev. 2019, 101, 26–46. [Google Scholar] [CrossRef]
  12. Zhang, Y.; Wu, Y. A review of rotating stall in reversible pump turbine. Proc. Inst. Mech. Eng. Part C J. Mech. Eng. Sci. 2017, 231, 1181–1204. [Google Scholar] [CrossRef] [Green Version]
  13. Zuo, Z.; Liu, S.; Sun, Y.; Wu, Y. Pressure fluctuations in the vaneless space of High-head pump-turbines—A review. Renew. Sustain. Energy Rev. 2015, 41, 965–974. [Google Scholar] [CrossRef]
  14. Gentner, C.; Sallaberger, M.; Widmer, C.; Braun, O.; Staubli, T. Numerical and experimental analysis of instability phenomena in pump turbines. IOP Conf. Ser. Earth Environ. Sci. 2012, 15, 032042. [Google Scholar] [CrossRef]
  15. Wang, L.; Yin, J.; Jiao, L.; Wu, D.; Qin, D. Numerical investigation on the “S” characteristics of a reduced pump turbine model. Sci. China Technol. Sci. 2011, 54, 1259–1266. [Google Scholar] [CrossRef]
  16. Widmer, C.; Staubli, T.; Ledergerber, N. Unstable characteristics and rotating stall in turbine brake operation of pump-turbines. J. Fluids Eng. Trans. ASME 2011, 133, 1–9. [Google Scholar] [CrossRef]
  17. Hasmatuchi, V.; Farhat, M.; Roth, S.; Botero, F.; Avellan, F. Experimental evidence of rotating stall in a pump-turbine at off-design conditions in generating mode. J. Fluids Eng. Trans. ASME 2011, 133, 1–8. [Google Scholar] [CrossRef]
  18. Jacquet, C.; Fortes-Patella, R.; Balarac, L.; Houdeline, J.B. CFD investigation of complex phenomena in S-shape region of reversible pump-turbine. IOP Conf. Ser. Earth Environ. Sci. 2016, 49, 042010. [Google Scholar] [CrossRef]
  19. Trivedi, C.; Cervantes, M.; Gandhi, B. Investigation of a high head Francis turbine at runaway operating conditions. Energies 2016, 9, 149. [Google Scholar] [CrossRef] [Green Version]
  20. Trivedi, C.; Gandhi, B.; Cervantes, M.; Dahlhaug, O. Experimental investigations of a model Francis turbine during shutdown at synchronous speed. Renew. Energy 2015, 83, 828–836. [Google Scholar] [CrossRef]
  21. Trivedi, C.; Cervantes, M.; Gandhi, B.; Dahlhaug, O. Transient pressure measurements on a high head model Francis turbine during emergency shutdown, total load rejection, and runaway. J. Fluids Eng. Trans. ASME 2014, 136, 121107. [Google Scholar] [CrossRef]
  22. Trivedi, C.; Cervantes, M.; Dahlhaug, O.; Gandhi, B. Experimental investigation of a high head Francis turbine during spin-no-load operation. J. Fluids Eng. Trans. ASME 2015, 137, 061106. [Google Scholar] [CrossRef]
  23. Yin, J.; Wang, D.; Walters, D.; Wei, X. Investigation of the unstable flow phenomenon in a pump turbine. Sci. China Phys. Mech. Astron. 2014, 57, 1119–1127. [Google Scholar] [CrossRef]
  24. Zhang, X.; Cheng, Y.; Xia, L.; Yang, J.; Qian, Z. Looping dynamic characteristics of a pump-turbine in the s-shaped region during runaway. J. Fluids Eng. Trans. ASME 2016, 138, 1–10. [Google Scholar] [CrossRef]
  25. Wei, B.; Ji, C. Study on rotor operation stability of high-speed large-capacity generator-motor: The Accident of Rotor Pole in Huizhou Pumped-Storage Power Station. Water Power 2010, 36, 57–60. (In Chinese) [Google Scholar]
  26. Zhou, Q.; Xia, L.; Zhang, C. Internal mechanism and improvement criteria for the runaway oscillation stability of a pump-turbine. Appl. Sci. 2018, 8, 2193. [Google Scholar] [CrossRef] [Green Version]
  27. Zhang, X. Three-Dimensional Transient Flow in Pumped-Storage Plant: Simulation and Analysis by Coupling One-Dimensional Water Conveyance System with Three-Dimensional Pump-Turbine. Ph.D. Thesis, Wuhan University, Wuhan, China, 2015. [Google Scholar]
  28. Zhang, X.; Cheng, Y.; Yang, Z.; Chen, Q.; Liu, D. Influence of rotational inertia on the runner radial forces of a model pump-turbine running away through the S-shaped characteristic region. IET Renew. Power Gener. 2020, 14, 1883–1893. [Google Scholar] [CrossRef]
  29. Xia, L.; Cheng, Y.; Yang, Z.; Yuan, Y.; Zhu, Z. Numerical investigations into the transient behaviour of a model pump-turbine during load rejection process. IOP Conf. Ser. Earth Environ. Sci. 2019, 240, 072040. [Google Scholar] [CrossRef]
  30. Liu, Q.; Su, W.; Li, X.; Zhang, Y. Dynamic characteristics of load rejection process in a reversible pump-turbine. Renew. Energy 2020, 146, 1922–1931. [Google Scholar] [CrossRef]
  31. Yang, Z.; Cheng, Y.; Xia, L.; Meng, W.; Liu, K.; Zhang, X. Evolutions of flow patterns and pressure fluctuations in a prototype pump-turbine during the runaway transient process after pump-trip. Renew. Energy 2020, 152, 1149–1159. [Google Scholar] [CrossRef]
  32. Fu, X.; Li, D.; Wang, H.; Zhang, G.; Li, Z.; Wei, X. Dynamic instability of a pump-turbine in load rejection transient process. Sci. China Technol. Sci. 2018, 61, 1765–1775. [Google Scholar] [CrossRef]
  33. Xia, L. Mechanism of the S-Shaped Characteristics and the Flow-Induced Dynamic Instability of Pump-Turbines. Ph.D. Thesis, Wuhan University, Wuhan, China, 2017. [Google Scholar]
Figure 1. Computational domains of the pump-turbines (PT) and conventional turbine (CT), the schematic of monitoring points, and mesh information.
Energies 13 05269 g001
Figure 2. Working point trajectories and parameter histories of the four pump-turbines: (a) PT-1, (b) PT-2, (c) PT-3, (d) PT-4.
Energies 13 05269 g002
Figure 3. Variations of the normalized radial velocity vr at the three monitor points: (a) PT-1, (b) PT-2, (c) PT-3, (d) PT-4.
Energies 13 05269 g003
Figure 4. Flow patterns at the runner inlet in PT-1: (a) t = 3.6 s (turbine (T)), (b) t = 10.0 s (turbine braking (TB)), and (c) t = 15.0 s (T).
Energies 13 05269 g004
Figure 5. Flow patterns at the runner inlet in PT-2: (a) t = 5.0 s (TB), (b) t = 8.0 s (TB), and (c) t = 15.0 s (TB).
Energies 13 05269 g005
Figure 6. Flow patterns at the runner inlet in PT-3: (a) t = 8.0 s (T), (b) t = 10.0 s (TB), (c) t = 13.0 s (reverse pump (RP)).
Energies 13 05269 g006
Figure 7. Flow patterns at the runner inlet in PT-4: (a) t = 4.0 s (T), (b) t = 5.8 s (TB), (c) t = 7.4 s (RP).
Energies 13 05269 g007
Figure 8. Variations of normalized pressure Cp at the three monitoring points of runner inlet: (a) PT-1, (b) PT-2, (c) PT-3, (d) PT-4.
Energies 13 05269 g008
Figure 9. Frequency spectrums for pressures at the monitoring points of PT-1: (a) at hub side, (b) at mid span, (c) at shroud side.
Energies 13 05269 g009
Figure 10. Frequency spectrums for pressures at the monitoring points of PT-2: (a) at hub side, (b) at mid span, (c) at shroud side.
Energies 13 05269 g010
Figure 11. Frequency spectrums for pressures at the monitoring points of PT-3: (a) at hub side, (b) at mid span, (c) at shroud side.
Energies 13 05269 g011
Figure 12. Frequency spectrums for pressures at the monitoring points of PT-4: (a) at hub side, (b) at mid span, (c) at shroud side.
Energies 13 05269 g012
Figure 13. Flow patterns in PT-1. (a) t = 3.6 s, (b) t = 10.0 s, and (c) t = 15.0 s.
Energies 13 05269 g013
Figure 14. Flow patterns in PT-2. (a) t = 0.1 s, (b) t = 7.0 s, and (c) t = 15.0 s.
Energies 13 05269 g014
Figure 15. Flow patterns in PT-3. (a) t = 5.0 s, (b) t = 10.0 s, and (c) t = 13.0 s.
Energies 13 05269 g015
Figure 16. Flow patterns in PT-4. (a) t = 4.0 s, (b) t = 5.8 s, and (c) t = 7.4 s.
Energies 13 05269 g016
Figure 17. Lean angles of the blade leading edges of the four pump-turbines: (a) PT-1, negative lean angle, (b) PT-2, positive lean angle, (c) PT-3, no blade lean, (d) PT-4, No blade lean.
Energies 13 05269 g017
Figure 18. Diagram explaining the reason of backflows at runner inlet in four pump-turbines: (a) PT-1, (b) PT-2, (c) PT-3 and PT-4.
Energies 13 05269 g018
Figure 19. Differences of blade leading edge diameters of the four pump-turbines: (a) PT-1, (b) PT-2, (c) PT-3, (d) PT-4.
Energies 13 05269 g019
Figure 20. Lean angle of blade leading edge and inlet diameter of CT. (a) Inlet lean angle and (b) inlet diameter.
Energies 13 05269 g020
Figure 21. Histories of the macro parameters of CT during runaway processes.
Energies 13 05269 g021
Figure 22. The variations of normalized radial velocity vr of three monitor points in CT.
Energies 13 05269 g022
Figure 23. Flow patterns at the runner inlet of CT.
Energies 13 05269 g023
Table 1. Main parameters of the four pump-turbines and a turbine.
-Specific-Speed ns (m·kW)Rated Head Hr (m)Rated Output Nr (MW)Diameter of Runner Inlet D (m)Height of Runner Inlet b0 (m)Relative Runner Inlet b0/D (-)Number of Runner Blades (-)Inertia of Rotating Parts GD2 (×107 kg·m2)
PT-1219.8105.81395.231.120.21471.092
PT-2189.8195.03065.260.790.15091.092
PT-3114.1510.03063.820.340.08991.092
PT-490.2655.03574.230.300.07191.092
CT148.4183.54666.01.080.180161.092

