5.1. Influence of Heat Accumulation on the Heat Pump’s COP and PV Energy Self-Consumption
The term self-consumption ratios is used many times in this article. The coefficients are determined for a period of one day,
, (Equation (1)), one month,
(Equation (2)) and, similarly according to Equation 2, for work days,
, free days,
, season,
, year,
, and whole period of work,
.
The authors have also used the concept of cumulative coefficient of self-consumption ΦC. The definition of this is analogous to Equation (2), given the fact that it is calculated in a stepwise fasion, e.g., from the beginning of the period. The coefficient was also calculated selectively for work days and free days.
The calculated average daily COPs depend on the average daily outdoor temperature, and are shown in
Figure 12. They are classified into the heating and summer seasons, and work and free days. A regression line was added for each data series, only to highlight the differences in trends. As can be seen, energy accumulation on work days reduces the average COP factor.
The self-consumption ratios calculated for each day of the year 2019 were grouped into months and presented in
Figure 13. A typical drop in the coefficient was obtained as the energy generated by the PV increased. A large dissipation of its values is noticeable. The benefits of cooling in the summer approximately double the self-consumption.
Subsequently, the data were grouped into work and free days. Then, a power type trend line was determined for each group. The results in the form of graphs are shown in
Figure 14. The calculated average difference in self-consumption between regression curves is about 11% in the energy range from 0.5 kWh to 27 kWh. These are only approximate calculations, but they clearly indicate the impact of the heat accumulation on self-consumption.
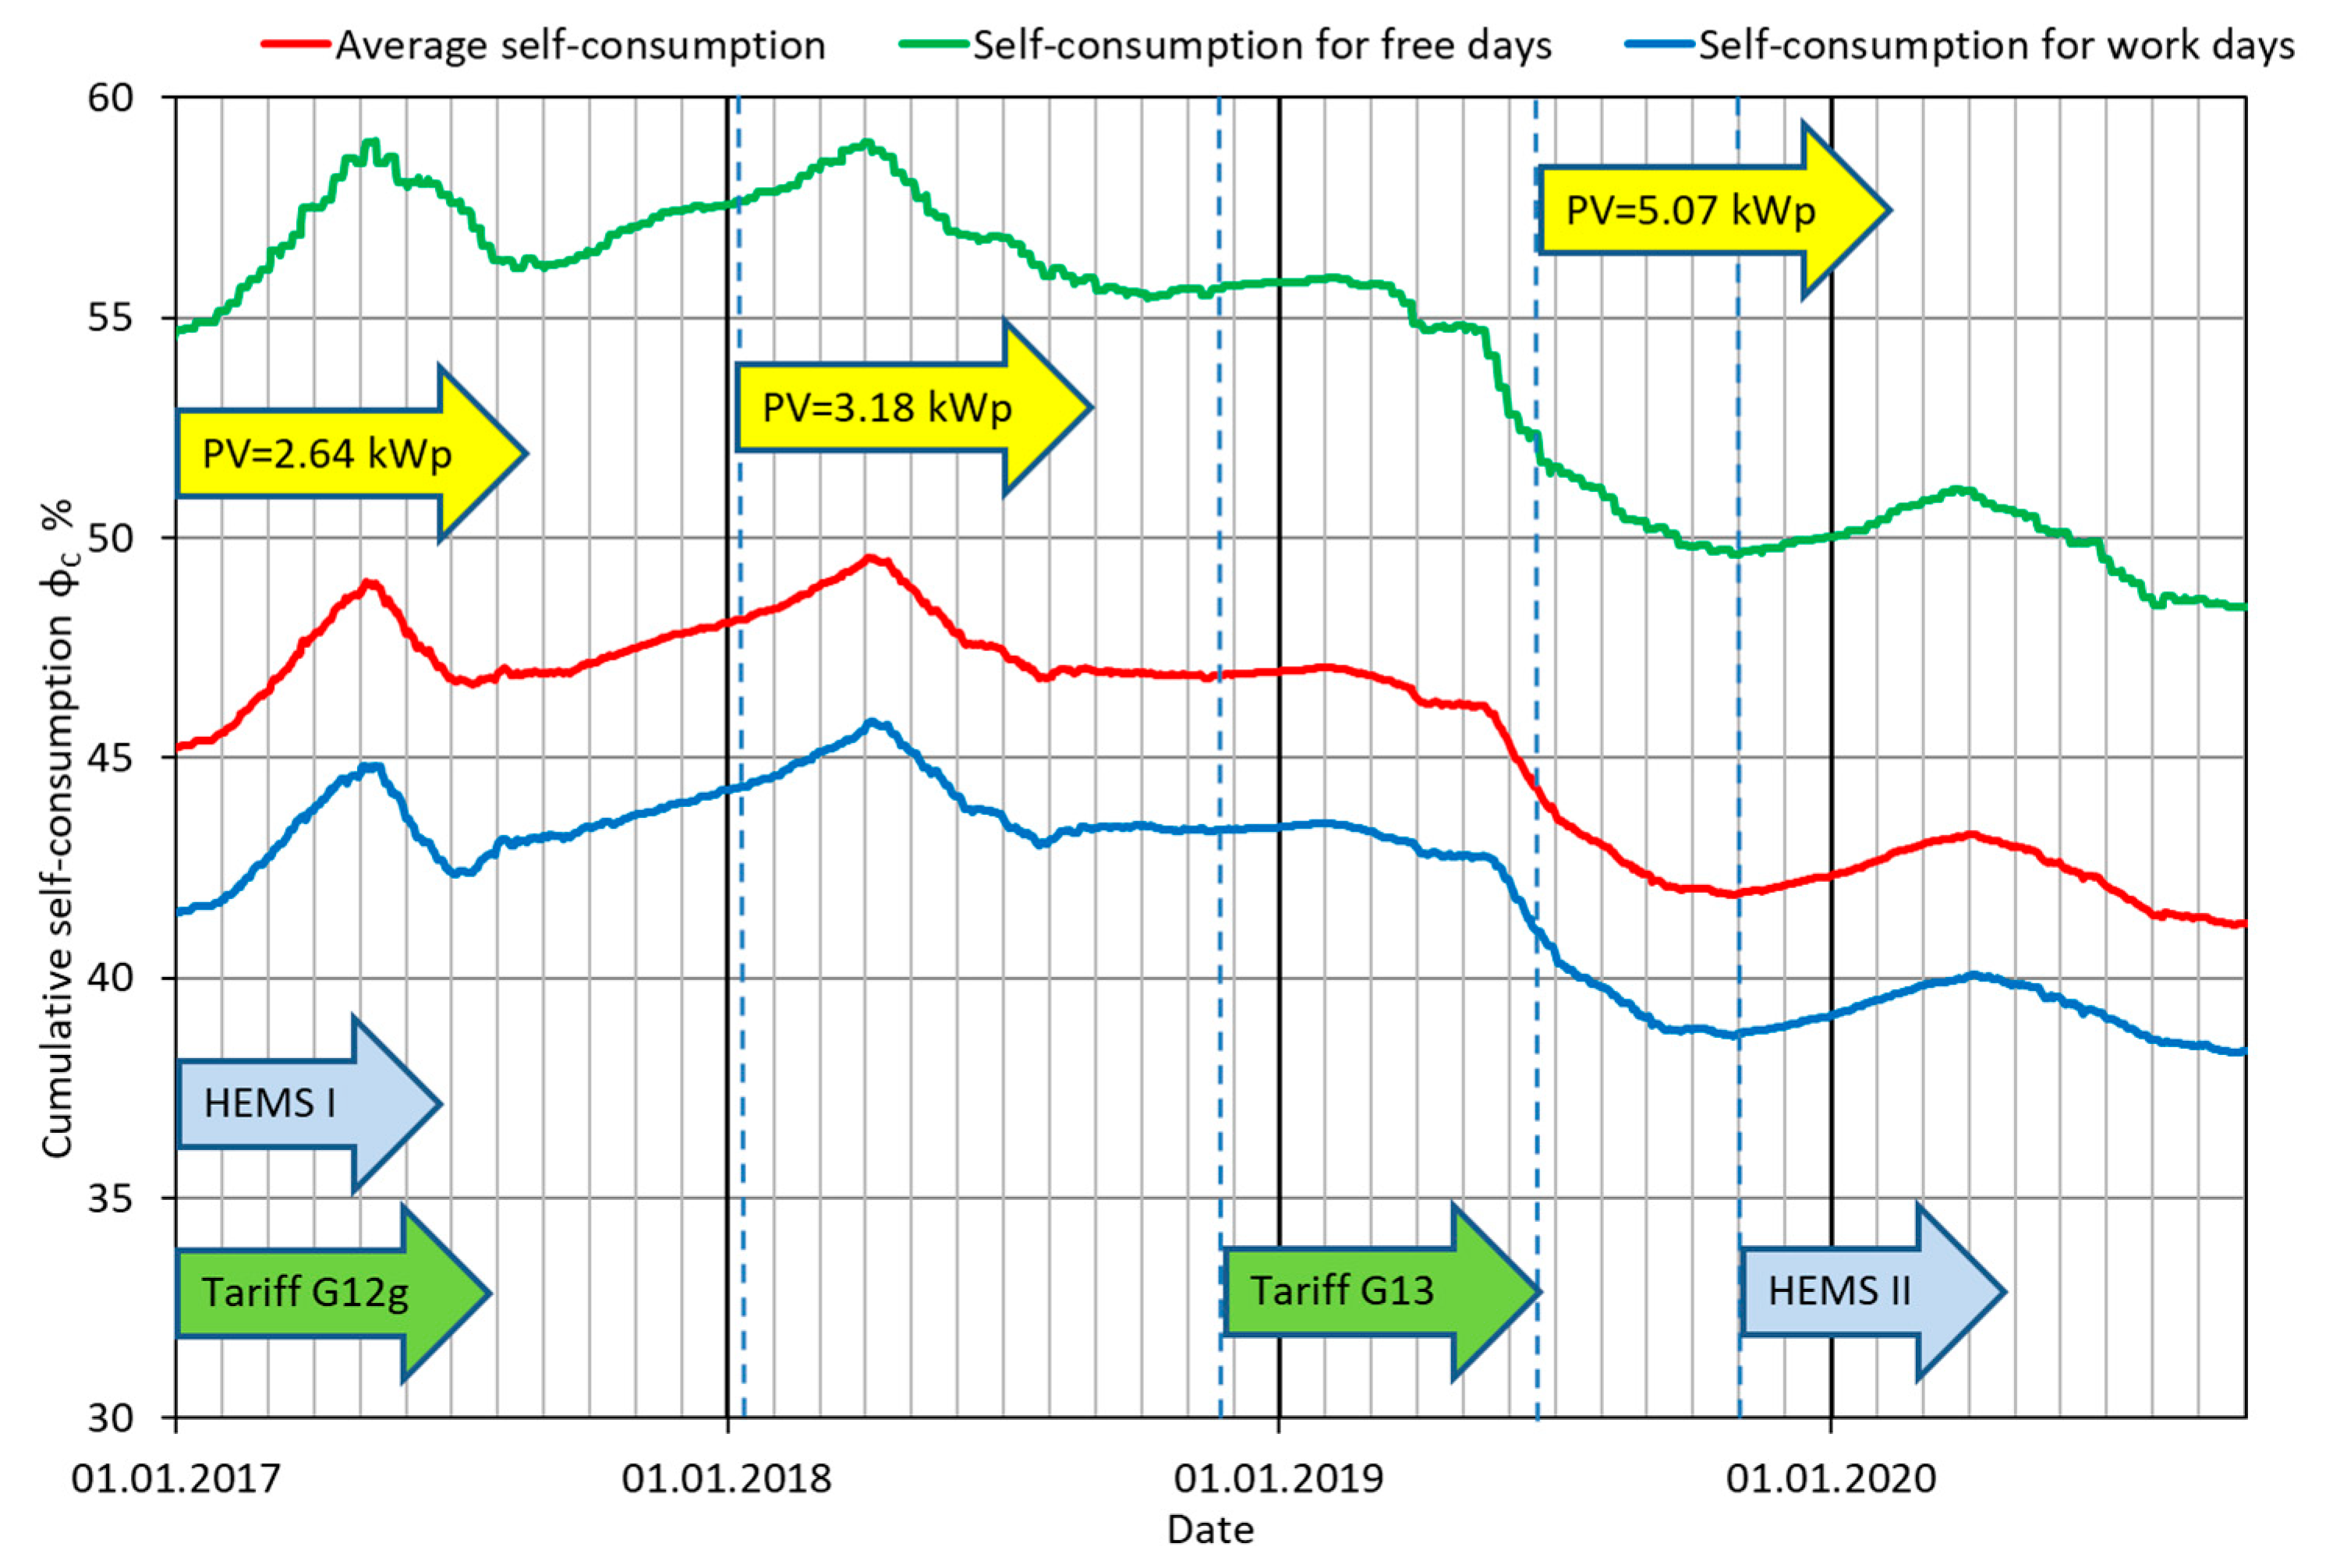
Cumulative year self-consumption charts (
Figure 15) were separately prepared for each year. The indicators on the timeline show the PVS build-up moments. The value of the self-consumption at the end of the year corresponds to its average annual value. A visible drop in value for each subsequent year is due to an increase in the PV power, and is indicated in publications [
12,
13].
Figure 16 shows the cumulative relative energy consumption since the beginning of the PVS operation; it shows even better all the changes that were made. It also shows the cumulative self-consumption on free and work days. In 2019, it points out the lack of increase in self-consumption in the first 3-4 months of the year (due to a different algorithm in the energy meter), and its sudden drop after the installation of additional PV power. In October of 2019, the new version of HEMS was introduced to increase the self-consumption, which increase is shown in
Figure 15 and
Figure 16.
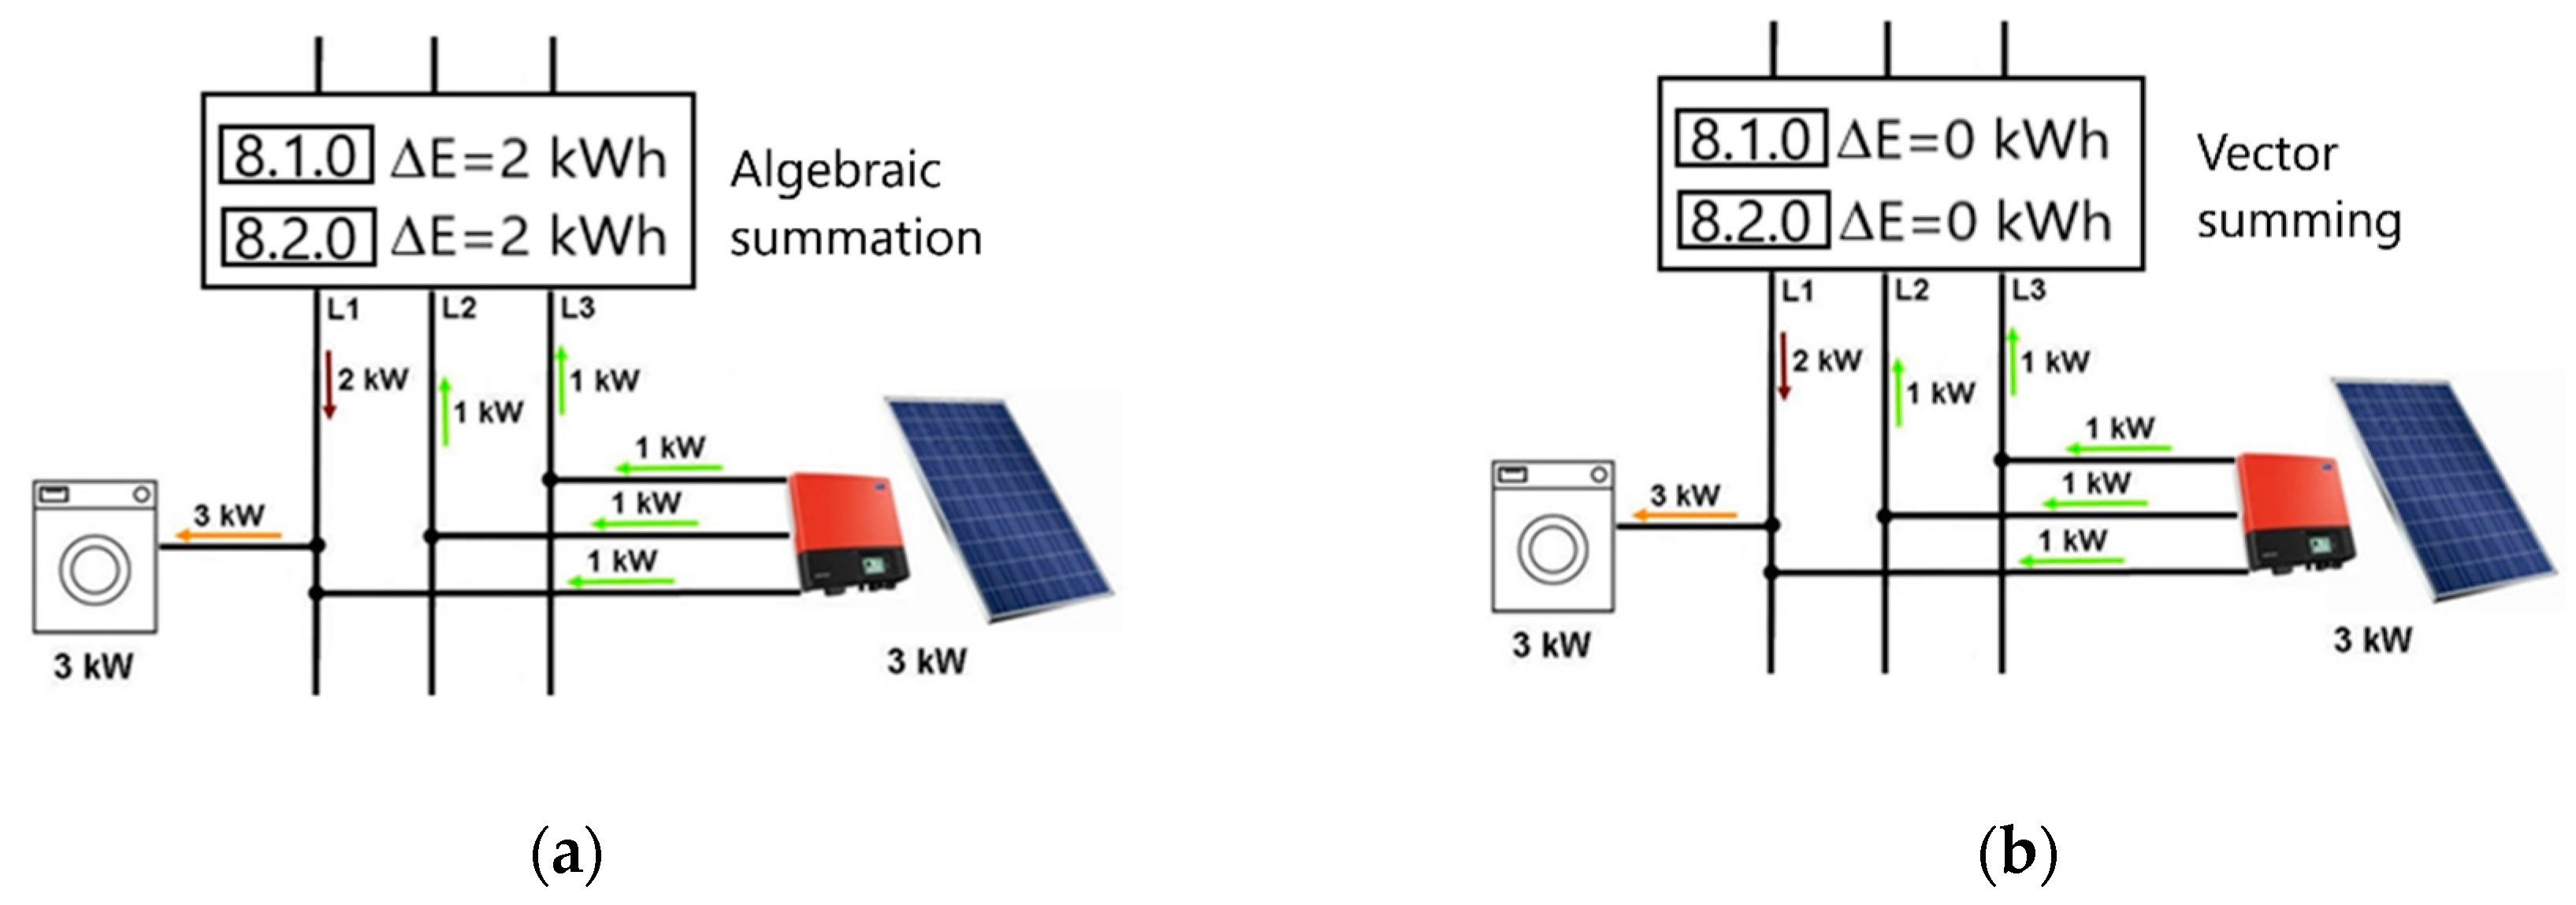
The new function allows for the control of the direction of energy flow on each phase, and switches the loads between phases so as to prevent simultaneous energy flow in both directions. Thanks to this, as long as there is enough energy from the PVS to power all the equipment in the building, it is not taken from the grid. As a result of use of the HEMS, the self-consumption here is greater than in 2019, although the energy meter still operates in the algebraic summation mode. The new operation of the HEMS will not be presented in this article, but only mentioned, pointing to its potential to increase self-consumption.
Table 6 presents the calculated average COP values, average temperature and average self-consumption for the whole year, split into work and free days.
Table 7 also presents the same parameters calculated separately for both seasons. In the analyzed year, the average COP was 3.14 and the average outdoor temperature was 10.4 °C. These values can be considered representative, although the average 10-year outdoor temperature for this location is 10.0 °C, whereas it has already been 10.6 °C for the last 5 years [
28].
During the heating season, heat is mainly generated for heating needs, and although the outdoor temperatures are lower, the average COP reaches lower values in summer (COP = 2.97) than in winter (COP = 3.23), at the average annual COP = 3.14. In case of the AWHP, it is normal that the average COP in the summer is lower than in the heating season.
The calculated COPs are higher without heat accumulation in the heating season by 11.5% and in the summer only by 4.8%. These are significant differences, but the economic benefits of using heat storage leave no doubt as to its purpose.
Generally, heat accumulation lowers COP and self-consumption, and this increases energy consumption, but shifts the load into a zone of cheaper energy pricing. In annual terms, self-consumption is on average higher by 9.5%, being 8.7% higher in the summer and 13.5% higher in the heating season. The average annual self-consumption ratio on free days is 41.2%, while in the heating season it is 55.7%, and it is 37.7% in the summer season. The energy management in the building was adjusted to minimize the building’s operating costs, rather than to maximize its self-consumption energy from the PVS.
5.2. The Economic Effects of Heat Storage
Several indicators can be used to assess the profitability of investments, considering inflation and rising energy costs. To simplify considerations, the heat accumulation costs are included as amortization, which is added to the current costs during the lifetime.
Table 8 shows the annual energy quantities exported, imported, and generated from the PV, including the energy used in the building over the 3 years. In addition to the self-consumption ratio, the self-sufficient ratio is also given. This is defined as the sum of the self-consumption of energy from the PV and the energy recovered as a rebate relative to the energy consumed in the building. In 2019, it was 35%. Based on the data from
Table 8, and the energy costs (as decided by the President of the Energy Regulatory Office [
29]) given in
Table 9 for the analyzed tariffs, the cost of energy use in the building was calculated, and is presented in
Table 10.
The question that arises is whether it is worth using multi-zone tariffs in Poland. If the energy from PV meets the annual needs, the choice of tariff is determined by fixed energy costs. If this is not the case, then the choice of tariff is important.
At the beginning, the costs were calculated if only the tariff was changed to G11, but without changing the control of the HS. The results are shown in
Table 11. The savings with multi-zone tariffs G12g and G13 increase with the power of the PV installations. They would reach 75% in 2019.
However, the accumulation is not necessary when using a single-zone tariff. As shown earlier, heat accumulation lowers the COP HP and reduces the self-consumption of energy from the PV. So is it worth investing in heat accumulators and choosing a multi-zone tariff? To determine this, calculations were made. It was assumed that if the G11 tariff was used, the self-consumption and COP would be the same as in the days without heat accumulation.
The calculations were made for 2019 only, because the analysis showed that only in that year were the export and import of energy on the days with and without accumulation similar (see
Table 1 and
Table 2).
In the first step, the amount of energy consumed was calculated, taking into account the change in COP and
—the share of energy consumed by the PC for heat generation for the needs of heating and DHW. The calculations were made separately for both seasons,
, and for each of the time zones,
, of the tariff G13.
In the second stage, the amount of imported energy was corrected due to the fact that the self-consumption rate is higher given unnecessary heat accumulation. To calculate energy exported,
, in each of the tariff time zones,
, of the G13 tariff, the energy generated from the PV in these zones was first calculated using Equation (4):
Then, formula (5) calculated the energy exported if tariff G11 was used, assuming the self-consumption ratio for free days,
.
In the last step, imported energy was calculated according to Equation (6).
The sum of energy for each period was calculated, and their comparison with the measurements for the G13 tariff are shown in
Table 12.
As expected, the amount of energy consumed would be lower if the G11 tariff was used. However, this small increase in energy consumption (by 317 kWh) cannot compensate for the cost of energy (
Table 13), which was much lower in the G13 tariff.
The building maintenance costs would be 47% higher if the G11 tariff was used. The calculated energy costs would be 71% higher if there was no PV installation. The decision to invest in the HB and the larger DHWB, made many years ago, was positively verified.


