Review

Effects of Fluid Viscosity and Two-Phase Flow on Performance of ESP

1
CNPC Key Laboratory of Oil & Gas Storage and Transportation, China University of Petroleum, Beijing 102249, China
2
China Petroleum Engineering & Construction Corporation Southwest Company, Chengdu 610094, China
*
Author to whom correspondence should be addressed.
Energies 2020, 13(20), 5486; https://doi.org/10.3390/en13205486
Submission received: 22 September 2020 / Revised: 10 October 2020 / Accepted: 12 October 2020 / Published: 20 October 2020
(This article belongs to the Section I: Energy Fundamentals and Conversion)

Abstract

:
Electric submersible pumps (ESPs) are widely used in the oil and gas industry for crude-oil lifting, especially in subsea oil fields or underground storage caverns. The failure of ESPs causes a large economic cost mainly attributed to a break in production continuity, as the ESP cannot be easily replaced. Therefore, the assurance of safe and efficient operation of ESPs has attracted high attention in recent years, although the problem still remains challenging given the complexity of carrying fluid and the mechanical structure of the ESP. In this article, we systematically review both the high-impact, classic contributions and the most up-to-date, current opinions in experimental and numerical advances of viscous effects and two-phase flow in ESPs. We specifically focus on the applications in the oil and gas industry and point out a few current challenges in the operation of ESPs. We aim to guide the audience which is new to the area of ESPs to the correct articles related to their interests, including classic work and recent advances.

Graphical Abstract

1. Introduction

With rapid development of the world economy and continuous exploitation of land resources, much attention has been paid to offshore oil fields. Oil in gusher wells can be extracted with natural power. For commonly existing low-pressure wells, however, artificial lift methods are usually needed, such as gas lifts [1], progressive cavity pumps [2], and electric submersible pumps (ESPs) [3]. Unlike rod pumping, ESPs can be employed without gas wells nearby and conveniently coupled with electrical motors, which, together with their small footprint and high energy efficiency [4], make them widely used in subsea oil field development.
The electric submersible pump oil production system is composed of aboveground and underground parts, as shown in Figure 1a. Usually, aboveground parts of ESP consist of a switchboard, junction box, wellhead, etc., while underground parts contain a motor, protector, separator, and pump. The motor is the prime motion-generator of the system, which is generally located at the bottom. The protector lays in the middle to isolate well fluid from motor oil. The main role of the separator is to reduce the gas volume fraction inside the pump. There are tens or even hundreds of stages in a pump and each stage consists of an impeller (Figure 1b) stacked under a diffuser (Figure 1c). When working, blades in impellers rotate at high speed, contributing to an increase in fluid pressure and velocity. The kinetic part of fluid energy is further converted to fluid pressure through the diffuser before the fluid is directed to the next stage. Eventually, the fluid pressure can be greatly elevated through fluid flow past multiple stages in series.
For different flow directions, centrifugal pumps are classified as axial, radial, and mixed flow pumps. Typically, radial and mixed flow pumps are selected for ESPs for their larger head. For lighter application when the flow rate is less than 3000 barrels per day (bpd), radial flow pumps are suitable. On the other hand, mixed flow pumps are typically used for a large capacity of up to 40,000 bpd. For all ESPs, stable operation and lifespan assurance are vitally important in reducing the economic cost during production, as the operating environment of ESP can be inaccessible and harsh. For instance, the maintenance cost of a pump under deep sea is up to 40 times that of setting up a new pump [5].
Factors that influence pump operation and performance include flow rate, rotational speed, pump geometry [6], and oil viscosity [7,8,9,10,11]. The flow rate and rotational speed are subject to operation conditions and relatively easy to control. The pump geometry, which also has a large influence on pump performance, however, needs to be taken into account in advance. The structure of ESPs can be increasingly sophisticated due to the interactions between stages, especially when a larger number of stages are introduced to gain a larger pressure head. For flow rate, rotational speed, and pump geometry, the affinity laws can be applied under various conditions in general. However, the viscous effect, which alters with the change in specific speed and rotational speed, is difficult to predict analytically with a general form.
The possible generation of two-phase flow in ESPs from the appearance of bubbles and particles can cause damage to critical parts of the pump, especially under certain working conditions like high pressure drop and heavy fluid medium. When the pressure drops below the bubble point pressure, cavitation appears and damages the pump’s critical parts. Furthermore, some fine sands in the mining process can flow through the pump channels with the fluid, despite the presence of filtering equipment. The problems that solid particles give rise to are not only pressure loss, but also wear damage, which could lead to vibration and even the failure of facilities. When bubbles and particles both appear in ESPs, the flow pattern is difficult to predict accurately [12,13].
Therefore, the effects of fluid viscosity and two-phase patterns have attracted much attention in recent years, and there were numerous studies on these problems, using three approaches: (1) experimental, phenomenological, or empirical curves/coefficients that are more practical in reality and engineering; (2) analytical or semi-empirical approaches; (3) computational fluid dynamic simulations.
To understand the effects of fluid viscosity and two-phase flow on ESP performance, various experimental tests on different operation conditions were conducted to achieve empirical coefficients, which were combined with analytical equations and semi-empirical formulas to explain pump performance. Meanwhile, with the development of computational fluid dynamics (CFD) and relevant commercial software, the method of numerical simulation, which has advantages of convenience and accuracy, is widely becoming a routine technique after verification from experimental results, although the high cost of calculation resources and time can sometimes become a problem depending on the complexity of geometry [6]. Moreover, the simulation results of a pumping head are usually higher than that from experimental data, owing to neglecting the leakage of clearance between impellers and diffusers.
Given the complexity of these approaches, we present this review to guide our audience to the proper references according to their specific needs without being overwhelmed by the pool of literature. This review covers two topics: viscous effects and two-phase flow in ESPs; under each category, the references are categorized as experimental or numerical analysis. The criteria used for selecting references was as follows: we first included the key classic references on the basis of our knowledge and experience, and we searched for articles most closely related using the keywords “ESP” and “performance curve” before refining our search results using the keywords “viscosity effects”, “particles”, “bubbles”, and “flow mechanism”. We then selected the higher-impact, classic contributions and the most up-to-date, novel results for the current framework of the review article to systematically evaluate the experimental and numerical advances in the study of viscous effects and two-phase flow in ESPs. Note that the effects of corrosive wear in the ESP are not covered in this review, as we focused on the applications in the oil and gas industry, specifically, when crude oil is the carrying fluid. In this case, corrosive damage is usually not as important as erosion/abrasion.

2. Viscous Effects

A pump’s performance is evaluated by its head, power, and efficiency at a certain flow rate. Usually, suppliers provide the performance curves of pumps with water handled. In working conditions, however, the pump is submerged under crude oil or another heavy fluid, which have much larger viscosity. It was shown that high fluid viscosity clearly results in a degradation in pump performance (Figure 2) by reducing head and efficiency and by increasing power consumption. In particular, Stepanoff [14] found that the centrifugal pump performance at the best efficiency point (BEP) is degraded at constant specific speed. Nevertheless, the flow rate and viscosity of fluid in ESPs can change substantially in a short time under operational conditions. Solano [15] then confirmed that this approach is also applicable under off-design conditions when proper dimensionless numbers are chosen.
To understand the effects of viscosity on pump performance, several ESP tests [7,8,11] were conducted. According to the experimental data of fluid with different viscosity, empirical coefficients [14,17] are given to guide pump operation. For comparing various pumps, dimensionless analysis is also an effective method. Fitting and correcting cannot explain the flow phenomenon in ESPs from the mechanism. Therefore, conservation equations of mass, momentum, and energy need to be solved to understand the flow pattern. Considering the flow rate and geometry parameters in ESPs, various turbulent flow equations are employed. After choosing a proper model in Computational Fluid Dynamics (CFD) commercial software, the distribution of related physical parameters such as velocity and pressure can be obtained through iterative computations, which can then be utilized to illustrate the flow feature.
In this section, researches on pump performance curves when pumping high-viscosity fluid are introduced. In order to understand the viscous effect, many experiments and numeric computations [7,8,9,10,11] were carried out. With respect to flow pattern and pressure loss, the mechanism of the viscosity effect behind performance is explained to some extent. In addition, the effects of fluid viscosity in multistage ESPs are briefly mentioned, although their thorough understanding remains challenging.

2.1. Performance Curves

The best indicator of pump behavior is achieved by evaluating the shift in the performance curve. To acquire a typical performance curve, four important factors (flow rate, head, power, and efficiency) are usually rendered dimensionless as a flow coefficient, head coefficient, power coefficient, and efficiency coefficient.
ϕ = Q ω D 2 3 , ψ = g H ω 2 D 2 2 , Π = ω Γ ρ ω 3 D 2 5 , η = ϕ ψ Π
where ϕ is the flow coefficient, ψ is the head coefficient, Π is the shaft power coefficient, η is the pump efficiency, Q is the volumetric flow rate, ω is the angular speed, D 2 is the impeller outlet diameter, g is gravitational acceleration, H is the head, Γ is the torque, and ρ is the fluid density. Three curves ( ψ vs. ϕ , Π vs. ϕ , and η vs. ϕ ) were drawn through several experiments to evaluate performance under different operation conditions for each type of pump [18].
When the viscosity of pumping fluid is much higher than that of water, performance curves deviate from the reality. The Hydraulic Institute Standard [17] provides correction factors for different fluid viscosities on the basis of empirical parameters from experiments. These results are sometimes questioned because the pumps’ specified speed in their experiments is limited to only a small range [19]. The influence of specific speed on head, power, and efficiency is plotted in Figure 3, as the trends of these parameters with respect to capacity (flow rate) can change with specific speed. For a larger specific speed, the power no longer increases with capacity.
When pumping fluid with higher viscosity, Reynolds numbers for ESPs decrease to the hydraulic transition zone. Thus, dimensionless numbers according to both specific speed and Reynolds number can be used. With constant Reynolds numbers, dimensionless head or efficiency curves overlap, in spite of different viscosities and rotational speeds. Morrison et al. [21] added a rotational Reynolds number ( Re w = ρ ω D 2 2 μ ) to understand pump performance ( μ is dynamic viscosity), They proposed a new variable ϕ Re w M o to establish the relationship with ψ . Here, exponent M o is known as the Morrison number which is related to pump design.
The performance curve for a specific pump can be drawn using CFD or experimental techniques. According to simulation results, the best efficiency point shifted to lower flow rates with increased viscosity. In other words, a pump with higher flow rate was needed. The study combined the viscosity effects at different specific speeds and provided a simple tool to predict pump performance. However, the research was based on results, and there was little explanation of a mechanism.
Patil [22] refined Morrison’s study and gave an analytical form of the Morrison number.
M o = { ( N s 20000 + 0.2698 ) * Re w ( N s 50000 0.11 ) M o M o max ( N s * 10 6 0.0008 ) * Re w ( 8 * 10 5 * N s + 0.5474 ) M o > M o max ,
where N s is the specific speed. As shown here, Morrison’s number is function of both specific speed and rotational Reynolds number. When the specific speed is a constant, Morrison’s number increases with increasing rotational Reynolds numbers until the peak M o max , which depends upon the specific speed. For larger Rew, the Morrison number attains the peak and then gradually reduces to a value of around 0.052. The sharp change in Morrison number reveals a transition of flow regime, which can be used to explain the decrease in pump head for larger-viscosity fluid to some extent. However, it is not adequate to explain the effects of viscosity on the power and efficiency, as the relationships among Π , η , and ϕ Re w M o are not yet clear.
Another method for predicting the viscous effect for different pump geometries is normalization. With dimensionless numbers, normalized groups are utilized according to design operation parameters. Ofuchi et al. [16] compared curves between constant normalized Reynolds numbers and constant normalized specific speeds. The effects of viscosity on the head curve degradation can be seen for both comparisons, but the degradation trends for different pumps match only for the latter. A general correlation ( ϕ n ϕ n , ω = [ ψ n ψ n , ω ] 1.5 ) between head and flow coefficient was proposed, which can be directly used to predict performance degradation without major geometry parameters. Here, ϕ n and ψ n are the normalized specific flow rate and head at a given rotational speed and fluid viscosity, whereas ϕ n , ω and ψ n , ω are the normalized specific flow rate and head at the design rotational speed with water.
Dimensionless analysis is a simple and effective method to consider the viscous effect and predict pump performance. However, it cannot explain why degradation happens. Thus, research on the flow pattern and pressure loss was conducted to understand the mechanism.

2.2. Flow Mechanism

Under operating conditions, the flow rate and viscosity of fluid may vary greatly in a short time. Pump performance in reality is likely to be degraded compared to that at BEP. In order to investigate the viscous effect in practical application, Amaral et al. [8] carried out experiments with glycerin, the viscosity of which varies within the viscosity range of crude oil. Simultaneous changes of fluid viscosity and pump speed were revealed, and related experimental results showed large deviations from data at BEP that HI-USA-charts provided. By assessing the head gain and comparing the pressure difference, the interaction between impellers and diffusers was proposed as the reason for the viscous effect and was not negligible in the theoretical calculation. The experimental data for various operation conditions were precious for following research, and the conclusion provided a direction for specific CFD simulations.
The flow field pattern in mixed flow pumps (Figure 3) is complex to understand even for single-phase operation. Thus, CFD simulations are commonly carried out. Specific steps include geometry creation, mesh generation, model selection, condition setting, and iterative computation. For the flow pattern in ESPs, the selection of turbulence model plays a key role. To acquire solutions with adequate accuracy within an acceptable period of time, the Reynolds average Navier-Stokes (RANS) equations were widely employed in CFD solvers in recent studies [9,10,23]. Due to the inclusion of the Reynolds stress term, it is necessary to add complementary equations. Several turbulence models, including standard k-ε, RNG (renormalization group) k-ε, standard k-ω, BSL (baseline) k-ω, and SST (shear stress transport) k-ω, are usually used. Most times, there is no large difference between numerical results using any of the above models for pump head. However, for part-load operation, the SST k-ω model is usually preferable as it can recover the appearance of separation zones while other models cannot. On the basis of this model, Stel [9] and Ofuchi [10] conducted much research on the viscous effect.
However, the sudden rising head effect was observed [24], which means that the pump head increases a little with higher fluid viscosity. Li [23] found this phenomenon to disappear with the SST k-ω model in CFD simulations. When the standard k-ε is employed instead, the effect reappears. The wet surface roughness was found to be related, and skin friction factors were defined as key parameters. In the hydraulic transition zone, the skin friction factors decrease with lower Reynolds numbers, resulting the sudden rising head. Providing the occurring condition of rough wet walls, the SST k-ω model may be improper. Thus, turbulence models need to be compared with experimental results under special circumstances.
Further researches were conducted for pressure loss due to viscosity. Various losses (Figure 4) in ESP stages were defined [25]. Pump head is influenced by hydraulic loss, disc friction, leakage, and so on. The hydraulic loss involves friction losses in the flow paths in the impeller and diffuser. The disc friction represents loss effects between impellers and diffusers. In addition, the influence of leakage is inevitable and should also be noted. The model is claimed to be applicable for various fluid properties, rotational speeds, and pump types. Sun [26] established a one-dimensional analytical model for an ESP channel to achieve boosting head. In this work, the hydraulic friction and shock loss were taken into account. Vieira [27] combined several definitions of pressure loss via theoretical calculation to study the effects of viscosity in a single stage of an ESP. The dominant factors considered were the impeller friction and disc friction losses. However, different combinations of parametrizations were needed for each flow case, due to the complexity of viscous effects. There was no general combination form that could explain all ESPs. With a two-dimensional laser Doppler velocimeter (LDV), Li [7] also concluded that increased hydraulic loss and the disc loss were dominant factors. Furthermore, pressure changes between impellers and diffusers for various viscosities were observed [11] to be quite close. In consideration of the strengthened recirculation due to flow regime transition, Zhu et al. [20] proposed a mechanistic model to predict pump performance. On the basis of conventional Euler equations and known losses, the recirculation loss was introduced to the model. With the Tulsa University Artificial Lift Projects (TUALP) database, it was validated to be applicable for several types of pumps. Knowing related coefficients, the boosting pressure is not hard to get. Thus, more accurate coefficients and better closure relationships could contribute to the improvement.
There exist some special phenomena in multistage ESPs. Stel et al. [9] used CFD simulations to explore average and transient flow features in a multistage ESP. Numerical results for a single-stage ESP are considered not convincible because the flow is heavily influenced by boundary conditions. Basically, the first stage has its own uniqueness relative to the following stages. Considering that the flow medium is water, pump performance with a high-viscosity fluid is even more complicated.
Ofuchi et al. [10] also analyzed the interaction between stages and the effects of a previous stage on the upstream flow, with a numerical study on three stages of a mixed-type ESP. The pressure head curve of the first stage was saddle-shaped, which was greatly different from the following stages. As viscosity increased, this effect was weakened. In general, the first stage provides a higher head compared to other stages. In addition, separation zones appear near the second and third impeller trailing edges when the rotational Reynolds number is lower. As the fluid is viscous enough, the separation zones are yet smoothed out. The first stage is likely to vary in performance and flow pattern on different operating conditions, as Stel concluded. The main reason is that the turbulence generated inside the impeller spreads to the diffuser and the backflow of the diffuser affects the following stages. The ESP geometry used in the numerical model was the same as that used by Amaral. Thus, the computational results agreed with related experimental data. However, the effects of pump geometry were not taken into account, which is also an important factor.
In terms of ESP performance degradation caused by high viscosity, classic and up-to-date researches are summarized in Table 1. Key findings, drawbacks, and assumptions are listed in the overview column.
As stated above, pump performance degradation would appear when fluid viscosity is high. The initial response is to give empirical coefficients for correction. This includes not only experimental fitting but also theoretical dimensionless analysis. Under operating conditions, pump performance is much harder to predict. In order to find major sources, various definitions of pressure loss and analytical models were then proposed. Increased hydraulic loss and disc loss between impellers and diffusers were finally thought to be dominant factors. However, the flow pattern in ESP channels is not yet achieved and the mechanism is not completely clear. With CFD simulations and experimental tests combined, the problem can be better solved. In addition, phenomena in multistage ESPs are much more complicated and difficult to explain. At present, improvement of the affinity laws is made on the basis of large amounts of CFD simulation results. It decreases the time cost to use simulations rather than experiments. Significantly, CFD models often oversimplify the geometry by using assumptions related to factors such as leakage. There is a long way to go before the simulation results are completely consistent with reality. The single-phase flow model is the basis of multiphase flow calculation, which is also necessary because of the existence of bubbles and particles in fluid.

3. Two-Phase Flow in ESPs
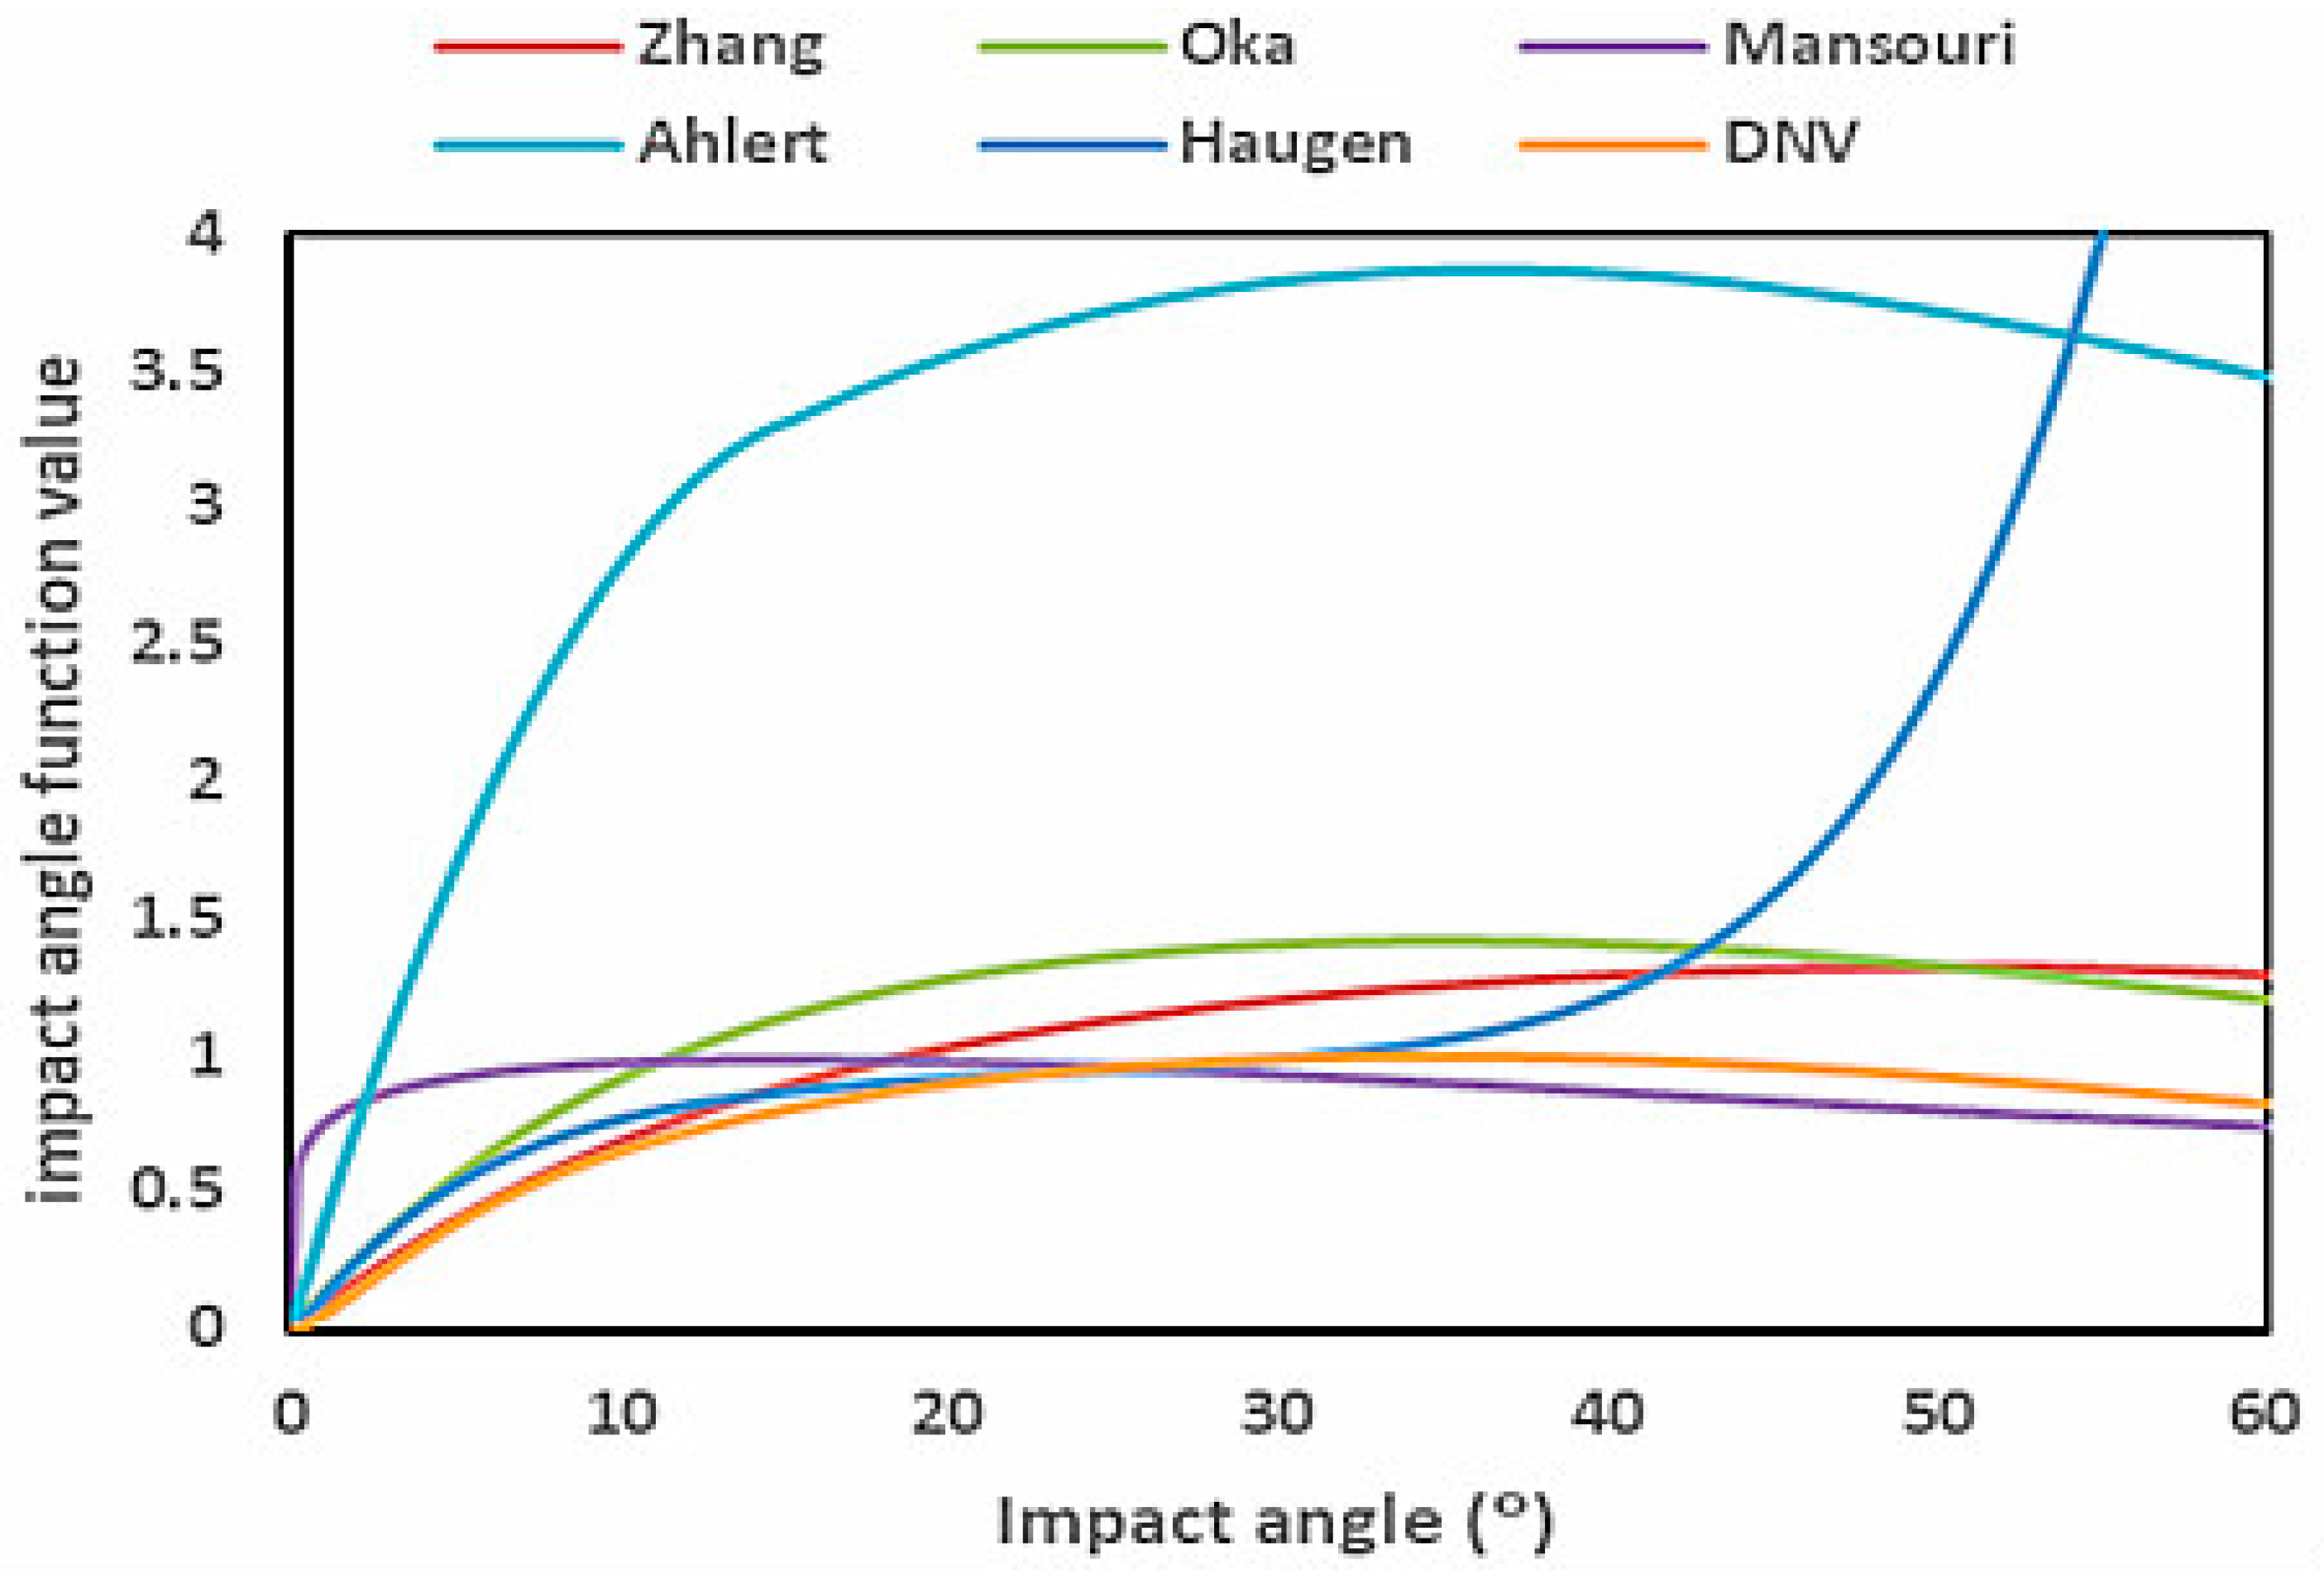
Influenced by a bad operating environment, fluid in ESPs usually contains other components. If insoluble impurities exist or sand particles are mixed during production, solid-liquid two-phase flow would appear in the pump. If pumped liquid contains gas, gas-liquid two-phase flow arises. When both are included, gas-solid-liquid three-phase flow comes into being, which is the difficulty in current research. Common ESPs are applied with high flow rate and low gas content in subsea conditions [3]. Compared with radial-type pumps, mixed-type pumps are proven to have better performance with inlet gas. When the gas void fraction (GVF) is large, energy loss between phases and the gas pocket can make the pump head decrease. Studying bubble behavior with visualization equipment, experiments were carried out to understand pump performance [30]. Lots of mechanistic models were put forward to predict performance degradation. Nevertheless, some factors like pump geometry and slippage between phases were overlooked [31]. Lack of versatility is also an important reason for its difficulty to use. In view of the above problems, experimentally validated CFD simulations with bubble processing models are commonly conducted to understand the flow feature.
Analogous to bubbles, much attention was paid to performance degradation due to existing solid particles in ESPs [32,33]. Considering material and mechanistic differences between bubbles and particles, adopted methods are different. Gas-liquid flow is studied using the Eulerian-Eulerian model, which is also applicable to pressure drop calculation for solid-liquid flow because of the advantage of turbulence computation. In order to achieve particle trajectories and erosion rates, the Lagrangian particle tracking model was employed. However, the method cannot be applied for a high particle volume fraction due to the assumption that solid particles do not occupy space. Differently, Marsis [34] proposed that the discrete phase model (DPM) seems to be more sensitive to near-wall gradients and the Eulerian model may be more accurate in predicting the erosion rate.
The existence of solid particles not only reduces pump operation efficiency, but also causes some damage to pump elements. Wear in ESPs is composed of abrasive wear [35] and erosive wear [36]. According to the number of objects in contact, abrasive wear is divided into two-body wear and three-body wear. For abrasive grains between two surfaces, positions in which abrasion usually occurs are bearings, bushings, and clearances. Erosion usually occurs at the shrouds of impellers and diffusers, impeller blades, and diffuser vanes. The direct cause is the impact of solid particles. In accordance with impact angles, erosive wear includes shear wear and impingement wear, and the mechanism is different. When the angle is small, shear wear takes place, and impact in and near the normal direction leads to impingement wear. This article focuses on erosion, and abrasion is not included. It can be seen from the formation mechanism that particle velocity is a dominant factor for erosion in ESPs. Furthermore, target material properties are also important according to experience. It is known that the erosion resistance of ductile material is higher than that of brittle material. Considering related factors that influence the erosion rate, various models were proposed, including empirical equations [37,38,39,40,41,42,43] and mechanistic models [44,45,46,47,48,49].

3.1. Erosion Models

In order to predict the erosion rate, empirical equations were firstly proposed on the basis of direct impingement tests. The direct fitting method is used to consider the effects of particle velocity, impingement angle, and material hardness. The general form for predicting the erosion rate is given below.
E R = A V n f ( θ )
where ER is the erosion rate, V is the particle impact velocity, and θ is the impact angle. A and n are constants related to material properties, and f(θ) takes different forms according to material properties. For instance, for a brittle target material, the maximum value of f(θ) appears at 90°. With a ductile material, however, the maximum erosion rate occurs at impact angles of 20–40°. Different forms of functions mean different erosion mechanisms.
In the work of Ahlert [37], a particle shape coefficient Ks was further added. The value of Ks is 1 for angular, 0.53 for semi-rounded, and 0.2 for rounded particles. In addition, f is given as shown below.
f ( θ ) = { a θ 2 + b θ θ α x cos 2 θ sin θ + y sin 2 θ + z θ > α
The model provided two groups of constants for carbon steel and aluminum. For other materials, the coefficients need to be adapted.
Taking carbon steel as a brittle material, Haugen [38] adopted the form of a polynomial function for f. Unlike with direct fitting, Oka [39] used E90 as a reference erosion rate. The equations are given below.
E R = 10 9 × ρ t E 90 f ( θ ) E 90 = K ( a H ) b K 1 ( V p V * ) K 2 ( d p d * ) K 3 f ( θ ) = ( sin θ ) n 1 [ 1 + H ( 1 sin θ ) ] n 2
where ρt is the target material density, H is the target material hardness, Vp is the particle velocity, dp is the particle diameter, V* and d* are the reference velocity and diameter, a and b are constants related to material properties, and other coefficients are known constants. The model adopted the method of comparison with the benchmark erosion rate and introduced target material properties in contrast to former equations. Furthermore, a new form of f was proposed.
Zhang [40] replaced Ahlert’s impact angle function with a polynomial function and added hardness directly to the erosion equation. According to Oka’s impact angle function, Mansouri [41] drew hardness into the equation in the same way. The DET NORSKE VERITAS (DNV) model [42] extended Haugen et al.’s model for both brittle and ductile materials. The impact angle functions of different mechanistic models [33] were as shown in Figure 5. As the effects of material properties are gaining more attention lately, the method of direct fitting is a simple but not precise approach. Existing coefficients are not universal, and constants in the above models need to be determined again by experiments in special circumstances.
Gülich [43] gave another empirical prediction of erosion in pumps. The method divided the whole pump into several regions for consideration and set up coefficients for the related region. The value was determined by geometry and flow parameters. Material properties were also taken into account in the form of material factors. The entire procedure produced a simple tool to predict the erosion rate. For the roughness of influencing factors, however, the accuracy of the prediction method is not guaranteed. In addition, empirical equations can only be used for simple prediction and they cannot explain the mechanism.
Due to possible repeated impact, rebounding of particles (Figure 6) ought to be considered, and empirical equations were proposed. The polynomial function as below is a commonly used method, although different coefficients were proposed [51,52], where e is the restitution coefficient, e N and e T are the normal and tangential restitution coefficient, θ is the impact angle, and A 1 , A 2 , A 3 , A 4 , A 5 , A 6 can be found in Table 2.
e = A 1 + A 2 θ + A 3 θ 2 + A 4 θ 3 + A 5 θ 4 + A 6 θ 5 .
In order to explain the erosion phenomenon, research on the impact of a single particle and mechanistic erosion models are necessary. Finnie [44,45] firstly proposed a single-particle erosion model for ductile material. Basic assumptions during model application were that impact particles are much harder than the surface and that the surface deforms plastically. The physical condition was that a particle impacts the target surface when the impingement angle is θ. The erosion rate is given below.
E R = c ρ t p K V 2 f ( θ ) ,
where c is a nonideal particle coefficient taken as 1/2, ρt is the target surface material density, p is the surface stress, and K is the ratio of vertical to horizontal force. Similar to Ahlert, f was divided into two parts according to the angle.
f ( θ ) = { sin 2 θ 6 K sin 2 θ tan θ K 6 K cos 2 θ 6 tan θ > K 6 .
Finnie took K = 2, giving a transition angle of 18.43°. Additionally, the angle causing maximum erosion rate was 16.85° when K = 2. Although the proposal of Finnie’s model is of historical interest, the prediction results above 45° are unacceptable and hard to improve.
Extending from Finnie’s model, Bitter [46,47] combined a ductile and brittle erosion model by bringing in the concept of a threshold velocity. Erosion occurs only if the impact velocity is larger than the threshold, when the target material is brittle. The suggested threshold velocity is related to the Young’s modulus of elasticity and the Poisson’s ratios of the particle and the surface. The wear curve for brittle material is incremental and reaches a maximum at 90°, and that for ductile material is similar to Finnie’s (Figure 7). The same weakness appears whereby there is no erosion at zero impact angle, which does not correspond with reality. Afterward, Neilson and Gilchrist [48] simplified Bitter’s model to a certain extent with an adopted empirical constant. Ding [49] took repeated impact into account with the kinetic theory of granular flow. Despite some progress, the mechanism of erosion is still not fully explained.
The erosion rate is important to calculate local penetration rates of grid cells in CFD simulations. For larger deviations of mechanistic models, empirical equations are more widely employed in commercial software. However, mechanistic models are necessary to understand the phenomenon. With the help of CFD simulations, key parameters can be determined and new mechanistic models are expected.

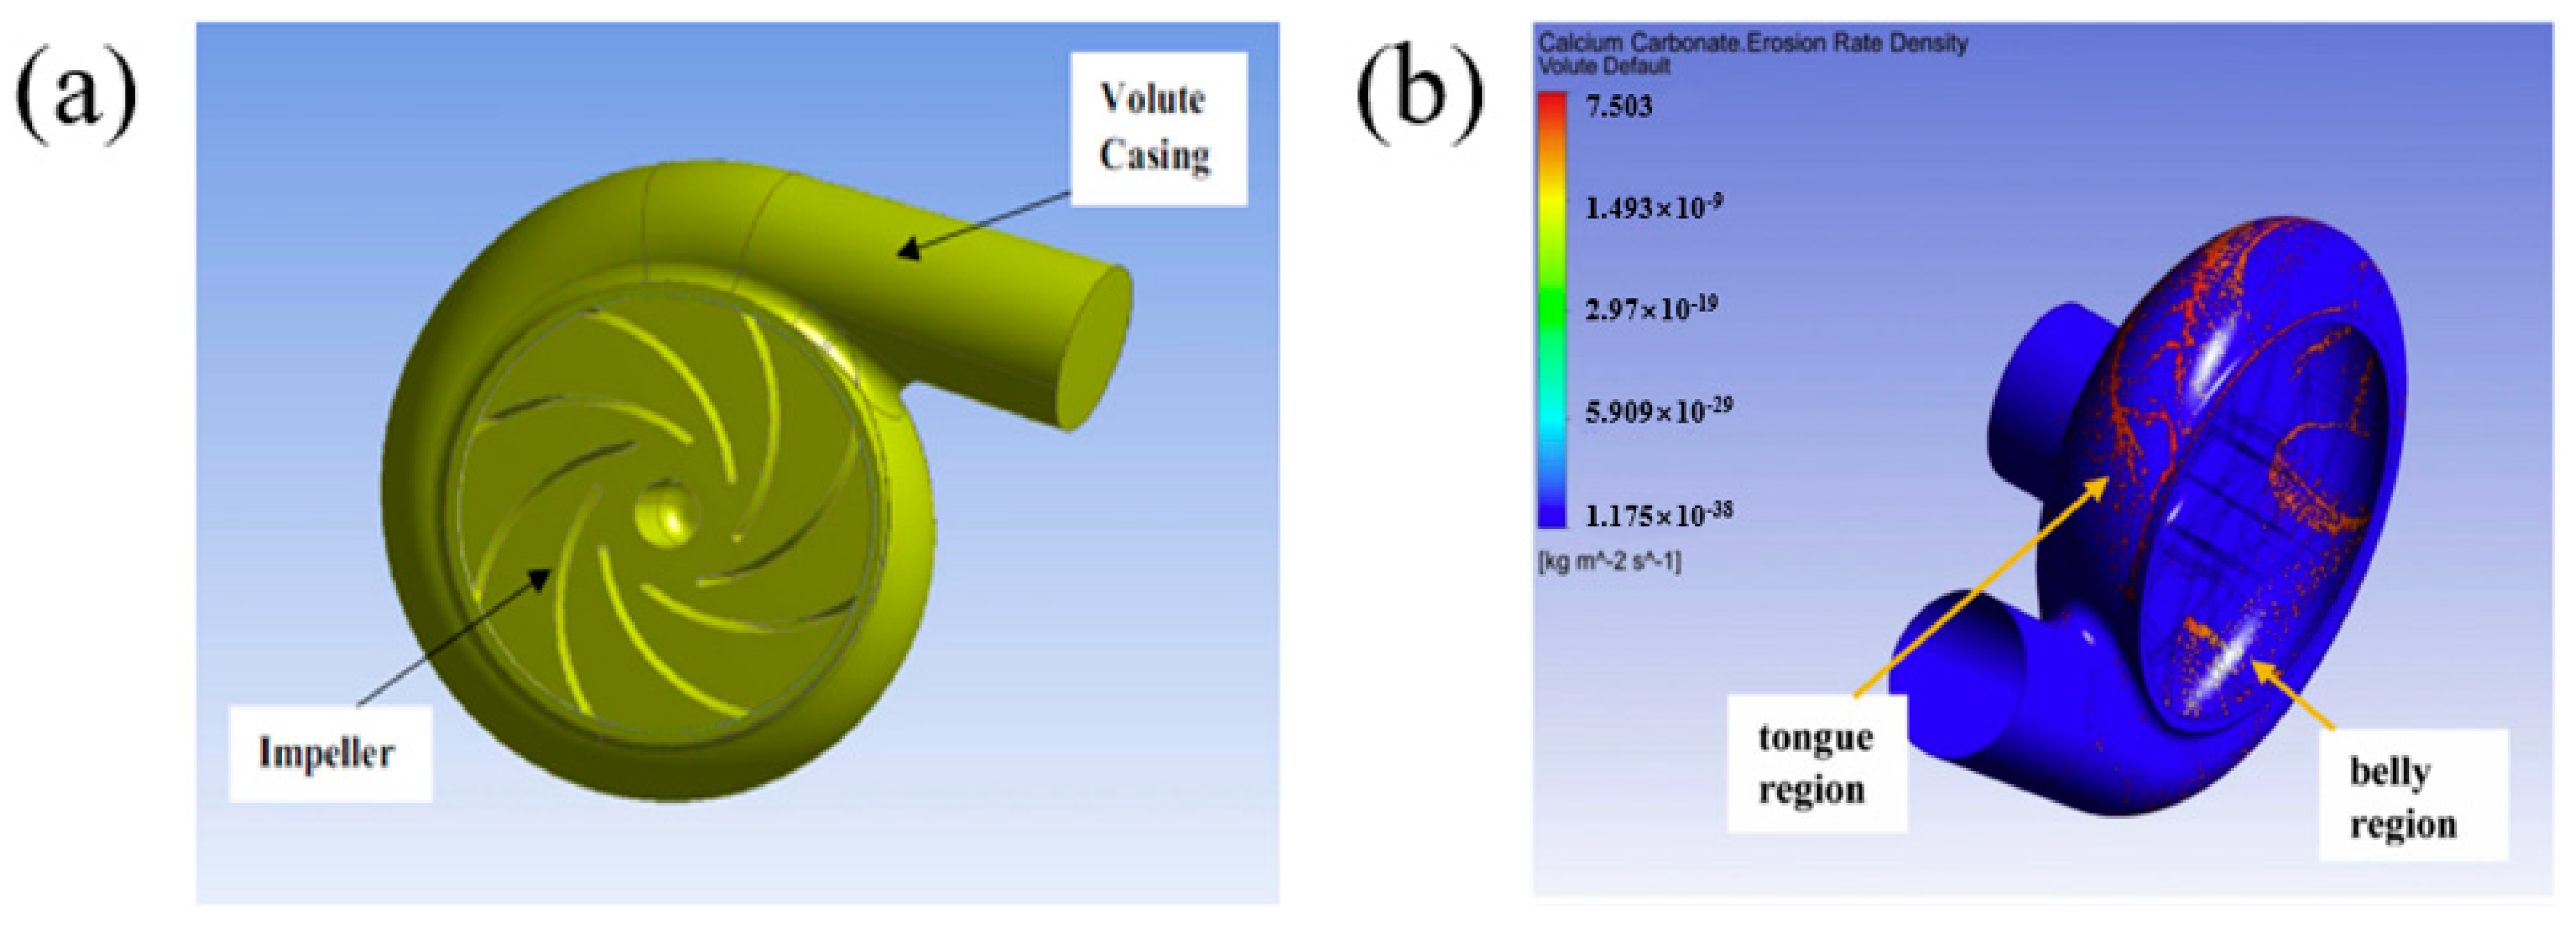
3.2. Erosion in ESPs

It is known from erosion models that parameters that influence the erosion rate can be split into two groups: primary parameters and secondary parameters. Primary parameters include particle size and velocity, while secondary parameters involve material properties such as Young’s modulus of elasticity and Poisson’s ratio. In ESPs, many particles impact pump elements. Thus, more macro parameters such as solid concentration need to be considered. Furthermore, an ESP’s lifespan is influenced by operating conditions such as flow rate, pressure, and load. A large number of experimental tests and CFD simulations were conducted to understand the erosion phenomenon.
Levy and Chik [54] investigated the effects of particle hardness and shape on the erosion. The erosion rate increased with higher hardness until 700 kg/mm2 (Vickers hardness number) when particles were strong enough to not crack. Two shapes were compared, and the damage caused by angular particles was four times that of spherical particles. However, the object material was 1020 carbon steel and the critical hardness may change for other materials. Although not universal, a research method was provided where the influence of some parameters could be eliminated for special materials.
Khalid and Sapuan [55] designed a wear equipment and conducted impeller rotating experiments in slurry. By selecting specific positions of the wear surface for observation, the conclusion was drawn that the rim of the impeller encounters more wear due to centrifugal force. In order to measure the degree of wear, several parameters were compared such as weight loss, diameter loss, thickness loss, and height loss of the impeller. The average height loss of the blade was finally determined to represent the wear performance of the impeller, which could be used to predict the pump’s lifespan. The research was mainly related to the erosion results and the mechanism was not given. Moreover, attention was paid to the impeller and other parts of pumps were not mentioned.
Batalović [56] divided factors affecting erosion into three groups, including characteristics of solid particles, pump material, and slurry flow. Theoretical analysis was combined with a statistical process of experimental data in order to build a new model. The small deviation was attributed to difficulties in precisely describing slurry flow. Although the erosion mechanism was not explained, the model could be used to find the optimal materials and predict the working life as a simple tool.
Morrison [36] generated a mixed flow ESP under 117 h of erosion. Both overall head and efficiency were observed to have declined. The primary cause was believed to be the significant clearance change in the seals, which led to increased leakage. When calculating by theory, therefore, leakage needs to be taken into account at some point.
Compared to costly and time-consuming experiments, the method of simulating erosion with the CFD technique is widely used. In CFD simulations, the total removed material mass can be given by calculating the cumulative results of particles with the discrete phase model (DPM). Due to two phases (solid and fluid) existing in a pump simultaneously, interactions between them need to be taken into account. Universally, the flow feature is important, and fluid governing equations need to be solved firstly. Then, particle motion equations considering fluid force can be solved for particle trajectories. During the process, the erosion rate is calculated. The iteration calculation of a time step ends here and the flow field at the next moment is achieved when the next time step starts. In this manner, the erosion in ESPs can be eventually predicted.
After determining coefficients using erosion experiments, Zhong [57] confirmed Bitter’s model. A numerical prediction of wear in the casing was then conducted to study the effects of particle diameter and flow rate on the erosion rate. With the increase in particle diameter and flow rate, the wear in the pump casing increased. Combining experimental data and numerical calculation, the accuracy of the prediction method was demonstrated.
Using Gülich’s empirical model along with CFD simulations, Kruger et al. [58] conducted some research on the erosion in a radial flow centrifugal pump. Erosion processes were spilt into shock-like and friction-like processes.
Noon and Kim [59] conducted three-dimensional numerical analysis for slurry through centrifugal pumps. Finnie’s model was adopted, and a wear map for the pump casing was achieved. The tongue (near θ = 35°) and belly area (near θ = 300°) were damaged most seriously. Effects of temperature were also mentioned due to corrosion-erosion. Unlike Khalid and Sapuan [55], emphasis was put on the volute casing (Figure 8).
Using Finnie’s model, Xiao et al. [60] also conducted systematic numerical research on the evolution of the erosion pattern in a centrifugal pump. With the blade surface damaged, the erosion rate in the impeller was reduced due to the change in geometry parameters. The direct reason is that local particle velocities decreased because of the strengthened recirculation and increased clearances. The results showed that the flow characteristics and particle trajectories in pumps would be influenced by the eroded material in turn, which provides some advice for the design and maintenance of centrifugal pumps.
Considering the effects of leakage, Pirouzpanah [61] took balance holes as an additional mass flow inlet. Furthermore, a new empirical model related to turbulence kinetic energy, solid concentration, and particle velocity was proposed to predict the erosion rate. Turbulence kinetic energy was believed to be the dominant factor. Although it was a simple equation obtained by fitting, the prediction of the other pump was verified.
Zhu et al. [32,33] conducted sand erosion experiments in an ESP and acquired paint-removal photos. The most seriously damaged positions were the vane edge area in impellers and the diffuser throat area. Numerical simulations with different turbulence models and erosion models in ANSYS were also carried out. The SST k-ε model was considered best for erosion simulation. Due to differences in average impingement velocity and angle, other turbulence models may produce large deviations. The results were compared with the experimental data and great differences appeared in the erosion rate magnitude for various erosion models. Oka et al.’s erosion model showed the least difference with the actual situation for the impeller, while Haugen et al.’s model agreed best for the diffuser. It can be seen from this that a single model may be inappropriate for erosion throughout the ESP. Two mixed-type pumps and one radial-type pump were also compared, and less erosion was observed with mixed-type pumps. Considering the complexity of the flow field, this conclusion deserves further validity for different pump types.
Research on erosion in ESPs was conducted using erosion models, experimental tests, and CFD simulations, as outlined in Table 3. Key findings, drawbacks, and assumptions are listed in the overview column.
Although erosion in ESPs is frequently observed, there exist difficulties in the quantitative description of erosion degree in ESPs. A commonly used measure for erosive degree is the target material removed by a unit mass particle. With the complexity of geometry, the wear of different parts of an ESP is different. The vane edge area in impellers and the diffuser throat area are believed to be damaged most seriously. The erosion rate was connected with particle velocity, flow rate, and target material parameters by fitting. Therefore, empirical models were proposed as a simple prediction method. For deeper understanding of this problem and better calculation accuracy, however, the numerical model should go down to a level of single-particle impact. On the basis of these efforts, continuous improvements were proposed to improve the prediction’s accuracy. In CFD simulations, the Lagrangian particle tracking model was employed, as well as the Eulerian–granular model. Combined with erosion models, numerical calculation is commonly used to predict the erosion rate. Subject to various material properties and complex geometry, the numerical results of erosion in ESPs struggle to match the experimental data. Even if realized, CFD simulations are hard to apply universally. Further research needs to be conducted to completely understand the mechanism.

4. Challenges

4.1. Effects of Viscosity

The complex pump geometry for ESPs plays a large role in the viscous effect. Thus, special designs need to be carried out in order to improve pump performance. Passage width and outlet angle of the impeller [62,63] are believed to be key parameters considering the effects of viscosity. The best ranges are 27.5–32.5° and 17–21 mm respectively. Before manufacture and production, dimensionless analysis and CFD simulations are necessary to predict pump head and efficiency under operating conditions. Although the viscous effect is relatively well understood at present, the specific speed of pumps suitable for theory has a certain range. If the specific speed of the adopted pump is too large or too small, the theoretical results are no longer credible. When the viscosity of pumping fluid changes with shear rate or when a multistage ESP is going to be used, the current theory cannot yet make accurate predictions.

4.2. Effects of Particles

When pump failure occurs, economic loss is attributed to the suspension of production, but not the expenses for repairing pumps [5]. Thus, enough attention ought to be paid to the design procedure to reduce possible wear, as well as emergency treatment after equipment failure. Materials more resistant to wear should be used in key parts of ESPs to extend their working life [54]. Another way is to control operating conditions such as the flow rate and rotational speed, which are key parameters of erosion. When a sharp change in operation conditions happens or an ESP is about to be worn out, the repair or even addition of a new ESP needs to be carried out in time. Currently, CFD is widely used to predict the erosion rate. The most commonly used DPM in simulations, however, has its own limitations. Because one of the theoretical assumptions is to treat particles as mass points without volume, DPM is not suitable for scenes with solid particles occupying a large volume fraction [34]. As the number of particles increases, the problem of long calculation time worsens. Moreover, the current treatment of fluid-solid boundaries in CFD commercial software is relatively simple, which may cause a certain deviation from reality. A method of taking into account both accuracy and calculation efficiency is expected.

4.3. Effects of Bubbles

In addition to oil, there is natural gas in the reservoir. When the pressure drops to the bubble point pressure, gas in crude oil is separated out and gas-liquid two-phase flow appears in the ESP. Head degradation due to the presence of gas is known but the mechanism is not yet clear for complex flow dynamics in an impeller. Various research methods were proposed to study the effects of geometry, GVF, and suction pressure. A visual experimental device was designed and utilized to observe the flow pattern [30]. The velocity profile of each file was simultaneously obtained. The gas pocket on the blade pressure side was believed to be the main reason for head degradation. The essence of efficiency decline is flow heterogeneity. In the gas-blocked zones, the flow path of the fluid is reduced, which causes an increase in the flow rate and slippage on the gas-fluid interface. Empirical models [64] were put forward on the basis of large amounts of experimental data. However, slippage, suction pressure, and specific speed were rarely taken into account. Numerical calculations [65,66] were also conducted to predict pump performance. In order to cover various bubble sizes, a new model, the population balance model (PBM), was employed [67]. However, the bubble size distribution in this model is discrete rather than continuous. Due to simplified assumptions according to complex equations of two-phase flow, the accuracy of the prediction results of the analytical model [31] still needs to be further improved. The presence of bubbles also complicates the influence on erosion and the mechanism [12,13]. More work is needed to completely understand two-phase or even three-phase flow in ESPs.

5. Conclusion

We reviewed classic and fundamental researches and up-to-date contributions to the study of viscosity effects [7,8,9,10,11] and two-phase flow [30,31,32,33] on ESP performance. In the oil and gas industry, the non-Newtonian and particle-rich nature of crude oil makes it crucial for considering pump performance degradation [14,15] when designing the operation process. There are three main research methods for investigating these effects: experimental tests, analytical approaches, and CFD simulations. Dimensionless [21,22] and normalized analyses [16] can be used to predict pump performance as a simple tool, but they are relatively incapable of investigating complex conditions such as two-phase flow or unconventional geometrical structures. Although widely utilized, results from CFD simulations are usually considered less convincing unless compared with experimental results, as they usually contain oversimplified hypotheses. For two-phase flow in ESPs, different methodologies were adopted for specific properties of particles and bubbles. The Eulerian-Lagrangian model [34] applies to solid-liquid flow and the Eulerian-Eulerian model is usually used for gas-liquid flow. The presence of solid particles can reduce pump efficiency and, more importantly, cause wear. The vane edge area in impellers and the throat area in diffusers are considered the most damaged areas [59]. Despite some exploration, the mechanism of particle erosion is not completely clear, and empirical models are frequently used for erosion prediction. A novel model for particle erosion in ESPs with physical mechanics, which covers both accuracy and efficiency, is well anticipated. When the effects of bubbles are added, interactions between phases are non-negligible but challenging to model, which deserve further investigation.

Author Contributions

Conceptualization, P.L. and Y.W.; Writing—original draft preparation, P.L., Y.W., J.G.; writing—review and editing, F.Y., C.N., X.O., J.X.; All authors have read and agreed to the published version of the manuscript.

Funding

We acknowledge support from the National Natural Science Foundation of China (Grant No. 51804319), the Science Foundation of China University of Petroleum, Beijing (Grant No. 2462018YJRC002 and No.2462020YXZZ045), and National Key R&D Program of China (Grant No. 2017YFC0805800).

Conflicts of Interest

The authors declare no conflict of interest.

References

  1. Sukarno, P.; Saepudin, D.; Dewi, S.; Soewono, E.; Sidarto, K.A.; Gunawan, A.Y. Optimization of gas injection allocation in a dual gas lift well system. J. Energy Resour. Technol. 2009, 131. [Google Scholar] [CrossRef]
  2. Robello Samuel, G.; Saveth, K.J. Optimal Design of Progressing Cavity Pumps (PCP). J. Energy Resour. Technol. 2006, 128, 275–279. [Google Scholar] [CrossRef]
  3. Joel Romero, O.; Hupp, A. Subsea Electrical Submersible Pump Significance in Petroleum Offshore Production. J. Energy Res. Technol. 2013, 136, 012902. [Google Scholar] [CrossRef]
  4. Takacs, G. Electrical Submersible Pump Manual, Design, Operations and Maintenance; Elsevier: Amsterdam, The Netherlands, 2009; Available online: https://g0.njuu.cf/extdomains/books.google.com.sg/books?hl=zh-CN&lr=&id=isUpDwAAQBAJ&oi=fnd&pg=PP1&dq=Electrical+Submersible+Pump+Manual,+Design,+Operations+and+Maintenance&ots=jvs5sBjmw9&sig=k0pVzQyCg4rMfMLNWiooGpXFLWs#v=onepage&q=Electrical%20Submersible%20Pump%20Manual%2C%20Design%2C%20Operations%20and%20Maintenance&f=false (accessed on 10 February 2020).
  5. Carvajal Diaz, N. Effects of Sand on the Components and Performance of Electric Submersible Pumps. Master’s Dissertation, Texas A&M University, College Station, TX, USA, 2012. [Google Scholar]
  6. Yedidiah, S. A study in the use of CFD in the design of centrifugal pumps. Eng. Appl. Comput. Fluid Mech. 2008, 2, 331–343. [Google Scholar] [CrossRef] [Green Version]
  7. Li, W.-G. Effects of viscosity of fluids on centrifugal pump performance and flow pattern in the impeller. Int. J. Heat Fluid Flow 2000, 21, 207–212. [Google Scholar] [CrossRef]
  8. Amaral, G.; Estevam, V.; Franca, F.A. On the influence of viscosity on ESP performance. SPE Prod. Oper. 2009, 24, 303–311. [Google Scholar] [CrossRef]
  9. Stel, H.; Sirino, T.; Ponce, F.J.; Chiva, S.; Morales, R.E.M. Numerical investigation of the flow in a multistage electric submersible pump. J. Pet. Sci. Eng. 2015, 136, 41–54. [Google Scholar] [CrossRef]
  10. Ofuchi, E.M.; Stel, H.; Sirino, T.; Vieira, T.S.; Ponce, F.J.; Chiva, S.; Morales, R.E.M. Numerical investigation of the effect of viscosity in a multistage electric submersible pump. Eng. Appl. Comput. Fluid Mech. 2017, 11, 258–272. [Google Scholar] [CrossRef] [Green Version]
  11. Zhu, J.; Banjar, H.; Xia, Z.; Zhang, H.-Q. CFD simulation and experimental study of oil viscosity effect on multi-stage electrical submersible pump (ESP) performance. J. Pet. Sci. Eng. 2016, 146, 735–745. [Google Scholar] [CrossRef]
  12. Basaran, B. CFD Simulation for the Erosion on Electrical Submersible Pump due to Viscosity and Air presence. Master’s Dissertation, Texas A&M University, College Station, TX, USA, 2017. [Google Scholar]
  13. Gerald Morrison, Y.; Daniel, S.; Yiming, C.; Changrui, B.; Abhay, P. Effect of Gas Presence on Erosive Wear of Split-Vane Electrical Submersible Pump. In Proceedings of the Turbomachinery and Pump Symposia, Houston, TX, USA, 11–14 December 2017. [Google Scholar]
  14. Stepanoff, A.J. Centrifugal and Axial Flow Pumps: Theory, Design, and Application. 1957. Available online: https://www.sciencedirect.com/science/article/abs/pii/0016003257900431 (accessed on 10 February 2020).
  15. Solano, E.A. Viscous Effects on the Performance of Electrical Submersible Pumps (ESPs). Master’s Thesis, University of Tulsa, Tulsa, OK, USA, 2009. [Google Scholar]
  16. Ofuchi, E.M.; Stel, H.; Vieira, T.S.; Ponce, F.J.; Chiva, S. Morales, Study of the effect of viscosity on the head and flow rate degradation in different multistage electric submersible pumps using dimensional analysis. J. Pet. Sci. Eng. 2017, 156, 442–450. [Google Scholar] [CrossRef]
  17. Hydraulic, I. Tentative Standards of Hydraulic Institute: Charts for the Determination of Pump Performance When Handling Viscous Liquids; The Institute: NewYork, NY, USA, 1948. [Google Scholar]
  18. Timár, P. Dimensionless Characteristics of Centrifugal Pump. Chem. Papers-Slovak Acad. Sci. 2005, 59, 500. [Google Scholar]
  19. Gülich, J.F. Pumping highly viscous fluids with centrifugal pumps—Part 2. World Pumps 1999, 1999, 39–42. [Google Scholar]
  20. Zhu, J.; Zhu, H.; Cao, G.; Zhang, J.; Peng, J.; Banjar, H.; Zhang, H.-Q. A New Mechanistic Model to Predict Boosting Pressure of Electrical Submersible Pumps Under High-Viscosity Fluid Flow with Validations by Experimental Data. SPE J. 2019. [Google Scholar] [CrossRef]
  21. Morrison, G.; Yin, W.; Agarwal, R.; Patil, A. Development of Modified Affinity Law for Centrifugal Pump to Predict the Effect of Viscosity. J. Energy Res. Technol. 2018, 140, 092005. [Google Scholar] [CrossRef]
  22. Patil, A.; Morrison, G. Affinity Law Modified to Predict the Pump Head Performance for Different Viscosities Using the Morrison Number. J. Fluids Eng. 2019, 141, 141. [Google Scholar] [CrossRef]
  23. Li, W.-G. Mechanism for onset of sudden-rising head effect in centrifugal pump when handling viscous oils. J. Fluids Eng. 2014, 136, 074501. [Google Scholar] [CrossRef]
  24. Ippen, A.T. The influence of viscosity on centrifugal pump performance. Trans. ASME 1946, 68, 823–848. [Google Scholar]
  25. Divine, D.L.; Lannom, R.W.; Johnson, R.A. Determining Pump Wear and Remaining Life From Electric Submersible Pump Test Curves. SPE Prod. Facil. 1993, 8, 217–221. [Google Scholar] [CrossRef]
  26. Sun, D.; Prado, M.G. Single-phase model for electric submersible pump (ESP) head performance. SPE J. 2006, 11, 80–88. [Google Scholar] [CrossRef]
  27. Vieira, T.S.; Siqueira, J.R.; Bueno, A.D.; Morales, R.E.M.; Estevam, V. Analytical study of pressure losses and fluid viscosity effects on pump performance during monophase flow inside an ESP stage. J. Pet. Sci. Eng. 2015, 127, 245–258. [Google Scholar] [CrossRef]
  28. Banjar, H.M. Experiments, CFD Simulation and Modeling of Oil Viscosity and Emulsion Effects on ESP Performance. Ph.D. Thesis, The University of Tulsa, Tulsa, OK, USA, 2018. [Google Scholar]
  29. Gülich, J.F. Pumping highly viscous fluids with centrifugal pumps—Part 1. World Pumps 1999, 1999, 30–34. [Google Scholar] [CrossRef]
  30. Barrios, L.; Prado, M.G. Experimental visualization of two-phase flow inside an electrical submersible pump stage. J. Energy Resour. Technol. 2011, 133, 042901. [Google Scholar] [CrossRef]
  31. Noghrehkar, G.; Kawaji, M.; Chan, A.; Nakamura, H.; Kukita, Y. Investigation of Centrifugal Pump Performance under Two-Phase Flow Conditions. J. Fluids Eng. 1995, 117, 129–137. [Google Scholar] [CrossRef]
  32. Zhu, H.; Zhang, J.; Zhu, J.; Rutter, R.; Zhang, H.-Q. A Numerical Study of Turbulence Model and Rebound Model Effect on Erosion Simulations in an Electrical Submersible Pump (ESP). In Proceedings of the ASME-JSME-KSME 2019 8th Joint Fluids Engineering Conference, San Francisco, CA, USA, 28 July–1 August 2019. [Google Scholar]
  33. Zhu, H.; Zhu, J.; Rutter, R.; Zhang, H.-Q. A Numerical Study on Erosion Model Selection and Effect of Pump Type and Sand Characters in Electrical Submersible Pumps by Sandy Flow. J. Energy Res. Technol. 2019, 141, 1–58. [Google Scholar] [CrossRef]
  34. Russell, R.; Marsis, E. A state-of-the-art computational fluid dynamics simulation for erosion rates prediction in a bottom hole electrical submersible pump. In Proceedings of the SPE Heavy Oil Conference-Canada, Alberta, Canada, 11–13 June 2013. [Google Scholar]
  35. King, D.; Traylor, F.; Stewart, R. Abrasion Technology for Electric Submergible Pumps. In Proceedings of the SPE Annual Technical Conference and Exhibition, San Francisco, CA, USA, 5–8 October 1983. [Google Scholar]
  36. Morrison, G.; Carvajal, N.; Saleh, R.; Bai, C. The Measured Impact of Erosion on the Rotodynamic and Performance Characteristics of a Mixed Flow ESP. In Proceedings of the 31st International Pump Users Symposium, Houston, TX, USA, 14–17 September 2015. [Google Scholar]
  37. Ahlert, K.R. Effects of Particle Impingement Angle and Surface Wetting on Solid Particle Erosion of AISI 1018 Steel; University of Tulsa: Tulsa, OK, USA, 1994. [Google Scholar]
  38. Haugen, K.; Kvernvold, O.; Ronold, A.; Sandberg, R. Sand erosion of wear-resistant materials: Erosion in choke valves. Wear 1995, 186, 179–188. [Google Scholar] [CrossRef]
  39. Oka, Y.; Okamura, K.; Yoshida, T. Practical estimation of erosion damage caused part 2: Mechanical properties of materials directly associated with erosion damage. Wear 2005, 259, 102–109. [Google Scholar] [CrossRef]
  40. Zhang, Y.; Reuterfors, E.; McLaury, B.S.; Shirazi, S.; Rybicki, E. Comparison of computed and measured particle velocities and erosion in water and air flows. Wear 2007, 263, 330–338. [Google Scholar] [CrossRef]
  41. Mansouri, A. Development of Erosion Equations for Slurry Flows; Advisory Board Report; Erosion/Corrosion Research Center, the University of Tulsa: Tulsa, OK, USA, 2014. [Google Scholar]
  42. DNV, G. Recommended Practice–DNVGL-RP-O501–Managing Sand Production and Erosion; DNV GL: Akershus, Norway, 2015; pp. 3–60. [Google Scholar]
  43. Gülich, J.F. Centrifugal Pumps; Springer: Berlin/Heidelberg, Germany, 2008; Volume 2. [Google Scholar]
  44. Finnie, I. Erosion of surfaces by solid particles. Wear 1960, 3, 87–103. [Google Scholar] [CrossRef]
  45. Finnie, I. Some observations on the erosion of ductile metals. Wear 1972, 19, 81–90. [Google Scholar] [CrossRef]
  46. Bitter, J.G.A. A study of erosion phenomena part I. Wear 1963, 6, 5–21. [Google Scholar] [CrossRef]
  47. Bitter, J. A study of erosion phenomena: Part II. Wear 1963, 6, 169–190. [Google Scholar] [CrossRef]
  48. Neilson, J.; Gilchrist, A. Erosion by a stream of solid particles. Wear 1968, 11, 111–122. [Google Scholar] [CrossRef]
  49. Jianmin, D.; Lyczkowski Robert, W. Three-dimensional kinetic theory modeling of hydrodynamics and erosion in fluidized beds. Powder Technol. 1992, 73, 127–138. [Google Scholar]
  50. Zhu, H.; Zhu, J.; Rutter, R. Sand Erosion Model Prediction, Selection and Comparison for Electrical Submersible Pump (ESP) Using CFD Method. In Proceedings of the ASME 2018 5th Joint US-European Fluids Engineering Division Summer Meeting, Montreal, QC, Canada, 15–20 July 2018. [Google Scholar]
  51. Grant, G.; Tabakoff, W. Erosion prediction in turbomachinery resulting from environmental solid particles. J. Aircr. 1975, 12, 471–478. [Google Scholar] [CrossRef]
  52. Forder, A.; Thew, M.; Harrison, D. A numerical investigation of solid particle erosion experienced within oilfield control valves. Wear 1998, 216, 184–193. [Google Scholar] [CrossRef]
  53. Lyczkowski, R.W.; Bouillard, J. State-of-the-art review of erosion modeling in fluid/solids systems. Prog. Energy Combust. 2002, 28, 543–602. [Google Scholar] [CrossRef]
  54. Levy, A.V.; Chik, P. The effects of erodent composition and shape on the erosion of steel. Wear 1983, 89, 151–162. [Google Scholar] [CrossRef] [Green Version]
  55. Khalid, Y.A.; Sapuan, S.M. Wear analysis of centrifugal slurry pump impellers. Ind. Lubr. Tribol. 2007, 59, 18–28. [Google Scholar] [CrossRef]
  56. Batalović, V. Erosive Wear Model Slurry Pump Impeller. J. Tribol. 2010, 132, 021602. [Google Scholar] [CrossRef]
  57. Zhong, Y.; Minemura, K. Measurement of erosion due to particle impingement and numerical prediction of wear in pump casing. Wear 1996, 199, 36–44. [Google Scholar] [CrossRef]
  58. Krüger, S.; Martin, N.; Dupont, P. Assessment of wear erosion in pump impellers. In Proceedings of the 26th International Pump Users Symposium, Turbomachinery Laboratory, Texas A&M University, College Station, TX, USA, 16–18 March 2010. [Google Scholar]
  59. Noon, A.A.; Kim, M.-H. Erosion wear on centrifugal pump casing due to slurry flow. Wear 2016, 364–365, 103–111. [Google Scholar]
  60. Xiao, Y.; Guo, B.; Ahn, S.-H.; Luo, Y.; Wang, Z.; Shi, G.; Li, Y. Slurry Flow and Erosion Prediction in a Centrifugal Pump after Long-Term Operation. Energies 2019, 12, 523. [Google Scholar]
  61. Pirouzpanah, S.; Patil, A.; Chen, Y.; Morrison, G. Predictive erosion model for mixed flow centrifugal pump. J. Energy Res. Technol. 2019, 141. [Google Scholar] [CrossRef]
  62. Shojaeefard, M.; Tahani, M.; Ehghaghi, M.; Fallahian, M.; Beglari, M. Numerical study of the effects of some geometric characteristics of a centrifugal pump impeller that pumps a viscous fluid. Comput. Fluids 2012, 60, 61–70. [Google Scholar]
  63. Shojaeefard, M.; Tahani, M.; Khalkhali, A.; Ehghaghi, M.; Fallah, H.; Beglari, M. A parametric study for improving the centrifugal pump impeller for use in viscous fluid pumping. Heat Mass Transfer. 2013, 49, 197–206. [Google Scholar]
  64. Duran, J. Pressure Effects on ESP Stages Air-Water Performance; University of Tulsa: Tulsa, OK, USA, 2003. [Google Scholar]
  65. Minemura, K.; Uchiyama, T. Three-dimensional calculation of air-water two-phase flow in centrifugal pump impeller based on a bubbly flow model. J. Fluids Eng. 1993, 115, 766–771. [Google Scholar]
  66. Minemura, K.; Uchiyama, T.; Shoda, S.; Egashira, K. Prediction of air-water two-phase flow performance of a centrifugal pump based on one-dimensional two-fluid model. J. Fluids Eng. 1998, 120, 327–334. [Google Scholar]
  67. Yiming, C.; Abhay, P.; Yi, C.; Changrui, B.; Yintao, W.; Gerald, M. Numerical Study on the First Stage Head Degradation in an Electrical Submersible Pump with Population Balance Model. J. Energy Res. Technol. 2018, 141, 022003. [Google Scholar]
Figure 1. (a) Conventional electric submersible pump (ESP) installation (Carvajaldiaz 2012 [5]); (b) an example of impeller front view (Takacs 2009 [4]); (c) an example of diffuser front view (Takacs 2009 [4]).
Energies 13 05486 g001
Figure 2. Curves of normalized pressure head versus flow rate at a certain rotational speed for different fluid viscosity (Ofuchi 2017 [16]).
Energies 13 05486 g002
Figure 3. Classification of centrifugal pumps (Zhu 2019 [20]).
Energies 13 05486 g003
Figure 4. (a) Head losses versus flow rate in an ESP (Divine 1993 [25]). The difference between an ideal Euler formula and actual H-Q curve is shown, including vane losses, hydraulic losses, shock losses, and leakage losses. (b) Power losses versus flow rate in an ESP (Divine 1993 [25]). The gap between brake horsepower and fluid horsepower is divided into turbulence, friction, leakage, disc friction, and bearing loss.
Energies 13 05486 g004
Figure 5. Impact angle functions of six erosion models (Zhu 2018 [50]).
Energies 13 05486 g005
Figure 6. Particle reflection ( θ 1 and θ 2 are particle velocity before and after impact) (Zhu 2019) [32].
Energies 13 05486 g006
Figure 7. Wear trend versus impact angle for brittle and ductile materials (Lyczkowski 2002) [53].
Energies 13 05486 g007
Figure 8. (a) Centrifugal pump casing model (Noon 2016); (b) erosion rate density (Noon 2016) [59].
Energies 13 05486 g008
Table 1. Summary of studies on ESP performance with high-viscosity fluid. SST, shear stress transport; CFD, computational fluid dynamics.
ApproachArticleOverview
Empirical correlationHydraulic Institute Standards (1948) [17]Correction coefficients were proposed within a narrow range of specific speeds.
Stepanoff (1957) [14]A new correlation at constant specific speed was proposed.
Experimental testsLi (2000) [7]The change in flow pattern was observed through experimental tests.
Amaral et al. (2009) [8]The interaction between impellers and diffusers was proposed to be vital.
CFD simulationsLi (2014) [23]Skin friction factors were supposed to result in the sudden rising head effect with the standard k-ε turbulence model in Fluent.
Stel et al. (2015) [9]Performance of the first stage was found to be different from that of the following stages with the SST turbulence model in ANSYS CFX 14.5 (ANSYS Inc., Pittsburgh, PA, USA.).
Ofuchi et al. (2017) [10]Turbulence spread and backflow were used to explain difference between stages with the SST turbulence model in ANSYS CFX 14.5.
Experimental tests and CFD simulationsZhu et al. (2016) [11]The flow regime transition was thought to strengthen the recirculation with the SST turbulence model in ANSYS CFX 15.
Banjar (2018) [28]A mechanistic model was proposed with oil–water emulsion effects studied using the SST turbulence model in ANSYS CFX.
Dimensionless analysisSolano (2009) [15]Degradation was confirmed at constant specific speed for off-design conditions.
Ofuchi et al. (2017) [16]Normalized specific speeds were proposed to predict performance without geometry.
Morrison et al. (2018) [21]Morrison’s number was defined to get the relationship between parameters.
Patil and Morrison (2019) [22]The specific formula to get Morrison’s number was given.
Analytical modelIppen (1946) [24]A new analytical model related to Reynolds number was given.
Gülich (1999a,1999b) [19,29]A new analytical procedure was given with all the losses considered.
Sun and Prado (2003) [26]A one-dimensional analytical model was given with hydraulic friction and shock loss included.
Vieira (2015) [27]Combinations of pressure losses were proposed to agree with experimental data.
Zhu et al. (2019) [20]A new mechanistic model was said to be applicable for all pumps.
Table 2. Coefficients in the empirical model.
A1A2A3A4A5A6
TabakoffeN0.993−1.761.56−0.49--
eT0.988−1.662.11−0.67--
FordereN0.988−0.780.19−0.0240.0027-
eT1−0.780.84−0.210.028−0.022
Table 3. Summary of studies on erosion in ESPs.
ApproachArticleOverview
Empirical modelAhlert (1994) [37]The impact angle function was split into two parts.
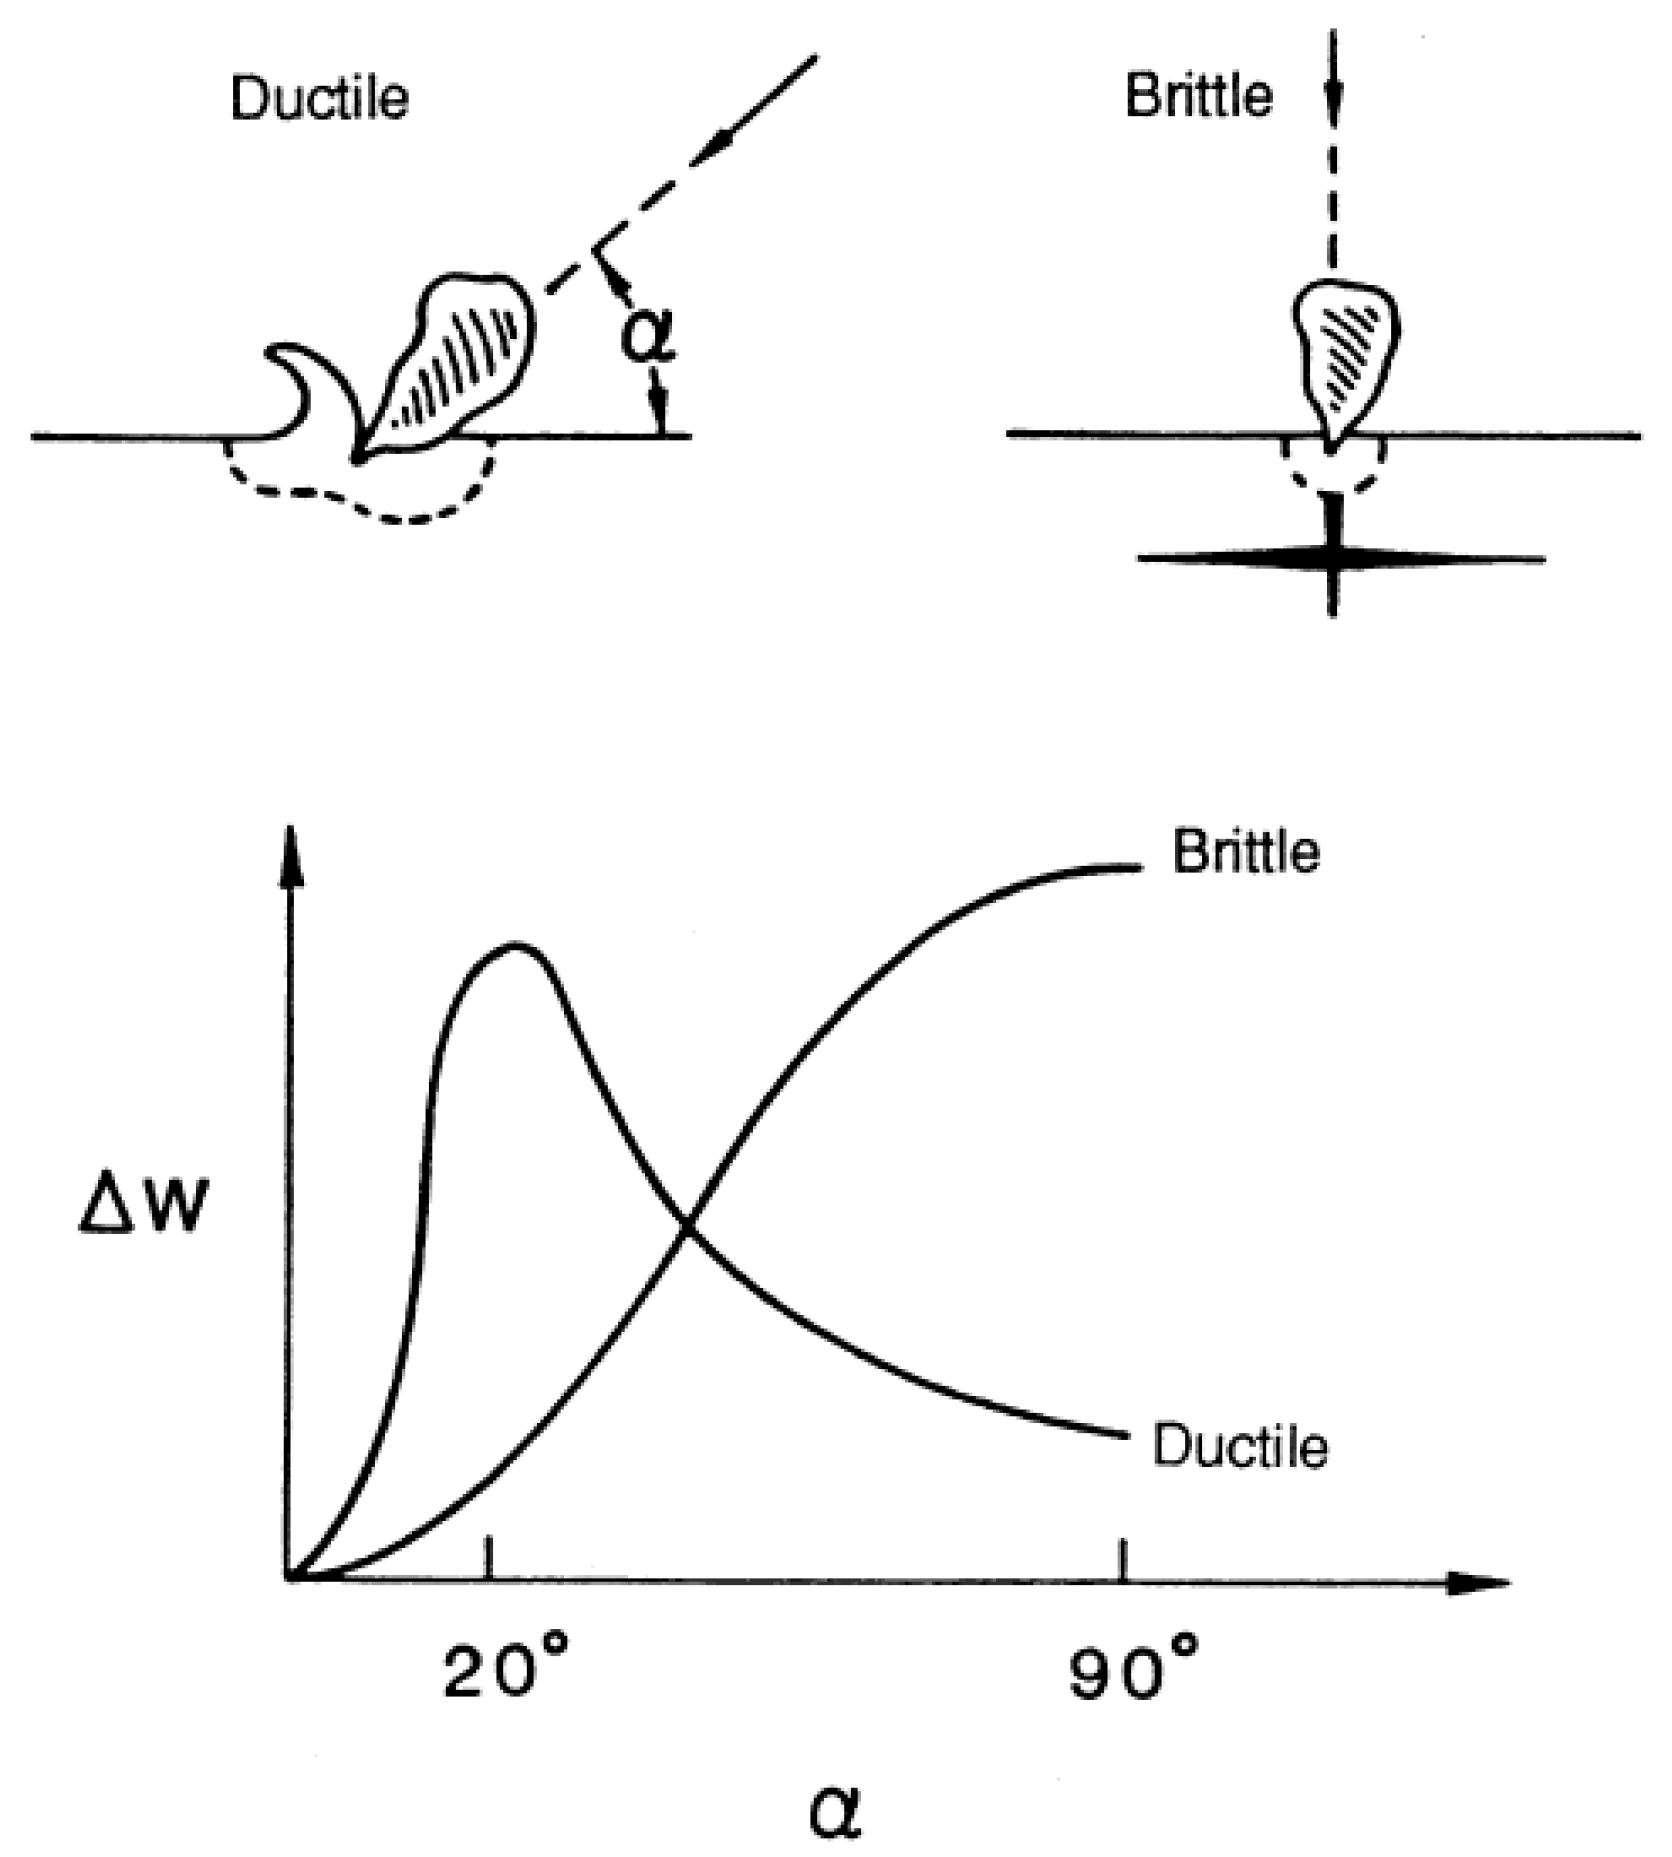
Haugen (1995) [38]Carbon steel was taken as a brittle material.
Oka (2005) [39]The erosion rate was calculated with a reference situation.
Zhang (2007) [40]Ahlert’s model was extended with a polynomial function.
Gülich (2008) [43]An ESP was divided into several parts according to geometry and flow parameters.
Mansouri (2014) [41]A trigonometric impact angle function was introduced.
DNV (2015) [42]Haugen et al.’s model was extended for both brittle and ductile materials.
Mechanistic modelFinnie (1960,1972) [44,45]A single-particle erosion model for ductile material was proposed.
Bitter (1963) [46,47]A threshold velocity was defined to combine ductile and brittle erosion model.
Neilson (1968) [48]Bitter’s model was simplified with an empirical constant.
Ding (1992) [49]Repeated impact of particles was included with the kinetic theory of the granular flow.
Experimental testsLevy (1983) [54]Particle hardness could be neglected when it was high enough.
Khalid (2007) [55]Average height loss of the blade was determined to represent the wear content.
Batalović (2010) [56]A new statistical model was introduced to predict pump working life.
Morrison (2015) [36]Leakage was believed to cause the decrease in overall head and efficiency.
CFD simulationsZhong (1996) [57]Bitter’s model was confirmed, and prediction of pump casing wear was conducted with programming calculation.
Kruger (2010) [58]Erosion processes were split into shock-like and friction-like processes with the Eulerian-Eulerian model.
Noon (2016) [59]The tongue and belly area were found to be damaged most seriously with Finnie’s model in ANSYS CFX.
Xiao (2019) [60]The erosion rate was believed to be reduced during the evolution of pump wear with Finnie’s model in ANSYS CFX 17.
Pirouzpanah (2019) [61]Turbulence kinetic energy was considered the key parameter to predict the erosion rate with the Eulerian–granular model in Fluent.
Zhu (2019) [32,33]Various turbulence and erosion models were compared with experimental data of erosion with the Eulerian-Lagrangian model in ANSYS Fluent 17.2.
Publisher’s Note: MDPI stays neutral with regard to jurisdictional claims in published maps and institutional affiliations.

