Abstract
Rock mass is a medium created through processes that have lasted over four billion years, and its intrinsic feature is the variability of the parameters that describe it. A particularly high variability of mechanical parameters is observed in Carboniferous sedimentary and metamorphic rocks. The mechanical properties, especially the rock mass strength, are essential for the design and maintenance of the stability of excavations conducted in it and for the safe conduct of mining operations. This article presents the test results confirming the random variability of the mechanical parameters of the rock mass. The second part of the article presents the results of numerical simulations mapping the Carboniferous rock mass along with a 1000 m deep tunnel excavation protected by steel arch supports. Numerical simulations were carried out for models with different variability coefficients of strength and deformation parameters, and the obtained results were analyzed in terms of damage zones and rock mass stress state as well as axial forces in the modelled supports. The results of the simulation demonstrate the impact of the variability of rock mass properties on its state in the vicinity of the excavation and, consequently, on the internal forces in the steel supports and their uneven loading along the length of the excavation. This fact should be taken into account in their design.
1. Introduction
A characteristic feature of rock mass, especially Carboniferous rock mass, is the high variability of both its rock layers and the properties of the rocks that make up the individual layers [1,2,3]. Designing galleries, and in particular the choice of their supports, requires knowledge of the mechanical properties of the rock mass [4,5,6,7,8], which are most often defined as average values for a given geological separation on the basis of tests performed with hydraulic testing machines in laboratory conditions [9,10,11] or with the use of penetrometers on site [12,13].
However, the assessment of the condition of the rock mass based only on the averaged values of strength parameters may lead to some discrepancies in the description of its behavior and, as a result, to an incorrect selection of supports, which may result in the loss of excavation stability [14] in a shorter or longer perspective as a result of dynamic or static loads [15].
The reason for taking up this subject is the authors’ observations regarding the condition of mining excavations where, despite properly designed supports, excessive clamping occurs, and in extreme situations, they are destroyed and rocks fall into the excavated space.
The main factor influencing the static load of the supports is the formation of the excavation damage zone [16,17,18,19]. The extent of this zone depends on many factors, the most important of which are the state of stress in the rock mass, rock properties, and the shape and dimensions of the excavation [20,21,22].
The purpose of this article is to determine the impact of the rock mass properties, and in particular, the statistical dispersion of the mechanical parameters that characterize it on the condition of both the rock mass and the supports installed in the mining excavations [23,24].
The solution that allows to take into account the variability of the rock mass is the use of numerical models of continuous media with appropriately differentiated parameters of constitutive models in the finite difference method [25,26,27] and simulations based on the finite element method [28,29]. Rock mass treated as a discontinuous medium also exhibits features of a stochastic medium, the characterization of which requires a description of the discontinuity systems [30,31].
In the first part of the article, based on the authors’ experiments, the variability of the material properties of Carboniferous rocks was analyzed, and then, in the main part, an attempt was made to simulate the rock mass with an excavation with steel arch supports. An innovative approach was used for the numerical analysis, taking into account the statistical dispersion of the rock mass parameters in the spatial model, and its cooperation with the arches of the steel supports. The purpose of the conducted multivariate simulations was to determine the level of variability of the strength and deformation parameters of the rock mass, beyond which the risk of loss of stability of the excavation supports increases. This is a different approach to the design of excavation supports than the one previously employed, based on an effective and at the same time simple criterion for dividing the excavation into characteristic sections, which will allow for the avoidance of costly and troublesome reinforcements and repair of the supports in the future.
The analysis of the results was carried out on the basis of the plasticization zones, the state of stress in the rock mass in the vicinity of the excavation and the axial forces in the supports obtained in models with different statistical dispersion values.
2. Analysis of the Variability of Rock and Rock Mass Properties in the Vicinity of Mining Excavations
In all the applied methods of assessing the stability and designing mine excavations, one of the basic pieces of data accepted for calculations are the strength and deformation properties of the surrounding rock mass. Depending on the method used, the following data, among others, are applied: rock compressive strength, rock tensile strength, rock shear strength, rock cohesion, fracture index, rock elasticity modulus, deformation modulus, compressibility modulus, Poisson’s ratio, internal friction angle, limit elastic strain, and geomechanical classifications.
When analyzing the results of laboratory tests in detail, it can be noticed that the obtained values of rock properties have the characteristics of a random variable [32,33,34,35]. Figure 1a presents examples of laboratory test results for compressive strength, whereas Figure 1b exhibits the results of tests of the elasticity modulus of sandstone samples. The presented results confirm the heterogeneity of rock strength within one layer and on a small area. Therefore, treating the properties of rocks as deterministic quantities for a larger area is a big approximation.
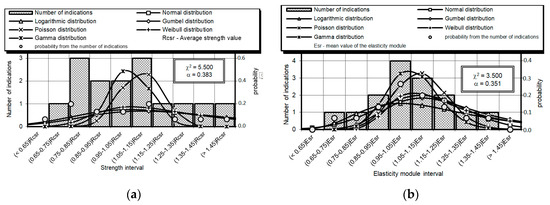
Figure 1.
Histogram of the results of laboratory tests (a) for the compressive strength of sandstone with verification of the statistical hypothesis consistency for the normal distribution. Reproduced from [32], Wyd. Politechniki Śląskiej: 2007, (b) the sandstone elasticity modulus with verification of the statistical hypothesis consistency for the normal distribution Reproduced from [32], Wyd. Politechniki Śląskiej: 2007.
Based on the analysis of the distribution of the number of repetitions of the measured value, a discrete random variable can be changed into a continuous random variable with a normal distribution, which is confirmed by the performed tests of statistical hypothesis consistency.
The results of the compressive strength variability test and the elasticity modulus test of the rock mass in the area within one tectonic block in 22 mining areas of hard coal mines in the Upper Silesian Coal Basin were analyzed. The test results are presented in Figure 2.
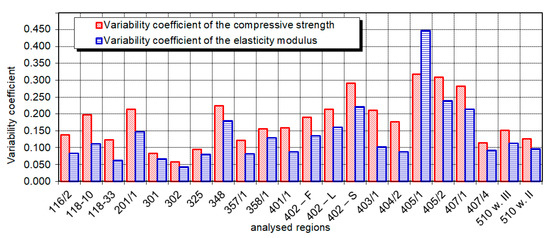
Figure 2.
Variability coefficient of the compressive strength and the elasticity modulus of rocks in the massif in the analyzed regions.
Figure 3 presents an example of the distribution of the compressive strength of sandstone forming one top layer of a coal seam [36], while Figure 4 presents the distribution of the compressive strength variability of sandstone, mudstone, and claystone constituting the same layers depending on the depth. The presented diagrams indicate that there is no relationship between the strength of the rocks forming the analyzed layers and their depth.
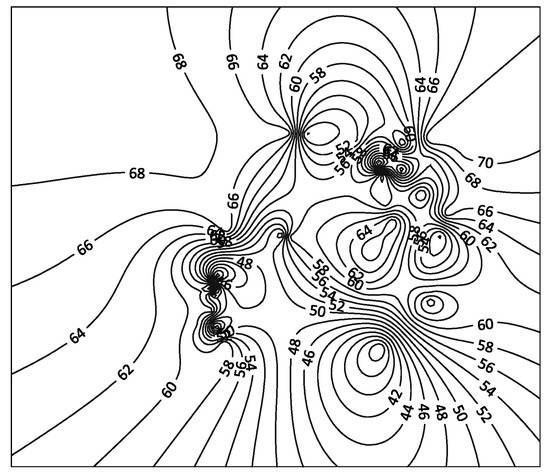
Figure 3.
Distribution of the rock compressive strength values expressed in MPa in the analyzed area. Reproduced from [36], Wyd. IGSMiE PAN: 2007.
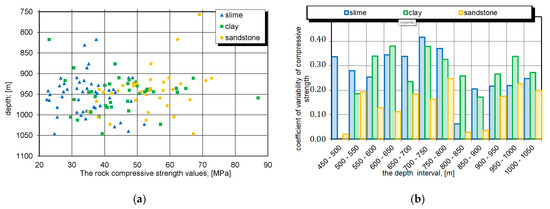
Figure 4.
Distribution of the rock compressive strength (a) values depending on the depth. Reproduced from [36], Wyd. IGSMiE PAN: 2007., (b) variability depending on the depth. Reproduced from [36], Wyd. IGSMiE PAN: 2007.
The analysis of the results of the compressive strength tests of claystone, mudstone, and sandstone presented above, despite the fact that it concerned only one rock layer, indicates the complexity of the process of determining the input data for geomechanical analyses.
Based on the conducted analyses of the research material, it can be concluded that the strength and deformation properties of rocks for the analyzed geological profile usually assume variable values, even within the same layer, and the variability in the analyzed area may even exceed 100%.
The performed analysis of the results of the compressive strength and elasticity modulus tests of the rocks of the rock mass in the vicinity of the corridor workings indicated the following:
- The values of strength and deformation properties of rocks in the rock mass can be determined on the basis of data from scattered points using statistical methods (Figure 3);
- The strength and deformation properties of the rocks surrounding the excavation may also change in time (e.g., as a result of mining works in the area of the excavation);
- For individual rock layers, no relationship was found between the change in the strength properties of the rocks and the depth of their deposition (Figure 4);
- The conducted statistical tests indicated that the strength and deformation properties of Carboniferous rocks can be treated as random variables with a normal probability distribution (Figure 1).
Regarding individual rock layers, no relationship was found between the change in the strength properties of the rocks and their depth. Therefore, in the conducted geomechanical analyses, the variability of the strength and deformation properties of the rock mass should be taken into account [6]. As the research has shown, the material parameters can be treated as random variables with a normal probability distribution [32,33,34,35,36].
3. Construction of the Numerical Model
On the basis of a series of numerical simulations using the FLAC 3D software (v. 4.0, Itasca Consulting Group, Inc., Minneapolis, MN, USA), the impact of the variability of the material properties of rocks on the stress-strain state in the vicinity of corridor excavations was analyzed.
The FLAC 3D software is designed for numerical modelling of the rock mass, and one of its advantages (applied in the discussed numerical simulations) is the option to create stochastic models in which material properties are defined with a statistical dispersion according to the adopted probability distribution. Using the same tool, the issue of parameter variability was taken into account for the stratified rock mass [37], as well as for subsurface layers and soils [38]. The variability of the rock mass parameters also results from the variability of the Rock Mass Rating (RMR) value [39].
In order to obtain comparative results, in the first cycle the calculations were carried out for the model where uniform deterministic mechanical parameters were assumed for the entire volume of the rock mass (variant 0). In the next cycle, in order to take into account the variability of the mechanical parameters of the rock mass, two variants (I and II) of the stochastic models were analyzed, where a random distribution of parameters according to the normal distribution was assumed. The simulations were carried out for six models, where under variant I, the strength parameters (cohesion, internal friction angle, and tensile strength) were defined as the average value, and by adopting the standard deviation corresponding to the variability coefficient equal to 5, 10, 15, 20, 25 and 30%. In variant II, apart from the strength parameters, the deformation parameters (shear and volumetric elasticity coefficient) were also variated.
Due to the nature of the problem, taking into account the variability of the material properties of the rock mass in space, it was necessary to build a three dimensional model, mapping the volume of the rock mass with dimensions of 25 × 25 × 50 m, due to the symmetry of the problem with relation to the vertical plane passing through the axis of the excavation, it was assumed as the side wall of the model (Figure 5). The model was equipped with beam structural elements reflecting ŁP 10 (5.5 × 3.8 m) steel arch supports (the most commonly used ones in Polish coal mines), with a step of 1 m (blue elements in Figure 5), for which the geometric parameters of a typical mining profile marked with the symbol V32 were adopted.
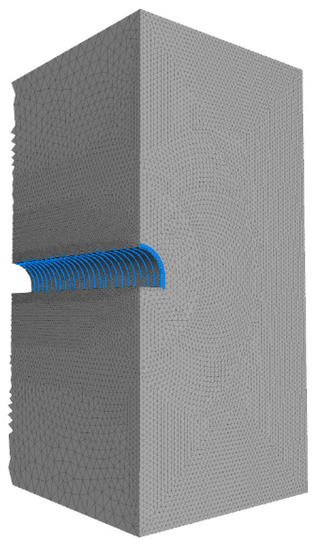
Figure 5.
Numerical model adopted for the calculations with structural elements representing the steel arch supports.
The rock mass model was built from 874,840 zones of finite difference connected in 155,279 nodes. For the nodes located on the side and bottom faces of the model, displacement boundary conditions were assumed in the form of imposing zero displacements in directions perpendicular to these faces. A load generating a vertical stress of 22 MPa was applied on the upper face of the model, which corresponds to a depth of approximately 1000 m.
Inherent stresses of 22 MPa acting both in the vertical direction and in two mutually perpendicular horizontal directions were assumed as initial conditions.
The simulations were carried out in two stages:
- In the first stage, the original stress state was determined in the model (modelled rock mass without excavation);
- In the second stage, the creation of the excavation was simulated by removing the elements inside its contour and introducing structural elements to the model, representing the arches of the steel supports.
An elastic-plastic constitutive model with the Coulomb–Mohr strength condition was used to model the rock mass. The material properties used for the calculations, characterizing the rock mass in individual calculation variants, are presented in Table 1. An example of the distribution of the cohesion values in individual elements of finite differences for variability coefficient equal to 20% is shown in Figure 6.

Table 1.
List of the adopted material properties for variants, taking into account the variability of strength parameters.
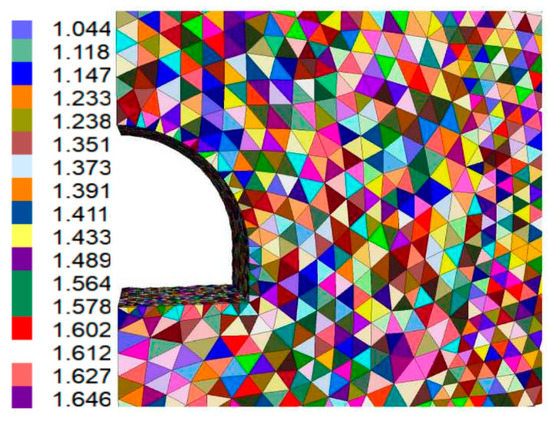
Figure 6.
Cohesion values (in megapascals) adopted in the individual elements of finite differences, after adopting the variability coefficient equal to 20%.
4. Results of Conducted Numerical Simulations
In order to illustrate the impact of the variability of material parameters on the state of the rock mass in the vicinity of the gallery, the results of the performed simulations were presented in the form of plasticization zone distributions, the largest and smallest main stress distribution, and the axial forces recorded in the elements simulating the supports.
4.1. Plasticisation Zones
The results of numerical simulations in the form of plasticization zones should be interpreted as zones in which the stress state has reached its limit value, defined by the applied strength condition. In the results presented in Figure 7, Figure 8 and Figure 9, the plasticization zones resulting from the reaching of tensile and shear strength were marked with various colors. Due to the iterative calculation method, the calculation results also allow the determination of whether the limit state is reached now, it is in the current calculation step (shear-now, tension-now), or was reached in past iterations (shear-past, tension-past).
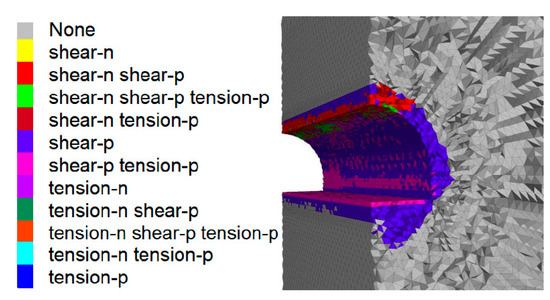
Figure 7.
Plasticization zones in the homogeneous model (variant 0).
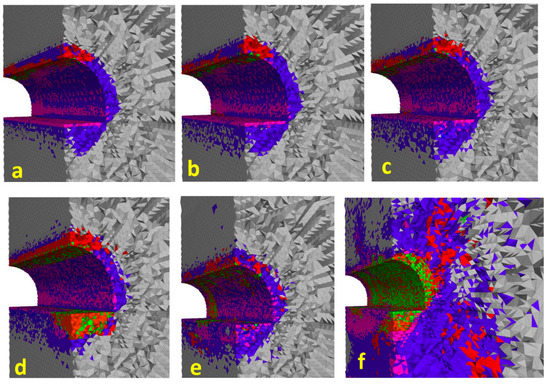
Figure 8.
Plasticization zones in the model with the distribution of strength parameters only, variability coefficients: (a) 5%, (b) 10%, (c) 15%, (d) 20%, (e) 25%, (f) 30%.
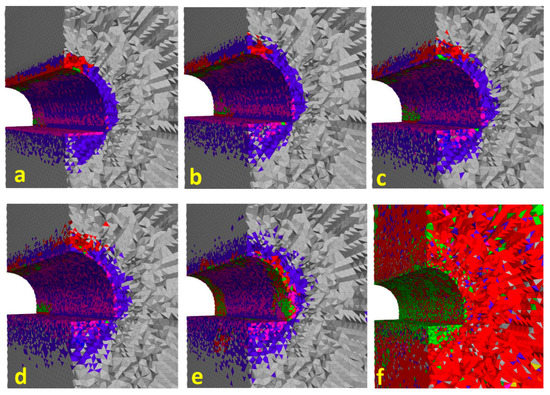
Figure 9.
Plasticization zones in the model with the distribution of strength and deformation parameters, variability coefficients: (a) 5%, (b) 10%, (c) 15%, (d) 20%, (e) 25%, (f) 30%.
In order to illustrate the impact of the variability of material parameters on the condition of the rock mass in the vicinity of the gallery, Figure 7, Figure 8 and Figure 9 show the plasticization zones for each of the analyzed variants in a vertical cross-section created at a distance of 5 m from the front face of the model.
The plasticization zones obtained in the reference model (variant 0) include the rock mass in the vicinity of the modelled excavation at a distance of up to 0.8 m in the roof, 1 m in the side wall, and 1.7 m in the floor, while the plasticization occurred mainly as a result of reaching the shear strength limit (Coulomb–Mohr strength condition met) in both the current (shear-now) and past iterations (shear-past). The tensile strength (tension-past) was exceeded only in the elements located directly on the outline of the excavation.
The distinction between plasticized elements in the previous (past) and the current (now) iteration results from the calculation procedure of the FLAC (v. 4.0, Itasca Consulting Group, Inc., Minneapolis, MN, USA) software, which is based on the fact that in each calculation step and in each element of finite differences a calculation cycle is performed, allowing for the determination of new stresses based on the current displacements and after taking into account the appropriate constitutive model [40,41]. In the case of using an elastic-plastic model, in elements in which the limit stress state (shear or tensile strength) has been achieved during the simulation, and in subsequent iterations where the stresses are lower, these elements are marked as shear-p or tension-p. On the other hand, elements in which the limit stress state occurs at the moment of completing the calculations are marked as shear-n or tension-n. Simulations carried out for variants in which material parameters were differentiated according to the normal distribution, with an increasing value of the variability coefficient, indicate an increase in the extent of the fracture zone. In stochastic models, the plasticized elements form a compact zone only in the immediate vicinity of the excavation, and with increasing distance from its contours, the density of plasticized elements decreases and there is no clear border of the plasticization zone.
The obtained results show that for models with a small statistical dispersion of material parameters (variability coefficients 5, 10, 15%) (Figure 8a–c and Figure 9a–c), the elements near the stress-relieved zone created in the homogeneous model are plasticized (Figure 7), and the most intense increase in the number of plasticized elements occurs at the bottom of the modelled excavation.
In the model with the assumed variability coefficient equal to 0.25, in addition to the elements in the immediate vicinity of the excavation, individual elements located several meters away from its contours were plasticized (Figure 8e and Figure 9e).
In the case of calculation variants If and IIf (variability coefficient 30%), the models were not balanced due to the plasticization of large volumes of the modelled rock mass (Figure 8f and Figure 9f). These results indicate a significant impact increase in the statistical dispersion of strength parameters on the behavior of the modelled rock mass in the range of variability coefficient 25–30%. The results of the conducted simulation demonstrate that more research is necessary in order to analyze and explain the changes of rock mass state with smaller increments of statistical dispersion.
The comparison of the plasticization zones obtained for models I and II shows that their size is influenced not only by the variability of the strength parameters, but also by the deformation parameters. The results of the simulations carried out for model II (strength and deformation parameters set in accordance with the normal distribution) showed a greater number of plasticized elements as compared to model I (only strength parameters set with the normal distribution).
The influence of the dispersion of mechanical parameters can also be inferred from the aspect of the total volume of all plasticized elements generated in individual variants, which is presented in the form of a diagram in Figure 10. As shown in the diagram below, the volume of plasticization zones increases from 200 m3 in the case of rock mass with homogeneous parameters to close to 380 m3 with a variability coefficient of strength and deformation parameters equal to 25%.
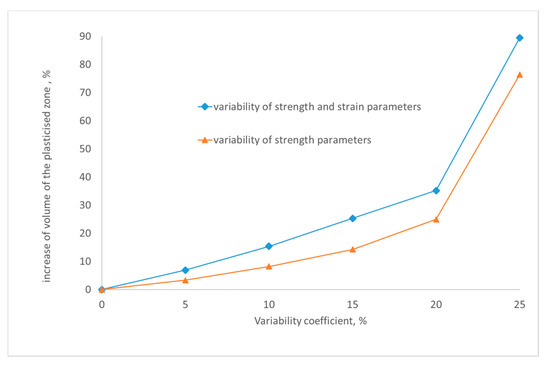
Figure 10.
The correlation obtained in the numerical model between the volume of the plasticized zone and the variability coefficient of the mechanical parameters of rocks.
4.2. Main Stress Distribution
The generation of plasticization zones in the model impacts the stress distribution. This is presented in the form of the largest and smallest main stresses for variants I (Figure 11) and II (Figure 12) for material parameters with a variability coefficient equal to 25%.
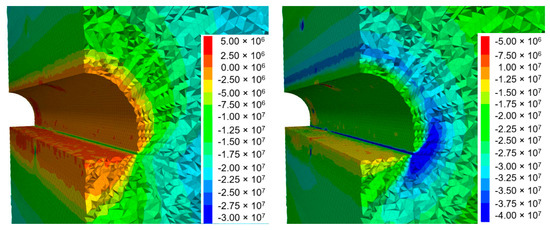
Figure 11.
Distribution of the largest and smallest main stresses expressed in pascals for the model with dispersion of strength parameters with a variability coefficient of 25%.
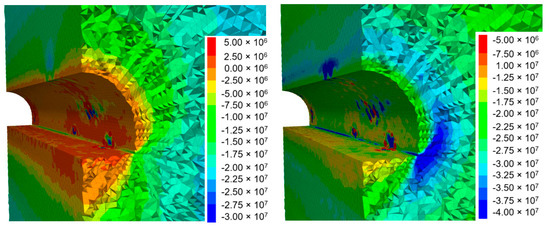
Figure 12.
Distribution of the largest and smallest main stresses expressed in pascals for the model with dispersion of strength and deformation parameters with a variability coefficient of 25%.
The results presented in the figures below show the main stresses expressed in pascals, after adopting the assumption that the compressive stresses are negative.
In the case of the homogeneous model, the stress distribution is invariable along the entire length of the modelled excavation, and the tensile stresses in the floor do not exceed 1 MPa. The highest compressive stresses occur in the area of the transition from the side part to the roof part of the excavation and reach nearly 45 MPa. Moreover, along the cross-section of the excavation, a zone of compressive stress concentration can be distinguished at the border with plasticized elements.
In the case of stochastic models, the stress distribution is generally similar to the reference model. With the statistical dispersion of only strength parameters (Figure 11), relatively small zones disturbing the stress state obtained for the homogeneous model are visible on the sides.
Much more pronounced disturbances in the stress distribution occur in the case of the model with a random distribution of both strength and deformation parameters (Figure 12), where compressive stresses exceeding 40 MPa can be observed in places on the sides of the excavation and the tensile stress zones generated in their vicinity reach up to 5 MPa.
4.3. Axial Forces in the Modelled Supports
The bar elements used in the model, mapping the arches of the supports, were subjected to various loads depending on the calculation variant. In the case of the reference model (Figure 13), the distributions of axial forces in individual support arches along the entire length of the modelled excavation are similar and reach maximum values of up to 700 kN in the bottom part of the supports.
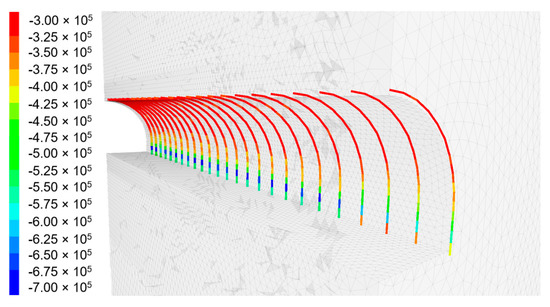
Figure 13.
Axial forces in the modelled supports, expressed in newtons, variant 0.
In the case of the dispersion of only strength parameters (variant Ie, Figure 14), increased values of axial forces can be observed on several arches. For the model accounting for both the dispersion of strength and deformation parameters (variant IIe, Figure 15), two zones with an increased value of axial forces in the support can be clearly distinguished, the first zone between 7 and 13 m of the length of the modelled excavation and the second zone between 23 and 25 m. The differences in the values of axial forces in separate zones may be as high as 100%.
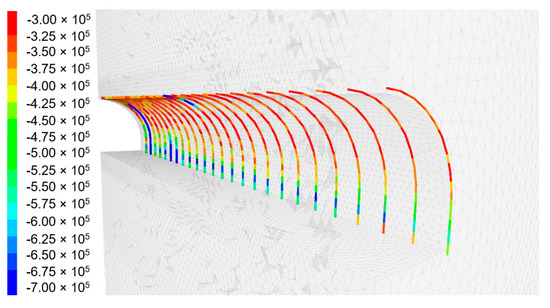
Figure 14.
Axial forces in the modelled supports, expressed in newtons, variant I with a variability coefficient of 25%.
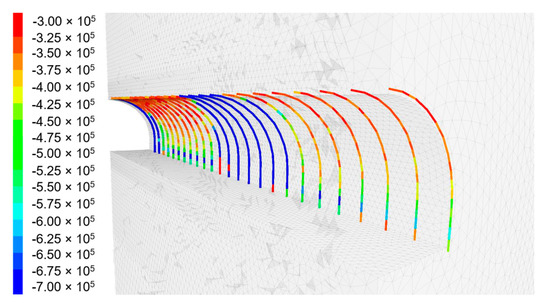
Figure 15.
Axial forces in the modelled supports, expressed in newtons, variant II with a variability coefficient of 25%.
Spots with increased values of axial forces correspond to regions of stress disturbances and zones of increased displacements. Locally occurring increased loads on the supports, in the absence of additional protection, may result in the destruction of the supports and the collapse of the roof rocks, as shown in Figure 16.
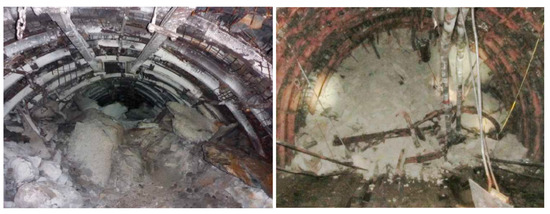
Figure 16.
Rock collapses in Silesian hard coal mines.
The conducted simulations are consistent with the observations of the behavior of the supports in situ and confirm the frequent need for their local reinforcement. They also indicate the need to pay special attention to the variability of the parameters of the rock mass at the stage of designing mining excavations in terms of their division into characteristic sections, taking into account the selection of the support type for individual sections in order to avoid introducing reinforcements—often costly and troublesome—in operational conditions in the future.
5. Summary and Conclusions
As part of this study, the results of 13 numerical simulations, differing in terms of the variability of the set strength and deformation parameters, were presented and discussed (Table 1). In terms of methodology, the analysis was carried out using a numerical model using software based on the FLAC 3D finite difference method. The model includes the rock mass along with a corridor excavation and supports made of steel arches. In order to take into account the variability of material parameters, each element of finite differences was assigned a random value of material parameters in accordance with the variation coefficient adopted for a given variant.
The obtained results for selected variants were presented in the form of the distribution of plasticization zones, main stresses, and axial forces in the modelled supports. The performed numerical simulations allow for the formulation of the following conclusions:
- The actual occurrence of the variability of rock properties may have a significant impact on the conditions of the safe use of galleries;
- An increase in the variability coefficient with constant average values of material parameters increases the range of the plasticization zone in the vicinity of the excavation;
- The increase in the volume of plasticization zones with an increase in the variability coefficient from 0 to 20% is relatively small; however, at higher values, the number of plasticized elements in the model increases rapidly, and with the variability coefficient equal to 30%, the plasticization covers such a large part of the model (Figure 9f and Figure 10f) that it is impossible to balance it;
- Only the variability of strength parameters has a smaller impact on the state of the model than taking into account the variance of both strength and deformation parameters;
- Due to the variability of the strength parameters of the rock mass, elements that provide additional protection and reinforcement of the supports in the sections of increased support load in the form of beams, stands, multi-sided supports, or local anchoring of the rock mass become very significant;
- Numerical modelling of the rock mass, taking into account the variability of the material parameters of the rocks, allows for the mapping of the variability of the rock mass along the excavation and, by applying additional protection, for the improvement of the safety of excavation use.
The numerical simulations and the observations of mining excavations carried out by the authors in situ show that the variability of the strength and deformation parameters of the rock mass significantly affects the behavior of the rock mass in the vicinity of mining galleries, and thus the extent of the support load in individual sections of excavation. This variability indicates the need to separate characteristic sections with significantly different parameters in the gallery and to individually select the support type for each section. On the basis of the conducted simulations, it can be assumed that the division into characteristic sections can be made based on the value of the variability coefficient, assuming the variability of 20% as the limit value. The conducted simulations indicate the necessity of a proper recognition of the rock mass parameters at the stage of designing mining excavations, and in particular the importance of obtaining an appropriate amount of data, enabling their statistical analysis not only in terms of average values but also the variability of individual parameters.
Author Contributions
Conceptualization, M.J. and S.D.; methodology, M.J. and S.D.; software, M.J.; formal analysis, G.D.; investigation, S.D.; resources, G.D.; writing—original draft preparation, M.J. and S.D.; writing—review and editing, M.J.; supervision, S.D.; project administration, G.D. All authors have read and agreed to the published version of the manuscript.
Funding
This research received no external funding.
Conflicts of Interest
The authors declare no conflict of interest.
References
- Duży, S.; Szafulera, K. Przestrzenna losowa zmienność wytrzymałości na ściskanie piaskowców towarzyszących pokładom węgla kamiennego warstw orzeskich. Bud. Gór. Tunelowe 2007, 13, 20–24. [Google Scholar]
- Lu, J.; Huang, G.; Gao, H.; Li, X.; Zhang, D.; Yin, G. Mechanical Properties of Layered Composite Coal–Rock Subjected to True Triaxial Stress. Rock Mech. Rock Eng. 2020, 53, 4117–4138. [Google Scholar] [CrossRef]
- Małkowski, P.; Ostrowski, Ł.; Brodny, J. Analysis of Young’s modulus for Carboniferous sedimentary rocks and its relationship with uniaxial compressive strength using different methods of modulus determination. J. Sustain. Min. 2018, 17, 145–157. [Google Scholar] [CrossRef]
- Chudek, M. Zasady Doboru i Projektowania Obudowy Wyrobisk Korytarzowych i ich Połączeń w Zakładach Górniczych Wydobywających Wegiel Kamienny; KGBPiOP Wydz. Górnictwa i Geologii Politechniki Śląskiej: Gliwice, Poland, 2000. [Google Scholar]
- Hoek, E.; Brown, E.T. Practical estimates of Rock Mass Strength. Int. J. Rock Mech. Min. Sci. 1997, 34, 1165–1186. [Google Scholar] [CrossRef]
- Bukowski, P.; Bukowska, M. Changes of some of the mechanical properties of rocks and rock mass in conditions of mining exploitation and mine workings flooding. AGH J. Min. Geoeng. 2012, 36, 57–67. [Google Scholar]
- Brady, B.H.G.; Brown, E.T. Rock Mechanics for Underground Mining, 3rd ed.; Springer: Dordrecht, The Netherlands, 2006. [Google Scholar]
- Hoek, E.; Kaiser, P.K.; Bawden, W. Support. of Underground Excavations in Hard Rock; Balkema: Rotterdam, The Netherlands, 1995. [Google Scholar]
- Aladejare, A.E. Evaluation of empirical estimation of uniaxial compressive strength of rock using measurements from index and physical tests. J. Rock Mech. Geotech. Eng. 2020, 12, 256–268. [Google Scholar] [CrossRef]
- Mardalizad, A.; Scazzosi, R.; Manes, A.; Giglio, M. Testing and numerical simulation of a medium strength rock material under unconfined compression loading. J. Rock Mech. Geotech. Eng. 2018, 10, 197–211. [Google Scholar] [CrossRef]
- Pells, P.J.N. Unixial strength testing. Compr. Rock Eng. 1993, 3, 67–85. [Google Scholar]
- Rabat, Á.; Cano, M.; Tomás, R.; Tomayo, Á.; Alejano, L. Evaluation of Strength and Deformability of Soft Sedimentary Rocks in Dry and Saturated Conditions Through Needle Penetration and Point Load Tests: A Comparative Study. Rock Mech. Rock Eng. 2020, 53, 2707–2726. [Google Scholar] [CrossRef]
- Cai, M.; Kaiser, P.K. In-situ Rock Spalling Strength near Excavation Boundaries. Rock Mech. Rock Eng. 2014, 47, 659–675. [Google Scholar] [CrossRef]
- Duży, S.; Cholewa, M. Assessment of the risk of loss of stability of the steel arch support of the underground excavations. In Proceedings of the Mining of Sustainable Development Conference 2018, Gliwice, Poland, 28 November 2018; Jonczy, I., Komorek, J., Eds.; Institute of Physics: Bristol, UK, 2019. [Google Scholar] [CrossRef]
- Villaescusa, E.; Brown, E.T. Maximum likelihood estimation of joint size from trace length measurements. Rock Mech. Rock Eng. 1992, 25, 67–87. [Google Scholar] [CrossRef]
- Perras, M.; Diederichs, M. Predicting excavation damage zone depths in brittle rocks. J. Rock Mech. Geotech. Eng. 2016, 8, 60–74. [Google Scholar] [CrossRef]
- Tao, M.; Hong, Z.; Peng, K.; Sun, P.; Cao, M.; Du, K. Evaluation of Excavation-Damaged Zone around Underground Tunnels by Theoretical Calculation and Field Test Methods. Energies 2019, 12, 1682. [Google Scholar] [CrossRef]
- Wang, H.W.; Jiang, Y.D.; Xue, S.; Shen, B.T.; Wang, C.; Lv, J.G.; Yang, T. Assessment of excavation damaged zone around roadways under dynamic pressure induced by an active mining process. Int. J. Rock Mech. Min. Sci. 2015, 77, 265–277. [Google Scholar] [CrossRef]
- Souley, M.; Renaud, V.; Al Heib, M.; Bouffier, C.; Lahaie, F.; Nyström, A. Numerical investigation of the development of the excavation damaged zone around a deep polymetallic ore mine. Int. J. Rock Mech. Min. Sci. 2018, 106, 165–175. [Google Scholar] [CrossRef]
- Yang, H.Q.; Zeng, Y.Y.; Lan, Y.F.; Zhou, X.P. Analysis of the excavation damaged zone around a tunnel accounting for geostress and unloading. Int. J. Rock Mech. Min. Sci. 2014, 69, 59–66. [Google Scholar] [CrossRef]
- Martin, C.; Kaiser, P.; McCreath, D. Hoek–Brown parameters for predicting the depth of brittle failure around tunnels. Can. Geotech. J. 1999, 36, 136–151. [Google Scholar] [CrossRef]
- Perras, M.; Langford, C.; Ghazvinian, E.; Diederichs, M. Numerical delineation of the excavation damage zones: From rock properties to statistical distribution of the dimensions. In Proceedings of the ISRM International Symposium-EUROCK, Stockholm, Sweden, 28–30 May 2012. [Google Scholar]
- Shadabfar, M.; Huang, H.; Kordestani, H.; Muho, E.V. Probabilistic modeling of excavation-induced damage depth around rock-excavated tunnels. Results Eng. 2020, 5, 100075. [Google Scholar] [CrossRef]
- Cai, M. Rock Mass Characterization and Rock Property Variability Considerations for Tunnel and Cavern Design. Rock Mech. Rock Eng. 2011, 44, 379–399. [Google Scholar] [CrossRef]
- Jiang, S.H. Modelling of spatial variability of soil undrained shear strength by conditional random fields for slope reliability analysis. Appl. Math. Model. 2018, 63, 374–389. [Google Scholar] [CrossRef]
- Dyson, A.P.; Tolooiyan, A. Prediction and classification for finite element slope stability analysis by random field comparison. Comput. Geotech. 2019, 109, 117–129. [Google Scholar] [CrossRef]
- Yu, X.; Cheng, J.; Cao, C.; Li, E.; Feng, J. Probabilistic Analysis of Tunnel Liner Performance Using Random Field Theory. Adv. Civ. Eng. 2019, 2019, 1348767. [Google Scholar] [CrossRef]
- Fenton, G.A.; Gryffith, D.V. Probabilistic foundation settlement on spatially random soil. J. Geotech. Geoenviron. 2002, 128, 381–390. [Google Scholar] [CrossRef]
- Green, D.K.E.; Douglas, K.; Mostyn, G. The simulation and discretisation of random fields for probabilistic finite element analysis of soils using meshes of arbitrary triangular elements. Comput. Geotech. 2015, 68, 91–108. [Google Scholar] [CrossRef]
- Villaescusa, E.; Thompson, A.; Windsor, C. Probabilistic estimate of rock mass static and dynamic demands for underground excavation stabilisation. Rock Mech. Rock Eng. 2019, 11, 481–493. [Google Scholar] [CrossRef]
- Hudson, J.A.; Priest, S.D. Discontinuities and rock mass geometry. Int. J. Rock Mech. Min. Sci. Geomech. Abstr. 1979, 16, 339–362. [Google Scholar] [CrossRef]
- Duży, S. Studium niezawodności konstrukcji obudowy i stateczności wyrobisk korytarzowych w kopniach węgla kamiennego z uwzględnieniem niepewności informacji. Zesz. Nauk. Górnictwo/Politech. Śląska 2007, 277, 134–150. [Google Scholar]
- Kim, K.; Gao, H. Probabilistic approaches to estimating variation in the mechanical properties of rock masses. Int. J. Rock Mech. Min. Sci. Geomech. Abstr. 1995, 32, 111–120. [Google Scholar] [CrossRef]
- Vanmarcke, E.H. Probabilistic modeling of soil profiles. J. Geotech. Eng. Div. 1977, 103, 1227–1246. [Google Scholar]
- Karakus, M.; Tutmez, B. Fuzzy and multiple regression modeling for evaluation of intact rock strength based on point load, Schmidt hammer and sonic velocity. Rock Mech. Rock Eng. 2006, 39, 45–57. [Google Scholar] [CrossRef]
- Duży, S. Wpływ głębokości lokalizacji wyrobisk górniczych na niezawodność i bezpieczeństwo ich konstrukcji. Zagrożenia naturalne w górnictwie. In Proceedings of the XI Warsztaty Górnicze, Ślesin k, Konina, Poland, 4–6 June 2007; Pilecka, J., Ed.; Wyd. IGSMiE PAN: Kraków, Poland, 2007; pp. 183–196. [Google Scholar]
- Chen, D.; Xu, D.; Ren, G.; Jiang, Q.; Liu, G.F.; Wan, L.; Liu, Z. Simulation of cross-correlated non-Gaussian random fields for layered rock. Comput. Geotech. 2019, 112, 104–119. [Google Scholar] [CrossRef]
- Exadaktylos, G.; Stavropoulou, M. A specific upscaling theory of rock mass parameters exhibiting spatial variability: Analytical relations and computational scheme. Int. J. Rock Mech. Min. Sci. 2008, 45, 1102–1125. [Google Scholar] [CrossRef]
- Stavropoulou, M.; Exadaktylos, G.; Saratsis, G. Combined three-dimensional geological-geostatistical-numerical model of underground excavations in rock. Rock Mech. Rock Eng. 2007, 40, 213–243. [Google Scholar] [CrossRef]
- Fast Lagrangian Analysis of Continua in 3 Dimensions, User Manual; Itasca Consulting Group: Minneapolis, MN, USA, 2009.
- Hang Lin, H.; Taoying Liu, T.; Li, J.; Cao, P. A Simple Generation Technique of Complex Geotechnical Computational Model. Math. Probl. Eng. 2013, 2013, 863104. [Google Scholar] [CrossRef]


Publisher’s Note: MDPI stays neutral with regard to jurisdictional claims in published maps and institutional affiliations. |
© 2020 by the authors. Licensee MDPI, Basel, Switzerland. This article is an open access article distributed under the terms and conditions of the Creative Commons Attribution (CC BY) license (http://creativecommons.org/licenses/by/4.0/).