Article

The Current State of the Engineering Method for the Optimal Gas-Dynamic Design and Calculation of Centrifugal Compressor

1
National Technological Initiative Center of Excellence in New Manufacturing Technologies, Peter the Great St. Petersburg Polytechnic University, 195251 Saint-Petersburg, Russia
2
Information Technology and Security Department, Melbourne Polytechnic, Locked Bag 5 Preston Victoria, 3072 Melbourne, Australia
3
National Technological Initiative Center of Excellence in New Manufacturing Technologies and Higher School of Power Engineering, Institute of Energy, Peter the Great St. Petersburg Polytechnic University, 195251 Saint-Petersburg, Russia
4
National Technological Initiative Center of Excellence in New manufacturing technologies and Higher School of Hydrotechnical and Power Engineering, Institute of Civil Engineering, Peter the Great St. Petersburg Polytechnic University, 195251 Saint-Petersburg, Russia
*
Author to whom correspondence should be addressed.
Energies 2020, 13(21), 5651; https://doi.org/10.3390/en13215651
Submission received: 21 September 2020 / Revised: 13 October 2020 / Accepted: 26 October 2020 / Published: 28 October 2020

Abstract

:
In the practice of centrifugal compressor designing, different engineering techniques are widely used because flow motion differential equations cannot be integrated, and Computational fluid dynamics cannot resolve the problem as a whole. Engineering personal computers’ programs are based on experimental data and the gas dynamics theory. The universal modeling method’s (UMM) mathematical model is a set of equations that determine the pressure loss in the elements of the centrifugal compressor flow path. By the earlier versions of the UMM, dozens of process compressors were designed. Several sets of empirical coefficients for stages of different specific speeds were applied. The paper presents the current state of the universal modeling method that was recently improved. The models of the centrifugal compressor characteristic calculation are described. A new model of the loading factor characteristic, an improved version of the compressor efficiency, and being based on a CFD-calculation vaneless diffuser model are samples of the improvements. Careful identification and verification demonstrate effective characteristic simulation with a single set of empirical coefficients. Centrifugal compressor new design examples of a turbo expander unit and a turbocharger are presented. The calculated characteristics are compared with the test results. For both objects, the experiments confirmed the calculated gas-dynamic characteristics with sufficient accuracy for engineering methods.

1. Introduction

Turbocompressors are widely used in industrialized countries. In the Russian Federation gas industry, thousands of centrifugal compressors operate with a total power over 50 million kW [1]. The aim of the gas-dynamic project is to create a flow path that provides a given pressure ratio at a given flow rate with minimal possible power consumption in order to reduce the main component of operating costs, the cost of energy to drive a compressor.
A compressor one-dimensional thermo-and gas dynamic calculation of characteristics is simple. For example, the pressure ratio of the compressor stage is calculated by the equation:
π * = p e x * p i n l * = [ 1 + ( k 1 ) ψ i M u 2 ] k k 1 η *
where π * —total pressure ratio, p*—total pressure, k—isentropic exponent, ψ i —work head coefficient, M u —impeller Mach number, and η —efficiency.
It is enough to know the magnitude of the work coefficient ψ i , which characterizes the amount of mechanical energy transferred to the gas by the impeller, and the efficiency η * , which characterizes the proportion of mechanical energy that compresses and moves the gas:
ψ i = h i u 2 2
where h i —work head, and u 2 —impeller velocity.
η * = ln π * k k 1 ln ( p e x * / p i n l * )
Equations (1)–(3) were presented in [2] already.
The similarity theory connects the efficiency and the work coefficient with the shape of the flow path F ¯ , the flow rate coefficient Φ , and the similarity criteria M u ,   k ,   Re u . The symbolic expression of this statement and flow coefficient Equation (5) were presented firstly in [2]:
η * ,   ψ i = f ( F ¯ ,   Φ ,   M u ,   k ,   Re u )
Where Re u —impeller Reynolds number and where:
Φ = m ¯ π 4 D 2 2 u 2 p i n l * R T i n l * .
The shape of the flow path is represented by a set of main dimensions’ values, examples of which are shown in Figure 1 and by blades’ and vanes’ 3-D or 2-D shapes. In accordance with the requirements of the theory of similarity, dimensions are presented in relative form: D ¯ h = D h / D 2 , R ¯ s = R s / D 2 etc.
The only correct solution of the parametric Equation (4) is a compressor test. Flow motion differential equations do not have an analytical solution. CFD calculations are based on empirical turbulence models and other simplifications. All engineering methods are based on different methods of summarizing the results of compressors tests and (or) model stage tests at special test rigs. Engineering methods are based on a simplified scheme of flow behavior (physical model) and on its description by empirical or semi-empirical algebraic equations (mathematical model). Many compressor manufacturers use engineering methods. However, the usually published information does not disclose technical essence of a model [3]. The exclusion is the following one as a sample.
The loss model of Agile engineering [4,5] uses the techniques of the boundary layer theory. In [6,7], losses are calculated on the basis of empirical equations for detailed experiments with straight diffusers, with correlations on channel curvature and other circumstances. The loading factor is calculated by the known A. Stodola equation.
The authors have no information to judge about the design practice of other math models. The universal modeling method (UMM) in its modern state is described in the next section of the text. The authors have designed several dozens of operations in industries compressors since the mid-1990s. Design parameters and predicted efficiency were proven by factory tests and exploitation in all cases.
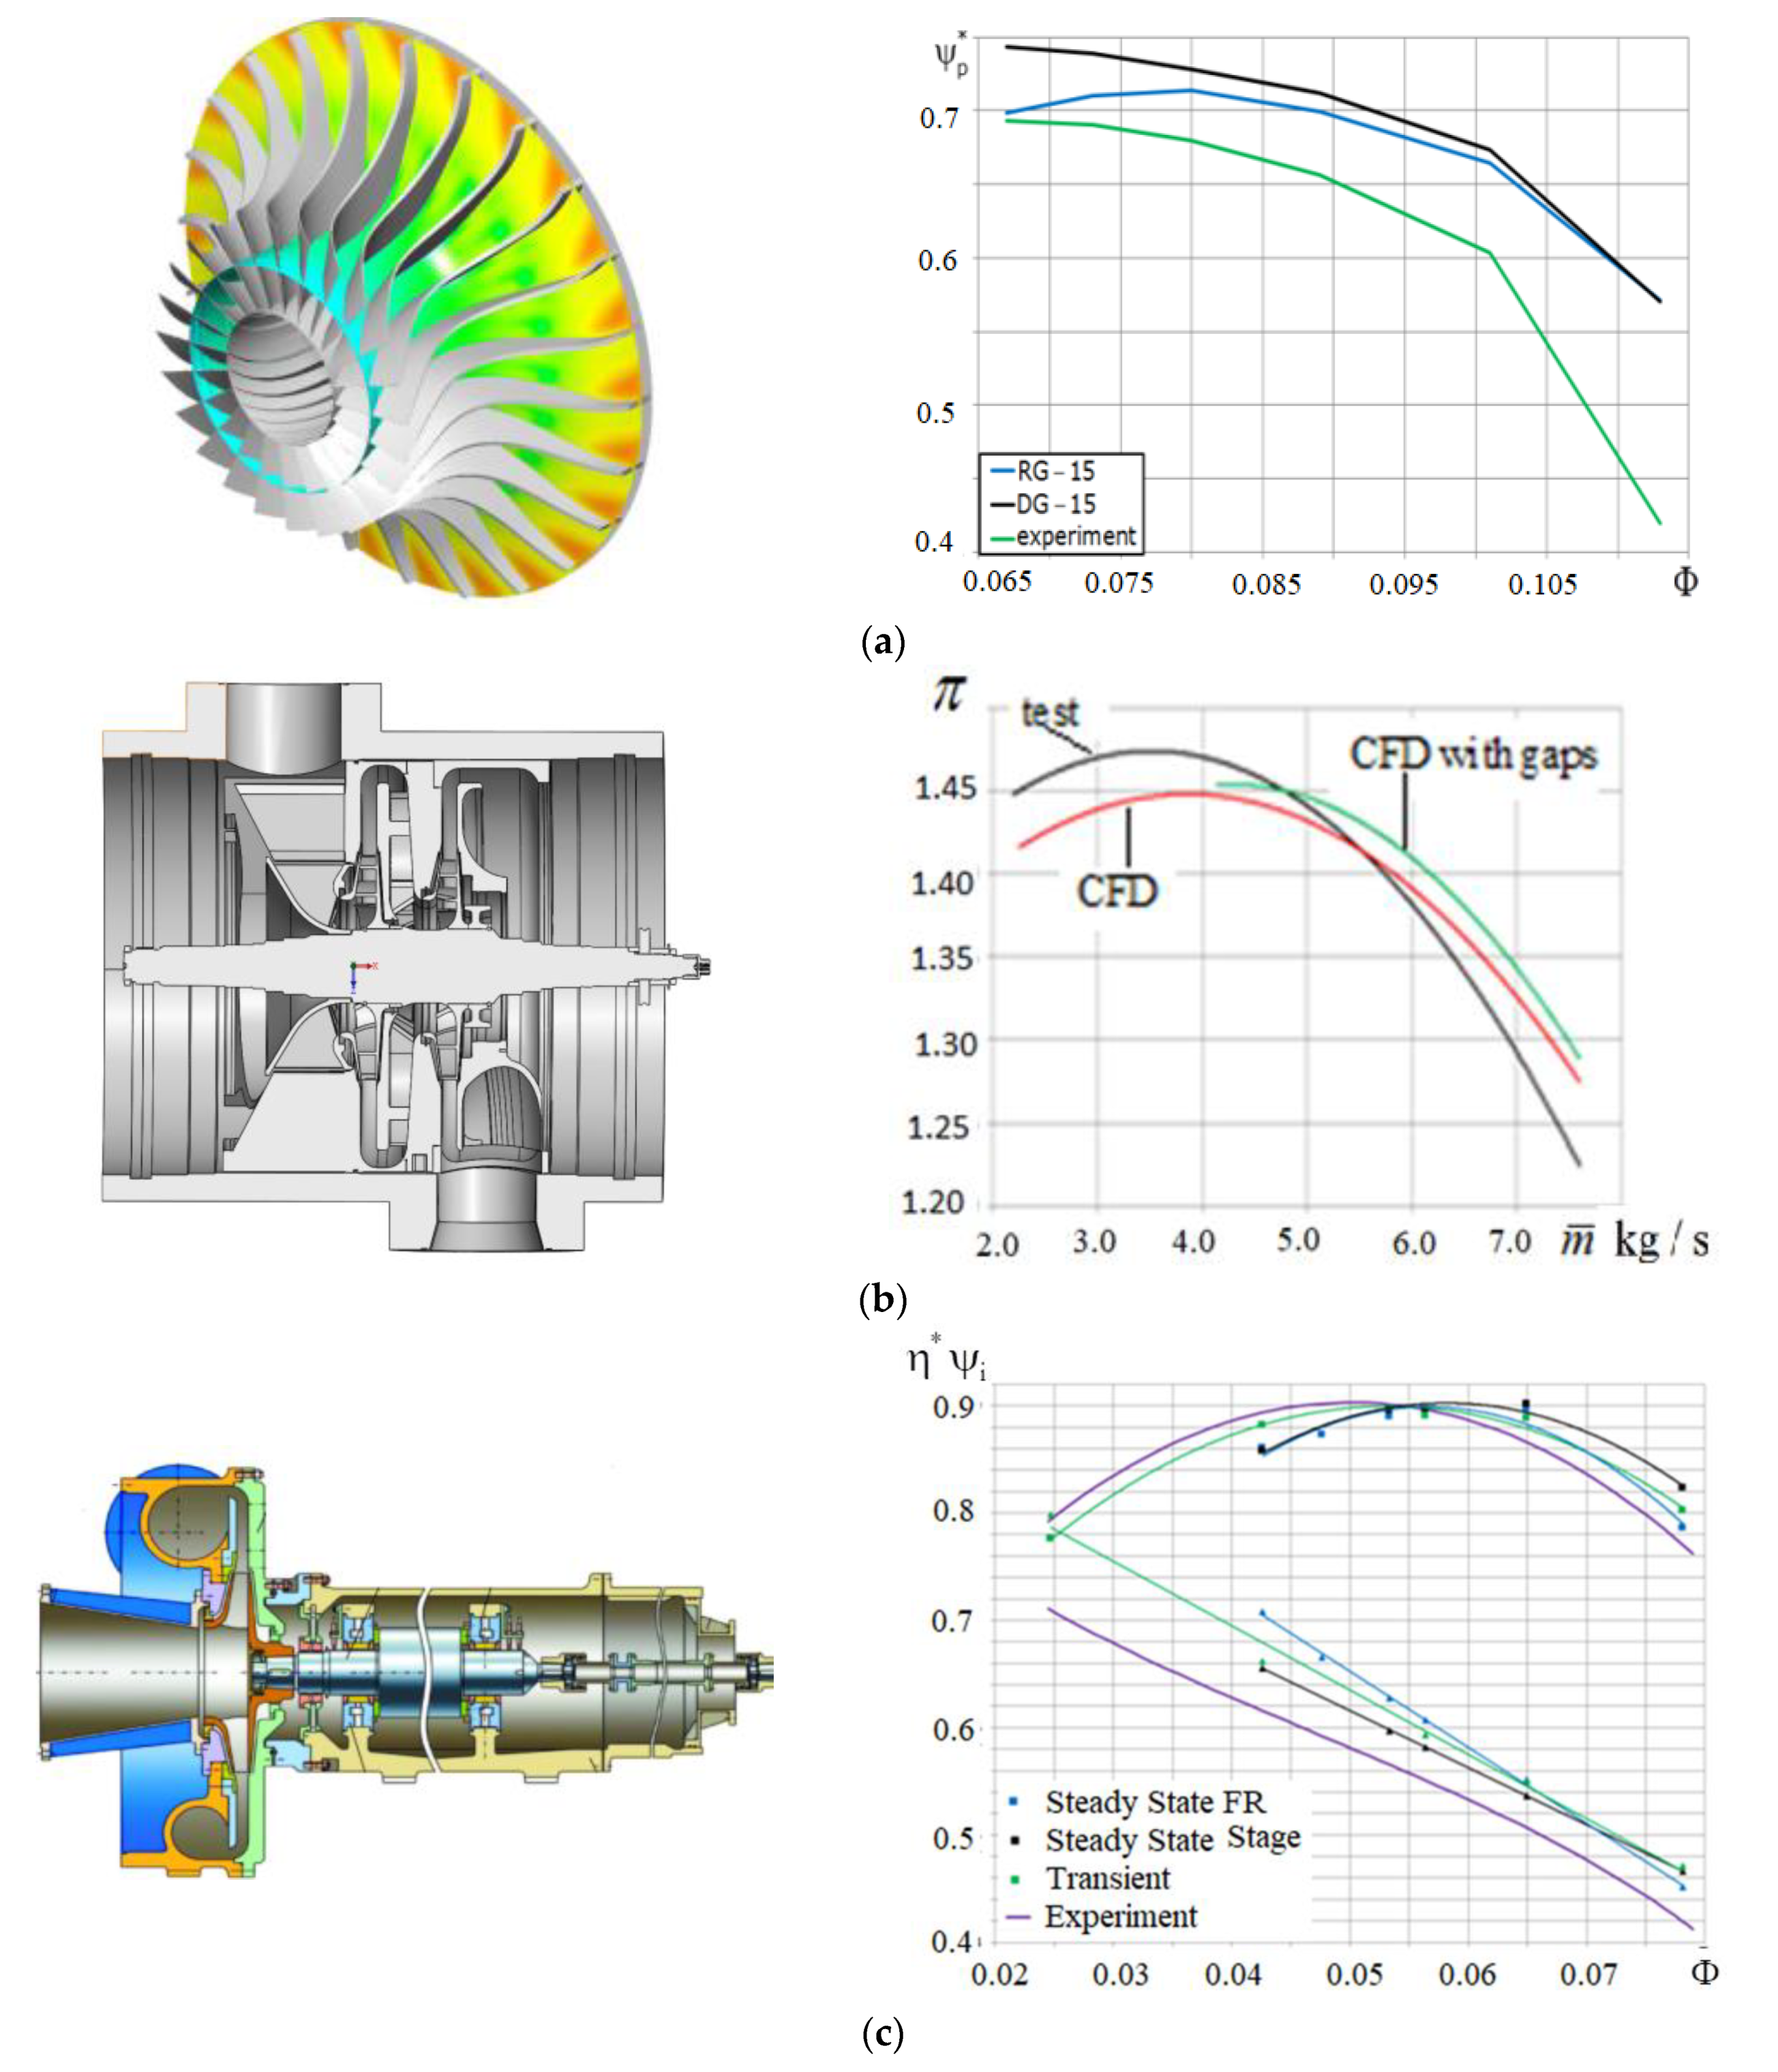
An alternative to engineering methods is computational fluid dynamics programs (CFD calculations). The authors and their colleagues have extensive experience in calculating the characteristics of stages and multistage compressors [8,9,10,11,12]. Commercial packages NUMECA and ANSYS were used. The influence of turbulence models, types and number of mesh elements, and the type of interface were investigated. Calculations were carried out in a stationary and non-stationary setting, with simulation of the flow in the impeller-housing gaps and without taking into account gap losses. Unfortunately, in all cases, the results of CFD calculations of stages and compressors were unsatisfactory. The calculated characteristics were compared with measured characteristics in the course of a plant test or model test. Typical examples are demonstrated in Figure 2.
The impeller in Figure 2 was tested with a vaneless diffuser. The calculated polytropic work coefficient ψ p * = ψ i η * with both types of meshes is much higher than the actual one.
The characteristic of the pressure ratio of the two-stage compressor is calculated without taking into account the impeller–housing gaps (red line) and taking into account the gaps (green line). The calculated characteristics are moved to the region of high flow rates and the calculated maximum π * is much smaller than the measured one.
CFD calculations of the 32 MW single-stage pipeline compressor model were made in a stationary setup with the “stage”, “frozen rotor” interfaces, and in a non-stationary setup. The influence of the interface is significant, but in both cases, the characteristics are moved to the higher flow rates. When calculating in a non-stationary setting, the efficiency characteristic satisfactorily coincides with the experimental characteristic. However, in all cases, the work coefficient unacceptably exceeds the measured value.
The authors of [13,14] also did not achieve the coincidence of the calculated characteristics with the test results. A number of authors report good results from CFD calculations [15,16,17]. The authors of these publications either use packages that are not accessible to a wide range of users or declare significant efforts in the way of using commercial packages without revealing the essence. An impressive example of a fully computerized compressor optimization process is presented in [18]. As the authors rightly point out, in the future, the designer will not require knowledge of the compressor operation. It is only necessary to wait when CFD simulated centrifugal compressor characteristics will become reliable. Now, the authors of this paper actively used CFD to design the flow path stator part [19,20] and for qualitative impeller optimization [21,22].

2. Materials and Methods: Fundamentals of the Physical and Mathematical Models

The UMM is based on the results of experiments with model stages in the LPI [2,23] and the results of factory tests of compressors [24]. The results of measuring the blade velocity diagrams and visualizing the flow in the impellers and stationary elements, and the analysis of gas-dynamic characteristics revealed the following flow features-physical model:
  • Coriolis forces prevent flow separation on hub and shroud surfaces and on the impeller blades’ pressure side at all flow rates;
  • On the impeller blades’ suction side, the flow according to the “jet-wake” scheme takes place at all flow rate regimes in most impellers;
  • Flow separation in the vane diffusers takes place on the vane pressure side in all flow regimes;
  • The velocity diagrams of an inviscid quasi-three-dimensional flow calculated by the method of integral equations in the non-incidence flow regime are close to the measured velocity diagrams. These are the valuable source of information about the flow behavior and the impeller loading factor. Figure 3 presents the results of measurement and calculation of the velocity diagrams of two 2-D impellers with radial cylindrical blades;
  • A decrease in efficiency with an increase in Mach numbers is most dependent on the value of the maximum local Mach number on the impeller blades;
  • The dependence of the loading factor versus the flow coefficient at the impeller outlet is linear.
The main features of the mathematical model are presented below. The mathematical model calculates separately and summarizes three types of losses: loss of surface friction, loss of separation (mixing), and incidence loss. These kinds of losses are calculated separately in an impeller and in stator elements, on suction and pressure sides of blades and vanes, and on shrouds and hubs. The authors [25,26,27] proposed the equations of the math model below.
The calculation of surface friction losses is based on the well-known Prandtl equations for the coefficient of resistance force of hydraulically smooth and rough plates:
c f   h s = 0.0307 Re w 1 / 7 ,   c f   r g = 0.0162 ( k r g l ) 1 / 7
where c f —friction drag force coefficient, the subscript «hs» means hub/shroud, and the subscript «rg» means hydraulically rough.
The influence of the longitudinal and transverse velocity gradient on the drag coefficient c w is taken into account by empirical coefficients:
c w = c f ( 1 + X i F D X i ) ( 1 + X i R o X i ) .
The empirical coefficient X i value depends on their place in equations, R o —conditional Rossby number.
Diffusion factor in case of an impeller is:
F D = 1 w 2 w 31 .
The velocities w s 1 ,   w s 2 ,   w p 1 ,   w p 2 are shown in Figure 4.
The dots show the values of velocities calculated by approximating equations after calculation experiments [22,28]. These values represent the blade shape in the loss equations of the math model.
The influence on the boundary layer of the inertia force directed normal to the surface is taken into account by the dimensionless parameter—the conditional Rossby number R o —introduced by the authors [2]:
R o = 4 w ¯ 1 + w ¯ 2 2 R ¯ b l   ( impeller ) , R o = c ¯ 1 + c ¯ 2 2 R ¯ v a n e ( VD ,   RCh ) .
The model for calculating mixing losses due to flow separation is the equation of sudden expansion losses h ws . e . = 0.5 ( c 1 c 2 ) 0 , 5 . It is accepted that mixing occurs instantly after the flow leaves the blade (vane) row. In this case, the tangential component of the velocity does not change. During the mixing process, only the radial velocity component decreases. The following equation for the mixing loss coefficient follows from the impeller exit velocity triangle:
ζ m i x = X m i x ( w 1 3 w 1 w ˙ s s i n β 2 c r 2 w 1 ) 2 .
To calculate the point of the flow separation position, a equation is proposed that takes into account the influence of normal inertia forces on the boundary layer:
w ˙ s = w s w 1 = X i ( 1 + X i R o X i ) .
The empirical coefficient X m i x in Equation (12) takes into account the difference between the real mixing process and the adopted scheme. The analysis of experimental data [29] has shown that this coefficient is different for impellers with different parameters:
X m i x = X i ( 1 + X i R o X i + X i F D X i ) .
Incidence losses are also calculated by analogy with sudden expansion losses. Upon inlet to the channel with an incidence angle, the flow changes direction, increasing the tangential component of the velocity at a positive incidence angle Δ w u i n c > 0 and decreasing at a negative incidence angle. For the impeller, the incidence loss coefficient is:
ζ i n c = X i Δ w ¯ u 2 2 w 1 2 .
In 3-D impellers, the inlet flow velocity varies greatly along the height of the leading edge. The pressure loss is not the same on different stream lines. To take this into account, the mathematical model is constructed as follows: the flow path is divided into eight blade-to-blade surfaces. For each surface incidence loss, mixing losses and blades’ friction losses are calculated. Friction hub and shroud losses are calculated separately.
At the blade row’s inlet, it is accepted that on each stream line, the flow rate coefficient φ 1 i is the same. Relative inlet velocity to the blades:
w ¯ 1 i = D ¯ 1 i 2 + φ 1 i 2 .
Similarly, the flow angle at the blade row’s inlet and other parameters are determined on each stream line. Further, for each stream line, a one-dimensional calculation is performed from previous versions of the mathematical model.
The process polytropic index between Section 1 and Section 2 depends on the sum of losses on each surface:
η 1 2 = k k 1 λ u 0 2 k k + 1 × × ( i = 1 8 ( ζ f r   b l   i + ζ m i x   i )   w ¯ 1 2 + ζ m i x   b 3 / b 2 w ¯ 1 2 + ζ lim   i = 1 w ¯ 1 i = 1 2 + + ζ lim   i = 8 w ¯ 1 i = 8 2 + i = 1 8 ( ζ i n c   i w ¯ 1 i 2 ) + 2 ψ T ( β l e a k + β f r ) ) / [ T 1 T 0 * ( T 2 T 1 1 ) ]
where λ —velocity coefficient, ψ T —impeller head coefficient, β l k —labyrinth seal leakage coefficient, β f r —impeller disc friction coefficient, and T —temperature.
Equation (3) estimates the efficiency when testing a compressor or stage under the assumption of a constant polytropic index. The actual process proceeds with different polytropic indexes in different elements of the flow path. The mathematical model calculates the process as Figure 5 illustrates.
In early versions of the model, the difference between the test efficiency by Equation (3) and math model-calculated efficiency was not taken into account. Elimination of it and other improvements increased the accuracy of the simulation.
The idea proposed by Y. Galerkin [2] was the basis of the loading factor performance model in early versions of the UMM. The linear character of the function ψ T = f ( φ 2 ) is well proven by experiments [11]. Figure 6 illustrates the new idea of modeling.
The equation for the loading factor follows from the velocity triangle:
ψ T = ψ T 0 φ 2 c t g β T .
The parameters ψ T 0 and β T determine the loading factor characteristic. Empirical equations connecting ψ T 0 and β T with b 2 b 1 , cascade density l t , β b l 2 are presented in [11].
The process of the UMM math models is presented in [26,31]. Different versions of the UMM were successfully used in interests of industry [27,32]. The new series of gas industry 10–25 MW compressors was created [33]. Now, several dozens of compressor designs are realized by Russian and foreign manufacturers. The total compressor capacity after the universal modeling method is more than 5 million kW [21].

3. Results

3.1. The Application of CFD Calculations in Mathematical Modeling

The authors’ experience shows that, in contrast to stages and compressors as a whole, CFD calculations of flow path’s stator elements provide useful information suitable for analysis, optimization, and mathematical modeling [19,20].
In previous versions, the calculation of the pressure loss in a vaneless diffuser was based on the Equation (7). The vaneless diffuser (VLD) was divided into 20 parts. In each part, the continuity and momentum equations were iteratively solved. The VLD model involves eight empirical coefficients being identified.
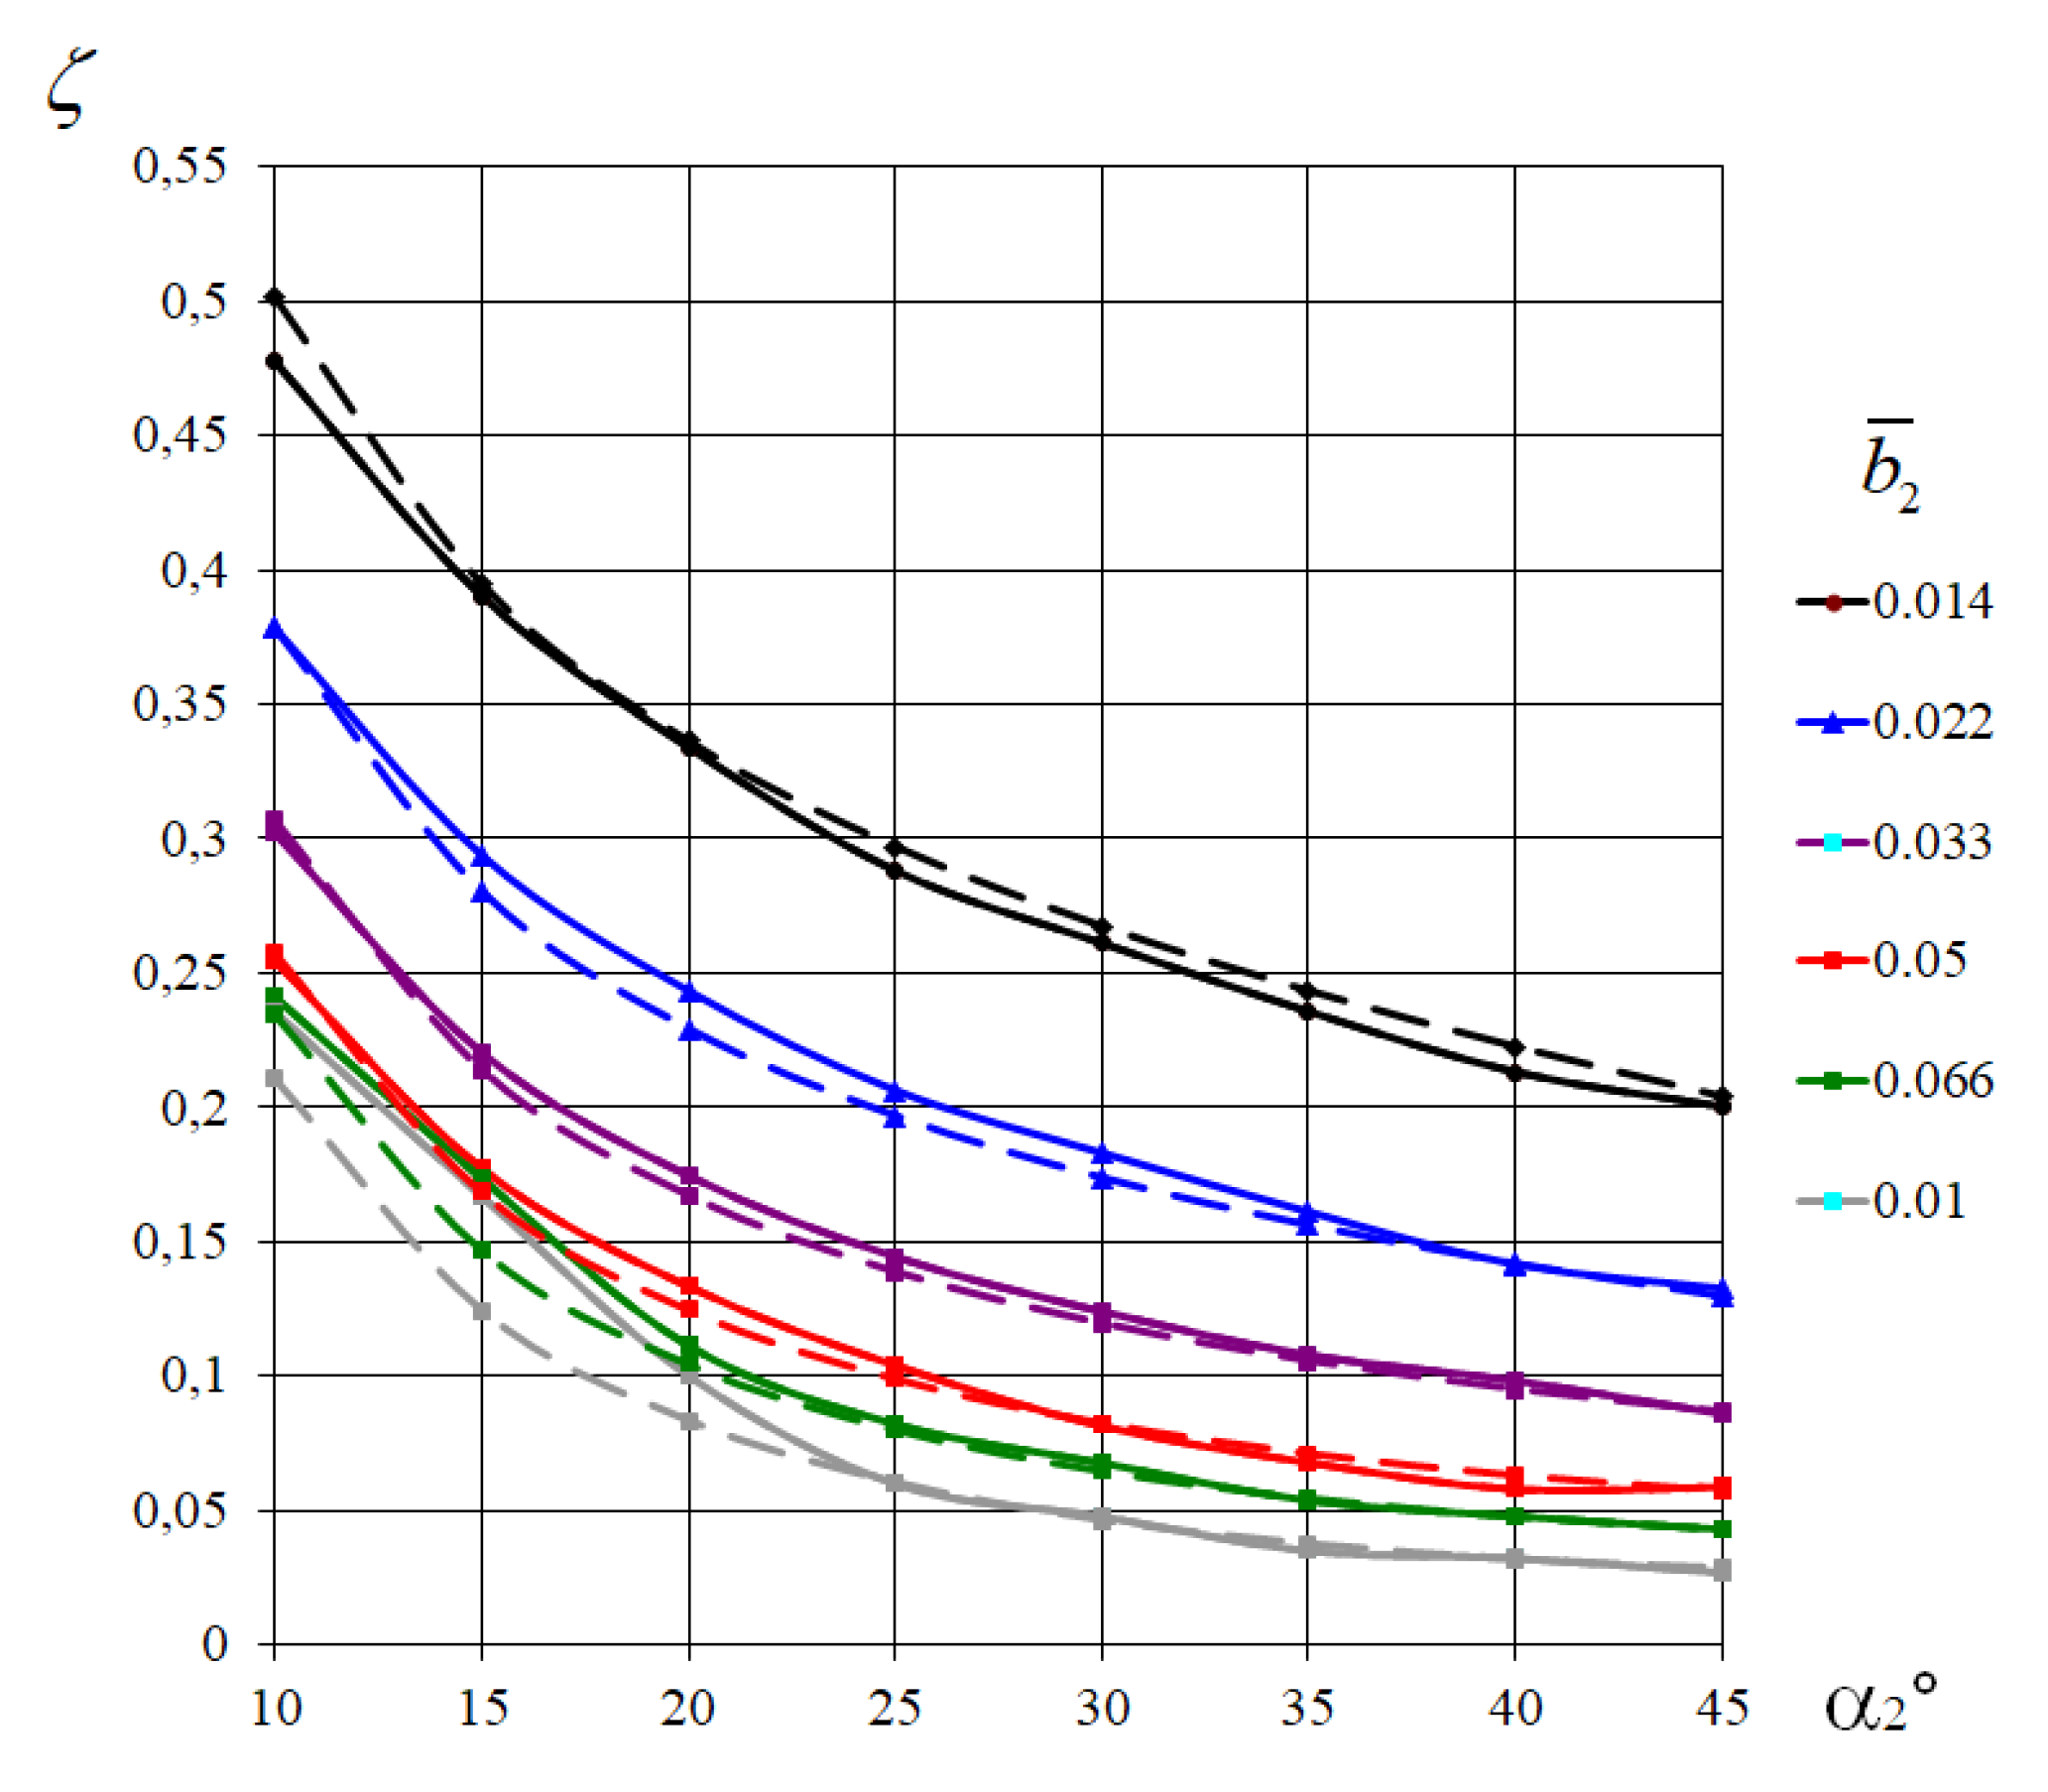
In the modern eighth version, the loss coefficient and exit flow angle is carried out according to the approximated results of CFD calculations of VLD with different relative widths and radial lengths [34]. Figure 7 shows the loss coefficients for CFD calculation and their approximation.
The ANSYS CFX program calculations ζ V L D ,   Δ α = f ( b ¯ ,   D ¯ 4 ,   α 2 ,   λ c 2 ,   Re b 2 ) , Δ α = α 3 α 4 are approximated. The accuracy of the approximation is good. An exception is the VLD loss coefficient with a relative width b ¯ = 0.100, in which an active separation occurs when the flow angle is less than 230. CFD calculations were applied for preliminary design rule formation as well.

3.2. Loss Model Identification

The IDENT program performs an automated search for empirical coefficients Xi, at which the total discrepancy between the measured efficiency of the model stages and their efficiency calculated by the mathematical model is minimal. Identification of the model by the efficiency of the stage as a whole is a principled position. In the agile engineering method [4,5], identification is made according to the characteristics of individual elements of the flow path. It could lead to incorrect results as it is shown in [25]. For instance, in case of the VLD, the loss coefficient characteristic is monotonous as it is shown in Figure 7. The measured VLD characteristic has a minimum at a design flow rate of an impeller that is absurd. Impeller mixing losses occur in a diffuser, but the losses are a consequence of flow separation in the impeller. The measured total pressure at an impeller exit does not reflect mixing losses. Therefore, the measured VLD loss coefficient is overestimated, and the impeller underestimated. An example of the identification results of the eighth model version is shown in Figure 8.
The characteristics presented in Figure 8 show the difficulty of modeling the maximum flow rate by engineering methods, but for industrial compressors, the maximum flow rate is not important. In the main part of the characteristic, the discrepancy between the measured and calculated values of the efficiency is less than 1%.
To verify the set of empirical coefficients, we used the characteristics of the model stages of the company Clark USA (does not exist now). The license on the stages was acquired in the 1960s. Stages with large and medium flow rates of Φ d e s 0.025 are out of date. However, the efficiency of a low flow rate, determined by friction losses in narrow channels, does not depend much on the design method. Figure 9 shows the characteristics of stages of type XXX3-R, XXX3-S, XXX3-T, which were not involved in the identification. The authors consider the verification results to be positive.

3.3. Compressor Candidate’s Comparison. New Version of the Simplified Efficiency Model

Necessary compressor parameters, mass flow and pressure ratio, can be provided with almost uncountable variants of the compressor. The designer has to select the following parameters:
  • The shafts’ number;
  • The shafts rpm;
  • The stages’ number on the shafts;
  • Impellers’ diameters;
  • The number of intermediate cooling;
  • Impellers’ types (2-D radial or 3-D axial);
  • Diffusers’ types (VD, VLD).
The simplified model of efficiency was proposed for stages with design parameters Φ d e s ,   ψ T d e s ,   D ¯ h [35]. The idea of the model is that the design parameters when the universal modeling method is applied determine the flow path’s dimensions, and therefore, the efficiency. The modern version of the model has a similar structure and is verified by calculating the efficiency of a number of modern stages [36]:
η d e s * = 1 X 1 K Φ K ψ T K D h K M u + Δ η V D Δ η i n l
The ability to calculate the efficiency by design parameters allows prompt evaluation of the efficiency and main dimensions of the desired number of compressor candidates.

3.4. Preliminary Design

After choosing a compressor candidate, the preliminary design should be carried out. The aim is to select the flow path’s main dimensions. These dimensions are sufficient for calculating gas-dynamic characteristics. Correction of the flow path to obtain the desired pressure ratio at the desired mass flow rate and the highest efficiency is the subject of further design.
The basics of the preliminary design of centrifugal compressors were equationted by many specialists in decades and are presented in the monographs [2,25,37,38,39,40,41,42,43]. These recommendations are not based on systematic investigations. Therefore, the recommendations are approximate, forcing a designer to show experience and intuition.
In order to make the preliminary design as close as possible to the final design, special studies were performed [44]. By the universal modeling method, 124 impellers were optimally designed in the range of design parameters Φ d e s = 0.015–0.15, ψ T   d e s = 0.40–0.70, D ¯ h = 0.25–0.40.
In accordance with the recommendation [25], the impeller inlet dimensions are selected to minimize the inlet relative velocity. The inlet blade angle guarantees the non-incidence inlet of the critical streamline. This principle appeared to be not effective and was corrected for low-flow-rate impellers with Φ d e s < 0.025. For low-flow-rate impellers, a small incidence can be optimal. In any case, the blade inlet angle must be β b l 1 22.50. The exit angle should not be less than 160. The desired value ψ T d e s is obtained by choosing the relative height of the blades b ¯ 2 . The approximate parameters of optimally designed impellers are contained in four dozen algebraic equations for calculating all sizes and shapes of impellers in the preliminary design.
The main part of the VLD is formed by parallel radial surfaces with a relative distance b ¯ 3 = b ¯ 4 between them. The sizes of a VLD narrowing initial part b 3 / b 2 < 1 is selected to avoid separation in VLD up to the surge margin Φ cr .
The generally accepted definition of the surge margin [17] is the maximum pressure ratio. An empirical estimation of a surge margin is presented in [45]:
Φ c r Φ d e s { 1 [ ψ T 0 ψ T   d e s 1   17 ( 1 η d e s * ) ] 0 , 5 } .
A flow angle at surge margin is:
α 2 c r a r c t g [ φ 2 d e s Φ c r Φ d e s   ψ T 0 ( ψ T 0 ψ T   d e s ) Φ c r Φ d e s ] .
Based on the results of the vaneless diffusers researches by CFD calculations [34], an empirical equation was proposed for the flow angle of the flow separation boundary:
α 3 s b = a r c t g ( 0.0875 + 3.5 b ¯ 3 ) .
Given the above equations, the condition for no separation of the flow is fulfilled with the relative VLD width:
b ¯ 3 = 0.0875 + 0.00766 + 14 t g α 2 c r b ¯ 2 7 .
The preliminary design technique for vane diffusers and return channels is equationted on the basis of the mathematical modeling, design experience, and CFD calculations [19].
The publication [46] presents examples of the preliminary design verification. Criteria for the effectiveness of the preliminary design include:
  • The diagram of velocity should have a favorable character. This means a controlled value of the maximum speed on the blade, a low deceleration on the suction side, and a favorable blade’s load;
  • Inlet blade angles should provide a non-incidence flow inlet;
  • The ratio of the calculated to non-viscid flow loading factors should be ψ T   d e s / ψ T n v 0.93.
Good results of the preliminary design of stages are presented in Figure 10.

4. Discussion

4.1. Optimal Compressor Design. Example No. 1

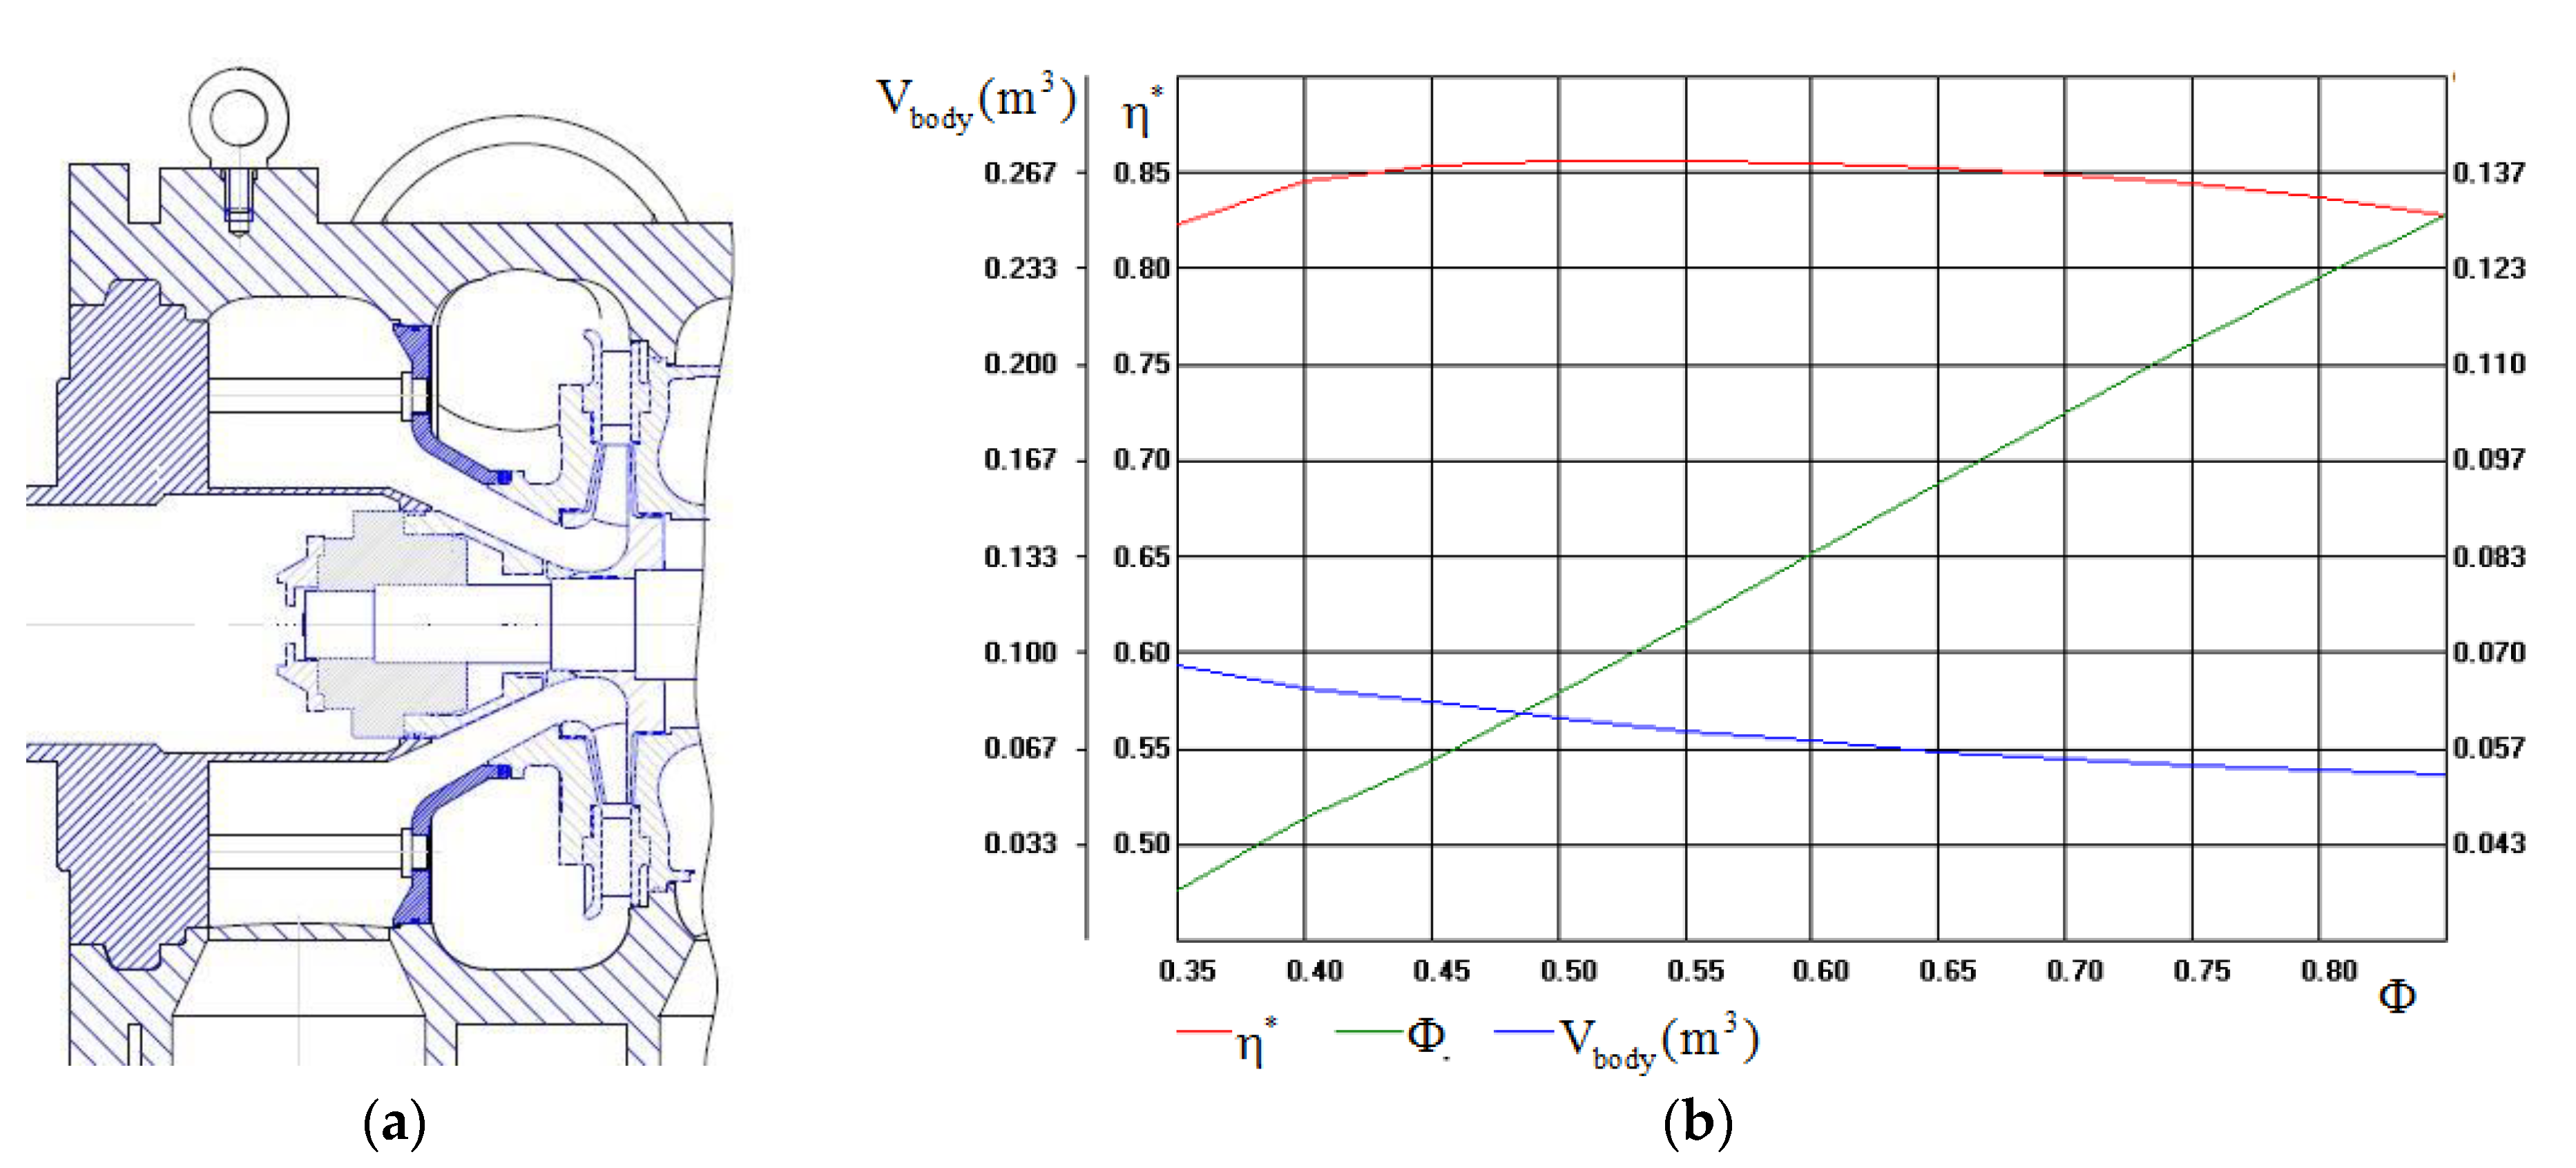
A single-stage centrifugal compressor for a turbo-expander unit was designed for the Turboholod JSC. Figure 11 shows a compressor cross-section, a program menu for preliminary design with compressor parameters, efficiency, and the body volume of variants with different loading factors.
The high hub ratio negatively influences the efficiency. The compressor variant with slightly lesser efficiency and a lesser design loading factor ψ T   d e s = 0.435 was chosen. Though, the selected variant has a wider operating area for lower flow rates. Besides, for the selected variant, the maximum power coincides with the design flow rate. Both are important for compressors with a turbine drive.
For the selected compressor variant, the preliminary flow path dimensions were automatically calculated. The 2-D impeller has blades with controlled velocity diagrams, but compressor manufacturing technology (casting) is adopted as a simpler midline with a circular arc. At the final step of the design process, the diffuser’ vanes were adjusted for a set design parameters. The design and experimental characteristics are shown in Figure 12.
The “air” test results were recalculated to the “gas” conditions and shown by dots in Figure 12. The experimental results confirmed the design level of efficiency. The impeller flow path forms have irregular shapes due to the manufacturing by casting. The pressure ratio has a margin, which guarantees a necessary pressure ratio for impellers whose shape deviates from the design one.

4.2. Optimal Compressor Design. Example No. 2

The authors and specialists of the industrial partner [47] developed the turbocharger compressor for the diesel engine converted to natural gas. A mass flow rate m ¯ = 0.62 kg/s and low value of π * = 1.61 are required. The turbine has 41,000 rpm.
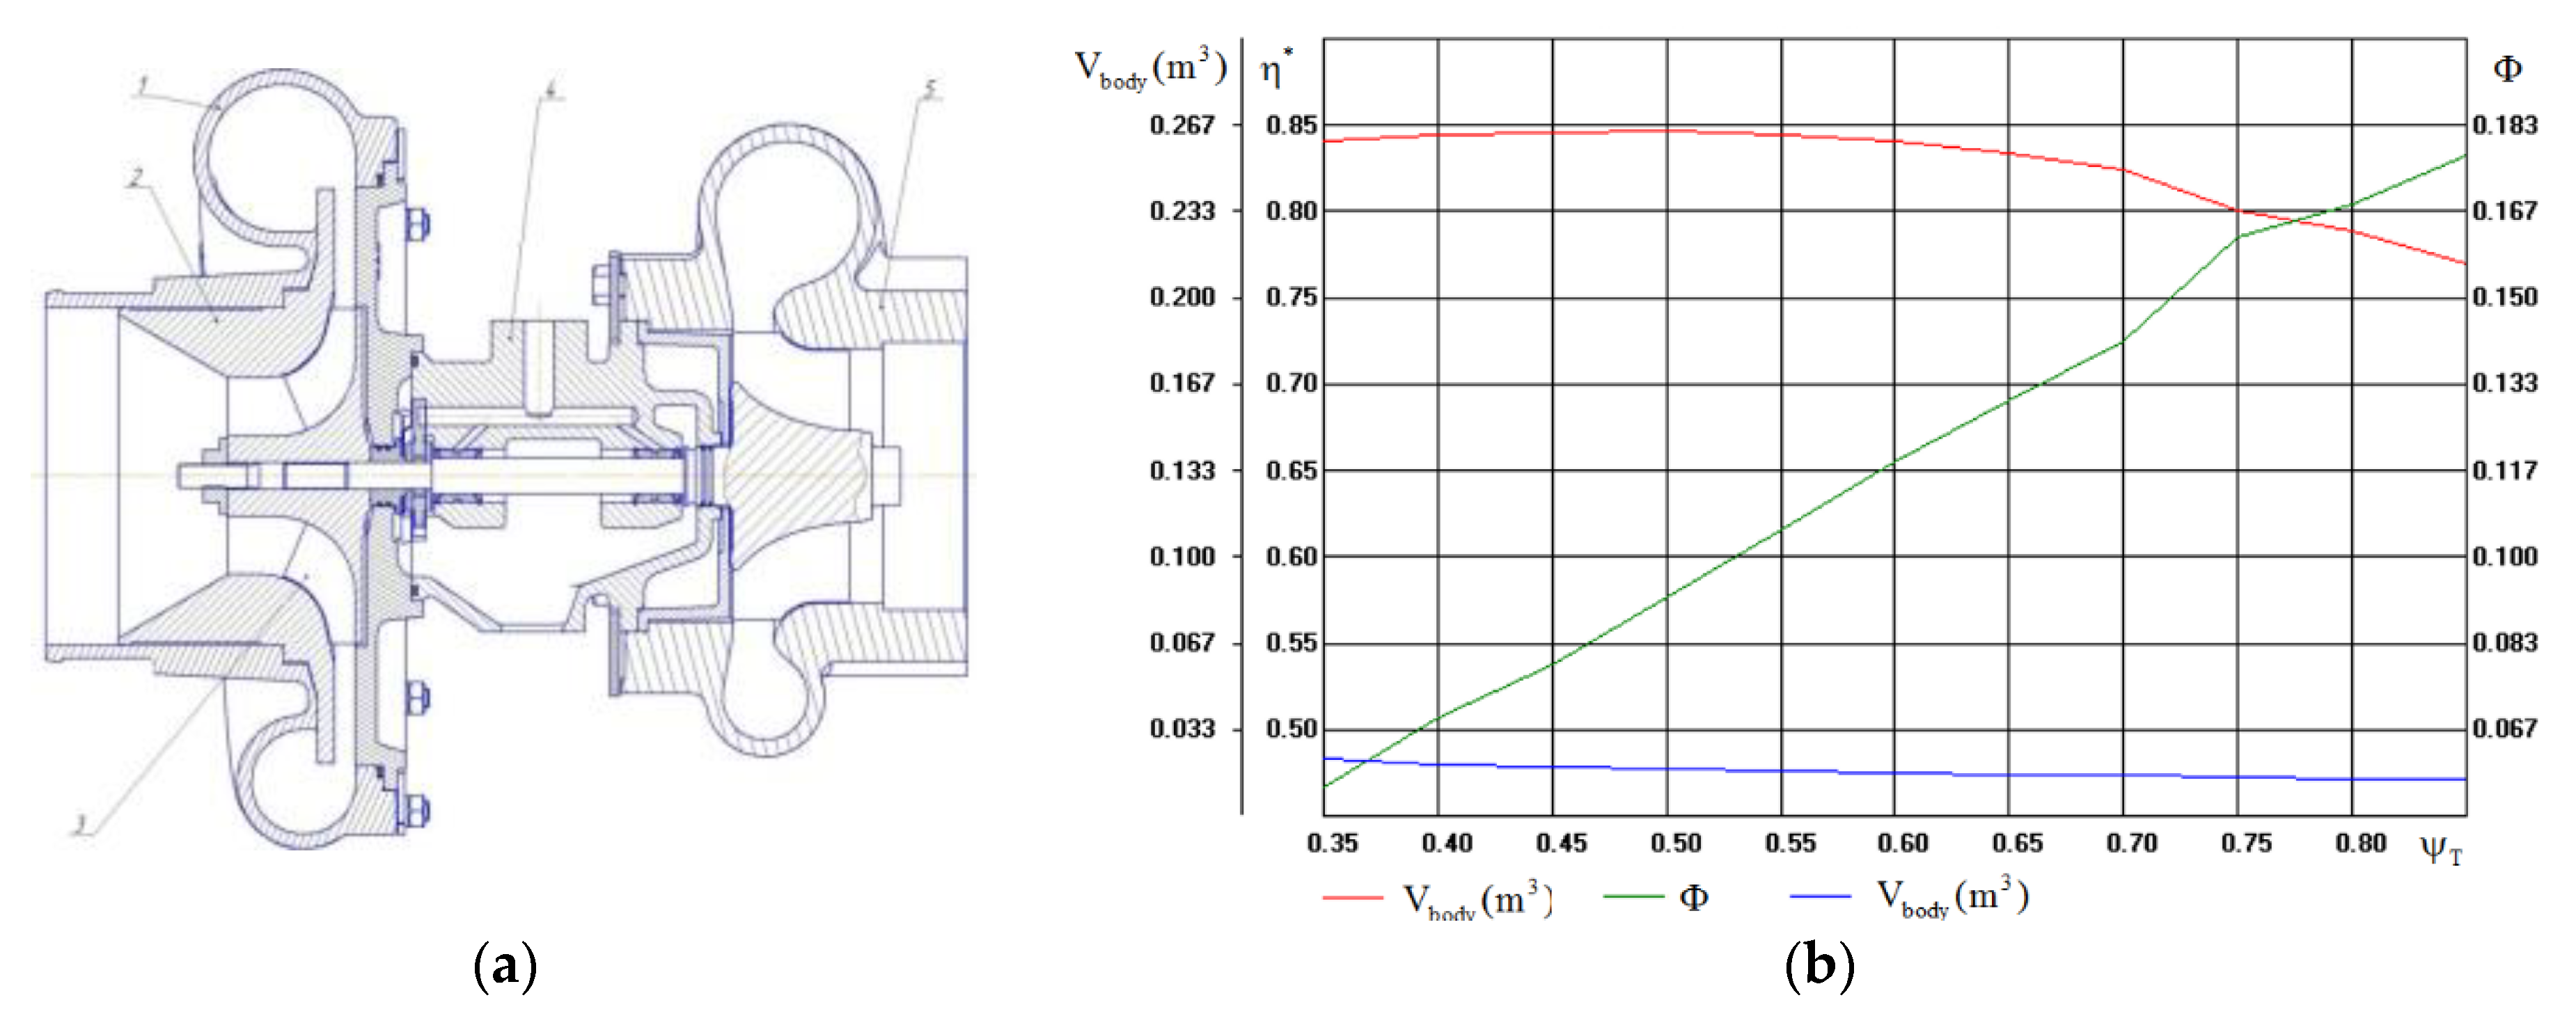
Figure 13 shows the turbocharger cross-section, a preliminary design program menu with compressor parameters, and comparisons of the efficiency and body volume for variants with different loading factors.
A simplified mathematical model recommends an impeller with ψ T d e s = c u 2 d e s / u 2 = 0.50 for maximum efficiency. For this candidate, the peripheral speed is 325 m/s, the diameter of the impeller is 151 mm, and the efficiency has to be equal to 0.847. However, for the final design, the candidate with higher, and ψ T d e s = 0.572 was adopted. The chosen candidate has a peripheral speed of 300 m/s, and the diameter of the impeller is 140 mm. The efficiency of the selected variant is lower by 0.49%. A medium-speed engine has a long service life, so it is better if an impeller has a lower peripheral speed. The designed compressor obtained the name 140E.
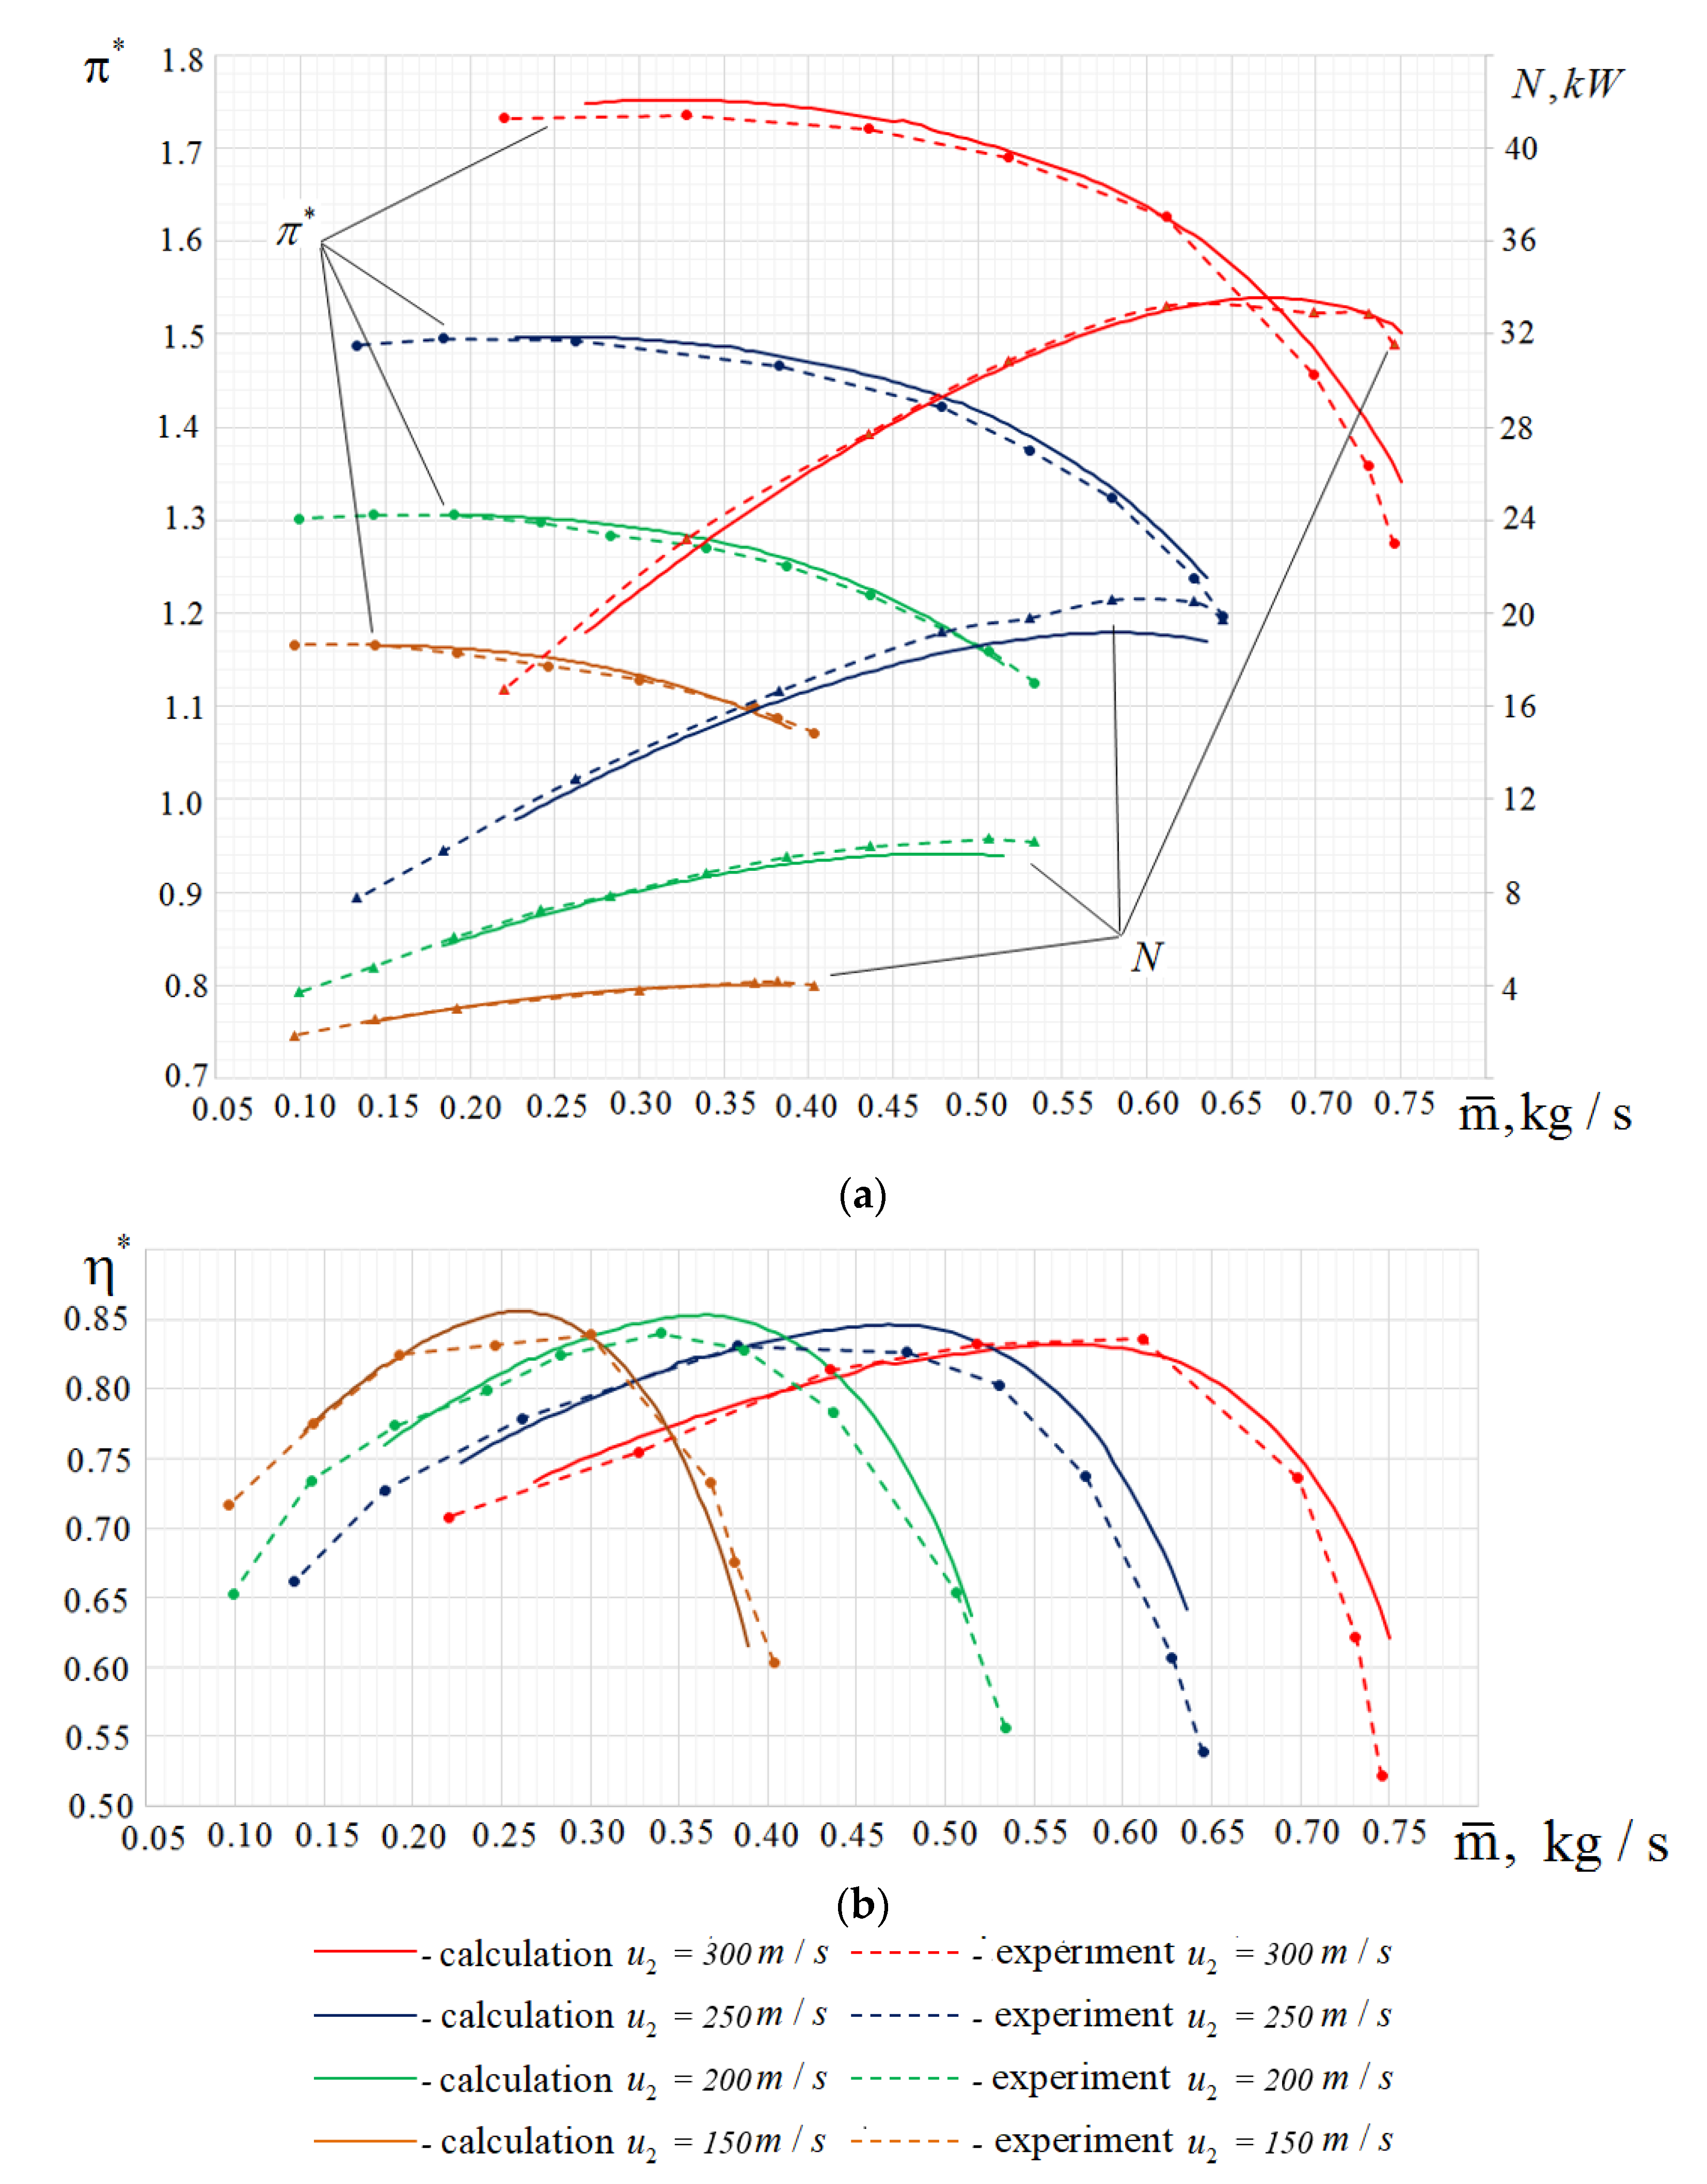
The stator elements of the stage—the vaneless diffuser and the volute—were designed by the industrial partner specialists. The compressor was tested at the partner’s test rig at an impeller velocity of 150–300 m/s. A comparison of the 140E compressor’s characteristics obtained during the experiment and the calculation is shown in Figure 14.
At the design point m ¯ d e s = 0.62 kg/s at u 2 = 300 m/s, the predetermined value of π * is ensured almost exactly. The expected efficiency is confirmed. The pressure ratio and efficiency in off-design modes calculated by UMM are slightly higher, but the measured pressure ratios are greater than the calculated ones. The mathematical model’s empirical coefficients will be refined by new test data.

5. Conclusions

In 1970–1980s, the ideas of universal modeling were firstly equationted and the method was applied to research and design. The first versions were able to calculate the parameters of a compressor at a design point only. There was the opinion then that engineering methods would cease to be relevant after several years in connection with the successes of computational gas dynamics. It was one of the reasons (of psychology nature) why the fourth version for characteristics simulation as a whole were based on several non-obligatory simplifications. Correct design needs several units of empirical coefficients for compressors with different specific speeds as a result. Anyway, three dozen effective process compressors were made by the four version in 1990–2010.
Now, there is even more of a reason for the opinion that CFD will be able to simulate the characteristics of any compressor operating in any conditions. It will be the gas dynamics end, as a technical science. However, the unsatisfactory results of calculating the characteristics of compressor stages by commercial gas-dynamic computing programs have already had a 20-year history in the practice of the authors, and ways out of the situation are unclear. The presented engineering technique (UMM) is constantly being improved based on the results of practical application. The fifth version is able to simulate precisely the compressor parameters at a design point with one unit of empirical coefficients X. Presented in this text are improvements and some others made possible to simulate all characteristics with one set of X. The average accuracy of simulation was <1% for model stages—identification and verification participants. The parameters of two newly designed compressors were predicted well.
Comprehensive studies and CFD calculations of vane diffusers and return channels are being carried out. Based on the research, faster and more reliable mathematical models of these elements of centrifugal compressors will be developed. The authors have a test rig ECC-55. Studies on centrifugal compressor stages with 3-D impellers are planned.

Author Contributions

Conceptualization, Y.G. and A.D.; methodology, Y.G. and A.R.; software, A.D.; verification, V.S. and K.S.; writing—review and editing, O.S., L.M. All authors have read and agreed to the published version of the manuscript.

Funding

Funding for open access charge: Russian Academic Excellence Project 5-100.

Conflicts of Interest

The authors declare no conflict of interest.

References

  1. Galiullin, Z.T.; Salnikov, S.Y.; Shchurovsky, V.A. Modern Gas Transmission Systems and Technologies; Gazprom VNIIGAZ: Moscow, Russia, 2014; p. 345. [Google Scholar]
  2. Seleznev, K.P. Centrifugal Compressors. [text]/K.P. Seleznev. Yu.B. Galerkin//; Publishing House Mechanical Engineering, Leningrad Department: Leningrad, Russia, 1982. [Google Scholar]
  3. PCA Engineers Limited. Available online: http://www.pcaeng.co.uk/software (accessed on 27 June 2019).
  4. Japikse, D. Agile engineering and the restructuring of modern design. In Proceedings of the 40th Israel Annual Conference on Aerospace Science, Tel-Aviv and Haifa, Israel, 23–24 February 2000. [Google Scholar]
  5. Qiu, X.; Japikse, D.; Zhao, J.; Anderson, M.R. Analysis and Validation of a Unified Slip Factor Model for Impellers at Design and Off-Design Conditions. J. Turbomach. 2011, 133, 041018. [Google Scholar] [CrossRef]
  6. Drozdov, A.V. The use of identification methods and multi-mode optimization in the design of centrifugal compressors. In Proceedings of the 19th International Symposium “Consumers-Manufacturers of Compressors and Compressor Equipment”, SPb, Russia, 17–19 June 2015; pp. 69–73. [Google Scholar]
  7. Lunev, A.T. Development of highly efficient replaceable flowing paths of pipeline centrifugal compressors. Dis. Tech. Sci. 2005, 123. [Google Scholar]
  8. Borovkov, A.I.; Voinov, I.B.; Galerkin, Y.B.; Nikiforov, A.G.; Nikitin, M.A. Issues of Modeling Gas-Dynamic Characteristics on The Example of a Model Stage of a Centrifugal Compressor. Scientific and Technical Statements; SPbPU: St. Petersburg, Russia, 2018; pp. 44–57. [Google Scholar]
  9. Borovkov, A.I.; Voinov, I.B.; Rekstin, A.F.; Bakaev, B.V. Modeling the Characteristics of a Two-Stage Pipeline Centrifugal Compressor. Scientific and Technical Statements; SPbPU: St. Petersburg, Russia, 2019; pp. 87–104. [Google Scholar]
  10. Borovkov, A.I.; Voinov, I.B.; Nikitin, M.A.; Galerkin, Y.B.; Rekstin, A.F.; Drozdov, A.A. Modeling the characteristics of a single-stage pipeline centrifugal compressor. Nat. Engin. Sci. 2018, 24, 153–175. [Google Scholar] [CrossRef]
  11. Nikiforov, A.; Popova, D.; Soldatova, K. A network application for modeling a centrifugal compressor performance map. In Proceedings of the IOP Conference Series: Materials Science and Engineering, Bristol, UK, 11–13 September 2017; IOP Publishing: Bristol, UK, 2017; Volume 232, p. 12046. [Google Scholar]
  12. Kortikov, N.; Borovkov, A.; Voynov, I.; Kirillov, A.; Drozdov, A. Erratum to: Simulation of the joint effect of rotor-stator interaction and circumferential temperature unevenness on losses in the turbine stage. In Proceedings of the MATEC Web of Conferences; EDP Sciences: SPb, Russia, 5 December 2018; Volume 245, p. 04019. [Google Scholar]
  13. Babák, M. Effective Computational Procedure for High Pressure Ratio Centrifugal Compressor; TechSoft Engineering: Berlin, Germany, 2009. [Google Scholar]
  14. Prasad, V.V. Centrifugal compressor fluid flow analysis using CFD. Sci. Insights Internat. J. 2011, 1, 6–10. [Google Scholar]
  15. Guidotti, E. Towards Centrifugal Compressor Stages Virtual Testing. Ph.D. Thesis, Università degli Studi di Bologna, Bologna, Spain, 2014; p. 100. [Google Scholar]
  16. Mosdzien, M.; Enneking, M.; Hehn, A.; Grates, D.; Jeschke, P. Influence of blade geometry on secondary flow development in a transonic centrifugal compressor. J. Global Power Prop. Soc. 2018, 2. [Google Scholar] [CrossRef]
  17. Sorokes, J.M. Sidestream optimization through the use of computational fluid dynamics and model testing. Turbomach. Symp. 2000. [Google Scholar] [CrossRef]
  18. Hehn, A.; Mosdzien, M.; Grates, D.; Jeschke, P. Aerodynamic optimization of a transonic centrifugal compressor by using arbitrary blade surfaces. J. Turbomachin. 2018, 140, 051011. [Google Scholar] [CrossRef]
  19. Marenina, L.N. CFD modeling and analysis of the characteristics of the stator elements of the centrifugal compressor stage flow path. Comp. Techn. Pneum. 2016, 3, 27–35. [Google Scholar]
  20. Rekstin, A.F.; Drozdov, A.A.; Solovyeva, O.A.; Galerkin, Y.B. Two mathematical models centrifugal compressor stage vaneless diffuser comparison. In Proceedings of the AIP Conference Proceedings, Omsk, Russia, 26 February–2 March 2018; Volume 2007, p. 030035. [Google Scholar] [CrossRef]
  21. Galerkin, Y.B. The development of the scientific school of turbocompressor engineering LPI-SPbPU Peter the Great. In Proceedings of the International Scientific and Technical Conference, Kazan, Russia, 23–24 May 2017; pp. 19–29. [Google Scholar]
  22. Drozdov, A.A. Design Method for Centrifugal Compressors With 3D Impellers; SPbPU: St. Petersburg, Russia, 2016; p. 236. [Google Scholar]
  23. Proceedings of the Scientific School of Compressor Engineering SPbSTU. [Text]; Yu, B.G. (Ed.) Publishing House AOOT “NPO CKTI”: Saint-Petersburg, Russia, 2000. [Google Scholar]
  24. Galerkin, Y.B. Modeling the Workflow of Industrial Centrifugal Compressors. Scientific Foundations, Stages of Development, Current Status; Monograph, SPbPU: St. Petersburg, Russia, 2011; p. 327. [Google Scholar]
  25. Galerkin, Y.B. Turbocompressors. Workflow, Calculation and Design of The Flow Path; KHT: Gelsenkirchen, Germany, 2010. [Google Scholar]
  26. Galerkin, Y.; Drozdov, A. New generation of universal modeling for centrifugal compressors calculation. In Proceedings of the IOP Conference Series: Materials Science and Engineering, London, UK, 7–9 September 2015; IOP Publishing: London, UK, 2015; Volume 90, p. 012040. [Google Scholar]
  27. Galerkin, Y.; Soldatova, K. Universal modeling method application for development of centrifugal compressor model stages. In Proceedings of the International Conference on Compressors and their Systems, London, UK, 9–10 September 2013; pp. 477–487. [Google Scholar]
  28. Lysyakova, A.A. Improving Programs for Calculating the Characteristics of Centrifugal Compressor Stages Using Generalized Flow Velocity Diagrams of Blades; SPbSPU: St. Petersburg, Russia, 2010; p. 141. [Google Scholar]
  29. Soldatova, K.V. Creation of A New Mathematical Model of The Centrifugal Compressors Flow Path and A Database of Model Stages; SPbSPU: St. Petersburg, Russia, 2017; p. 357. [Google Scholar]
  30. Galerkin, Y.; Drozdov, A.; Soldatova, K. Centrifugal compressor efficiency types and rational application. In Proceedings of the 8th International Conference on Compressors and their Systems, London, UK, 9–10 September 2013; pp. 533–542. [Google Scholar]
  31. Seleznev, K.P.; Galеrkin, Y.B. Mathematical Modelling of Performance Characteristics and Optimization of Turbomachine Stades. In Proceedings of the International Gas Turbine Congress, Tokyo, Japan, 23–29 October 1983. [Google Scholar]
  32. Galerkin, Y.; Rekstin, A.; Soldatova, K.; Drozdov, A. Universal Modeling Method: The Instrument for Centrifugal Compressor Gas Dynamic Design. In Proceedings of the ASME 2015 Gas Turbine India Conference, Hyderabad, India, 2–3 December 2015. [Google Scholar]
  33. Vasiliev, Y.S. New generation high performance centrifugal compressors. Scientific principles of calculation, development of optimal design methods and production development. Sci. Ind. Russia 2000, 10, 78–85. [Google Scholar]
  34. Solovyova, O.A. A Mathematical Model for Calculating the Gas-Dynamic Characteristics and Optimizing the Vaneless Diffusers of Centrifugal Compressor Stages; SPbPU: St. Petersburg, Russia, 2018; p. 162. [Google Scholar]
  35. Popova, E.Y. Optimization of The Main Parameters of Stages of Turbomachines Based on Mathematical Modeling; SPbSPU: St. Petersburg, Russia, 1991. [Google Scholar]
  36. Rekstin, A.; Popova, Y.; Ucehovscy, A. Centrifugal compressor stages efficiency analysis by means of the approximate algebraic equations. In Proceedings of the AIP Conference Proceedings, Omsk, Russia, 26 February–2 March 2018; Volume 2007, p. 030036. [Google Scholar] [CrossRef]
  37. Den, G.N. Design of the Flow Path of Centrifugal Compressors; Leningrad Branch: Moscow, Russia, 1980; p. 230. [Google Scholar]
  38. Riess, V.F. Centrifugal Compressor Machines; Leningrad Branch: Moscow, Russia, 1981; p. 351. [Google Scholar]
  39. Khisameev, I.G. Design and Operation of Industrial Centrifugal Compressors; FEN Publishing House: Kazan, Russia, 2012. [Google Scholar]
  40. Shnepp, V.B. Design and Calculation of Centrifugal Compressor Machines; Publishing house, Mechanical Engineering: Moscow, Russia, 1995; p. 240. ISBN 5-217-01196-3. [Google Scholar]
  41. Aungier, R.H. Centrifugal Compressors: A Stragedy For Aerodynamic Design and Analysis; ASME Press: New York, NY, USA, 2000; p. 320. [Google Scholar]
  42. Cumpsty, N.A. Compressor Aerodynamics; Longman Scientific and Technical: London, UK, 1989. [Google Scholar]
  43. Japikse, D. Effective two-zone modeling of diffusers and return channel systems for radial and mixed-flow pumps and compressors. In Proceedings of the 11th International Symposium on Transport Phenomena and Dynamics of Rotating Machinery, Honolulu, HI, USA, 26 February–2 March 2006. [Google Scholar]
  44. Drozdov, A.A.; Rekstin, A.F. Analysis of the Velocity Charts of the Impellers of Centrifugal Compressor Stages After the Preliminary Design; SPbPU: St. Petersburg, Russia, 2019; pp. 79–91. [Google Scholar]
  45. Galerkin, Y.B. Design issues for the flow of centrifugal compressors of natural gas. Compressor Engineering and Pneumatics in the 21st Century. In Proceedings of the International Scientific and Technical Conference on Compressor Engineering, Sumy, Ukraine, 15–17 September 2004; pp. 166–188. [Google Scholar]
  46. Rekstin, A.F.; Bakaev, B.V. Variant Calculations of Industrial Centrifugal Compressors Based on A Simplified Mathematical Model; SPbPU: St. Petersburg, Russia, 2018; pp. 24–38. [Google Scholar]
  47. Galerkin, Y.B.; Rekstin, A.F.; Drozdov, A.A.; Kaminsky, R.V.; Sibiryakov, S.V.; Turgenev, T.I.; Usenko, A.E. Experience in creating a low-pressure turbocharger for boosting internal combustion engine using the modern version of the Universal Modeling Method. Compres. Techn. Pneum. 2019, 2, 2–10. [Google Scholar]
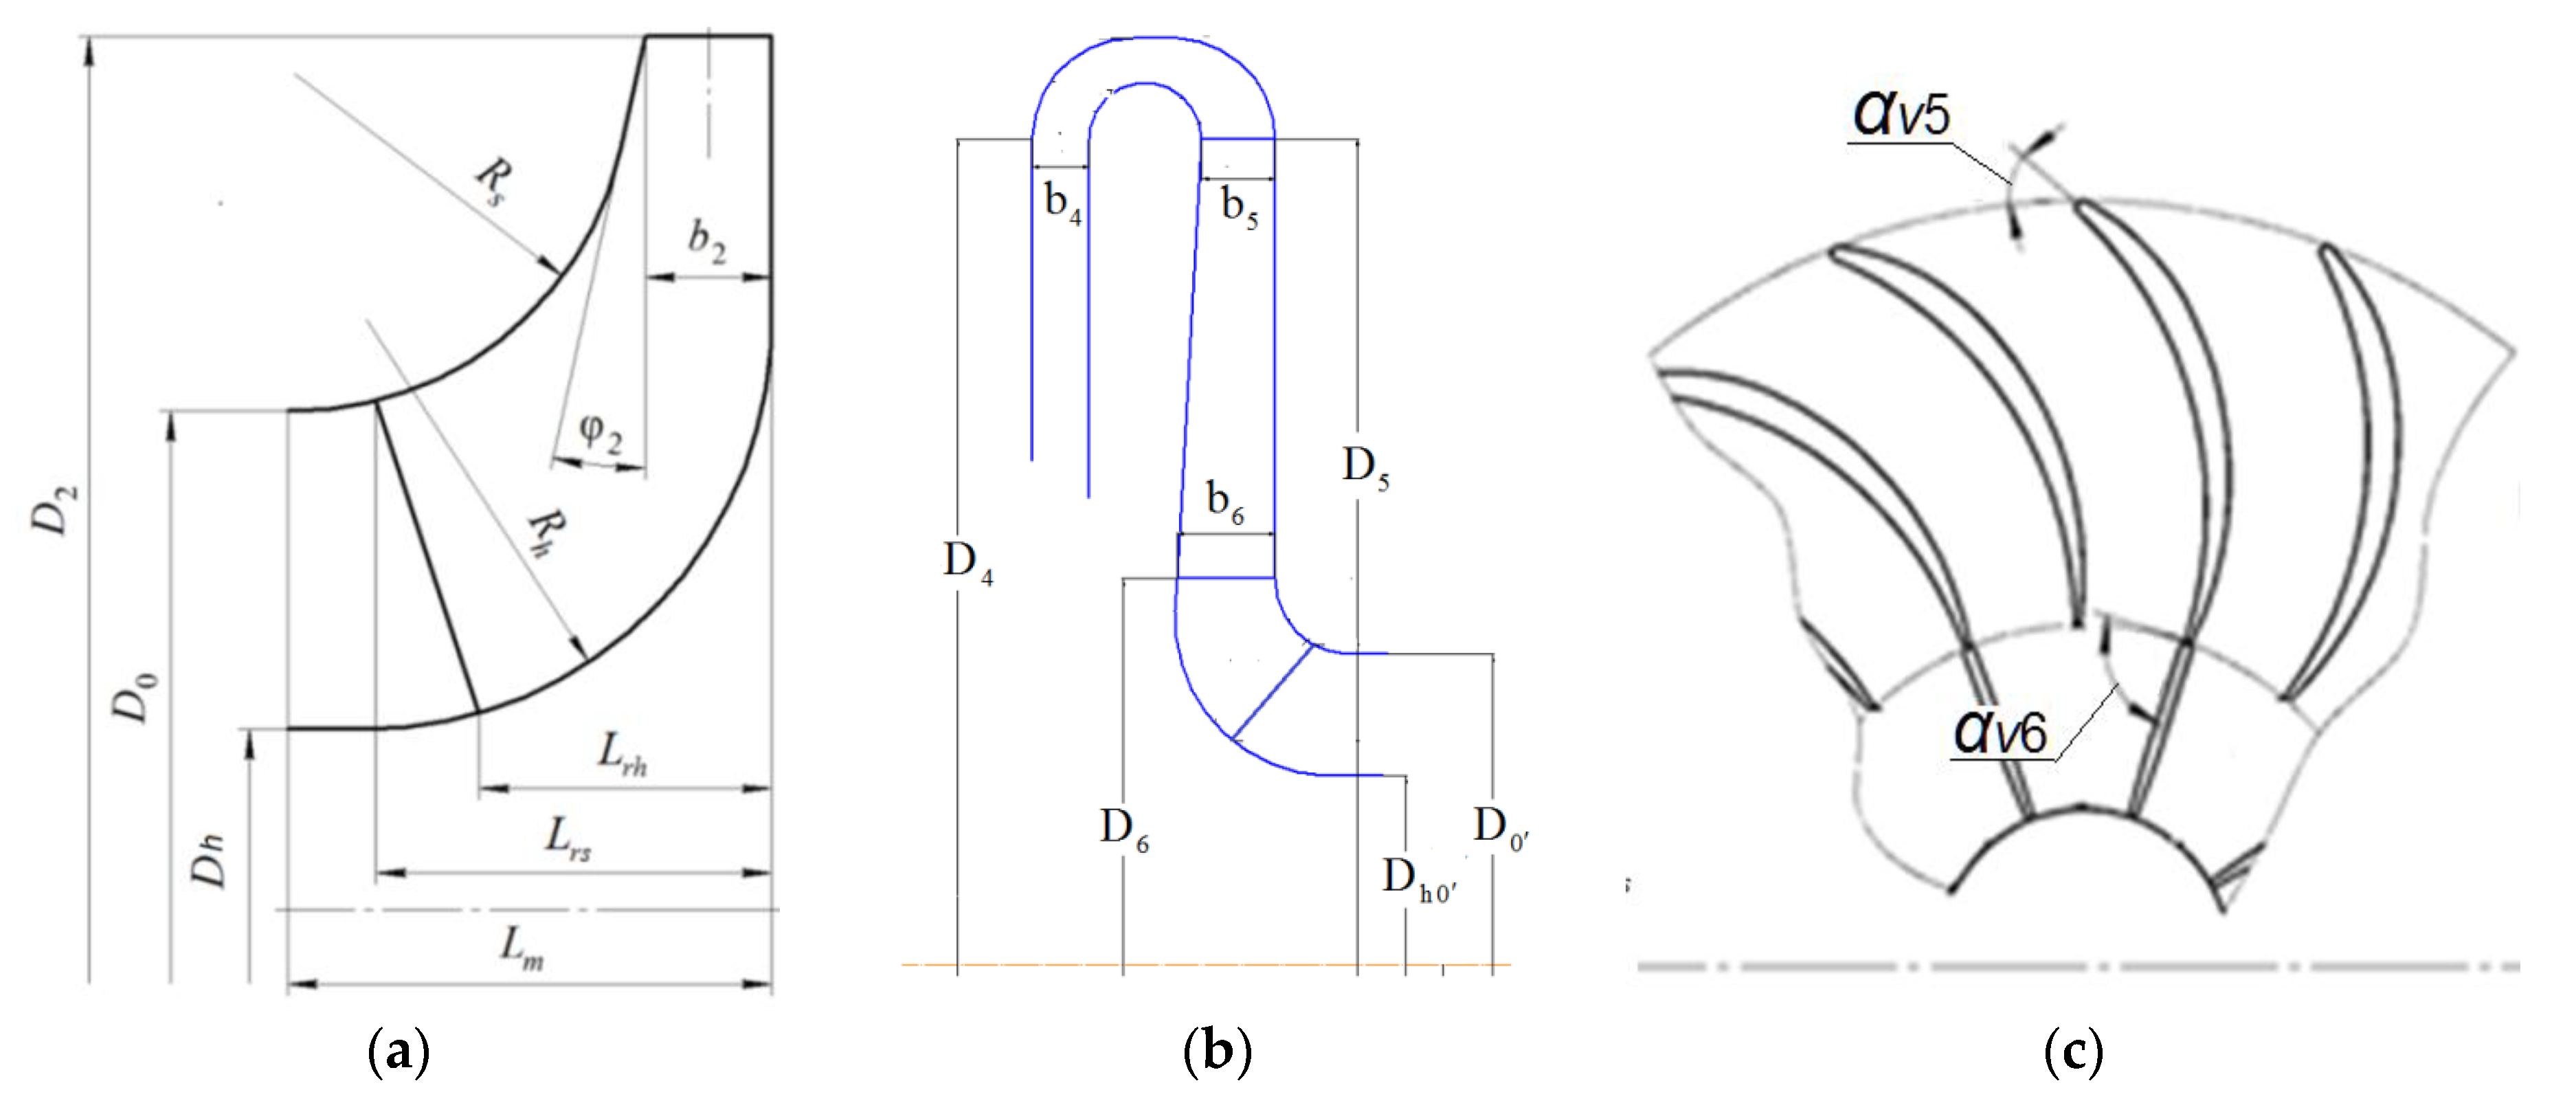
Figure 1. Main dimensions of the stage flow path necessary for characteristic calculation: (a) the impeller, (b) the vaneless diffuser and the return channel, (c) the vane cascade of return channel.
Energies 13 05651 g001
Figure 2. (a) 3-D impeller and its polytropic coefficient characteristics (rare and dense grids, sector 150) [8]; (b) Two-stage compressor 16 MW pipeline compressor unit and its pressure ratio characteristic [9]; (c) 1:2 model of the single-stage pipeline compressor 32 MW and its characteristics [10].
Energies 13 05651 g002
Figure 3. Velocity diagrams on the impeller blades. On the (left) is an incidence angle i > 0 , in the (middle) is non-incidence flow ( i = 0 ), on the (right) is a negative incidence angle ( i < 0 ). Solid lines—measurement, dashed lines—inviscid quasi-three-dimensional calculation (average current surface) [25].
Energies 13 05651 g003
Figure 4. Velocity diagrams on the shroud in the non-incidence flow regime of three 2-D impellers (different design parameters) [28]: (a) Φ d e s = 0.0625, ψ T d e s = 0.575, D h ¯ = 0.28; (b) Φ d e s = 0.068, ψ T d e s = 0.56, D h ¯ = 0.32; (c) Φ d e s = 0.048, ψ T d e s = 0.64, D h ¯ = 0.35.
Energies 13 05651 g004
Figure 5. T S —gas flow diagram of the two-stage pipeline compressor (design flow rate). □—MM calculation, Δ—constant polytropic index [30].
Energies 13 05651 g005
Figure 6. Loading factor performance and velocity triangle with linear dependence ψ T = f ( φ 2 ) [11].
Energies 13 05651 g006
Figure 7. VLD loss coefficients with different relative widths. D ¯ 4 = 1.6 , λ c 2 = 0.64 and Re D 2 = 9.2 10 6 . Solid line—ANSYS CFX, dotted line—approximation.
Energies 13 05651 g007
Figure 8. IDENT program. Characteristics of Compression Engineering Problem Laboratory SPbPU model stages [23] (dashed lines), and their calculated characteristics after identification (solid lines).
Energies 13 05651 g008
Figure 9. IDENT program. Characteristics of the Clark model stages (dashed lines), and their calculated characteristics (solid lines).
Energies 13 05651 g009
Figure 10. Characteristics of a stage series with Φ d e s = v a r . Flow path by the preliminary design. Green—pressure ratio, red—efficiency, blue—work coefficient, orange—polytropic coefficient.The efficiency and the flow rate range of the stages are close to the best values, which indicates a satisfactory quality of the preliminary design.
Energies 13 05651 g010
Figure 11. (a) Compressor for a turbo-expander unit and (b) comparison of compressor variants with different loading factors.
Energies 13 05651 g011
Figure 12. Design characteristics of the turbo-expander compressor and the experimental results.
Energies 13 05651 g012
Figure 13. (a) Section of a turbocharger unit with a centrifugal compressor and a radial turbine, and (b) compressor candidates’ parameters with different loading factors ψ T   d e s = v a r .
Energies 13 05651 g013
Figure 14. Comparison of the 140E compressor’s characteristics obtained during the experiment and the calculation at impeller velocity u 2 = 150, 200, 250, and 300 m/s: (a) gas-dynamic characteristic of total pressure ratio and power; (b) gas-dynamic characteristic of efficiency.
Energies 13 05651 g014
Publisher’s Note: MDPI stays neutral with regard to jurisdictional claims in published maps and institutional affiliations.