1. Introduction
Potable fresh water is not only significant for the consistency of environment and life, but it is also important for industrial and agricultural objectives. Potable water shortage has increased dramatically due to pollutants of water resources (rivers and lakes) via industrial dissipation, and the rapid growth of the global population. According to UNICEF, globally more than 1.1 billion people do not have potable water, and approximately 1000 children die daily because of diseases resulting from undrinkable water. Lack of pure water can make war conflicts in water shortage areas [
1]. Availability of fresh water is acknowledged to be one of the main issues of humankind.
There are some advanced and technologically sophisticated methods to saltwater desalination; viz. multi-stage flash (MSF) desalination, multiple effect distillation (MED) [
2], thermal vapor compression (TVC) [
3], membrane distillation (MD) [
4], reverse osmosis (RO) [
5], and others. These methods consume a high amount of energy and require highly skilled labors and technicians to operate. Many areas of the world lack sources of energy, but they are sunny and receive high amounts of solar radiation through the whole year.
A solar still is a very communal technology that converts brackish and saltwater to potable fresh water. It is easy to manufacture using locally available materials and it needs low maintenance [
6]. Although basin-type solar still is a very attractive and reliable tool for providing fresh water in sunny remote areas, it suffers the disadvantages of low productivity.
All over the world, many researchers have improved designs and presented valuable modifications of a solar still to produce attractive lineaments, and improve its behavior and performance. Much research has been done regarding, for example, single- and double-slope solar still [
7], single slope, double-basin still [
8], fin-type still [
9], rubber and glass balls as a thermal storage material [
10,
11], and an external reflector for solar still [
12]. In addition, researchers have studied the solar still from different angles of investigation and most of these studies have been focused on enhancing the outcome of solar still. Integrating the solar still with other devices such as flat plate collector, solar pond, or use of concentrators has been found to be effective in the enhancement of still productivity, but these methods greatly increase its cost [
13].
It is a big challenge to improve the productivity of still without sacrificing its inherent feature of being a low-cost device. This problem could be overcome to a great extent by optimizing the various factors that influence the solar still performance. This involves the study of modeling mass and heat transfer in the device of solar still. This modeling is then used for revealing the influence of the various geometrical and operating parameters on the design of the solar still. CFD modeling of solar still can help to a great extent in the optimization of their parameters as CFD tools are capable of modeling evaporation and condensation phenomena and also provide freedom to change the parameters at will. It significantly reduces the cost and time involved in conducting a big number of experimental tests for the optimization of individual parameters.
Vaibhav et al. [
14] developed a CFD model and utilized it to raise the performance of the solar still by several parametric analyses. The simulation data have been connected with the experimental results by using constant temperatures for glass, bottom, and collecting surfaces as boundary conditions. The researchers inferred that simulation outcomes were found to be satisfactorily in accordance with the experimental results. Shakaib and Khan [
15] designed and constructed a three-dimensional CFD modeling to study fluid flow caused due to natural convection in a solar still unit. The researchers fixed the temperatures of the absorber and condensing surfaces of the solar still at 300 and 350 K, respectively, and the remaining surfaces were adiabatic. They concluded that a major flow recirculation region along with high velocity zones in the top as well as in the bottom portions was observed. Due to these high velocity zones, shear stress increased on the top and bottom walls. The CFD results were evaluated against the experimental results and a reasonable agreement was found. Rahbar and Esfahani [
16] investigated a two-dimensional CFD simulation appreciating the hourly productivity of a single slope for the solar still. Furthermore, a new equation depending on the Chilton–Colburn analogy was suggested to evaluate the yield of the solar still. The results indicated that there is satisfactory conformity with the data of the well-renowned models (especially the Chilton–Colburn relation).
From investigating the previous numerical research for the simulation of solar still, it can be inferred that the temperatures of the glass condensing cover and saltwater could not be calculated, but they were taken from measurement and fed to the simulating model as input data. Subsequently, the main purpose of the current research was to develop a CFD model, which could be used for predicting the performance of the solar still without using any experimental measurements, depending on the CFD solar radiation model. Thus, a three-dimensional, multi-phase CFD model was developed with the aid of ANSYS FLUENT R15.0 Workbench. Furthermore, performance evaluation of conventional basin-type solar still design is presented using the experimental results for the sake of comparison with the predicting simulated result. Condensing glass cover and saltwater temperatures and outcome productivity of potable water from the simulation output were compared with the actual results.
2. Experimental Setup
The basin-type solar still, single-slope solar still (SSSS) consisted of an airtight basin, manufactured from galvanized iron material with dimensions of 1000 × 1000 mm, which held the saltwater. To avoid the saltwater spilling outside the basin to the condensate duct and the contact of this duct with the saltwater and with the condensing glass cover, the elevation of the frontal vertical side of the still was set at 100 mm, while the elevation of the high vertical side was set at 525 mm. The top of the condensing cover was made of window glass with a thickness of 3 mm. It was fixed to the top of the still vertical walls with silicon rubber glue along all the perimeter sides of the glass. The slope angle of the still cover was 23°. The inner surface of the base of the still basin was painted black in order to enable absorbing the largest amount of solar radiation. The other interior faces (back, front, and two side walls) of the still were painted with white paint to enhance the reflection of solar radiation to the basin water the base. The frame of the still was made of wooden sheets. An insulating layer of 50 mm thickness also made of wooden chips was used to decrease the amount of heat lost from the still to the atmosphere, and this layer was placed in the space between the still outer frontal, back, and side wall, and the wooden frame interior.
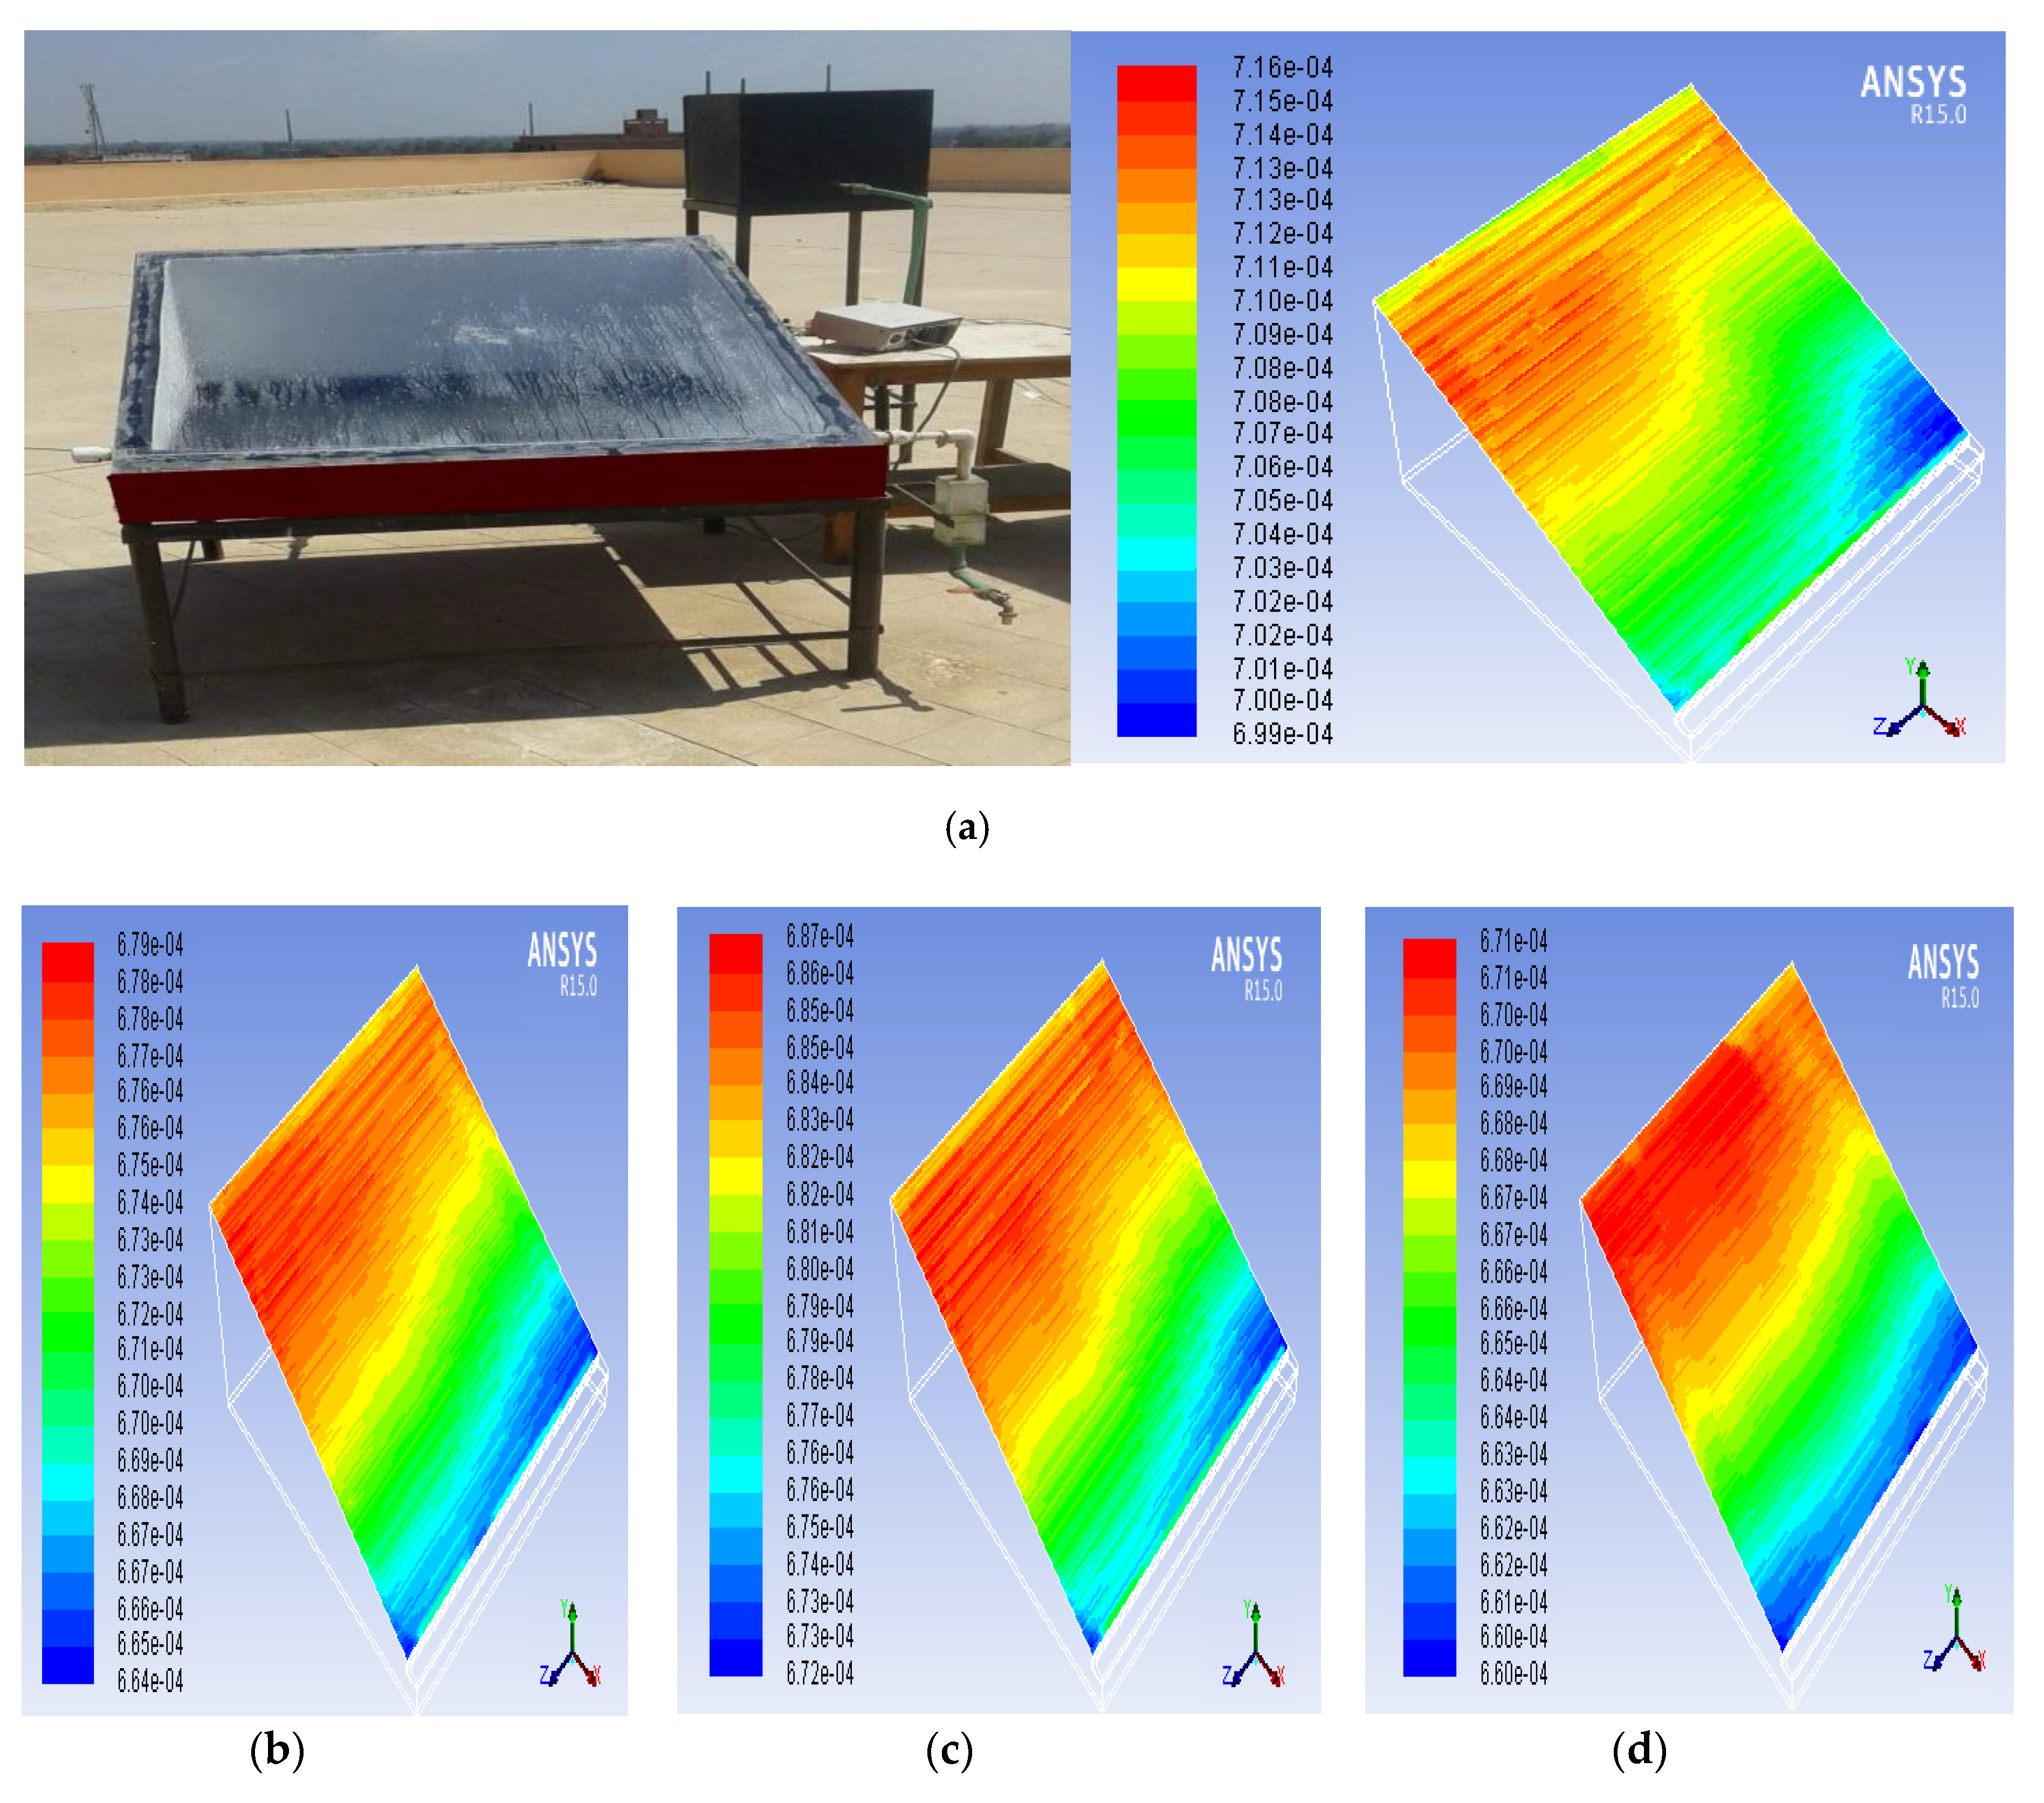
Figure 1 shows an illustrative section of the SSSS considered in this study while
Figure 2 shows a photograph of the still. The solar radiation passed to the still through the condensing glass cover. The black basin base absorbed the solar radiation. Water started to heat up and the wetness content of the air inside the still was increased. The heated air and water vapor rose toward the cooler glass cover where they came in touch with it, and became cooler where some of the water vapor condensed on the inner surface of the cover. Condensed water dripped down the inclined condensing glass cover to an inner gathering trough put in the lower inner edge of the glass cover to gather the condensate. The condensate of potable water was collected in the channel and was constantly drained by a hose and stocked into an external measuring jar. A hole in the side wall allowed for the insertion of the calibrated (Chromel–Alumel (type-K)) thermocouples for the measurement temperatures of the inner glass cover, water vapor, and basin water at different points.
The current experimental investigation was performed using the manufactured solar still in the laboratory of solar energy of the Mechanical Power Engineering Department, Faculty of Engineering, Menoufia University at Sheben El-Kom (latitude of 30.5° N and longitude 31.01° E), Egypt. Experiments for predicting the performance of the still were carried out during June 2018. The solar still configuration under test was directed towards the south direction to get the largest possible amount of solar radiation during the test period. In addition, the test run was started at a local time of 07:00 AM, and continued until 20:00 PM. The comparative solar still performance was tested at the maintained constant water depth of 2 cm. The experimental tests were carried out across ten days and the experimental measurements of the most clear test day of 14 June 2018 were considered. If there were no clouds, the maximum deviations between the days would not increase by 2%, depending on the leakage of the device.
Experimental Uncertainty
Some uncertainties may stem from instrument selection, calibration, environment, and reading. The measured uncertainty values of the instruments were considered as plus or minus (±) half the smallest scale division. For each solar still, the following parameters were measured each hour: The global solar radiation and distillate yield, as well as the temperatures of the inner glass cover surface and the water. On measuring these parameters, the uncertainties, which may occur, are presented in
Table 1. All values were small compared to the data obtained and found to be within the allowable range of the devices’ measurement.
3. CFD Modeling
3.1. Geometry Creation and Meshing Details
The first step in the CFD analysis of any problem is the creation of the geometric model of the problem domain as per the design specifications. The problem domain considered here is the space confined by the surface of the saltwater in the still basin, side walls, front and back and the transparent cover of the still. A 3D geometry of the conventional basin-type solar still was created by ANSYS Workbench, which provided a design modeler as a design tool to develop the geometric models of the physical problem domain.
Figure 3 shows the geometric model of the solar still with the same dimensions of the designed experimental model.
Since the geometry of the basin-type solar still does not involve any type of curved surfaces, the CutCell method of meshing was the most suited for the considered problem, and could provide accurate results with moderate computation time required with the help of ANSYS, Canonsburg, Pennsylvania, United States, fluent workbench MESHING, as seen in
Figure 4. The total number of nodes and elements in the meshed domain were 1,535,520 and 1,465,261, respectively, which were enough from the point of view of the complexity of the problem at hand.
After generating the mesh, it was essential to test the mesh quality because it could affect the accuracy of the solution to a great extent. There were several parameters available with ANSYS Workbench for checking the quality of the mesh. Some of the significant parameters were element quality, skewness, aspect ratio, orthogonal quality, etc. In this study, these parameters were checked.
As per the skewness criteria, an element with a skewness value of zero was considered as the perfect element, while the elements with skewness values greater than zero were not considered to be the good quality elements. An element with a skewness value of 1 was, in general, considered to be an unviable element. In a well-meshed domain, there had to be very few or a negligible number of elements with a skewness value equal to 1. The average value of skewness had to always be less than 0.3 for a good quality mesh.
Figure 5 shows that most of the elements have skewness values less than 0.1.
Similarly, aspect ratio was also a parameter for the assessment of the quality of a generated mesh. For 3D elements, the aspect ratio was the magnitude of the stretching of a cell, and was defined as the ratio of the extreme quantity to the least quantity of any of the next distances: The normal spaces among the center of the cell and the center of the face, and the spaces among the center of cell and nodes. The average value of the aspect ratio for a perfect quality mesh had to be lower than 2.
Figure 6 shows that most of the elements had a value of an aspect ratio less than 2. This indicates that the generated mesh, which had mostly hexahedron elements, was a good quality mesh from the point of view of skewness as well as the aspect ratio.
3.2. Assumptions for Simulation
In constructing the CFD simulation modeling, some assumptions had to be considered, as follows:
There was no thermal energy generation source inside the still;
As the ambient wind velocity was low, the effect of wind velocity was neglected and only free convection was taken into account;
Only film condensation type was happening in exchange for drop condensation type;
No leakages occurred in the system. In addition, the bottom and side walls of the still were insulated; hence, they were considered adiabatic;
The water level inside the basin was kept constant and heat conveyance by inlet and outlet saltwater masses were negligible;
As temperatures variation was low, the fluid properties like density, thermal conductivity, specific heat, and viscosity were taken as a piecewise-linear profile with temperature, while the physical properties of walls were taken as constant;
There was no gradient in temperatures through the glass cover and basin water of solar still.
3.3. Energy Balance for Passive Single-Slope Solar Still
The heat balance equation for the saltwater inside the basin may be expressed as:
where
G is the global incident solar radiation intensity on a horizontal surface, (W/m
2);
is the specific heat capacity of saltwater, (J/kg K); and
is the mass of the salt water contained in the still basin, (kg).
The heat balance equation for the glass cover may be written as:
where
is the specific heat capacity of the glass cover, (J/kg K); and mg is the mass of the glass cover, (kg).
,
, and
can be determined as described briefly in the literature [
17,
18].
Besides the above-mentioned equations, the differential equations describing heat and mass transfer of the wet air inside the cavities of the studied domains for the unsteady state condition and used in the developed CFD models were based on the continuity, momentum, and energy transfer conservation principles.
3.3.1. Energy Equation
The energy equation for the mixture is given below [
14]:
where
Keff is the effective conductivity.
3.3.2. Continuity Equation
The continuity equation for the mixture is:
where,
is the mass-averaged velocity:
3.3.3. Momentum Equation
The momentum equation for the mixture can be attained by adding each of the momentum equations for all the phases. It can be expressed as:
ANSYS FLUENT supplied a solar load model that could be utilized to determine radiation influences from the sun’s rays that come in a computational domain. Two options were obtainable for the model: Solar ray tracing and discrete ordinates irradiation. The ray tracing approach was an extremely effective and practical means of applying solar loads as heat sources in the energy equations. For optical thickness greater than 3 mm, the Rosseland model was more effective. In this case, the Rosseland radiation model with the solar loading and solar ray tracing was used [
19]. This model allowed us to calculate the intensity of the incident of solar radiation on a surface, as well as the ambient temperature when the latitude and altitude of the application site were given.
3.4. Boundary Conditions and Types for the Model
Defining the proper boundary conditions and types was essential for the accurate solution for a fluid flow problem. Most of the boundary conditions were established by the physical phenomena. However, some were established by the simulation ANSYS software.
Table 2 displays the boundary conditions and types for the different parts of the studied domain.
The selection of boundary conditions is an important step in CFD simulation. Any CFD tool solves the various equations involved in the modeling on the basis of constraints put by the boundary conditions. The real or physical boundary conditions are idealized and simplified in order to put them in the simulation. For instance, in this study the side walls of the solar still, which were insulated, were considered to be adiabatic.
3.5. Selection of Models and Constants for Simulation
The models and operating parameters used for the simulation of multiphase basin-type solar still of FLUENT solver are given in
Table 3.
After giving inputs parameters, the solution was initialized. The time step for the iterations was set equal to 0.001–1.0 s depending on the ease of convergence and time required to complete the simulation.
4. Results and Discussion
Unsteady simulation of the conventional basin-type of single-slope solar still was carried out for 14 June from 07:00 to 20:00 with a water depth of 2 cm.
Figure 7 displays the global intensity of solar radiation for the simulated and measured data. Referring to
Figure 7, the results indicate that similar trends and good agreement among the simulated results and measured results for the global solar radiation intensity were observed throughout the day (the maximum difference amounted to 12.7%). It can also be notice that the solar radiation was increased gradually with the local time and reached maximum values at the noon period according to the weather conditions, and then it decreased for both the simulated and measured data. Thus, the Rosseland radiation model, solar loading, and solar ray tracing using a solar calculator was a suitable model for predicting the intensity of the solar radiation of the location depending on the latitude, longitude, daytime, and directions of the solar still (orientation).
As the solar radiation was absorbed by the still base, the saltwater above it became heated and evaporated. Because of the variation in temperature among the saltwater and the condensing glass cover, water condensation on the condensing cover took place. Gravity forced the water droplets to slide down and be collected in a distillate channel.
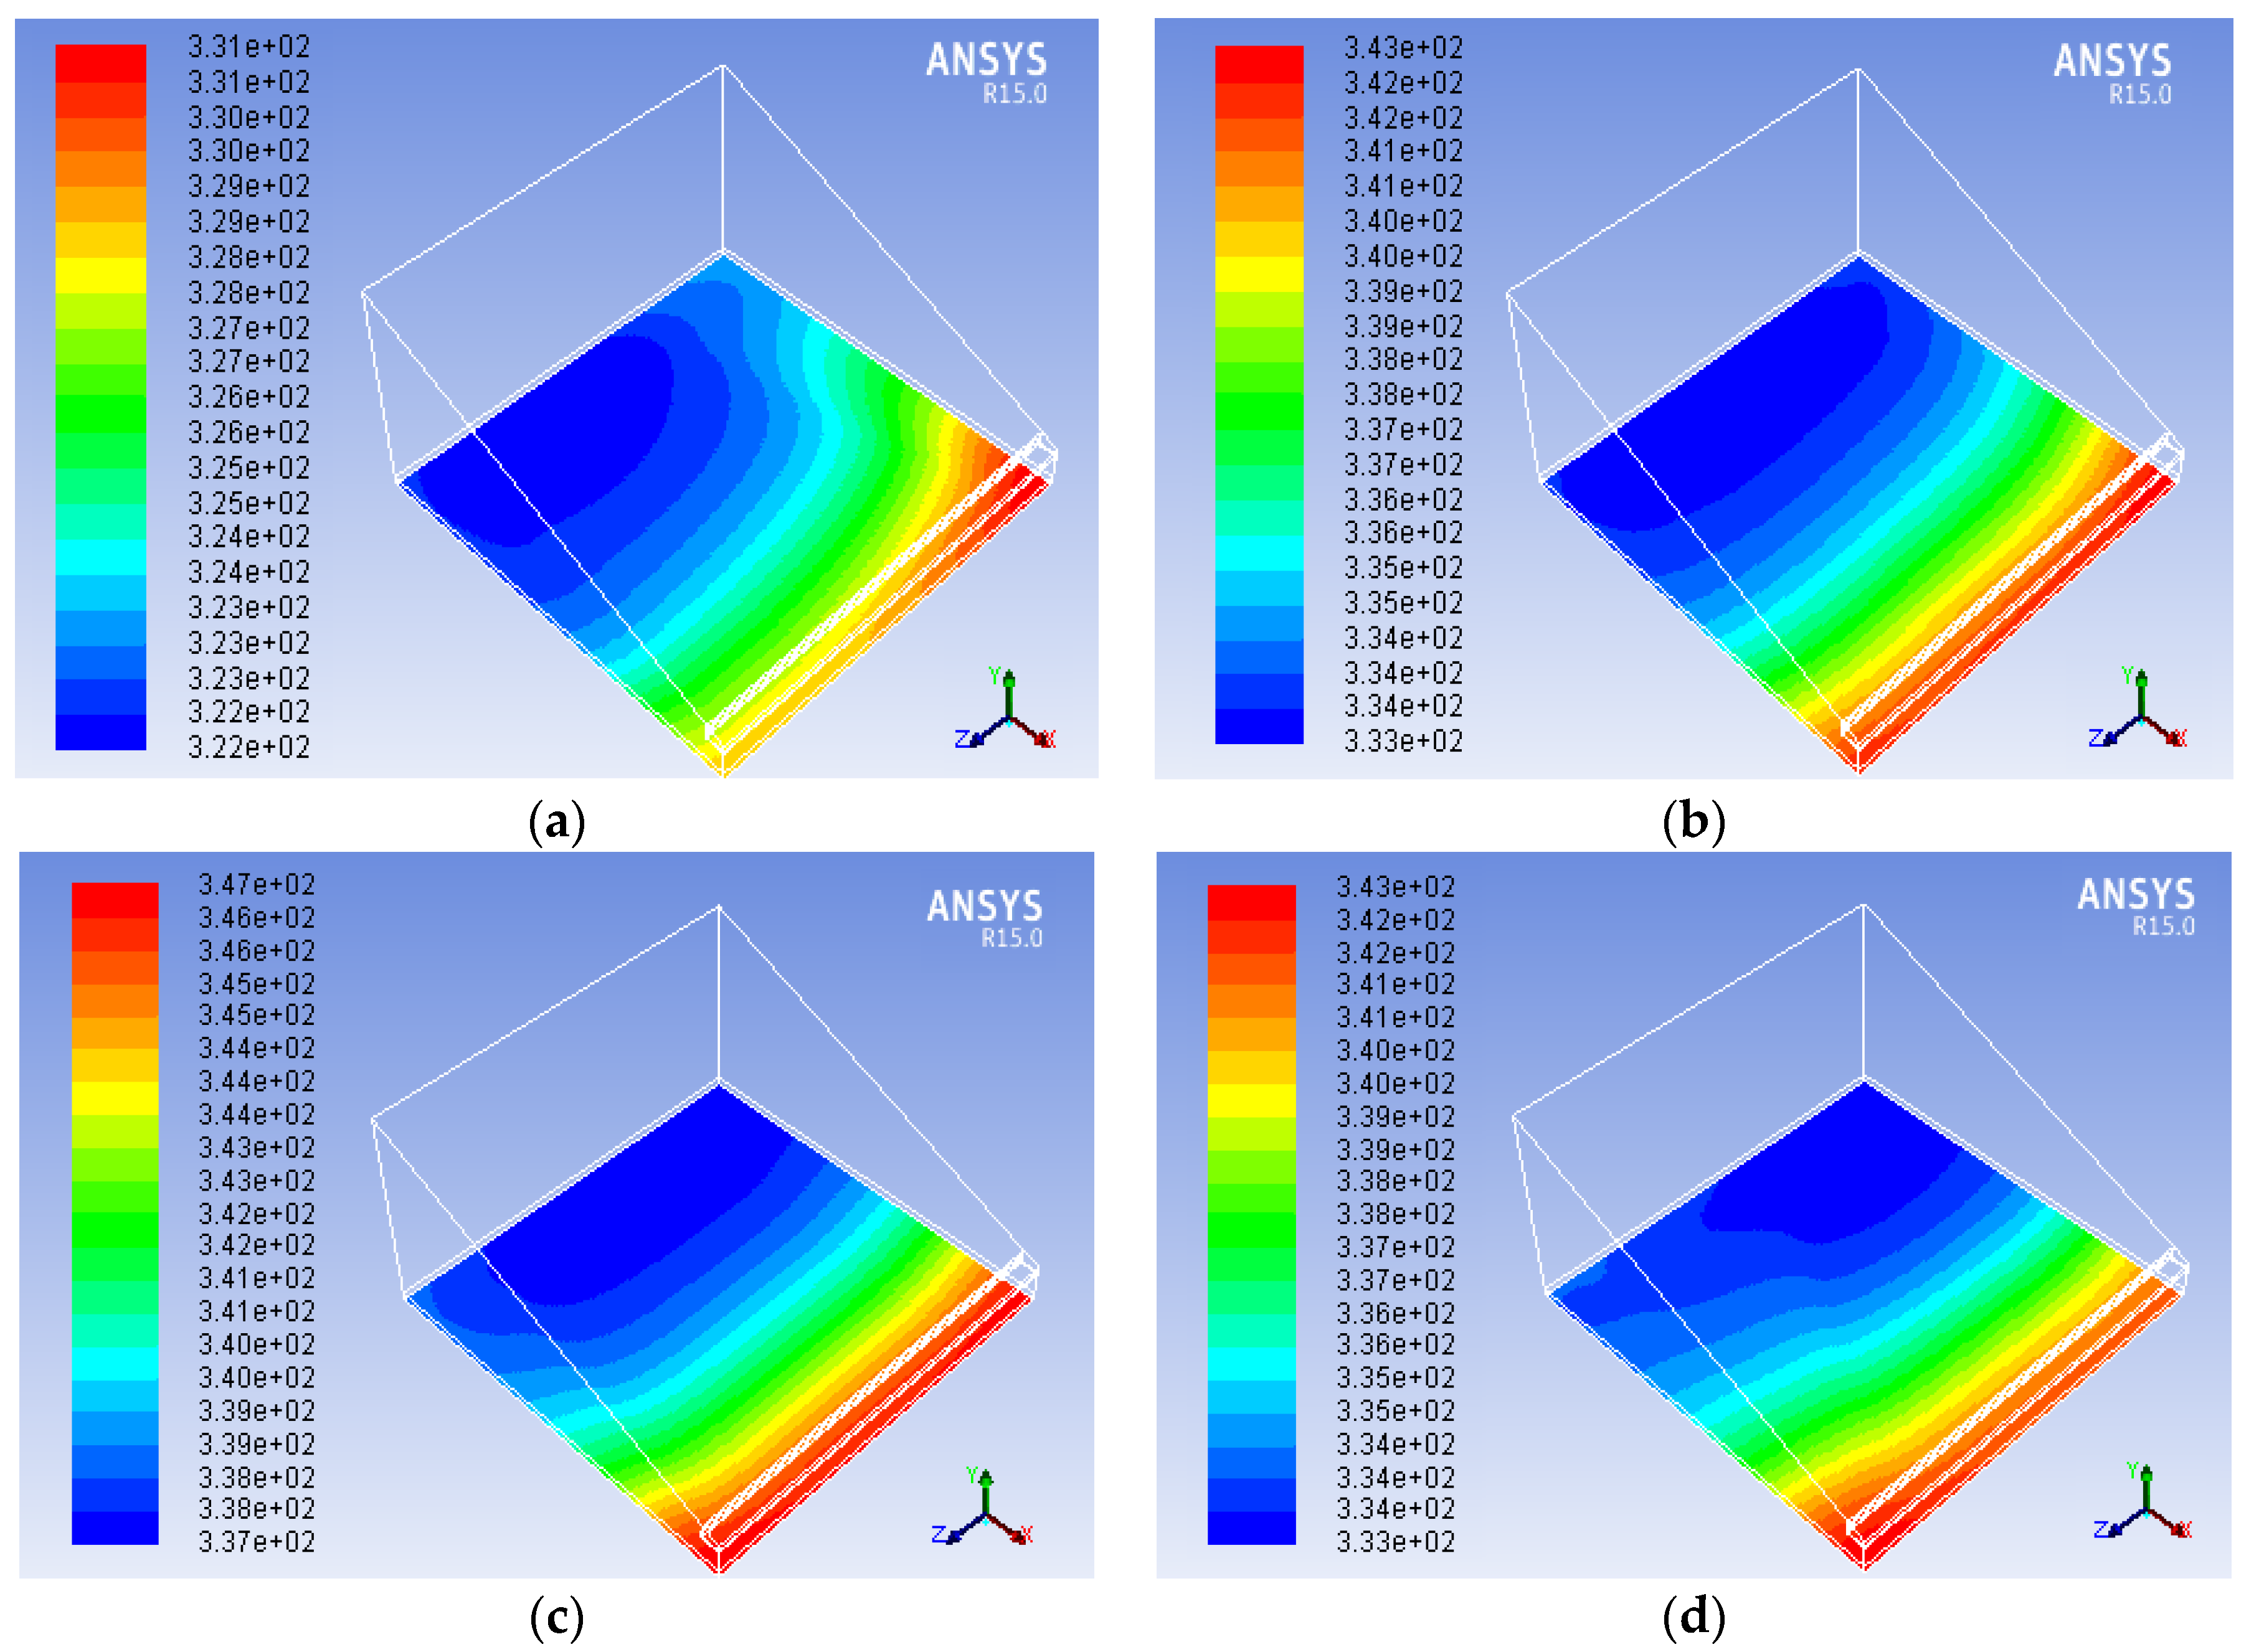
In solar still, the attained temperatures by the condensing glass cover, water basin, and the inner of the still played necessary functions for the water distillation and optimum working of the solar still. In general, the amount of distillate produced by the solar still depends upon the temperature variation among the water basin and the condensing glass cover. Temperature contours of the absorber plates for the tested solar still at different time intervals are shown in
Figure 8. The color coding of the temperature is also shown on the charts. The minimum and the maximum temperatures are in Kelvin. The “blue” color shows the minimum value of the temperatures and the “red” color shows the maximum value. The contours of the absorber plate temperature charts show that:
- -
Within the tested solar still, the temperature of the absorber plate began to rise as the solar radiation fell on the basin. This temperature showed increases gradually until 14:00 and after that, it decreased little by little;
- -
Temperature contours of the mixture (air and water vapor) inside the solar still were drawn at the X-Y plane passing through the center of the still and parallel to its sidewalls at different time intervals through the daytime, as is shown in
Figure 9;
- -
It can be seen in
Figure 9 that the interior temperature of the tested still follows the pattern of solar radiation falling over the glass cover. The interior temperatures of air and water vapor mixture inside the tested still increased gradually up to 14:00 and after that, they decreased gradually.
The contours of the glass cover temperature of the tested still is also illustrated in
Figure 10 at various time intervals with a water depth of 2 cm. Since the still was facing south direction, the effect of movement of the sun with the time of day could be clearly seen on the temperature profiles of the glass cover. As the solar radiation intensity rose with time, the glass cover temperature also increased up to a maximum at 14:00. After that, the temperature of glass cover decreased as the solar radiation intensity diminished upon reaching a maximum value. Thus, the glass cover temperature also followed the pattern of the solar radiation intensity falling on the glass cover.
For the validation of the developed CFD model of the tested solar still, the simulated average values of temperatures were compared with the experimental results already available on 14 June from 07:00 to 20:00 with a water depth of 2 cm.
Figure 11 indicates a comparison among the average predicted (simulated) and experimental results of the water and condensing glass cover temperatures for the tested still (SSSS) with a water depth of 2 cm. According to
Figure 11, the results indicate that there are similar trends and good agreement for the predicted and measured data for the water and glass cover temperatures throughout the day (maximum discrepancy amounts to 3%). The reason for the slight difference between the predicted and measured data was that the FLUENT software considered the ideal characteristics of water and glass and not the actual properties. In addition, the reason for this variation was that the solar radiations intensity used in the simulation did not calculate for natural.
It can also be noticed from
Figure 11 that the temperatures of the water and condensing glass cover increased from 07:00 to 14:00 monotonically, and after that, they decreased monotonically. This pursued the intensity of the solar radiations trend, as expected.
The temperature differences among the water vapor and the glass cover led to the condensation of the vapor on the glass cover. From the glass cover temperature contours (
Figure 10), it can be seen that the temperatures on the lower parts of the glass cover were comparatively higher than the upper part temperatures of the glass cover, which led to more condensate of water in the upper parts of the glass cover compared to the lower ends.
Figure 12 illustrates the volume fraction of water liquid on the condensing glass cover for the studied still with a water depth of 2 cm at different time intervals.
- -
There was the same distribution of the water liquid on the condensing glass cover at 10:00 between experimental diagram and the CFD sketch;
- -
The volume fraction of the water increased until 14:00 and thereafter, it started decreasing as the intensity of solar radiation and saltwater and condensing glass cove temperatures decreased.
Figure 13a,b presents a comparison between the values of the hourly and accumulated productivities, obtained using the developed CFD model and those measured for the studied still with a water depth of 2 cm. The results indicated that the daily simulated and experimental accumulated productivities were 1.982 and 1.785 L/m
2. It can also be seen from
Figure 13 that the percentage deviation between the simulated and measured accumulated productivity is 11%. In addition, it is clearly seen from
Figure 13 that the experimental graphs are very near to that of the simulated graphs, which suggests an acceptable conformity between the CFD predicted data (simulated) and experimental amounts for the tested solar still.
The velocity contours of the mixture (air and water vapor) inside the basin of the studied still in the X-Y plane passing through center of the still and parallel to its sidewalls at different time intervals through the daytime for a water depth of 2 cm are drawn
Figure 14.
Figure 14 shows clearly that a flow recirculation along with high velocity zones takes place in the top and bottom portion, while in the central portion an intermediate low velocity is brought about. Near the walls, the velocities were minimizing. The behavior of the flow could be considered appropriate as the re-circulated air probably drove the condensate towards the channel of the distillate. The magnitudes of velocities were in m/s.
The solar still efficiency signified the capability of the still in desalinating saltwater and could be practiced as a parameter that should be maximized for finding out the optimal still design. The ratio of the total quantity of thermal energy utilized to have a certain quantity of water productivity in a certain period to the energy provided to the solar still through the same period was defined as the thermal solar still efficiency.
Figure 15 illustrates the daily simulated and experimental efficiency of the studied still. The experimental daily quantity of the efficiency was a bit smaller than the simulated quantity, which displays acceptable agreement among simulated and experimental values with a maximum difference of 8.3%. The experimental efficiency was lower than the simulated efficiency because of possible leakage of vapor.


