Abstract
The efficient and clean use of fuel is very important for the sustainable development of energy. In this article, a numerical study of molten carbonate fuel cell (MCFC) unit is carried out, and the source, distribution, and extent of six irreversible losses (fluid friction loss, mass transfer loss, ohmic loss, activation loss, heat transfer loss, the coupling loss between heat and mass transfer) are described and quantified. The effects of the operation temperature, current density, CO2 concentration, and cathode CO2 utilization rate on the exergy destruction and exergy efficiency during the power generation process are investigated. The results show that the main source of entropy generation in MCFC is the potential difference, which affects the ohmic and activation entropy generation, especially when the CO2 concentration is very low. The second is the temperature gradient, which causes the entropy production of the heat transfer. With the rise of the CO2 concentration at the cathode inlet, the exergy destruction reduces and the exergy efficiency increases. With the rise of the cathode CO2 utilization rate, the exergy destruction rises and the exergy efficiency reduces. Therefore, analyzing the irreversible process transfer mechanism in MCFC can provide the theoretical basis for its thermal performance optimization and structure design.
1. Introduction
Climate change problem has attracted more and more attention all over the world, especially in China. With the rapid economic development in the last thirty years, energy consumption and CO2 emissions of fossil fuel-fired power stations are growing rapidly [1]. An effective solution to the problem is the carbon dioxide capture and storage (CCS) technology. However, the CO2 emission from coal-fired power plants is hard to be captured due to its low CO2 concentration. Molten carbonate fuel cell (MCFC) can enrich the CO2 in the exhaust gas of fossil fuel-fired power system to a higher concentration due to its special characteristics that the CO2 gas is needed to be fed into the cathode for producing carbonate ions during the process of the electrochemical reaction.
MCFC is a kind of high temperature fuel cell operating at 650 °C, which has a high power generation efficiency. In the molten electrolyte of MCFC, the carbonate ions work as active charge carriers. At the cathode, CO2 is reacted with O2 to generate carbonate ions. The carbonate ions are transported from the cathode electrode to the anode electrode, then reacting with H2 and producing H2O and CO2. Through the electrochemical reaction, the chemical energy of fuel (usually hydrogen) is directly converted into the electrical energy. The CO2 is separated from the cathode electrode, which is inputted with low-CO2-concentration exhaust gas of fossil fuel-fired power system, and transported to the anode electrode, where a gas stream with higher concentration of CO2 can be achieved. Additionally, as the working temperature is high, the MCFC is able to be coupled with a gas turbine or thermal power plant.
Although the MCFC has higher efficiency than other technologies and can be used for the distributed power generation, there is still potential for further performance improvement. The second law of thermodynamics is widely applied to achieve an optimal design of the energy system. The entropy production rate can be used to correctly quantify the thermodynamic irreversibility. Therefore, a higher energy efficiency can be achieved through reducing the entropy generation. There are some published papers involving the analysis of fuel cell using the second law of thermodynamics. Duan et al. [2] analyzed the energy and exergy efficiencies of an integrated gasification combined cycle (IGCC) system integrated with molten carbonate fuel cells. Correspondingly, a total energy efficiency of 47.31% and a CO2 capture rate of 88% were achieved. Javad Yazdanfar et al. [3] conducted exergy and advanced exergy analysis of the molten carbonate fuel cell power system integrated with carbon dioxide capture, and showed that more than 65% of exergy destruction can be avoided. M.Y. Ramandi et al. [4] used the computational fluid dynamics (CFD) model to study the characteristics of high current density MCFCs, and used thermodynamic models to calculate the entropy production and exergy efficiency of MCFC. However, the black box model is used in most researches, and few studies have investigated the reasons for thermodynamic irreversibility and its local entropy production distribution in fuel cells. Sciacovelli [5] used a computational fluid dynamic (CFD) model to investigate improvements in the geometry design of a monolithic-type solid oxide fuel cell (SOFC). The results showed that, for the monolithic-type SOFC, the contribution due to coupling between heat and mass transfer accounted for about 50% of the total entropy generation. Ramirez-Minguela [6] developed a three-dimensional CFD model to investigate the behavior of a mono-block layer built (MOLB-type) SOFC. The results showed that, the variability of the electrolyte thickness mainly affected the ohmic loss and when the inlet temperature was 973 K, the overall entropy generation was reduced by about 35% compared with the case that the inlet temperature was 873 K. Sciacovelli [7] also analyzed the circular MCFC with a three-dimensional model, and studied the optimal shape of the distribution channel through the entropy analysis method. The results showed that the largest contribution to the irreversibilities was due to the mass transfer in the porous media. However, although the current research focuses on the main sources and distribution of entropy generation, the influences of the CO2 capture rate variation on the entropy generation rate and exergy destruction during the entire power production process are still insufficient. The variation laws of local entropy production rates in MCFC are deeply investigated in this article.
In this article, the distribution characteristics of entropy production under different CO2 capture conditions are revealed. Hydrogen is used as fuel and COMSOL Multiphysics software is used to perform numerical calculations on the mass-heat transfer and electrochemical fields in MCFC, the local entropy generation sources formed by these six irreversible processes are comprehensively analyzed, and the distributions of various local entropy production rates and the changes of system exergy loss, exergy efficiency, and power generation efficiency during the power generation process under different CO2 capture conditions are described. Using the entropy generation, the micro-flow, micro-diffusion, electrochemical reaction, and CO2 transfer are unified in the macro model for theoretical analysis.
2. System Modeling
A single planar MCFC module is built in this research. The MCFC model is divided into five parts and the configuration of the MCFC module is shown in Figure 1.
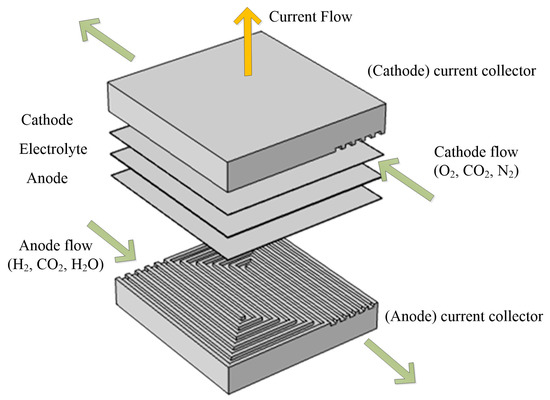
Figure 1.
Structure of the MCFC single cell.
The current collector is also used as a fluid channel. In order to distribute the reaction fluid evenly throughout the electrode area, serpentine channels are designed. Fuel and oxidant gases are fed into the anode and cathode channels from the opposite direction.
The anode and cathode are averaged triple-phase porous electrodes. Fuel and oxidant gases diffuse through the anode and cathode, respectively, and then transfer to the triple-phase boundary.
The electrolyte layer is a porous structure filled with the liquid electrolyte, where charges are transferred in the form of carbonate ions.
The fuel gas consists of hydrogen, water vapor and carbon-dioxide; the oxidant gas consists of oxygen, carbon-dioxide, and nitrogen. The electrochemical reaction equations are as follows:
The CO2 is reduced in the anode and generated in the cathode at the same rate. The geometrical parameters of a single MCFC module are shown in Table 1. The current collectors of anode and cathode have the identical dimensions. The parameters of model are displayed in Table 2.

Table 1.
Values for dimensions used in the MCFC module.

Table 2.
Parameters of MCFC single cell.
The following assumptions are made during the establishment of the model:
- Steady state conditions.
- The electrodes and the gas mixture are in a thermal equilibrium state.
- Homogeneous and isotropic porous media.
- The MCFC is thermal isolated, the entropy flow to the environment is zero.
- The effects of gravity and the electrical contact losses between the fuel cell structures are neglected.
- Incompressible ideal gas mixtures.
- Laminar flow.
2.1. Boundary Conditions
Outer surfaces of the fuel cell, besides the inlets and outlets, are isolated, which means there is no mass flows, heat flows, or electric flows crossing through the outer surfaces. The boundary conditions of channel and electrode are set to no slip and insulated, and thus the fluid velocity and the mass fluxes are zero. Local thermal equilibrium hypothesis is used in the fuel cell, which assumes equality of temperature in both fluid and solid phases. Continuities of velocity, heat flux and mass fraction are applied for all balances at the interfaces in the model. The flow rate, composition of the substance, and temperature are specified at the entrance. The pressure at the outlet is set equal to the ambient pressure.
2.2. Numerical Approach
COMSOL Multiphysics is applied to discretize and solve the coupled multiphysics equations. Firstly, the velocity field and pressure field are received by solving the compressible Navier-Stokes equations and the Brinkman equations. Secondly, Maxwell–Stefan diffusion, convection equations, and heat transfer equations are solved to get the species concentration and temperature. Finally, the local current density is calculated with the concentration dependent Butler–Volmer equation. This process is repeated until the convergence is reached. The convergence criteria with the relative tolerance of each variable less than 10−3 is set. A structured grid of 620,000 elements is established to perform the calculation.
2.3. Governing Equations
2.3.1. Velocity Distribution
The velocity and pressure fields are obtained by solving the continuity Equation (3) and Navier–Stokes Equation (4):
In the porous electrodes, in consideration of the effect of solid matrix, the velocity and pressure fields are given by the continuity Equation (3) and Darcy–Brinkman (5):
where is velocity vector, is permeability tensor of the porous medium, is the dynamic viscosity of the fluid, is the pressure, and is the effective porosity:
where is the gas mixture density, which is determined by the ideal gas law:
where M is the average molar mass:
where is the mass fraction and is the molecular weight of component .
2.3.2. Concentration Distribution
The conservation of each species is described with the transport equations:
where, is the source term caused by electrochemical reactions. In the porous electrodes, is calculated with the Faraday law Equation (21), while in other components of the model, the species mass source term is zero because no electrochemical reaction exists. is the mass flux due to molecular diffusion of species , which is governed by Fick’s law:
where represents the effective mass diffusion coefficient of species . When species diffuses in the gas mixture, the effective mass diffusion coefficient can be calculated as follows:
where the effective binary mass diffusion coefficient of species in species , , is determined as follows:
where represents the binary mass diffusion coefficient of species in species . The tortuosity of the porous medium, , is obtained by the Bruggeman model:
The porosity is equal to one in the channels.
The effective mass diffusion coefficient in the porous electrodes is an average value calculated with the volume fraction [8]:
2.3.3. Current Density Distribution
To clearly reveal the influences of the concentration of reactants and products on the current density, the concentration dependent Butler–Volmer equation is applied in electrodes. The volumetric current density of the electrode, , is expressed as follows [10]:
where, represents the active surface area of the electrode, and represent the actual surface concentrations of reactant and product, and represent the reference concentrations, which is the inlet concentrations in this paper, represents the transfer coefficient, F represents the Faraday constant, and represents the overpotential. The exchange current density of the reference concentrations, , is calculated as follows [2]:
where the standard exchange current density is represented by , and the inlet molar fraction of species is represented by .
The overpotential is as follows:
where and represent the electric and the electrolyte potentials in the porous electrodes. denotes the equilibrium potential, which is defined with Nernst equation:
The species source terms caused by the electrochemical reactions in the porous electrode can be written as follows:
where is the stoichiometric coefficient of species .
The conservation of electronic charge is determined as follows:
where is the electron source term in the electrodes. The effective electric conductivity in the solid phase, , is calculated as follows:
The conservation of ionic charge is written as follows:
where is the carbonate ion source term in the electrodes. The effective electric conductivity of the liquid electrolyte, , is given by the following equation:
2.3.4. Temperature Distribution
Conservation of energy is given by the following equation:
where the effective thermal conductivity is represented by , which is the gas mixture thermal conductivity in the channels, and the volume-averaged value of the thermal conductivity of triple-phase materials in the porous electrodes is as follows [8]:
where , , and are the thermal conductivities of solid phase, gas phase, and liquid phase, respectively.
In an electrochemical cell, reversible and irreversible are included in the heat source item . Irreversible voltage losses can be caused by the following processes: charge transport in the electrolyte or solid phase (Joule heating) and activation overpotentials generated in the electrochemical reactions. Moreover, reversible heat sources are caused by the entropy generations in the electrochemical reactions. Therefore, in the anode and cathode, the heat source item can be written as follows:
While, the heat source in the rest parts is determined as follows:
2.3.5. Entropy Generation Distribution
The exergy analysis of the single MCFC is conducted in this subsection, which includes the analysis of the type, location, and value of exergy destructions. Based on the second law of thermodynamics, exergy analysis quantifies the degree of the irreversibility of the energy conversion process, which is proportional to the entropy production. The local entropy production is calculated by the entropy balance equation, which is composed of the entropy flow into the volume element and the entropy source caused by the irreversible process inside the volume element as follows:
where is the time derivative of entropy, represents the entropy flux vector and represents the entropy generation rate. Assuming the local thermodynamic equilibrium, the following relation can be used:
where the internal energy is represented by u and the chemical potential of species is represented by . After differentials replaced and some rearrangements it is possible to obtain the following equation:
where the heat flux is represented by . The total entropy production rate is divided into four parts, which are related with four transport processes:
where represents the entropy generation of viscous stress, is the contribution of heat transfer, is the entropy production caused by the mass transfer, and is the entropy generation of coupling between heat and mass transfer. The total entropy production is represented by . Equation (34) can be further expressed as follows:
where the strain and stress tensor are represented by and . Moreover, the entropy generation caused by the ohmic loss can be expressed as follows:
The entropy production caused by the activation loss, is written as follows:
where is overpotential and j is current density, which is calculated as follows:
Finally, the exergy destruction over the entire fuel cell can be calculated as follows:
where the first term integral is calculated in the domain of the whole single MCFC and the second term integral is extended to the electrode surface.
There is no heat transferred by MCFC walls as the assumption of thermal insulated. The exergy balance of the fuel cell is expressed as follows:
where , represents the exergy of the input and output streams, respectively, and denotes the output power of the MCFC, which is written as follows:
The exergy efficiencies are evaluated by the following equation:
3. Model Validation with Experiment
To check the model reliability, a MCFC planar unit cell with identical dimensions (Tabel.1) as the simulation model is assembled and tested. A porous Ni/Cr alloyed structure is used as the anode and a porous NiO structure is used as the cathode. The electrolyte is a mixture of 62% Li2CO3 and 38% K2CO3. The electrolyte matrix is LiAlO2. The experimental facility is shown in Figure 2. The experimental facility is composed of a heating equipment, a gas flow control equipment, MCFC unit cell and measuring equipment. The cell operates at 650 °C in atmospheric conditions and the isothermal condition is maintained with an electric furnace, where the cell is heated with two plates equipped with six electric heaters each. The inlet gas mixture flow rate of anode or cathode is controlled with several mass flowmeters. The gas flow rate is measured by the film flow meter, and the composition is analyzed by the gas chromatograph. The polarization curves of experiment and simulation model are shown in Figure 3, and it is obvious that the simulation values are well consistent with the experimental data.
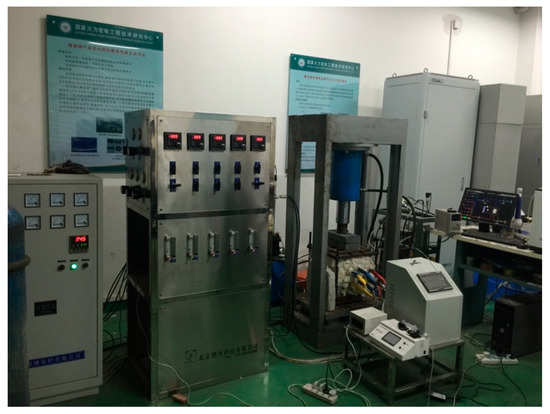
Figure 2.
Test facility of the MCFC single cell.
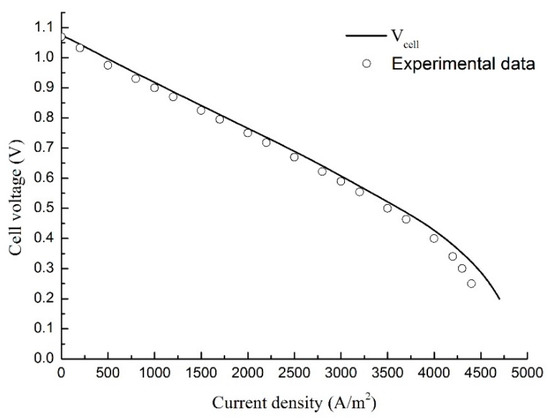
Figure 3.
The polarization curves of experiment data and simulation values.
4. Results and Discussion
Because the specific local entropy generation distribution in MCFC is basically the same under all working conditions, a reference working condition (Table 3) is taken as an example to describe and analyze the local entropy generation distribution. The inlet mixture gas temperature is adjusted to maintain the electrode working temperature at 923 K. The current density is maintained at 2000 A/m2. The results are displayed in Figure 4.

Table 3.
The reference operating parameters of MCFC.
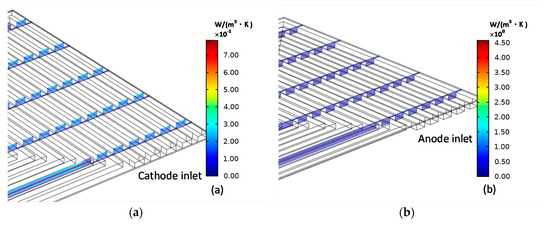
Figure 4.
Cathode (a) entropy production and anode (b) entropy production caused by fluid friction.
Figure 4a shows the distributions of cathode entropy generation and anode entropy generation caused by the viscous dissipation. The viscous dissipation is caused by the shear force generated by the multi-component gas at the boundary of the solid channel, where the velocity gradients are large. So, the largest viscous entropy generation distributes along the walls. Compared with the flow rate at the entrance of anode, the flow rate at the cathode inlet is greater. Therefore, the cathode eddy current is stronger and is larger, which is shown in Figure 4a.
The distributions of the cathode entropy production and anode entropy production caused by the mass transport is shown in Figure 5. Along with the electrochemical reaction process, the gradients of species concentration are generated, which is the source of the entropy production. As shown in Figure 5a, at the corners of the electrodes, there concentrates a larger entropy generation caused by mass transfer. While for the anode electrode, the anode gas gradient is greater and is larger than the cathode so there is a greater entropy generation at the anode inlet, which is shown in Figure 5b.
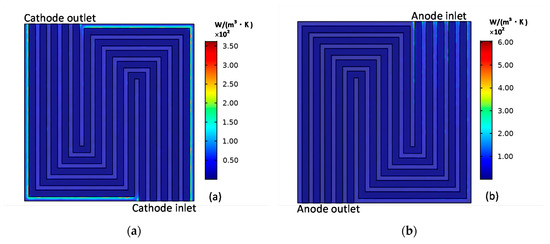
Figure 5.
Cathode (a) entropy production and anode (b) entropy production caused by mass transfer.
The distributions of the cathode ohmic entropy production and anode ohmic entropy are shown in Figure 6. They are consistent with the current density distributions on the electrolyte and electrodes. Electrons are transferred to the current collector through the electrode layer and output the current at the current collector. Therefore, either for cathode or anode electrode, a large resistive force will concentrate at the contact place of the electrode and the current collector, which results in the resistance effect and the ohmic heat dissipation.
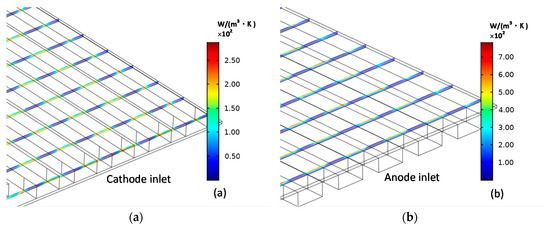
Figure 6.
Cathode (a) entropy production and anode (b) entropy production caused by ohmic loss.
The distributions of the cathode entropy production and anode entropy production caused by the activation loss is shown in Figure 7. Activation loss is caused by the activation energy barrier of charge transfer, which needs to be overcame in the electrochemical reaction. is distributed in the contact layer of the electrode and the electrolyte. As shown in Figure 7a,b, along the direction of gas flow, the overpotential increases because of the reduced reactant concentration, which finally results in the increases; simultaneously, as current density concentrates at the contact place of the electrode and the current collector, the largest is located at the contact place of the electrode and the current collector near the outlet.
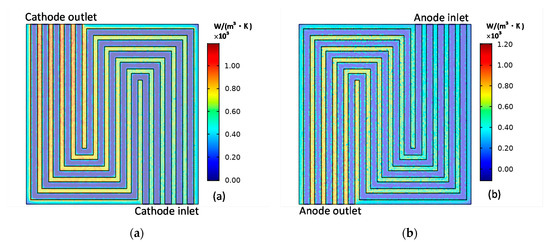
Figure 7.
Cathode (a) entropy production and anode (b) entropy production caused by activation loss.
Figure 8 shows the distributions of the cathode entropy production and anode entropy production caused by the heat transfer. No heat is transferred by MCFC walls, as the assumption of thermal insulated. The heat generated by MCFC is carried out of the fuel cell by the convection along the flow direction of components. Therefore, for either cathode or anode, is concentrated around the entrance of the channel. Since the inlet gas mixture temperature of cathode and anode is equal and there is more mass flow at the cathode inlet than the anode inlet, there is more heat flux at the cathode inlet than the anode inlet, which results in that the at the cathode entrance is larger than that at the anode entrance.
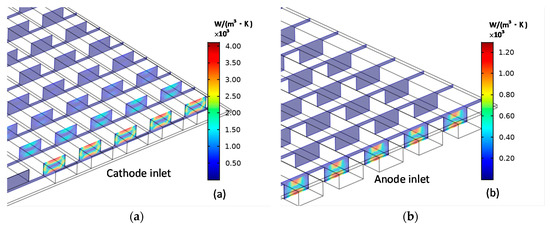
Figure 8.
Cathode (a) entropy production and anode (b) entropy production caused by heat transfer.
The distributions of the entropy production caused by the coupling of heat and mass transfer are shown in Figure 9. The largest entropy generation appears along the inlet channel profiles because of the presence of temperature gradients and species concentration gradients.
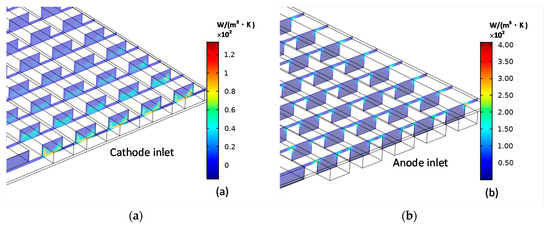
Figure 9.
Cathode (a) entropy production and anode (b) entropy production caused by the coupling between heat and mass transfer.
To evaluate the dependence of the thermodynamic irreversibility on the current density, working temperature, CO2 concentration and cathode CO2 gas utilization rate, the exergy analysis has been performed for four sets of comparative cases.
In the first set of comparative cases, the current density is changed from 1000 A/m2–15,000 A/m2, with a constant working temperature at 923.15 K. The cathode inlet gas flow rates of CO2 and O2 are adjusted to keep the utilization rates of CO2 and O2 at 0.4. The inlet gas mixture temperature is adjusted from 761 K to 360 K to keep the electrode working temperature at 923.15 K. In the second set of comparative cases, the electrode working temperature is changed from 823.15 K to 1023.15 K, with a constant current density, 2000 A/m2. The cathode inlet gas composition and flow rate in the reference case (Table 3) are adopted here. With the identical cathode inlet gas parameters and the constant current density, the utilization rates of O2 and CO2 in cathode are kept at 0.4.
In the third set of comparative cases, the O2 and CO2 flow rates are selected from the reference case (Table 3). The operating voltage is selected to maintain the fuel cell working at current density of 2000 A/m2. With the constant flow rates of O2 and CO2, and the same current density, the utilization rates of O2 and CO2 are maintained at 0.4. The inlet CO2 concentration is varied from 0.1 up to 0.6 by decreasing the N2 flow rate, meanwhile the inlet O2 concentration is changed from 0.05 to 0.3. The inlet gas mixture temperature is adjusted from 787 K to 674 K to maintain the electrode working temperature at 923 K. In the fourth set of comparative cases, with the uniform inlet CO2 flow rates, the operating voltage is adjusted to change the utilization rates of CO2 from 0.4 to 0.9. The inlet N2 flow rate is adjusted to keep the inlet CO2 concentration at 0.3, and the inlet H2 and O2 flow rates are adjusted to maintain the utilization rates of H2 and O2 at 0.4. The inlet mixture gas temperature is changed from 802 K to 577 K to keep the electrode working temperature at 923 K.
The global entropy generations for different working conditions are displayed in Figure 10. Figure 10a shows the comparison among every entropy generation under the identical working temperature, 923 K, and different current densities. It is obviously shown that, with the rise of the current density, each exergy destruction increases. Figure 10b shows the comparison among every entropy generation under constant current density, 2000 A/m2, and different working temperatures. It can be observed that all kinds of exergy destructions reduce with the rise of the working temperature. Figure 10c shows the comparison among every entropy generation under different inlet CO2 concentrations. It can be observed that increases with the rise of the inlet CO2 concentration, which is owing to that, when the inlet gas mixture flow rate and composition are kept constant, is strongly influenced by the temperature difference between gas mixtures inlet temperature and the working temperature. reduces with the rise of the CO2 concentration. Because under the premise of the same current density, that means the same species consumption rate, the higher the CO2 concentration is, the smaller the CO2 concentration gradient is. Since the current density remains unchanged, is not changed with the rise of the CO2 concentration. When the CO2 concentration is reduced to the molar fraction 0.1, the increases drastically. That is because when the CO2 concentration is 0.1, the actual current density is close to the limited value, so the overpotential becomes very large. Although the O2 concentration has also decreased, because the diffusivity in liquid electrolyte of O2 is three times that of CO2, which leads to that CO2 is much more difficult to diffuse in the triple-phase boundary than O2. Therefore, the main factor affecting and is the CO2 concentration. This situation is verified in experiments. The open circuit voltage and actual voltage running under different CO2 concentrations in the experiment are displayed in Figure 11. It is shown that the cell voltage reduces most drastically when the CO2 concentration becomes 0.1. In Figure 10d, it is obviously observed that both and are effected by the cathode CO2 gas utilization rate, this is because with constant CO2 and O2 inlet concentrations and higher cathode CO2 gas utilization rate, the cathode reaction gas concentration at the triple-phase layer is reduced, which results in the increase in the entropy generation.
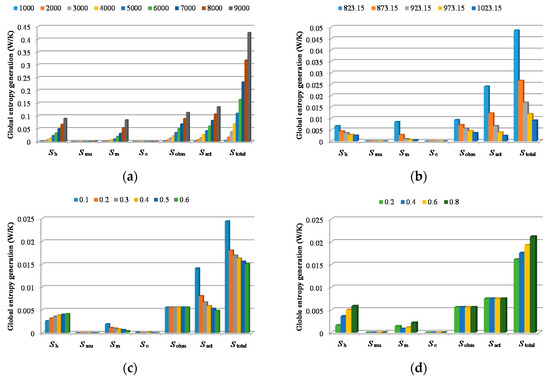
Figure 10.
Global entropy generation for: (a) different current densities (A/m2); (b) different working temperature (K); (c) different CO2 concentrations; (d) different cathode CO2 gas utilization rates.
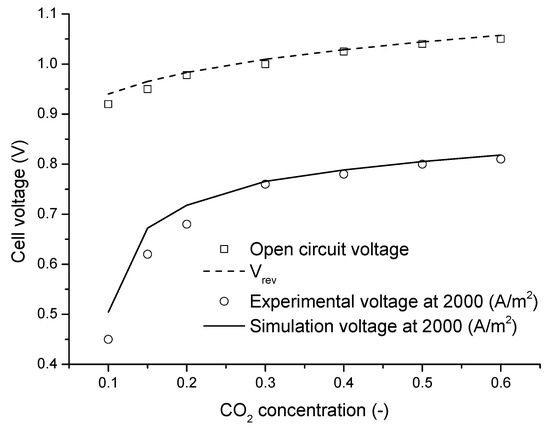
Figure 11.
Experimental voltage and simulation voltage for different concentrations of CO2.
The dependence of the exergy loss and exergy efficiency on the current density and working temperature are displayed in Figure 12. With the increase of the current density, the cell voltage decreases as shown in the polarization curves in Figure 3. This is because that the cell total exergy destruction increases with the increase of the current density, which is obviously shown in Figure 12a. The increase of the total exergy destruction will result in the decrease of the exergy efficiency, as shown in Figure 12b. With the operating temperature of MCFC rising, the MCFC total exergy destruction decreases as shown in Figure 12a. Therefore, the cell voltage will increase. As the current density is remained unchanged, the MCFC output will increase, which results in the increase of the exergy efficiency as shown in Figure 12b.
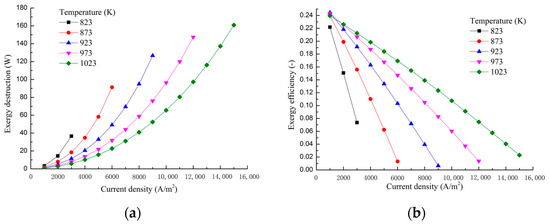
Figure 12.
Exergy destruction (a) and exergy efficiency (b) for different current densities and different working temperatures.
The influences of CO2 concentration and cathode CO2 gas utilization rate on the exergy destruction and exergy efficiency are displayed in Figure 13, which is in line with previous research. With the increase of the CO2 concentration, the total exergy destruction is slightly reduced, as shown in Figure 13a, which results in the increase of the cell voltage. As the current density is remained constant, the power output of MCFC will increase with the increase of the CO2 concentration, which will result in the increase of the exergy efficiency, as shown in Figure 13b. With the increase of the CO2 gas utilization rate, there is a substantial increase of the total exergy destruction of MCFC, which is shown in Figure 13a. Although the current density increases with the increase of the CO2 gas utilization rate, the power output of MCFC decreases because the decrease extent of the cell voltage is greater than the increase extent of the current density. Therefore, the exergy efficiency of MCFC decreases with the increase of the CO2 gas utilization rate, as shown in Figure 13b.
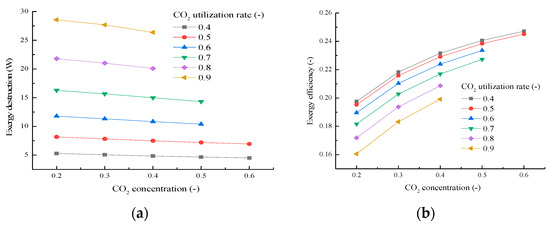
Figure 13.
Exergy destruction (a) and exergy efficiency (b) for different CO2 concentrations and different cathode CO2 gas utilization rates.
5. Conclusions
This paper analyzes the thermodynamic irreversibility that occurs in MCFC, and experimentally verifies part of the fuel cell performance. A local entropy generation model is established for six irreversible losses such as viscous friction, molecular diffusion, thermal mass transfer, activation polarization, and ohmic heating, and the effects of temperature, current density, inlet CO2 concentration and cathode CO2 gas utilization rate on the exergy loss and exergy efficiency are deeply investigated. The main results are as follows:
- According to the local entropy distribution results, it can be seen that the is mainly affected by the temperature gradient. The magnitude of and are too small to be ignored. is greatly affected by the gas concentration gradient. In the low current density area, both and are larger, indicating that the potential difference is the principal source for the entropy production. With the increase of the current density, both and increase rapidly.
- The total exergy destruction increases with the rise of the current density and the reduction of the operating temperature. The exergy efficiency reduces with the increases of the current density and the decreases of the working temperature.
- In the process of exploring the variations of local entropy production with the CO2 concentration at the cathode inlet, the driving force for the entropy production is the CO2 concentration, especially when the CO2 concentration is very low.
- Under the operating condition of the cathode CO2 gas utilization rate of 0.4, the total exergy loss decreases and exergy efficiency rises, with the rise of the inlet CO2 concentration; under the operating condition of the CO2 inlet concentration of 0.3, the total exergy loss increases and the exergy efficiency decreases, with the rise of the cathode CO2 gas utilization rate. According to the results of this study, the appropriate cathode CO2 gas utilization rate and CO2 inlet concentration can be selected according to different situations to obtain the optimal operation performance of the system.
Author Contributions
Conceptualization, L.D.; methodology, J.B.; software, J.L.; formal analysis, J.B.; investigation, J.B.; resources, J.B.; data curation, J.B.; writing—original draft preparation, J.B.; writing—review and editing, L.D.; supervision, Y.Y.; project administration, L.D. All authors have read and agreed to the published version of the manuscript.
Funding
This research was funded by [the National Nature Science Foundation Project of China] grant number [52076078] and [51276063]; and [the Science Fund for Creative Research Groups of the National Natural Science Foundation of China] grant number [51821004].
Conflicts of Interest
The authors declare no conflict of interest.
Nomenclature
| Electrode active surface area (m2 m−3) | |
| Specific heat (J kg−1 K−1) | |
| Molar concentration (mol m−3) | |
| D | Diffusivity (m2 s−1) |
| E | Exergy (W) |
| Apparent activation energy in Equation (26) (K−1) | |
| F | Faraday constant (96487 C mol−1) |
| Standard Gibbs free energy (J mol−1) | |
| Electrode thickness (m) | |
| Exchange current density (A m−2) | |
| Standard exchange current density (A m−2) | |
| Volumetric current density (A m−3) | |
| Current density (A m−2) | |
| Diffusive flux (kg m−2 s−1) | |
| Entropy flux vector (W m−2 K−1) | |
| Heat flux (W m−2) | |
| k | Thermal conductivity (W m−1K−1) |
| K | Permeability (m2) |
| M | Molecular weight (kg mol−1) |
| n | Number of moles of electrons |
| n | Molar flow rate (mol s−1) |
| p | Pressure (Pa) |
| R | Universal gas constant (8.314 J mol−1 K−1) |
| s | Specific entropy (J kg−1K−1) |
| s | Entropy production per unit volume (W m−3 K−1) |
| Entropy production per unit area caused by Activation (W m−2 K−1) | |
| S | Source terms |
| T | Temperature (K) |
| Velocity vector (m s−1) | |
| Equilibrium electric potential (V) | |
| W | Power output (W) |
| x | Molar fraction |
| Greek letters | |
| Transfer coefficient | |
| Tortuosity | |
| porosity | |
| Electrolyte filling degree | |
| Overpotential (V) | |
| Dynamic viscosity (kg m−1 s−1) | |
| Chemical potential (W kg−1) | |
| Stoichiometric coefficient (kg m−3) | |
| Density (kg m−3) | |
| Electric potential (V) | |
| Electric conductivity (S m−1) | |
| Exergy efficiency | |
| Mass fraction | |
| Subscripts and superscripts | |
| a | Anode |
| c | Cathode |
| c | Heat-mass transfer |
| d | Destruction |
| e | Electrolyte phase |
| eff | Effective |
| ele | Electrical |
| g | Gas phase |
| h | Heat transfer |
| i | ith component |
| in | Inlet |
| j | jth species |
| l | Liquid phase |
| m | Mass transfer |
| ohm | Ohmic losses |
| out | Out let |
| P | Product |
| R | Reactant |
| tot | Total |
| T | Energy equation |
| Fluid friction | |
References
- Liu, H.; Gallagher, K.S. Driving Carbon Capture and Storage forward in China. Energy Procedia 2009, 1, 3877–3884. [Google Scholar] [CrossRef]
- Duan, L.; Sun, S.; Yue, L.; Qu, W.; Yang, Y. Study on a new IGCC (Integrated Gasification Combined Cycle) system with CO2 capture by integrating MCFC (Molten Carbonate Fuel Cell). Energy 2015, 87, 490–503. [Google Scholar] [CrossRef]
- Yazdanfar, J.; Mehrpooya, M.; Yousefi, H.; Palizdar, A. Energy and exergy analysis and optimal design of the hybrid molten carbonate fuel cell power plant and carbon dioxide capturing process. Energy Convers. Manag. 2015, 98, 15–27. [Google Scholar] [CrossRef]
- Ramandi, M.Y.; Dincer, I. Thermodynamic performance analysis of a molten carbonate fuel cell at very high current densities. J. Power Sources 2011, 196, 8509–8518. [Google Scholar] [CrossRef]
- Sciacovelli, A.; Verda, V. Entropy generation analysis in a monolithic-type solid oxide fuel cell (SOFC). Energy 2009, 34, 850–865. [Google Scholar] [CrossRef]
- Ramirez-Minguela, J.J.; Uribe-Ramirez, A.R.; Mendoza-Miranda, J.M.; Pérez-García, V.; Rodríguez-Muñoz, J.L.; Minchaca-Mojica, J.I.; Alfaro-Ayala, J.A. Study of the entropy generation in a SOFC for different operating conditions. Int. J. Hydrog. Energy 2016, 41, 8978–8991. [Google Scholar] [CrossRef]
- Sciacovelli, A.; Verda, V. Entropy Generation Minimization for the Optimal Design of the Fluid Distribution System in a Circular MCFC. Int. J. Thermodyn. 2011, 14. [Google Scholar] [CrossRef]
- Ramandi, M.Y.; Berg, P.; Dincer, I. Three-dimensional modeling of polarization characteristics in molten carbonate fuel cells using peroxide and superoxide mechanisms. J. Power Sources 2012, 218, 192–203. [Google Scholar] [CrossRef]
- Verda, V.; Sciacovelli, A. Design improvement of circular molten carbonate fuel cell stack through CFD analysis. Appl. Therm. Eng. 2011, 31, 2740–2748. [Google Scholar] [CrossRef]
- Cheng, J.; Guo, L.; Xu, S.; Zhang, R.; LI, C. Numerical Simulation on the Bipolar Plate of Molten Carbonate Fuel Cell. Proc. CSEE 2011, 31, 239–243. [Google Scholar] [CrossRef]
- Tsuchihira, H.; Oda, T.; Tanaka, S. Modeling of influence of lithium vacancy on thermal conductivity in lithium aluminate. Fusion Eng. Des. 2010, 85, 1814–1818. [Google Scholar] [CrossRef]
- Kleykamp, H. Enthalpy and heat capacity of LiAlO2 between 298 and 1700 K by drop calorimetry. J. Nucl. Mater. 1999, 270, 372–375. [Google Scholar] [CrossRef]
- Fu, Y.; Chen, G.; Hu, K. Phase Stability of MCFC Electrolyte Plate. Mater. Rep. 2003, 17, 76–78. [Google Scholar] [CrossRef]
Publisher’s Note: MDPI stays neutral with regard to jurisdictional claims in published maps and institutional affiliations. |
© 2020 by the authors. Licensee MDPI, Basel, Switzerland. This article is an open access article distributed under the terms and conditions of the Creative Commons Attribution (CC BY) license (http://creativecommons.org/licenses/by/4.0/).