Abstract
This paper deals with the interactions between biophysical and microclimatic factors on the one hand with, on the other, the urban morphology of intermediate urban open spaces, the relationship between environmental and bioclimatic thermal comfort, and the implementation of innovative materials and the use of greenery, aimed at the users’ well-being. In particular, the thermal comfort of the open spaces of the consolidated fabrics of the city of Rome is studied, by carrying out simulations of cooling strategies relating to two scenarios applied to Piazza Bainsizza. The first scenario involves the use of cool materials for roofs, cladding surfaces, and pavement, while the second scenario, in addition to the cool materials employed in the first scenario, also includes the use of greenery and permeable green surfaces. The research was performed using summer and winter microclimatic simulations of the CFD (ENVI-met v. 3.1) type, in order to determine the different influences of the materials with cold colors, trees, and vegetated surfaces on the thermal comfort of the urban morphology itself. Meanwhile, the comfort assessment was determined through the physiological equivalent temperature (PET) calculated with the RayMan program. The first scenario, with the use of cool materials, improves summer conditions and reduces the urban heat island effect but does not eliminate thermal discomfort due to the lack of shaded surfaces and vegetation. The second scenario, where material renovations is matched with vegetation improvements, has a slightly bad effect on winter conditions but drastically ameliorates the summer situation, both for direct users and, thanks to the strong reduction of the urban heat island effect, to urban inhabitants as a whole.
1. Introduction
The 2015 Paris COP 21 and those that followed (until the last one in Madrid), forcefully underscored that the struggle against climate change is one of the environmental issues most debated on the global level in recent years and that an innovative vision for cities has never been so important as in our century. In fact, currently more than half of the world’s population lives in cities, and this migratory trend should continue in the years to come: by 2050, more than two thirds of the world’s population will be concentrated in urban settlements. The IPCC’s 2018 report indicated that the risks—for the human race, the biosphere, and economies—were higher than previously stated and that encouraged actions aimed at reducing global temperatures [1], as well as reducing greenhouse gas concentrations [2]. These actions were polarized on two levels: the first regarding the planet’s major ecosystems (rain forests, major river systems, etc.) and the second focusing on urban areas, since these are the ones most seriously stricken by the effects of climate change, showing a high level of vulnerability and of environmental risk.
It is thus brought to light that with the gradual phenomenon of urbanization taking place, it will in the future be cities determining the possible achievement of a radical turning point, capable of dealing with climate change and inclusive economic growth able to create jobs, without making foolish use of nonrenewable resources, on the path shown by environmental sustainability and resilience. This is why the Sustainable Development Goal (SDG) 11, “Make cities and human settlements inclusive, safe, resilient and sustainable” (https://www.un.org/sustainabledevelopment) holds such importance at the moment. In particular, objective 11.B states that by 2020 we might see substantial growth in the number of cities and urban settlements that have adopted and implemented integrated policies and plans towards inclusion, the efficiency of resources, mitigation of and adaptation to climate change, and resilience to disasters, and that have developed and implemented, in line with the Sendai framework for disaster risk reduction 2015–2030, a disaster risk management that is holistic on all levels. There are, however, still many challenges to be faced in order to achieve SDG 11. It will be necessary to conceive necessary innovative solutions to help inhabitants behave in a more aware fashion (consider Switzerland’s 2000 W citizen) and to design models of city life in which the inhabitants are involved in positively influencing their lifestyle and can interact actively with their community.
The increasingly frequent heat waves triggered by climate change focus attention on the important relationship between land cover and temperature, particularly in urban areas with a greater presence of artificial surfaces, often asphalted and built in concrete or with fewer planted areas. Accompanied by the reduction in urban green areas, these are all characteristics that cause open spaces to absorb heat in the summer and do not permit the land’s adequate transpiration and evaporation, thus resulting in the phenomenon of urban heat islands. In this perspective, the strategies of mitigation and adaptation to resilience of public spaces are seen as the most important ones to realize in the short term and, as in many other cases, the identified objectives must be tangible, concrete, and measurable so as to be able to make a significant impact on changing course and having the power to make a difference.
According to Landsberg [3], the first scholar to use the term “heat island” was Manley in 1958, in his discussion on the effect of London’s artificial heat [4]. The term has now taken on the meaning of a phenomenon taking place in urban environments, characterized by higher summer temperatures—varying from 2 °C to 12 °C—than the surrounding rural areas [5,6,7], attributable to the built urban environment and presenting particular risks for the urban population [8]. Moreover, experts often divide heat islands into three different types:
- Surface heat islands: the infrared radiation emitted and reflected by surfaces, which allow the portions of building where the surfaces are hottest to be identified, must be measured.
- Canopy-level heat islands: which exist in the air stratum where human activities are performed, from the ground to beneath the tree canopy and building roofs.
- Urban and boundary layer heat islands: which start from the level of building roofs and tree canopies, extending to the point where the urban landscapes no longer influence the atmosphere. This region generally extends no more than a mile from the surface [5].
Urban heat islands at the surface and canopy level, more commonly studied in architecture as cited in this document, are those in which the built environment and its artificialization has the most pronounced effect because air flow and energy exchanges are controlled for micro-scale, and in which the site’s specific characteristics are extremely important [9,10].
In Europe, massive urbanization today sees the intensification of the phenomenon of the urban heat island, which contributes to the increased thermal discomfort of the inhabitants of the city, and therefore to the increase in their behaviours and energy-intensive consumption to counteract the phenomenon of summer overheating (e.g., through the intense use of artificial ventilation systems). Some cities like Paris and London, after intense heat waves, recorded exponentially increased mortality [11] and adopted strategies to mitigate urban heat islands, seeking to react with initiatives making it possible to protect the population by increasing its capacity to adapt to these extreme levels of the phenomenon. Therefore, based on existing knowledge, several questions were raised from the standpoint of urban planning, relating to the mitigation and adaptation strategies to combat the risks of UHIs (Urban Heat Islands) and of climate change. In particular, in line with the growing importance of mitigation and adaptation measures, and in light of the concept of energy retrofitting, especially of consolidated and historic fabrics, the identification, study, and design of high-performance, innovative systems is one of the main fields of investigation and a significant contribution that technology can provide to combat the negative effects of the UHI and the risks due to climate change in highly manmade settings. In this sense, technological research never ceases to suggest alternative, innovative, and creative paths and to offer new components and materials for designing; it is the architect’s task to grasp their possibilities in power, in order to trigger that process of acting, operating, and working, in which to express one’s will to change course towards a resilient planning of public space [12,13].
2. Mitigation and Adaptation Strategies toward Urban Resilience
In recent decades there has been an increasing interest in the concept of “urban resilience” [14]. The theory of resilience was introduced for the first time in the 1960s–1970s in the discipline of ecology [15], thanks to the work of the American C.S. Holling, considered the founder of modern thinking in ecological resilience [16]. Built on the American ruins of the thinking linked to the Keynesian Fordist regime of unlimited, unrestricted growth, this concept essentially represents an adaptive resource management strategy. Thereafter, the concept was notably used to describe the behaviour of natural systems when confronted with external disturbances [17], and it is in this area that, in the 1990s, “engineering resilience” was identified. Contrary to ecological resilience, which regarded the adaptive capacities of ecological systems in conditions of irreducible uncertainty [18], engineering resilience admitted multiple states of equilibrium and granted the system the possibility of absorbing disturbances under a given threshold. Resilient systems thus took shape, which, when confronted with a stress, were able to react by renewing themselves, while maintaining the functionality and recognizability of the initial systems [19]. In this perspective, urban resilience refers to an urban system’s ability to maintain or to rapidly return to its vital functions when confronted with a disturbance and to adapt to change [20]. As the OECD (Organization for Economic Co-operation and Development) has stressed, a resilient city has the ability to absorb, rebound, and prepare for future shocks, of whatever nature they are [21]. In this line of research, the concept of the resilient city is articulated with respect to the challenges and risks that climate changes are heralding, by including two main strategies: those of mitigation and those of adaptation, strategies in which mitigation aims to reduce the impact of climate change [22], while adaptation aims to diminish its effects [23]. In the sector of constructions in simplified fashion, three prevalent strains of action aimed at putting these two strategies into practice may be identified: (i) those dedicated to the use of smart materials (nanomaterials, smart materials, cool materials); (ii) those introducing the implementation of green infrastructures (green wall, green roof, trees); and (iii) those relating to the development of blue infrastructures (nebulisation systems and use of water for cooling air or surfaces) [24].
2.1. Cool Materials
Among the mitigation techniques that aim to balance the heat load of the cities by increasing the heat losses and decreasing the relative thermal increases are those based on geoengineering. Since the 1970s, there have been many studies that have investigated the optical characteristics of materials, leading to the application of highly reflective materials (cool materials) capable of maintaining low surface temperatures, and other research that has instead investigated the thermal characteristics of materials leading to the applications in construction of phase change (PCM) and thermochromic materials. As pointed out by Pisello, the class of cool materials is the broadest and includes natural materials with high reflectivity, artificial white materials, cold coloured materials (traditional dark materials with a low surface temperature), and nanomaterials [25].
As observed by Yang et al. [26] previous studies on high reflective materials were focused primarily on their effects on the outdoor temperatures, thus focusing only on microclimate parameters such as air temperature and surface temperature variations and in that regard a consistent review has been made by Santamouris and Hakbari et al. [22,27] and recently by Pisello [25]; nevertheless, recently studies have highlighted the importance to comprise also other parameters such as mean radiant temperature (Tmrt) and above all comfort analysis (in terms of physiological equivalent temperature—PET or Universal Thermal Comfort Index—UTCI), since it appears that “cool materials” have different side effects on outdoor thermal comfort depending on the surface of application, on their exposure to solar radiation, and on the combination with other elements [26].
During the day, a greater reflectivity of surface materials allows a considerable reduction of daytime surface temperature to be achieved, while during the night the materials’ albedo has no influence as concerns lower nocturnal surface temperatures. Cool materials can be applied to roofs (e.g., Cool roof), walls (e.g., Cool wall), and sidewalks (e.g., cool pavement). A field study conducted in Athens, regarding pavement, in an urban park, made with cool materials (Flisvos project) [28], showed that using pavement made with cool materials can reduce surface temperatures by up to 7.6 °C in unshaded conditions. However, it is essential to assess what part of the reflected radiation is absorbed by the surrounding surfaces of the built environment, like walls or pedestrians themselves, as several studies [26,29,30,31] have shown. A study by Chatzidimitriou and Yannas [31] shows that the lower surface temperatures obtained using reflecting materials, at the level of the users’ comfort, do not offset the greater quantity of reflected radiation. On the other hand, the combination of cool materials and vegetation, particularly with trees, has shown positive effects both on reducing outdoor temperature and on the users’ comfort [32,33].
Recently, some authors have shown that the use of the cool roof was able to bring about a 2–44% reduction in the cooling requirement, with an average of 20% [34,35]. It was pointed out that cool roofs can obtain a greater potential of mitigation of the urban heat island when they have an albedo coefficient greater than or equal to 0.7. In spite of the excellent performance, cool roofs, in a matter of a few years, lose much of their initial reflection due to constant exposure to atmospheric agents, which accelerates its ageing process.
Thermochromic materials are particularly used on construction envelope surfaces for their ability to dynamically modify their optical and thermal properties, changing colour reversibly in response to the thermal stresses of the outdoor environment—passing from darker hues to lighter ones as the temperature rises and returning to the original colour when it falls. Karlessi et al. [36] have perfected 11 thermodynamic claddings for building envelopes, studying their performance in comparison with similarly coloured claddings, both of the highly reflective type (cool) and traditional. The study casts light on how the surface temperatures of thermochromic claddings were lower than the temperatures of cold claddings and of traditional ones of the same tone of colour, by 7 °C and 11 °C, respectively. In addition, in the case of thermochromic materials, there are still factors limiting widespread use, due to problems of durability of performance and stability over time [37].
2.2. Green Infrastructures
The second type of mitigation and adaptation measures regarding open urban space is that of “green infrastructures”, considered by many as one of the best and most effective strategies for cooling, combating, and mitigating the urban heat island, thanks to the shade, with the consequent reduction of ground surface temperatures and evapotranspiration [38]. They are defined as a “strategically planned network of natural and semi-natural areas with other environmental features designed and managed to deliver a wide range of ecosystem services” [39] thanks to their cooling potential and their mitigation effects in and out of doors [38]. This type comprises all the vegetated surfaces, from parks to trees, including the more artificial ones like green roofs and walls. Many studies have shown that green infrastructures make a significant contribution to reducing the impacts of climate change [40], particularly by acting in a significant way improving air quality, reducing heat stress, and containing floods. Parks with their large, grassy surfaces are important in night-time cooling action [31], but during the daytime can at times, especially if not well irrigated, be hotter than the surrounding environment [41]. This temperature difference between urban green spaces and the surrounding built terrain, called the “park cool island” (PCI) [42], shows a considerable diversity in the effectiveness of the surrounding areas and over the course of the day, and thus raises some disputed observations. Bowler et al. [43] have shown that most of the research that has been done has dealt with the study of PCIs at the “micro-scale” level, localizing their effect only in the immediate vicinity of the vegetated area and not considering the effect of the cooling contributed by the vegetation beyond the green area. In a recent study, Ketterer and Matzarakis, for a consolidated urban area in Stuttgart, proposed three intervention scenarios with different solutions of implementation of green infrastructures [44]. The results obtained by the two scholars have shown how air temperature is higher in the scenario with the asphalt paving and lower in the same area that has been planted with trees, while the scenario with only substitution of the asphalt with grass and low vegetation was revealed as without influence, presenting the same temperatures as obtained in the scenario with asphalt alone. Considering the thermal comfort these results are in line with a recent study conducted by Lee et al. in Friburg [11], where trees display a mean PET variation of 3 K and grassland of 1 K. Thus, it appears that the shading factor is the most dominant in the comfort perception, and it may vary considerably if it is from a building, a vegetated element (e.g., tree), or an artificial element (e.g., umbrella).
A recent Canadian study has shown how the shadow cast by buildings is one of the most effective cooling strategies in an urban environment, followed by the planting of trees and the construction of canopies [45]. If in a park area we calculate only the performance for comfort and that for mitigating heat, trees taken individually have clearly better results than grassy surfaces—results due to the geometric shape and the shady effect of tree canopies, as well as to the phenomenon of evapotranspiration and the ability of the foliage to modify the direction of the natural ventilation and to interact with it [43]. Of all the green infrastructures, trees are the best mitigating agents during heat waves, able to dissipate heat by long-wave radiation, convection of heat into the air, and transpiration. In particular, as pointed out by Upreti et al. [46]: “the effect of the shading of urban trees reduces net energy absorption, thereby modifying the urban energy balance and cooling the urban canopy and limit strata while reducing the sensible heat [47,48]; trees also influence indoor energy consumption for cooling [49]”. The study’s results also [46] clearly show, through calculations, how the shade from trees is able, during the daytime, to reduce the quantity of heat absorbed by roads and building envelopes by approximately 6 °C in their immediate vicinity, and by 1–4 °C for the expanded surrounding area, while during the night-time a reduction in heat due to the UHI phenomenon, by about 1.5 °C, was calculated.
In all the analysed studies, trees exert a greater influence on surface temperature than on air temperature, given that the surface heating caused by the sensible heat of construction materials is more significant in comparison with atmospheric heating. Moreover, trees are a good solution for the absorption and evaporation of water, creating a water evaporation path also through impermeable layers like asphalt [50].
However, there is a recent controversial side-effect due to climate change and air pollution on the plant behaviour and thus on parks efficiency. A recent collaborative study with plant biologists and climate scientists [51] has pointed out how under certain extreme outdoor conditions, such as summer heatwaves and high air pollution rate, parks do not always “behave” as they should, in fact they decrease their cooling capacity and may not improve outdoor thermal comfort.
In an urban setting, the extensive use of trees also presents other risks, and in particular: excessive shading of certain areas, wind shadow, maintenance problems, and pollen allergies [47].
Thus, in evaluating and designing green spaces it is fundamental to consider all the risks derived from the initial environmental conditions and consequentially to design according to local characteristics. Finally, regarding systems of “superficial greenery”, green roofs represent an interesting measure because they proved to have positive mitigation effects both on indoor as well on the outdoor [52], they can reduce the risks of heat waves, catch run-off water, and reduce the need for indoor cooling. By preventing incoming solar radiation from reaching the building structure below and by the evapotranspiration process of plants, green roofs guarantee a mitigation of the ambient outdoor temperatures.
In these cases, thermal performance is determined by: roof shading; evaporative cooling due to the presence of plants and of substratum of cultivation; and additional insulation levels of plants, caused by their substratum of cultivation and by the thermal mass of the soil [53]. Moreover, the energy benefits that can be obtained through the implementation of green roofs are also influenced by the local climate [22], by the morphology of the green roof, and by the technological components constituting the building. It has been found that the average solar radiation absorbed by vegetation is nearly 23% [54], and research conducted on the interiors of buildings in Southern Italy have found, during the summer, average surface temperatures inside buildings with green roofs are approximately 12 °C lower than those measured in buildings with traditional roofs [30]. Many recent studies have focused on the variations in air temperature outside the buildings, by comparing the values that can be obtained via mitigation of the UHI through the use of reflecting roofs on the one hand and green roofs on the other [22]. The results on an urban scale obtained on the applied green roofs have provided evidence of a reduction in urban room temperatures between 0.3 and 3 °C. In a recent study conducted by Berardi [55], the results show how the increase in the leaf area index (LAI) leads, during the daytime, to a cooling of the air temperature of to up to 0.4 °C more at the pedestrian level. In New York City, the use of numerous green roofs has made it possible to reduce summer afternoon temperatures by up to 0.6 °C [56], while in Hong Kong air temperature reductions due to the implementation of vegetation on the roofs of up to 0.7 °C at 2:00 p.m. have been measured [57].
Another interesting strategy belonging to GI and to the adaptation measures are rain gardens, also referred to as Sustainable Drainage Systems (SuDS).
SuDSs are able to reduce the impacts of the actions of the artificialization and in particular of the sealing of the soil, seeking to re-establish the natural water cycles and managing the rainwater system through processes of infiltration and evapotranspiration in situ. Sustainable Drainage Systems (SuDS), as rain gardens, bring back water to the surface, encouraging an interactive relationship with local residents and helping to improve urban landscape; they focus on the use of new paradigms, acting at the root point of the problem, that is to say, at the points of contact between rain water and the city: rooftops, private plots, gardens, squares, streets, etc.
Thanks to their ability to reduce air pollution, prevent flooding disasters, and improve urban open spaces, these systems are no longer considered as adaptation measures but as mitigation measures as well. SuDSs contain within them soil desealing strategies obtained through the use of permeable and/or porous pavements that bring beneficial effects to the soil, the air, and human comfort; porous pavement, for example, allows rainwater to infiltrate and evaporate in a significant quality in comparison with what takes place on asphalted surfaces, helping to mitigate the phenomenon of the urban heat island. In a recent study in Como [50], experiments on four different types of pavement were conducted and considerable reductions of evaporative cooling were measured from land with permeable pavement, in comparison with impermeable solutions: at a depth of 20 cm, the soil temperatures recorded beneath concrete and asphalt pavement were respectively 4 and 5 °C warmer than those recorded at the same depth beneath the soil with porous pavement or from unpaved surfaces [58].
3. Case Study Piazza Bainsizza, Rome
Piazza Bainsizza (Figure 1) is an area around 4500 square meters (90 m × 50 m), located in Rome in Prati|della Vittoria district: latitude 41° 53′ Q″ N, longitude 12° 30′ 67″ E, elevation 18 m and its climate is dry-subtropic Csa, according to Köppen-Geigen classification. The fronts of the buildings around the square arose in the post-war period, including a bus depot and three tree-lined roads that cross it and form the backdrop to the square. These buildings are approximately 5–7 floors high, with a height/width (H/W) ratio between 0.30 and 0.36. Over time, the oval-shaped centre of the square has taken on the use of a parking lot, forming a real roundabout for vehicles crossing it. Activities and shops are articulated along the wings outlined by the buildings facing the square, while inside, in the area not used as a parking lot, there are examples of black poplar over 20 m high. During the winter, the area is shaded all day long due to its compactness; on the contrary, Piazza Bainsizza receives direct radiation because of its morphology and dimension. During the summer, the piazza is almost completely unshaded all day long (Figure 2).
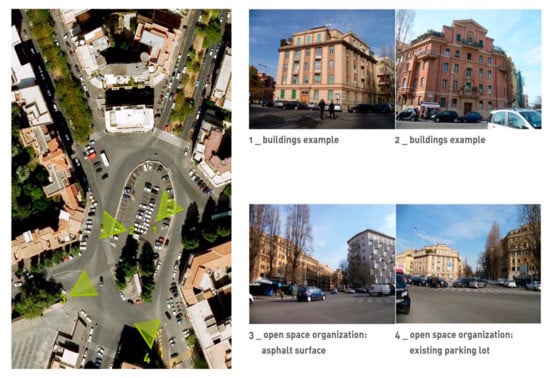
Figure 1.
Site analysis and urban morphology.
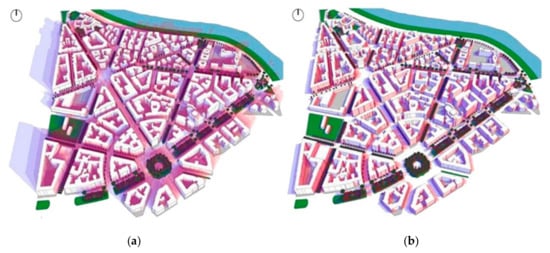
Figure 2.
Prati area shadow factor: (a) Winter shading analysis based on 21 December, with analysis range 9–12 (blue) 12–15 (red) hours and step 120 min; (b) Summer shading analysis based on 21 June, with analysis range 9–12 (blue) 12–15 (red) hours and step 120 min (analysis software: ECOTECT ANALYSIS 2010, software preset grid cell dimension).
The research methodology included a site analysis preliminary phase. The main climatic factors, represented by the average air temperature, solar radiation, wind speed and humidity, and the related seasonal and daily fluctuations were determined [59]; this data was determined looking at the related meteorological stations (in Prati|della Vittoria District). Then the morphological characteristics that best show the relationship with the microclimate were identified: form and size of open spaces and surrounding buildings; building density; SVF, Sky View Factor (defined by Nikolopoulou et al. [60], as the three dimensional measurement of the solid angle of sky view from an urban space, which determines the radiating heat exchange between city and sky); shading; the reflection and emissivity characteristics of materials and surfaces present in outdoor spaces (facades, roofs, paving systems); vegetation quality through an accurate survey of the existing vegetation.
Afterwards, different possible indicators were considered that could describe the microclimatic conditions and the thermo hygrometric comfort of the site, operating through Mean Radiant Temperature (MRT), and Physiological Equivalent Temperature (PET). The first parameter measures the average of temperatures for surfaces in an environment that are involved in a radiating thermal exchange and it represents the influence of the urban reservoir, the morphological system, and the materials on microclimate [61]. The second indicator, specifically developed for exterior spaces, defines the temperature as users perceive it, taking into account overall environmental meteorological factors, thermal balance, and thermoregulation processes of the human body, and therefore delivering a comfort value estimate that can easily be understood. Its accuracy, together with the other outdoor comfort indexes, has recently been questioned since it underestimates the strong adaptation capability of users to variable outdoor conditions and therefore it may result in an excessively negative evaluation compared to the actual perceived sensation; despite this, the PET allows us to define at least the trend of comfort with a fair amount of accurateness. The next step was to analyse the possible space morphological transformation strategies that can be applied to the specific context; since it was impossible to perform invasive actions variations on surfaces, integration of vegetation was considered. The possible actions operable on surfaces include: exterior paint or substitution of plaster coating on facades and roofs and the introduction of new materials on roofs and paving systems; allowing both colour variation and innovative systems such as “cool pavements” and “cool pigments” that present a high reflecting coefficient and high emissivity which lower heat gain. Moreover, it is possible to hypothesize the implementation of green areas in punctual, linear, and spread configurations of ground cover or trailing vegetal elements.
After this preliminary phase, characterized by information gathering procedures, a computer model was assembled within suitable simulation software (ENVI-met 3.1 by ENVI-met GmbH, Essen, Germany, RayMan by Albert-Ludwigs-Universität Freiburg, Freiburg, Germany), where previously collected climatic and morphological data concerning the research field could be merged. Such a model allows one to calculate the indicators related to microclimate and comfort (MRT e PET), selected both during the system’s initial stage, highlighting problems and faults, and following the implementation of the design strategies analysed, in order to evaluate their effectiveness and highlight the relationship between microclimate and morphology.
The strategies can be considered both singularly and within a system, in order to define implementation of two different scenarios and classify them based on invasiveness of the actions, on financial feasibility and environmental compatibility. In this case, defining the simulation of the ante-operam benchmark state means establishing a standard model to refer to and with respect to which propose in the final phase a scale for evaluating the performance of the outdoor comfort index (PET) scenario; it will be put into evidence, from time to time, the most relevant factors and the most interesting time slots to be able to extrapolate considerations regarding the single material (thermal and physical characteristics, distribution), the single surface (exposure, configuration), and between different materials (e.g., innovative material-trees, innovative material-vegetation, etc.) in order to be able to investigate the relationship between the technical characteristics (mainly related to the material) and morphological (related to the spatial configuration and distribution) of the urban outdoor spaces. Within this treatment structure, the simulation of the starting scenario represents the basic reference on which to build connections and comparisons between the various scenarios of urban regeneration, constituting in effect the benchmark case of reference.
3.1. Analysis of Initial Meteorological Conditions and Simulated Models
Piazza Bainsizza was chosen as main reference area due its morphological, materials vegetation condition with its close fronts (70%), high of buildings around 25–30 m, little vegetation, pavements in asphalt and low buildings albedo (0.2–0.3).
The study was conducted during the summer and winter season on the outdoor spaces, and in particular the 21st of June and the 21st of December were selected in that they were considered two appropriate periods of time to analyse the effects of cool materials and vegetation on the outdoor microclimate and thermal comfort conditions in Rome.
The ENVI-met v.3.1 model, which is a Computational Fluid Dynamic (CFD) modelling, was used to calculate the human biometeorological conditions in the two urban regeneration scenarios proposed through the modelling of the four systems: soil, vegetation, atmosphere, and buildings.
The scenario was approximated in terms of spatial configurations within the specific constraints of the software, thus:
- 1.
- The grid cell dimension used for the ENVI-met models measures 2 m × 2 m.
- 2.
- Walls and roofs were modelled in the Database Manager specifying their three characteristic layers.
- 3.
- In the exterior layer of walls and roofs it was chosen to apply the prevalent material, that is concrete tiles for the roofs and brick block covered with lime plaster for the walls.
The ENVI-met simulations were carried out from 8:00 to 20:00 on 21st June 2015 and 21st December 2015. The input data used in ENVI-met include air temperature (Ta) and relative humidity, air velocity (v), and cloud cover (cc) from the Prati|della Vittoria District meteorological station (Table 1) and the others related to materials and vegetation setting in the different scenarios (S0, S1, S2) represented in Table 2.

Table 1.
Initial settings for winter and summer simulation used in ENVI-met 3.1.
Table 2.
Materials and vegetation settings for the different scenarios: S0, S1, S2.
The evaluation of outdoor thermal comfort was calculated (with RayMan) through the PET index (physiological equivalent temperature) defined as the air temperature at which, in an indoor environment (without wind and solar radiation), the heat balance of the human body between the internal temperature and that of the skin is balanced with the outdoor conditions to be assessed.
The input value in summer and winter are the same used for ENVI-met. The SVF, one of the main features of RayMan, was determined with ENVI-met. At the same time, the Leaf Area Density (LAD) was calculated with ENVI-met (Figure 3).
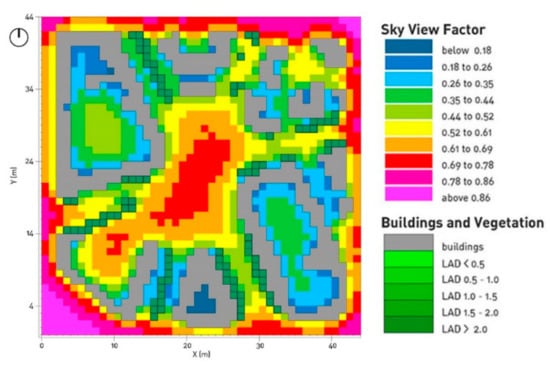
Figure 3.
Piazza Bainsizza reference area: Sky view factor distribution and Leaf Area Density (analysis software: ENVI-met 3.1).
The Global radiation G (W/m2) was part of a meteorological datafile calculated from time, date, geographic position, and a cloud cover observation. For the thermophysiological parameter of the human body, three different users were simulated, based on the Munich Energy-balance Model for Individuals (MEMI): a standard European male (35 years old, 1.75 m tall, weight 75 kg), a standard European woman (35 years old, 1.60 m tall, 50 kg weight), and a standard European child (5 years old, 1.10 m tall, 18 kg weighted), both with a clothing index of 0, 6 clo in summer, 0.9 clo in winter, and an average activity rate of 80 W for adults and an activity rate of 120 W for the child (Figure 4).
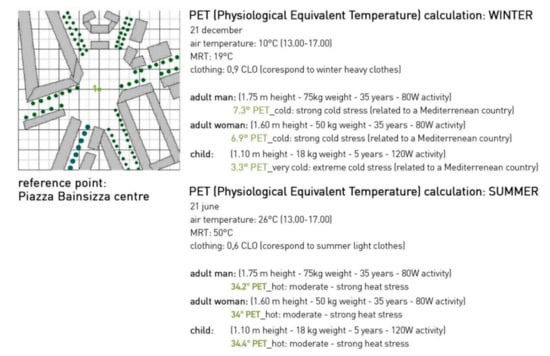
Figure 4.
Microclimatic comfort analysis of initial scenario (S0): PET during winter and summer.
3.2. Definition of Scenario Simulation
The second study phase focused on simulations and the comparison of two different scenarios of regeneration of urban exterior spaces, in order to reduce the urban heat island effect and improve microclimatic comfort. The first scenario involves the use of cool materials for pavements, façades, and roofs, while the second scenario, beyond using cool materials, in addition to what was done in the first scenario inserts the use of vegetation (green roof, green pavements, and trellis). The yardstick of comparison of both scenarios was the initial condition, scenario 0, used as a reference model for assessing the validity and the improvement from time to time due to the implementation of the various innovative materials and of vegetation. In scenario 0, we may notice that most of the street presents a high value of SVF; in summer, they are shaded during the day and buildings store heat and release during the night, increasing the UHI (Figure 3).
In Figure 5a we can notice that during winter, wind from the north can pass through Piazza Bainsizza, which is unprotected. Surface temperature is medium because asphalt pavement is the common building material with low albedo value (0.15–0.3). Meanwhile during summer, as it is shown in Figure 5b, wind from the south-west can pass through Piazza Bainsizza due to urban streets configuration. Although, surface temperature is very high due to the low albedo of building and pavements material and the absence of vegetation.
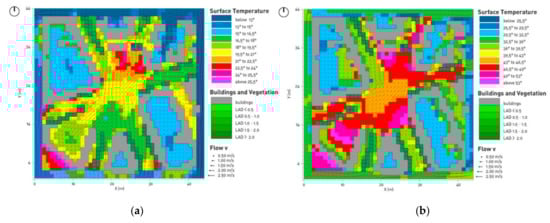
Figure 5.
Piazza Bainsizza surface temperature and wind analysis: (a) Winter simulation based on 21st December at 3:00 p.m.; (b) Summer simulation based on 21st June at 3:00 p.m. (analysis software: ENVI-met 3.1).
The cool materials used in the urban regeneration process were selected and applied to meet the following criteria:
- Optimization of possible nonmirrored reflectivity to solar radiation on the surfaces involved in the intervention.
- Optimization of the emissivity factor.
- Aesthetic value and integration due to the consolidated urban context.
The natural materials and elements like grass and trees were selected to meet the following criteria:
- Planting with trees having medium-high leaf area density (LAD).
- Planting implemented in keeping with the consolidated urban and Mediterranean context.
The first restructuring scenario (S1) is configured as a minimum intervention scenario that acts upon the surfaces at pedestrian level, in the replacement of the urban paving asphalt and the cement tiles of roofs with tiles made using cool materials and upon the building envelope through the application of cool pigments (Figure 6).
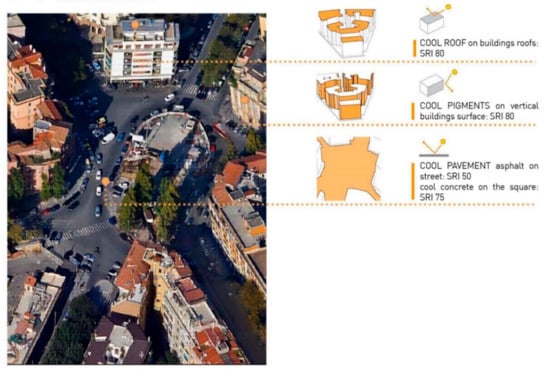
Figure 6.
Scenario of intervention 1: surface renovation.
The second proposed requalification scenario (S2) applies the cool materials of scenario 1 in the same way, adding trees (28 new trees on the South West side in total) and vegetated surfaces among the urban pavements (Figure 7).
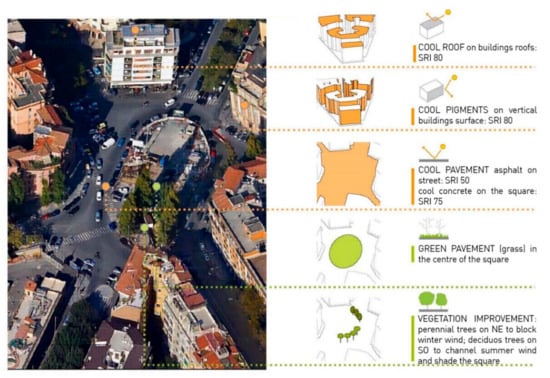
Figure 7.
Scenario of intervention 2: surface renovation and vegetation improvement.
Figure 8 represents the initial condition scenario S0 (initial condition) and the two restructurings, scenario S1 (cool materials) and scenario S2 (cool materials + trees + grass).
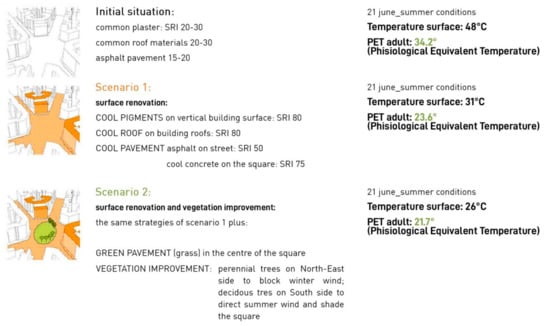
Figure 8.
Summary of the comparison between the initial situation (S0) and the two different scenarios (S1 and S2) during summer (21 June).
4. Discussion of Results
In scenario 1, during winter, using a cool pavement and cool pigments and building materials, there is a slight decrease of surface temperature, as heat storage in urban fabric is reduced (Figure 9a). Meanwhile during summer (Figure 9b), cool materials use really improves microclimatic comfort by decreasing surface temperature up to almost 10 °C; however, direct radiation is still very high due to the complete lack of shading surfaces.
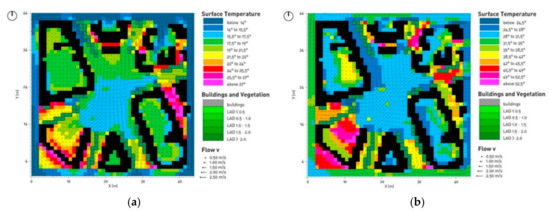
Figure 9.
Scenario 1 surface temperature and wind speed analysis: (a) Winter analysis based on 21st December at 3:00 p.m.; (b) Summer analysis based on 21st June at 3:00 p.m. (analysis software: ENVI-met 3.1).
In scenario 2, during winter, vegetated pavement strongly reduces surface temperature, but coniferous trees on wind direction decrease cold winter wind speed (Figure 10a). During summer, cool materials, vegetation, and shading plants drastically decrease surface temperature, thus reducing heat storage in urban fabric and so lowering urban heat island effect (Figure 10b).
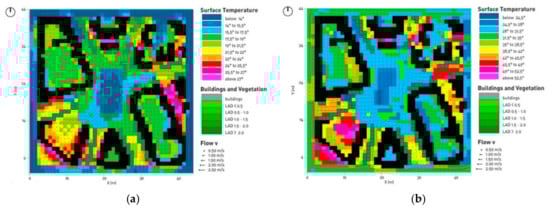
Figure 10.
Scenario 2 surface temperature and wind speed analysis: (a) Winter analysis based on 21st December at 3:00 p.m.; (b) Summer analysis based on 21st June at 3:00 p.m. (analysis software: ENVI-met 3.1).
Assessing the PET variations found in the two urban regeneration scenarios, during the summer both scenario S1 and scenario S2 show a broader distribution of PET levels that are lower during the day than the initial condition evidenced in scenario S0, demonstrating their potential for thermal comfort, attenuating summer overheating.
As regards scenario S1 done with the use of cool materials, it is important to emphasize that regardless of whether they are used for pavement or on façades, they show a significant cooling effect on the surface temperature.
As to the scenario S2 results, the study shows the significant mitigation potential of trees, due to the shading determined by the geometry and characteristics of the canopy and the leaf area density (LAD).
The first scenario, with the use of cool materials, improves summer conditions and reduces the urban heat island effect but does not eliminate thermal discomfort due to the lack of shaded surfaces or vegetation. The second scenario, where material renovations are matched with vegetation improvements, has a small bad effect on winter conditions but drastically ameliorates the summer situation, both for direct users and, thanks to the strong reduction of the urban heat island effect, to urban inhabitants as a whole.
The air temperature (Tair) is the parameter that registers the least changes between the base scenario and the two proposed upgrading scenarios. In scenario 1 (cool materials) the delta is equal to −0.5 °C and −1.0 °C at 12.00 while there is a greater extension of the intermediate values, i.e., what is interesting to note is that it is not so much the delta that changes and the extension in the distribution of intermediate temperature values, which involve a greater area of the pedestrian square. Scenario 2 (cool pavements + trees) records a sharper lowering of the Tair value equal to −1 °C, at 16.00 there is a delta of −0.5 °C compared to 16.00 of the starting scenario (Figure 11).
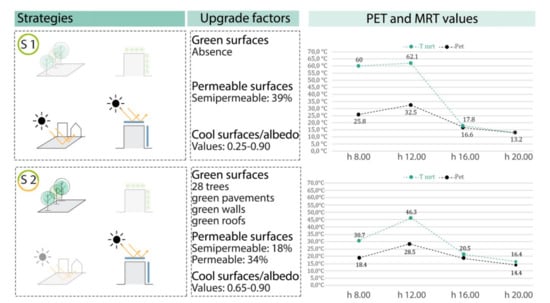
Figure 11.
Variation of Tair, surface T and mrt T between S0, S1 and S2 during summer (21 June).
It is possible to see how the albedo factor affects convective exchanges more decisively, since by decreasing the surface temperature of the materials, the convective exchanges between surface and air and therefore the temperature of the air itself decrease. The parameter of the surface temperature (T surfaces) is perhaps one of the most easily read parameters of microclimatic simulations, since it is in direct correspondence with the physical and thermal characteristics of the material used in particular its reflection coefficient, as well as in direct relation to the shading factor. The most performing scenario is scenario 2, where the combination of trees and cool coloured flooring results in a delta equal to −2 °C (Figure 11).
The scenario that presents the highest values of Tmrt and therefore pejorative compared to the basic scenario turns out to be scenario 2, combination-application of cool coloured materials to all the architectural surfaces of the urban area, which records an increase in Tmrt equal to +4.5 °C at 8.00 and +7.3 °C at 12.00. During the day, therefore, the increase in the solar reflection of the surfaces leads to a lowering of the air temperature and a significant lowering of the temperatures of the surfaces themselves; however, the effect on the average radiant temperature is worse, with consequent modification of the PET (Figure 12).
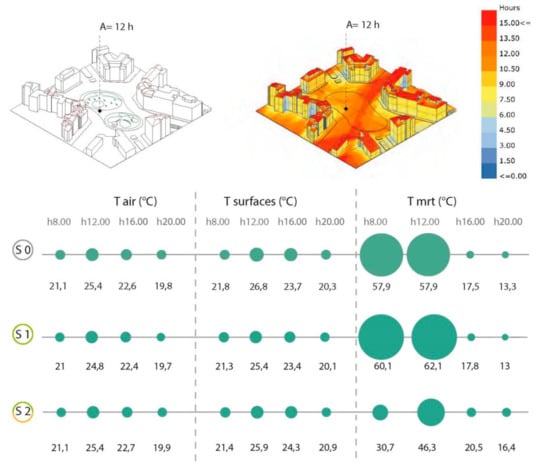
Figure 12.
Final comparison between S1, S2 during summer (21 June).
5. Conclusions
The results of this study reveal certain aspects of importance for the regeneration of open spaces in the setting of an established Mediterranean city. In the first place, the study casts light on how, during the summer, significant results on attenuating the urban heat island can be obtained thanks to the use of innovative materials, particularly if accompanied by the use of shading vegetation.
Moreover, the use of vegetation has a better effect on outdoor thermal comfort, as shown by the scenario S2 results (Figure 11 and Figure 12).
The open spaces with trees in combination with pavement made using cool materials, and cool roofs, are demonstrated to be an effective strategy for mitigating the phenomenon of summer overheating and for improving outdoor thermal comfort. As regards the use of cool material for the renewal of pavement, roofs, and façades in a consolidated urban environment, they improve the conditions of summer outdoor with a mitigation effect as concerns surface temperatures.
Additional investigations should be done on their behaviour in different orientations and design configurations with patterns of other materials, leading research to analyse additional combinations of hybrid technologies of cool materials, the use of vegetation like the green wall, and the use of water to promote evaporative cooling on the pedestrian level. Lastly, as to the use of vegetation, additional simulations might permit a more targeted choice of newly planted trees, assessing the performance of different trees and the cooling effect on the outdoor environment depending on the type, position, and orientation of the foliage.
In particular, more targeted studies could be conducted on the design of more comfortable open spaces, especially during summer overheating, for the fragile segment of the population such as children and even the elderly.
In fact, as shown in Figure 13 and Figure 14, which compares the hottest hours between 13 and 17, the children in scenario 1 and 2 are in more disadvantaged conditions than a 35 year old man and woman (perceiving a PET of 3.5° lower in winter and only 0.7° lower in summer in scenario 1 and 2.8° lower in winter and 1.2° lower in summer in scenario 2 than that of an adult man and 3.1° lower in winter and only 0.3° lower in summer than that of an adult woman in scenario 1, while in scenario 2 it is 2.5° lower in winter and 0.8° lower in summer).
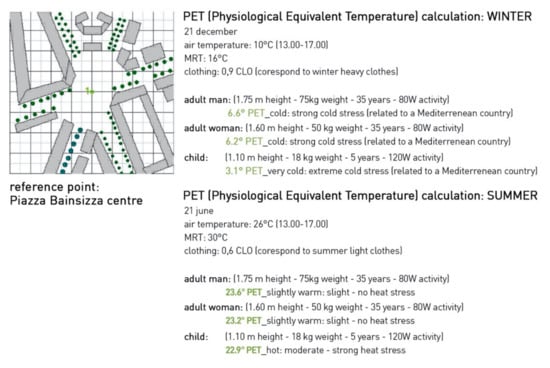
Figure 13.
Microclimatic comfort analysis of scenario 1 (S1): PET during winter and summer.
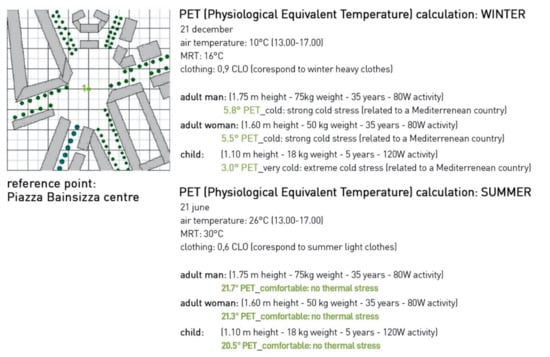
Figure 14.
Microclimatic comfort analysis of scenario 2 (S2): PET during winter and summer.
Funding
This research received no external funding.
Acknowledgments
Conflicts of Interest
The author declares no conflict of interest.
References
- Intergovernmental Panel for Climate Change. IPCC Global Warming of 1.5 °C An IPCC Special Report on the Impacts of Global Warming of 1.5 °C Above Pre-Industrial Levels and Related Global Greenhouse Gas Emission Pathways, in the Context of Strengthening the Global Response to the Threat of Climate Change, Sustainable Development, and Efforts to Eradicate Poverty, 1st ed.; IPCC: Geneva, Switzerland, 2018; ISBN 978-92-9169-151-7. [Google Scholar]
- UNFCCC. Yearbook of Global Climate Action 2019, 1st ed.; UNFCCC: Bonn, Germany, 2019; ISBN 978-92-9219-186-3. [Google Scholar]
- Landsberg, H.E. The Urban Climate; Academic Press: New York, NY, USA, 1983; ISBN 978-0-12-435960-4. [Google Scholar]
- Manley, G. On the frequency of snowfall in metropolitan England. Q. J. R. Meteorol. Soc. 1958, 84, 70–72. [Google Scholar] [CrossRef]
- US EPA. Reducing Urban Heat Islands: Compendium of Strategies. 2009. Available online: http://www.epa.gov/heatisld/resources/compendium.html (accessed on 12 May 2019).
- Pearlmutter, D. Patterns of sustainability in desert architecture. Arid Lands Newsl. 2000, 47, 1–12. Available online: http://ag.arizona.edu/oals/ALN/aln47/pearlmutter.html (accessed on 12 May 2019).
- US EPA. Smart Growth and Urban Heat Islands. 2009. Available online: http://www.epa.gov/heatisld/resources/pdf/smartgrowthheatislands.pdf (accessed on 12 May 2019).
- Oke, T.R. The energetic basis of the urban heat island. Q. J. R. Meteorol. Soc. 1982, 108, 1–24. [Google Scholar] [CrossRef]
- Golden, J. The built environment induced urban heat island effect in rapidly urbanizing arid regions—A sustainable urban engineering complexity. Environ. Sci. 2004, 1, 249–321. [Google Scholar] [CrossRef]
- Santamouris, M. Heat island research in Europe—The state of the art. ABER 2007, 1, 123–150. [Google Scholar] [CrossRef]
- Lee, H.; Mayer, H.; Chen, L. Contribution of trees and grasslands to the mitigation of human heat stress in a residential district of Freiburg, Southwest Germany. Landsc. Urban Plan. 2016, 148, 37–50. [Google Scholar] [CrossRef]
- Piselli, C.; Castaldo, V.; Pigliautile, I.; Pisello, A.; Cotana, F. Outdoor comfort conditions in urban areas: On citizens’ perspective about microclimate mitigation of urban transit areas. Sustain. Cities Soc. 2018, 39, 16–36. [Google Scholar] [CrossRef]
- Nouri, A.S.; Costa, J.P. Addressing thermophysiological thresholds and psychological aspects during hot and dry mediterranean summers through public spacedesign: The case of Rossio. Build. Environ. 2017, 118, 67–90. [Google Scholar] [CrossRef]
- Hassler, U.; Kohler, N. Resilience in the built environment. Build. Res. Inf. 2014, 42, 119–129. [Google Scholar] [CrossRef]
- Holling, C.S. Myths of ecology and energy. In Perspectives on Energy: Issues, Ideas, and Environmental Dilemmas, 2nd ed.; Ruedisili, L.C., Firebaugh, M.W., Eds.; Oxford University Press: New York, NY, USA, 1982; Volume 3, pp. 8–15. [Google Scholar]
- Cretney, R. Resilience for whom? Emerging critical geographies of socio-ecological resilience. Geogr. Compass 2014, 8, 627–640. [Google Scholar] [CrossRef]
- Holling, C.S. Resilience and stability of ecological systems. Annu. Rev. Ecol. Syst. 1973, 4, 1–23. [Google Scholar] [CrossRef]
- Nelson, S.H. Resilience and the neoliberal counter-revolution: From ecologies of control to production of the common. Resilience 2014, 2, 1–17. [Google Scholar] [CrossRef]
- Gunderson, H.; Pritchard, L. Resilience and the Behavior of Large-Scale Systems, 1st ed.; Island Press: Covelo, CA, USA, 2002; ISBN 1-55963-970-9. [Google Scholar]
- Meerow, S.; Newell, J.P.; Stults, M. Defining urban resilience: A review. Landsc. Urban Plan. 2016, 147, 38–49. [Google Scholar] [CrossRef]
- OECD. Resilient Cities. Available online: http://www.oecd.org/cfe/regional-policy/resilient-cities.html (accessed on 21 July 2018).
- Santamouris, M. Cooling the cities—A review of reflective and green roof mitigation technologies to fight heat island and improve comfort in urban environments. Sol. Energy 2014, 103, 682–703. [Google Scholar] [CrossRef]
- European Environment Agency. Urban Adaptation to Climate Change in Europe 2016: Transforming Cities in a Changing Climate, 1st ed.; EEA: Copenhagen, Denmark, 2016; ISBN 978-92-9213-741-0. [Google Scholar]
- Shashua-Bar, L.; Hoffman, M.E. Vegetation as a climatic component in the design of an urban street: An empirical model for predicting the cooling effect of urban green areas with trees. Energy Build. 2000, 31, 221–235. [Google Scholar] [CrossRef]
- Pisello, A.L. State of the art on the development of cool coatings for buildings and cities. Sol. Energy 2017, 144, 660–680. [Google Scholar] [CrossRef]
- Yang, J.; Wang, Z.H.; Kaloush, K.E. Environmental impacts of reflective materials: Is high albedo a ‘silver bullet’ for mitigating urban heat island? Renew. Sustain. Energy Rev. 2015, 47, 830–843. [Google Scholar] [CrossRef]
- Akbari, H.; Cartalis, C.; Santamouris, M.; Synnefa, A.; Kolokotsa, D.; Muscio, A.; Pisello, A.L.; Rossi, F.; Wong, N.H.; Zinzi, M. Local climate change and urban heat island mitigation techniques—The state of the art. J. Civ. Eng. Manag. 2016, 22, 1–16. [Google Scholar] [CrossRef]
- Santamouris, M.; Gaitani, N.; Spanou, A.; Saliari, M.; Giannopoulou, K.; Vasilakopoulou, K.; Kardomateas, T. Using cool paving materials to improve microclimate of urban areas—Design realization and results of the flisvos project. Build. Environ. 2012, 53, 128–136. [Google Scholar] [CrossRef]
- Erell, E.; Pearlmutter, D.; Boneh, D.; Kutiel, P.B. Effect of high-albedo materials on pedestrian heat stress in urban street canyons. Urban Clim. 2014, 10, 367–386. [Google Scholar] [CrossRef]
- Taleghani, M.; Berardi, U. The effect of pavement characteristics on pedestrians’ thermal comfort in Toronto. Urban Clim. 2018, 24, 449–459. [Google Scholar] [CrossRef]
- Chatzidimitriou, A.; Yannas, S. Microclimate development in open urban spaces: The influence of form and materials. Energy Build. 2015, 108, 156–174. [Google Scholar] [CrossRef]
- Shahidan, M.F.; Jones, P.J.; Gwilliam, J.; Salleh, E. An evaluation of outdoor and building environment cooling achieved through combination modification of trees with ground materials. Build. Environ. 2012, 58, 245–257. [Google Scholar] [CrossRef]
- Laureti, F.; Martinelli, L.; Battisti, A. Assessment and mitigation strategies to counteract overheating in urban historical areas in Rome. Climate 2018, 6, 18. [Google Scholar] [CrossRef]
- Kolokotsa, D.; Maravelaki-Kalaitzaki, P.; Papantoniou, S.; Vangeloglou, E.; Saliari, M.; Karlessi, T.; Santamouris, M. Development and analysis of mineral based coatings for buildings and urban structures. Sol. Energy 2012, 86, 1648–1659. [Google Scholar] [CrossRef]
- Synnefa, A.; Santamouris, M.; Livada, I. A study of the thermal performance of reflective coatings for the urban environment. Sol. Energy 2006, 80, 968–981. [Google Scholar] [CrossRef]
- Karlessi, T.; Santamouris, M.; Apostolakis, K.; Synnefa, A.; Livada, I. Development and testing of thermochromic coatings for buildings and urban structures. Sol. Energy 2009, 83, 538–551. [Google Scholar] [CrossRef]
- Bretz, S.E.; Akbari, H. Long-term performance of high albedo roof coatings. Energy Build. 1997, 25, 159–167. [Google Scholar] [CrossRef]
- Saaroni, H.; Amorim, J.; Hiemstra, J.; Pearlmutter, D. Urban Green Infrastructure as a tool for urban heat mitigation: Survey of research methodologies and findings across different climatic regions. Urban Clim. 2018, 24, 94–110. [Google Scholar] [CrossRef]
- Building a Green Infrastructure for Europe. Available online: https://www.worldcat.org/title/building-a-green-infrastructure-for-europe/oclc/875969246&referer=brief_results (accessed on 4 August 2018).
- United Nations Human Settlements Program (UN-Habitat). The State of European Cities 2016 Cities Leading the Way to a Better Future, 1st ed.; Publications Office: Luxembourg, 2016; ISBN 978-92-79-64259-3. [Google Scholar]
- Human-Biometeorological Conditions and Thermal Perception in a Mediterranean Coastal Park. Available online: https://link.springer.com/article/10.1007%2Fs00484-014-0944-z (accessed on 22 July 2018).
- Spronken-Smith, R.A.; Oke, T.R. The thermal regime of urban parks in two cities with different summer climates. Int. J. Remote Sens. 1998, 19, 2085–2104. [Google Scholar] [CrossRef]
- Bowler, D.E.; Buyung-Ali, L.; Knight, T.M.; Pullin, A.S. Urban greening to cool towns and cities: A systematic review of the empirical evidence. Landsc. Urban Plan. 2010, 97, 147–155. [Google Scholar] [CrossRef]
- Ketterer, C.; Matzarakis, A. Human-biometeorological assessment of heat stress reduction by replanning measures in Stuttgart, Germany. Landsc. Urban Plan. 2014, 122, 78–88. [Google Scholar] [CrossRef]
- Analysis and Comparison of Shading Strategies to Increase Human Thermal Comfort in Urban Areas. Available online: http://www.mdpi.com/2073-4433/9/3/91 (accessed on 22 July 2018).
- Upreti, R.; Wang, Z.H.; Yang, J. Radiative shading effect of urban trees on cooling the regional built environment. Urban For. Urban Green. 2017, 26, 18–24. [Google Scholar] [CrossRef]
- Roy, S.; Byrne, J.; Pickering, C. A systematic quantitative review of urban tree benefits, costs, and assessment methods across cities in different climatic zones. Urban For. Urban Green. 2012, 11, 351–363. [Google Scholar] [CrossRef]
- Rahman, M.A.; Armson, D.; Ennos, A.R. A comparison of the growth and cooling effectiveness of five commonly planted urban tree species. Urban Ecosyst. 2015, 18, 371–389. [Google Scholar] [CrossRef]
- Akbari, H.; Pomerantz, M.; Taha, H. Cool surfaces and shade trees to reduce energy use and improve air quality in urban areas. Sol. Energy 2001, 70, 295–310. [Google Scholar] [CrossRef]
- Fini, A.; Frangi, P.; Mori, J.; Donzelli, D.; Ferrini, F. Nature based solutions to mitigate soil sealing in urban areas: Results from a 4-year study comparing permeable, porous, and impermeable pavements. Environ. Res. 2017, 156, 443–454. [Google Scholar] [CrossRef] [PubMed]
- Kala, J.; De Kauwe, M.G.; Pitman, A.J.; Medlyn, B.E.; Wang, Y.P.; Lorenz, R.; Perkins-Kirkpatrick, S.E. Impact of the representation of stomatal conductance on model projections of heatwave intensity. Sci. Rep. 2016, 6, 23418. [Google Scholar] [CrossRef]
- A Practical Guide to Cool Roofs and Cool Pavements. Available online: https://www.coolrooftoolkit.org/read-the-guide/ (accessed on 22 July 2018).
- Liu, K.; Baskaran, B. Thermal performance of green roofs through field evaluation. In Proceedings of the first North American Green Roof Infrastructure Conference, Awards and Trade Show: Greening Rooftops for Sustainable Communities, Chicago, IL, USA, 29–30 May 2003. [Google Scholar]
- Lazzarin, R.M.; Castellotti, F.; Busato, F. Experimental measurements and numerical modelling of a green roof. Energy Build. 2005, 37, 1260–1267. [Google Scholar] [CrossRef]
- Berardi, U. The outdoor microclimate benefits and energy saving resulting from green roofs retrofits. Energy Build. 2016, 121, 217–229. [Google Scholar] [CrossRef]
- Smith, K.R.; Roebber, P.J. Green roof mitigation potential for a proxy future climate scenario in Chicago, Illinois. J. Appl. Meteorol. Climatol. 2011, 50, 507–522. [Google Scholar] [CrossRef]
- Rosenzweig, C.; Solecki, W.; Parshall, L.; Gaffin, S. Mitigating New York City’s Heat Island with Urban Forestry, Living Roofs and Light Surfaces, 1st ed.; Columbia University: New York, NY, USA, 2006. [Google Scholar]
- Asaeda, T.; Ca, V.T.; Wake, A. Heat storage of pavement and its effect on the lower atmosphere. Atmos. Environ. 1996, 30, 413–427. [Google Scholar] [CrossRef]
- Mancini, F.; Nastasi, B. Solar energy data analytics: PV deployment and land use. Energies 2020, 13, 417. [Google Scholar] [CrossRef]
- Nikolopoulou, M.; Steemers, K. Thermal comfort and psychological adaptation as a guide for designing urban spaces. Energy Build. 2003, 35, 95–101. [Google Scholar] [CrossRef]
- Dessì, V.; Rogora, R. Il Comfort Ambientale Degli Spazi Aperti; EdicomEdizioni: Gorizia, Italy, 2005. [Google Scholar]


Publisher’s Note: MDPI stays neutral with regard to jurisdictional claims in published maps and institutional affiliations. |
© 2020 by the author. Licensee MDPI, Basel, Switzerland. This article is an open access article distributed under the terms and conditions of the Creative Commons Attribution (CC BY) license (http://creativecommons.org/licenses/by/4.0/).