Article

One-Dimensional Heterogeneous Reaction Model of a Drop-Tube Carbonator Reactor for Thermochemical Energy Storage Applications

by
Evgenios Karasavvas
1,
Athanasios Scaltsoyiannes
2,
Andy Antzaras
2,
Kyriakos Fotiadis
1,
Kyriakos Panopoulos
1,
Angeliki Lemonidou
2,
Spyros Voutetakis
1 and
Simira Papadopoulou
1,3,*
1
Chemical Process & Energy Resources Institute (CPERI), Centre for Research and Technology Hellas (CERTH), P.O. Box 60361, 57001 Thessaloniki, Greece
2
Department of Chemical Engineering, Aristotle University of Thessaloniki (AUTH), P.O. Box 472, 54124 Thessaloniki, Greece
3
Department of Industrial Engineering and Management, International Hellenic University (IHU), P.O. Box 141, 57001 Thermi, Greece
*
Author to whom correspondence should be addressed.
Energies 2020, 13(22), 5905; https://doi.org/10.3390/en13225905
Submission received: 23 September 2020 / Revised: 6 November 2020 / Accepted: 9 November 2020 / Published: 12 November 2020

Abstract

:
Calcium looping systems constitute a promising candidate for thermochemical energy storage (TCES) applications, as evidenced by the constantly escalating scientific and industrial interest. However, the technologically feasible transition from the research scale towards industrial and highly competitive markets sets as a prerequisite the optimal design and operation of the process, especially corresponding reactors. The present study investigates for the first time the development of a detailed, one-dimensional mathematical model for the steady-state simulation of a novel drop-tube carbonator reactor as a core equipment unit in a concentrated solar power (CSP)-thermochemical energy storage integration plant. A validated kinetic mathematical model for a carbonation reaction (CaO(s) + CO2(g) → CaCO3(s)) focused on thermochemical energy storage conditions was developed and implemented for different material conditions. The fast gas–solid reaction kinetics conformed with the drop-tube reactor concept, as the latter is suitable for very fast reactions. Reaction kinetics were controlled by the reaction temperature. Varying state profiles were computed across the length of the reactor by using a mathematical model in which reactant conversions, the reaction rate, and the temperature and velocity of gas and solid phases provided crucial information on the carbonator’s performance, among other factors. Through process simulations, the model-based investigation approach revealed respective restrictions on a tailor-made reactor of 10 kWth, pointing out the necessity of detailed models as a provision for design and scale-up studies.

Graphical Abstract

1. Introduction

As an environmentally sustainable process for green energy production, thermochemical energy storage (TCES) supported by concentrated solar power (CSP) has been at the center of the research and industry community for over two decades. The reason for this mobilization is that, along with TCES systems, CSP constitutes a carbon free technology that alleviates global warming and exploits the renewable aspects of solar energy, incorporating mature technologies for power production (i.e., Steam Rankine Cycle). The global installed capacity of CSP has seen a great increase over the last 10 years and approximate counts of 5 GWe, with an escalating trend that could even double in 2020 [1]. Increasing public attention to environmental protection and the political decisions that change the preferences of manufacturers from conventional to renewable solutions are the major factors influencing these market dynamics. Nevertheless, commercial intrusion into the global power market has so far been conservative, and definitely has not aligned with the requirements of this expanding economy.
Well-established CSP systems are used commercially nowadays, producing a sufficient amount of electricity. Sensible heat storage (i.e., molten salts, oils), latent heat storage (i.e., thermochemical energy storage (TCES) and phase change materials (PCMs)) belong to the broader family of energy storage systems. Molten salts, a sensible heat storage system, performs the most mature technology at an industrial scale. Although several commercial plants trade on these technologies, significant drawbacks have restrained their widespread use. For example, molten salt technologies suffer as a result of their corrosiveness [2], their limited power-cycle efficiency due to limitations on their operating temperatures (i.e., temperatures above ~550 °C induce salt degradation) [3] and the significant energy consumption continuously needed to abstain from salt solidification (molten salts suffer from severe solidification at temperatures below ~200 °C) [4]. Moreover, due to unavoidable energy losses and intermittency, molten salts can only produce and store energy for short-term periods.
Recently, TCES systems integrated with CSP have emerged as an alternative for long-term energy storage and electricity production. In such systems, the heat is stored via an endothermic chemical reaction exploiting solar energy, which is released later during the reverse exothermic reaction. The products of both reactions can be stored according to the operating conditions of the installation, and TCES has numerous advantages over the previous technologies. Energy densities of the materials used in TCES re approximately 5–10 times higher than the materials used in latent and sensible heat storage systems, and storage periods are longer, as products can be stored at ambient conditions [2].
Among diverse chemical systems for thermochemical energy storage, calcium looping (CaL)—which relies on the calcination–carbonation reaction system (Equation (1))—stands as one of the most promising technologies [5]. Numerous advantages of this system such as high energy density (~3.2 GJ/m3 compared with ~0.8 GJ/m3 in commercially installed molten salts units) and the extremely low price of natural limestone CaCO3 (~€10/ton) have been extensively discussed, among other factors, in the literature [5,6,7]. Furthermore, the commercial potential of the CSP-CaL integration for thermochemical energy storage and power production has been theoretically studied in detail by numerous authors in terms of energy analysis [5,8,9], exergy analysis [10,11] and the optimization of power cycles used for energy production [12,13], proving the potential commercialization of these systems.
CaCO 3   s CaO   s + CO 2   g             Δ H r x n 0 178   kJ / mol
The feasible transition of CSP-CaL systems from a research scale towards a highly competitive industrial scale will require the development of rigorous mathematical models to be used as tools that can simulate and predict process activities in a systematic and consistent manner. However, one can see from the current literature that has been no adequate published research work in relation to the development of steady-state or dynamic mathematical reactor models. The literature has extensively explored how calcination and carbonation reactions can be accomplished in different reactor types [14], but recent model developments of both reactors have referred mainly to applications relevant to post-combustion CO2 capture, and reaction conditions and kinetics in these applications are different from those used in CSP-CaL processes. Typical conditions in CO2 capture applications involve low CO2 partial pressures that exit from the flue gases of power plants (~10% vol.) and temperatures around 650 °C during carbonation step. Under these conditions, and due to the sulphation of CaO and the multiple number of cycles, a material’s reactivity significantly drops in its residual value by 0.07–0.10 [15]. Moreover, the reactivity of the material depends on the calcination/carbonation conditions and grain size, as well as the origin of the solids [7].
In recent years, there have been numerous published works that have examined the simulation of heterogeneous gas–solid reaction systems in drop-tube or downflow reactors using mathematical models with different levels of complexity and accuracy [16,17,18,19,20,21,22,23,24]. Drop-tube reactors present a number of advantages compared to other types of reactors (i.e., risers), and are well known in the chemical and petrochemical industries. In a downer reactor, both solid and gas phases enter the reactor from the top, flowing concurrently under gravity and momentum of their inlet flows, and which results in a more uniform hydrodynamic flow and a better control of the contact between gas and solid phases [25] than the back-mixing flow and non-uniform radial distribution of solids that occurs in riser reactors [26,27]. The principles of these modelling techniques are used as a prototype in the current manuscript to provide a means by which to develop a detailed mathematical model of a drop-tube carbonator reactor as a provision for scale-up studies and industrial applications in CSP-CaL plants. Deng et al. [24] set up and implemented a one-dimensional (1D) model based on mass and momentum balance equations along with a hypothetical kinetic model for a downer reactor. The results pointed out the effect of varying superficial velocities on a reactor’s performance. Chuachuensuk et al. [21] developed a 1D model to describe the hydrodynamic characteristics and reaction kinetics of a downer regenerator reactor during the fluid catalytic cracking (FCC) process. The control of operating variables and reaction conditions was examined in terms of reactor performance. Moreover, Kasule et al. [18] developed a detailed mathematical model for the gasification of biomass in a single-stage, downward-firing, entrained-flow gasifier whereas the dynamic terms are involved later in [28]. Other similar studies have focused on the modelling strategies of different kinds of heterogeneous gas–solid reaction systems such as the oxidation of copper particles at high temperatures in a downer reactor [22], or the carbonation of CaO for CO2 capture applications in cement kilns [20]. Finally, two recent studies have presented the construction of novel experimental facilities for the carbonation of fine CaO particles in a drop-tube reactor [29] and an entrained-flow reactor [30], examining the efficiency of the decarbonization of gases when exposed to different conditions and materials. To the best of our knowledge, there has not been any published work related to an experimental or model-based investigation of CaO carbonation in a drop-tube reactor that has focused on the relevant conditions for thermochemical energy storage applications.
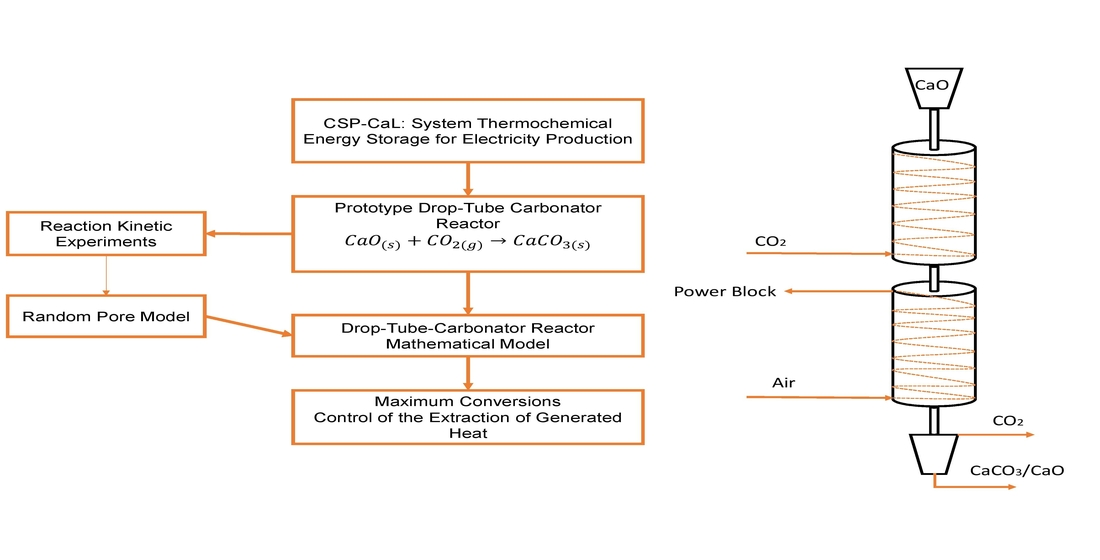
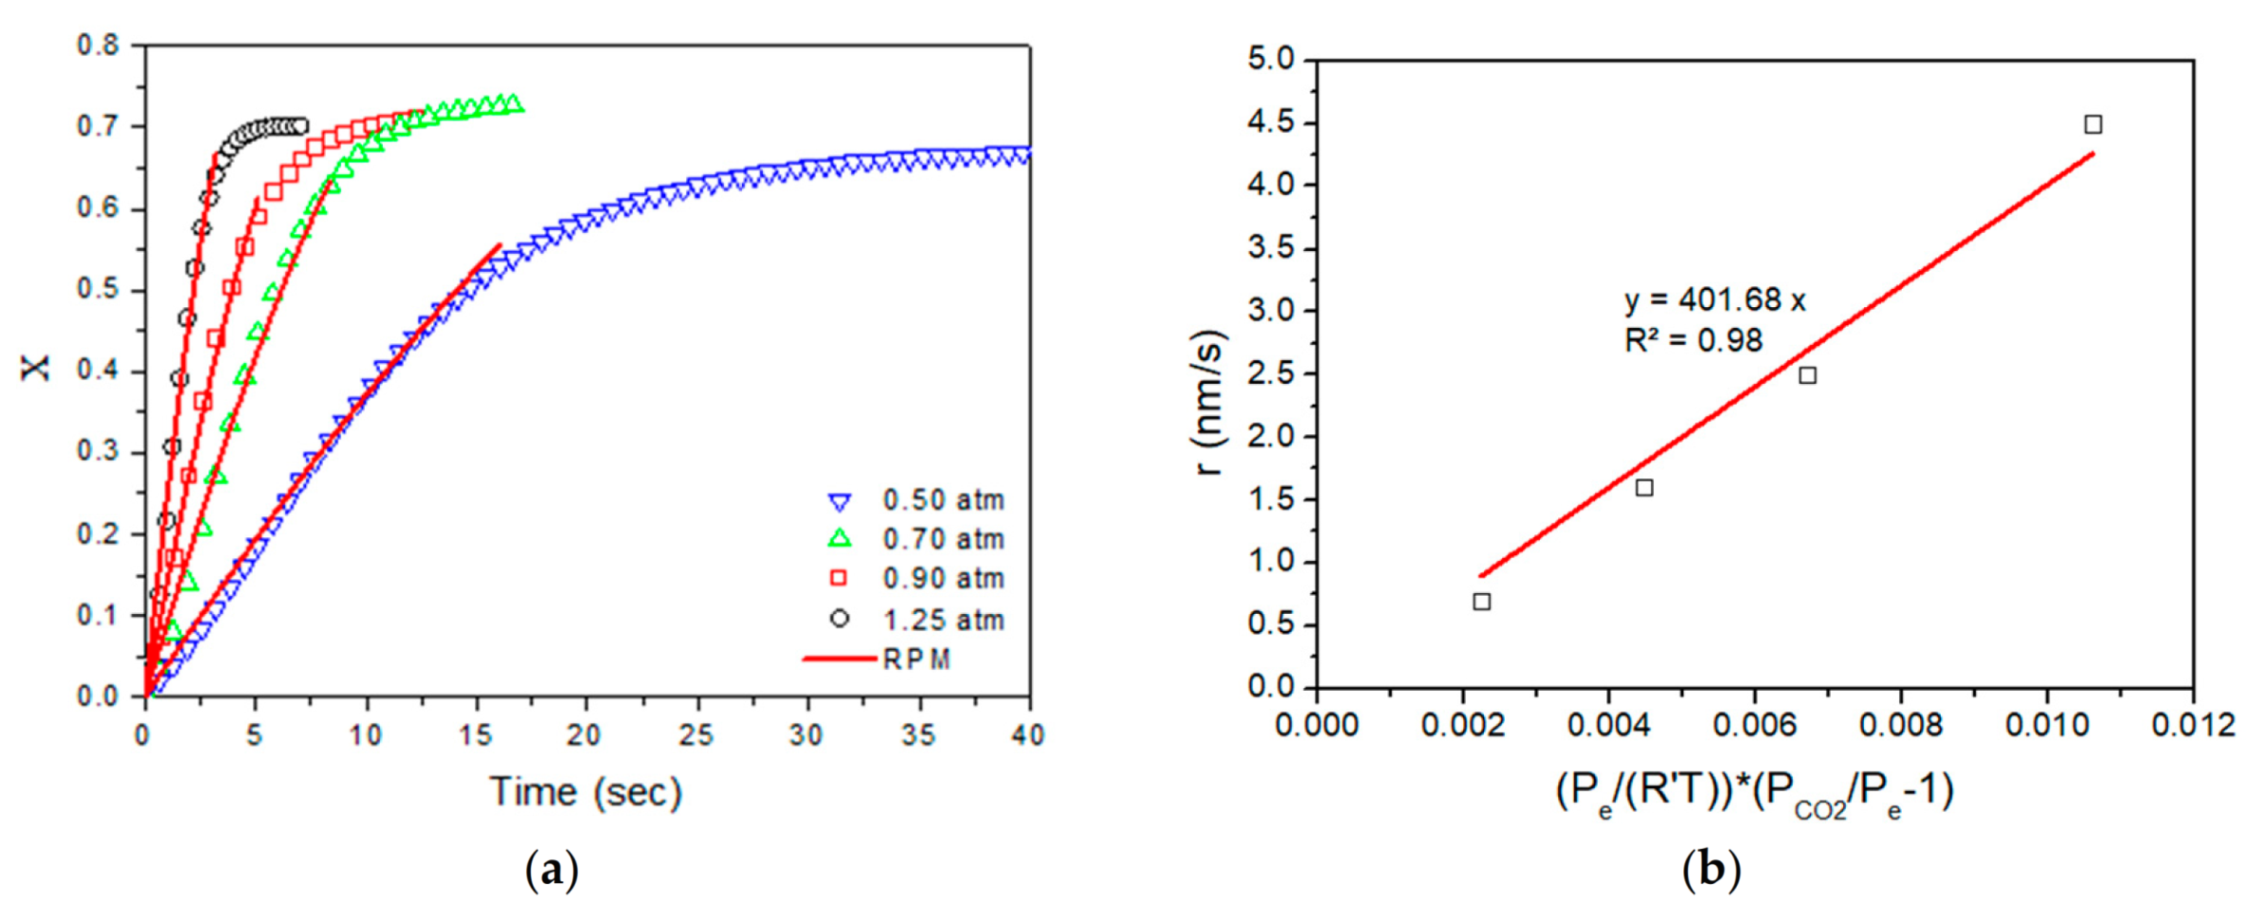
In this study, the development of a meticulous model of a tailor-made carbonator reactor for CSP-CaL integration is attempted for the first time, as part of the activities performed within the H2020 SOCRATCES project [31]. A detailed one-dimensional (1D), steady-state, heterogeneous reaction model of a drop-tube carbonator reactor was developed, focusing on simulation studies to reveal the operating performance of a 10 kWth reactor under different conditions. Mass, energy and momentum equations were considered for the two phases (gas and solid) derived by simplified Navier–Stokes equations. Moreover, the model included radiative heat transfer mechanisms and a random pore model (RPM) for carbonation kinetics that were validated through experimental work under conditions relevant to TCES. The main scope of this work is to demonstrate the model’s capabilities, and to describe the operations of a fixed-dimension prototype drop-tube carbonator reactor. The simulation studies investigate its performance, concerning the conversion and distribution of thermal power production across the length of the reactor, under different operating conditions. Subsequently, this will lead to future optimization, design and further scale-up studies. For this reason, critical variables were parametrically studied (i.e., the reactor’s wall temperatures, flows, carbonation pressure, etc.) with respect to process performance.

2. Concentrated Solar Power (CSP) and Calcium Looping (CaL) Concept Description

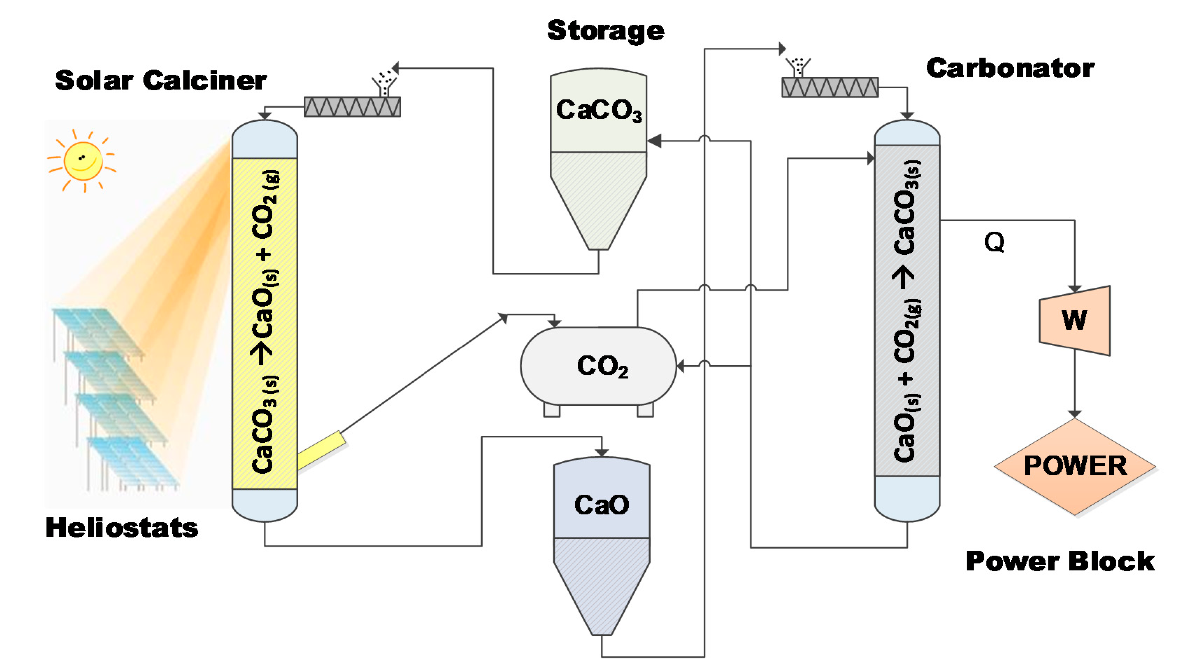
For the first time within a European Union (EU) research project [31], a CSP-CaL integrated system was tested to prove that stored thermochemical energy can be effectively used for electricity production. The prototype pilot plant (comprising a calciner, carbonator and power block) as well as storage modules are depicted in Figure 1. In this plant, solar energy is exploited to accomplish an endothermic calcination reaction where limestone (CaCO3) is decomposed towards CaO and CO2 (Equation (1)) in the calciner. The products are stored in vessels through the storage section, then react in the carbonator reactor to recover a large part of thermal energy through the exothermic carbonation reaction. The concept is completed via an engine (Figure 1) in the power block where this energy is explicitly used to produce electricity.
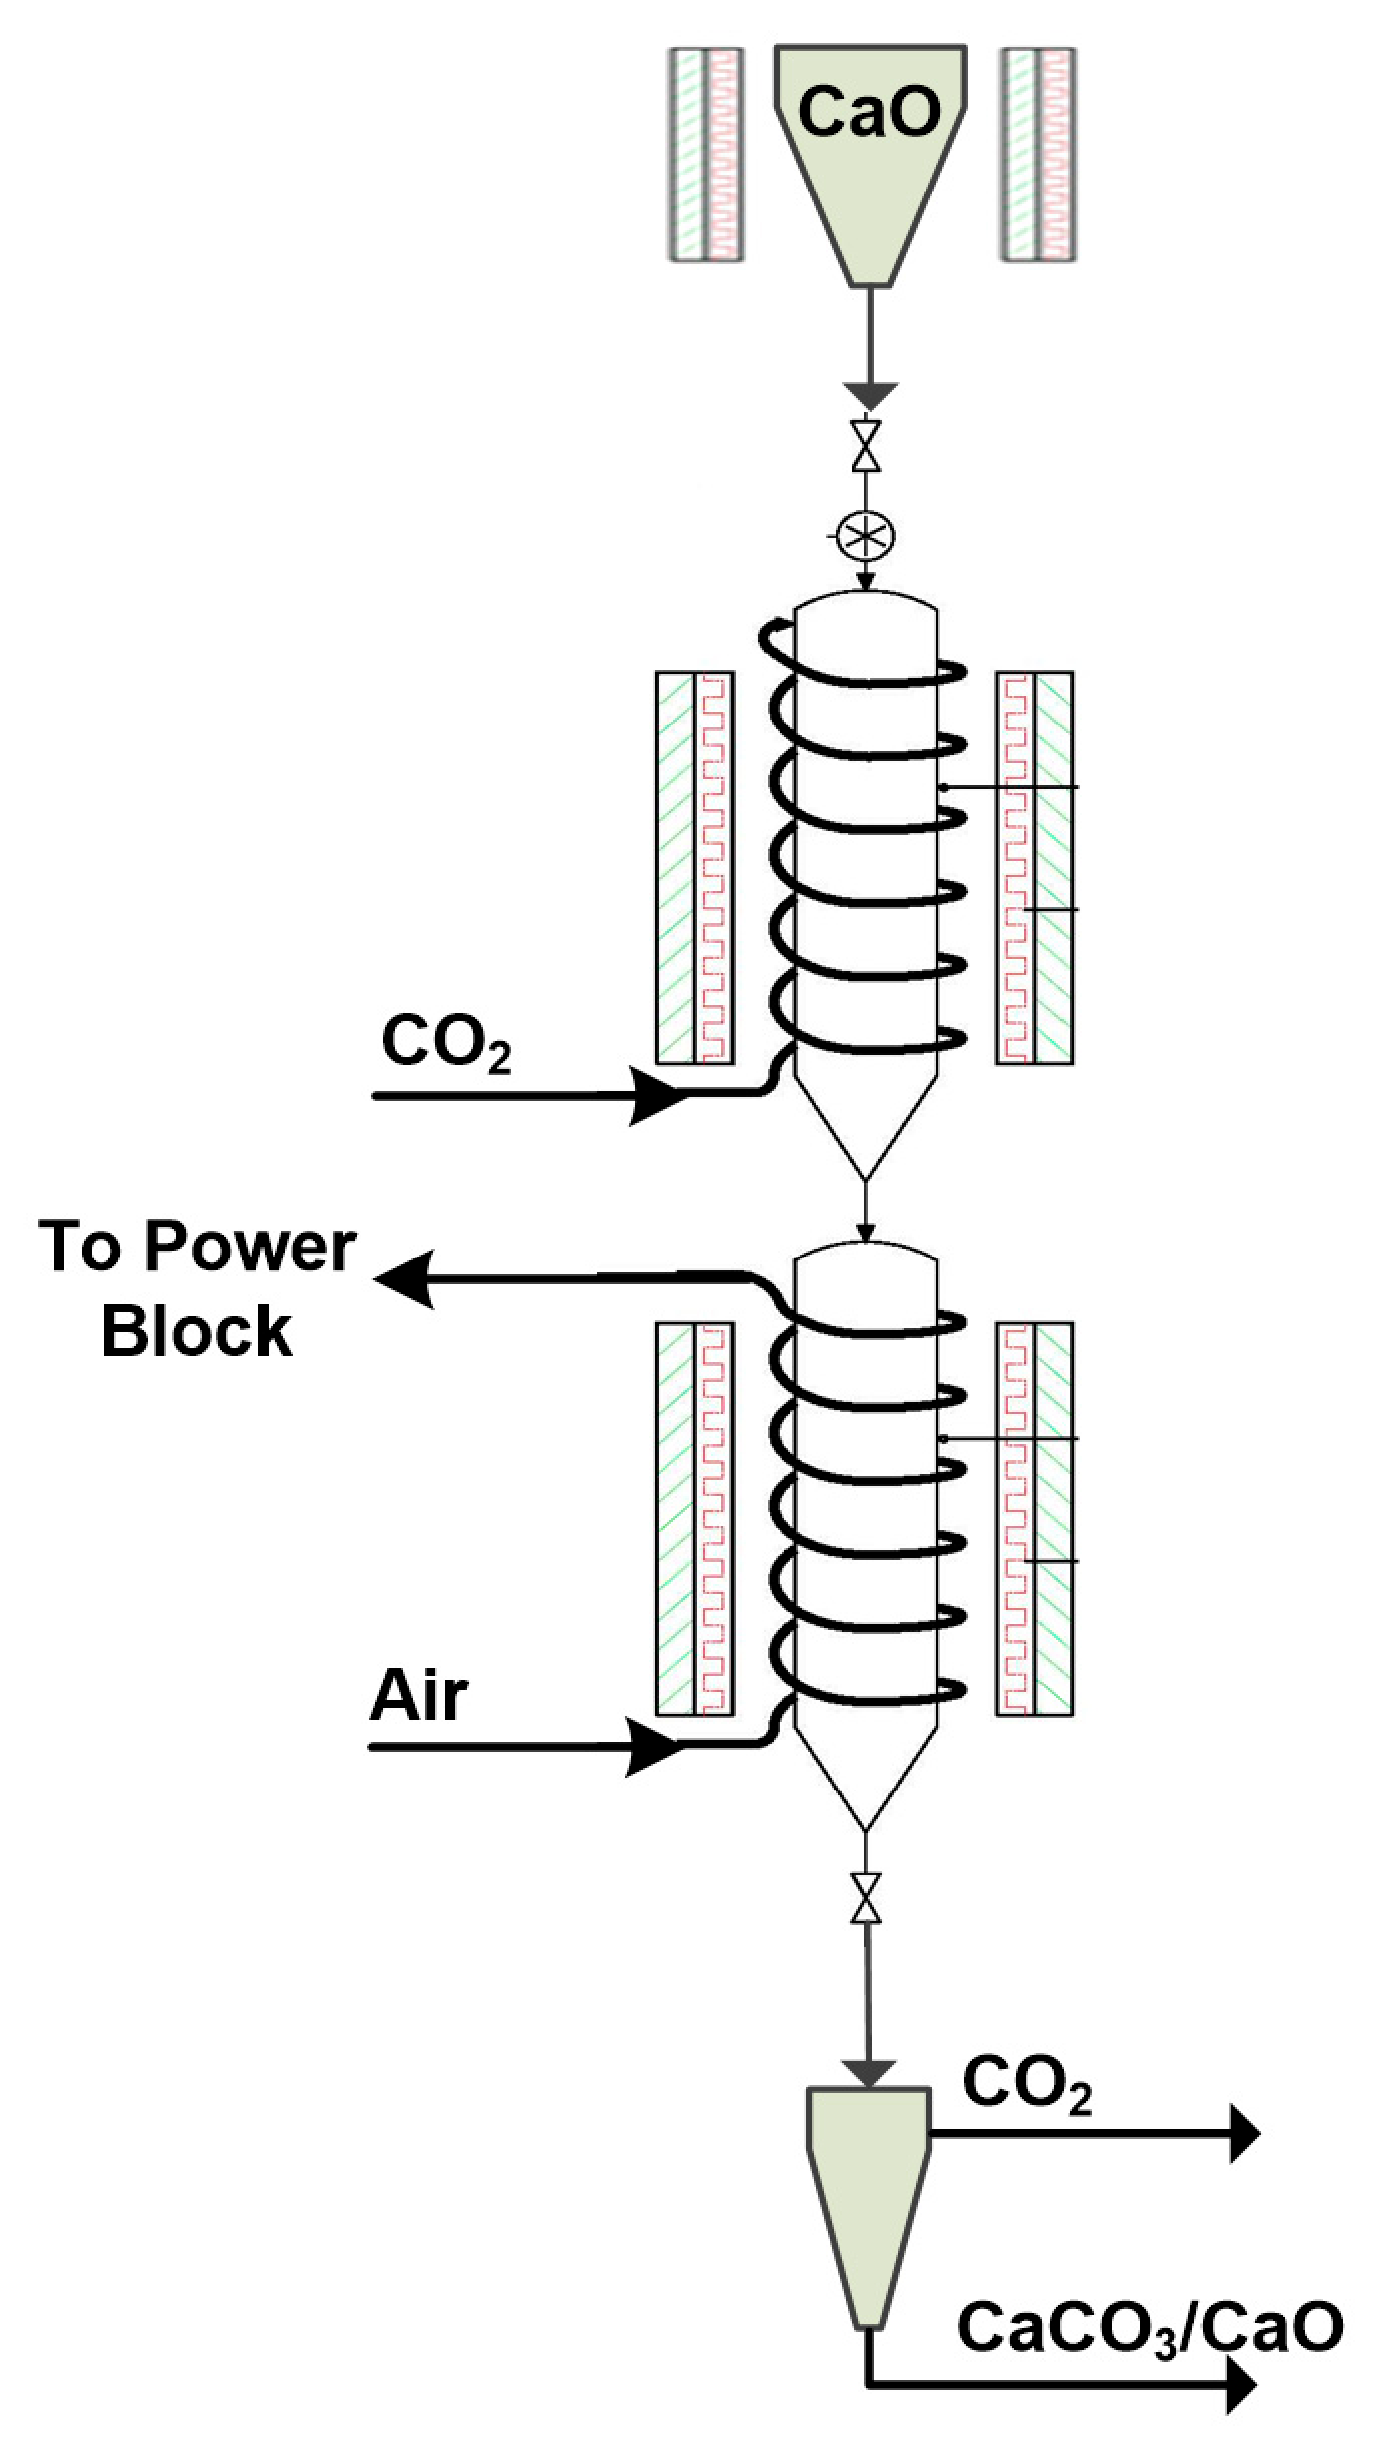
The carbonator reactor resembles a drop-tube (Figure 2) and is suitable for a wide range of fast gas–solid reaction systems [18,20,21,22]. It is divided into two sections and the dimensions selected (~0.154 m diameter and ~4 m length) are appropriate to achieve a long solid phase residence time. The initially calcined solids (CaO) are stored in a heated tank (~200 °C) on top of the reactor and enter into it mechanically via a screw feeder device. Pure CO2 is provided by pressurized bottles, entering from the top. A heat exchanger composed of a set of helical coils encircling the reactor is used for the removal of the heat released by the exothermic reaction. In the first reaction section, the CO2 reactant passes through the coils to preheat before entering the reactor, while in the second section, fresh air is used as the heat transfer fluid to act as a cheap and effective heat sink (Figure 2) [17]. The produced hot air is later used in the power block to provide heat for electricity generation. The two reactor segments are surrounded by electric furnaces that preheat the carbonator system in order to trigger the carbonation reaction (~400–500 °C).

3. Experimental

3.1. Materials and Methods

The precursor material used for the reaction kinetics experiments was limestone (Granicarb 0.1/0.8) from the OMYA company. Lime was produced after first calcination during pre-treatment under the conditions described in the next paragraph for the kinetic experiments and will be referred to in the manuscript as “fresh CaO”. The material denoted as “sintered CaO” was previously subjected to 10 successive carbonation/calcination cycles in the same fixed-bed reaction unit, with carbonation carried out under a pure CO2 flow ( P CO 2 = 1.25   atm at T = 850   ° C ) for a time period of 8 min (including the heating step to the calcination temperature). The calcination stage was carried out under a 25% vol. CO2/N2 flow at 900   ° C for a time period of 8 min (including the cooling step to the carbonation temperature under pure N2). Nitrogen physisorption at 77 K was applied for measuring the surface areas and pore volumes of the two materials in a Surface Area Analyzer (Autosorb-1 Quantachrome Instruments, Boynton Beach, FL, USA). Prior to these measurements, samples were degassed in a vacuum at 250 °C overnight.

3.2. Laboratory Test Procedure

A fixed-bed reactor unit was used for the kinetic experiments of the carbonation reaction. The gases were admitted to the quartz reactor (10 mm internal diameter) using mass flow controllers. An electric tubular furnace with three independently controlled temperature zones surrounding the reactor were used for heating, while the reaction temperature was continuously measured during the experiment using a coaxial thermocouple. The hot gases exiting the reactor were cooled down to room temperature and continuously analyzed by a mass spectrometer (MS) (Omnistar TM GSD 320, PFEIFFER, Nashua, NH, USA).
The sorbent material was sieved in the range of 45 < d p < 75 μm, and each time 100 mg were mixed with 1.5 g of quartz with particle sizes of 100 < d p < 180 μm and loaded into the reactor. The reactor was heated at a heating rate of 20 °C/min up to the carbonation temperature under N2 flow, with a gas hourly space velocity (GHSV) of 22,500 h−1 to complete calcination (pre-treatment). Carbonation was initiated at the prespecified temperature by switching the flow from pure N2 to 600 cc/min (GHSV = 27,000 h−1) of the desired CO2 (containing 2% vol. Ar used as an internal standard)/N2 mixture. The carbonation stage was carried out for 3 min isothermally. Given that Ar flow was constant, quantification of the adsorbed CO2 was performed while the carbonation reaction was taking place, based on the ratio of CO2/Ar signals (represented by mass/charge (m/z) ratios 44 and 40, respectively) of the mass spectrometer. Temperature in the reactor was also recorded throughout the procedure.

4. Model Development

4.1. The Random Pore Model (RPM)

Carbonation of CaO is characterized by two stages: a fast, initial surface reaction-controlled stage, followed by a much slower regime dominated by the diffusion of CO2 through the CaCO3 product layer. Bhatia and Perlmutter [32,33,34] developed a random pore model for the occurrence of both effects simultaneously using the general equation
d X CaO t d t = k s   S 0 C t 1 X CaO t 1 Ψ ln 1 X CaO t 1 ε 0 1 + β t Z Ψ 1 Ψ ln 1 X CaO t 1
Later, Li et al. [35] proved experimentally that CaCO3 accumulates in islands on CaO during carbonation, leaving free CaO surfaces that can react until the entire surface is covered by product layer and the diffusional regime starts. Moreover, Equation (2) predicts much lower reaction rates and conversions compared to the experimental results, due to the product layer’s diffusional resistance from the first moment of the reaction. Thus, for the fast regime, it can be assumed that the thickness of the product layer is zero, which implies that β could also be considered negligible, leading to
  d X CaO t d t = k s   S 0 C t 1 X CaO t 1 Ψ ln 1 X CaO t 1 ε 0
and after integrating [36]
X CaO t = 1 exp 1 τ t 2 Ψ + 1 2 Ψ ,           X X k
where τ is the dimensionless time given by
τ t =   r t S 0 t 1 ε 0
and Ψ is a structural parameter of the initial material containing S 0 , L 0 and ε 0 :
Ψ =   4 π L 0 1 ε 0 S 0 2
The initial surface area, total pore length and porosity ( S 0 , L 0 and ε 0 ) of the material before carbonation can be calculated using the Brunauer-Emmett-Teller (BET) measurement results, assuming a cylindrical pore geometry:
S 0 =   S B E T   ρ CaO   1 ε 0
ε 0 = P V 0   ρ CaO 1 + P V 0   ρ CaO
L 0 = S 0 2 4   π   ε 0
As the dependence of the carbonation rate on CO2 concentration is experimentally explored, the term of CO2 concentration C in Equation (3) is converted to partial pressure via the gas law and introduced in the reaction’s front velocity r as follows:
r T ,   P CO 2 = k s f P CO 2
For the diffusion-controlled regime that follows the surface reaction, the conversion-time equation is given by
X CaO t = X k + 1 exp 1 Ψ 1 β Ζ τ t 1 β Ζ Ψ 2 Ψ β 2 Ζ 2 ,       X X k
where
β = 2 k s a ρ CaO 1 ε 0 M W CaO b D p S 0
The apparent product-layer diffusivity is then calculated from
D p = b M CaO D C a ρ CaO
Grasa et al. [36] established an Arrhenius expression for effective product-layer diffusivity D , with a pre-exponential factor D 0 = 3.37 4.32 × 10 6   m 2 / s and activation energy for diffusion in the product layer E a D = 163   kJ / mol .
The material subjected to carbonation kinetic experiments was CaO derived from limestone (~99% wt. CaCO3) after initial calcination. In the reactor simulation studies, two cases were considered using a fresh (lime after first calcination) and a sintered material after cycling (lime after 10th calcination). The properties of these materials obtained from BET and Barrett-Joyner-Halenda (BJH) measurements, along with the calculated properties ( S 0 , L 0 , ε 0 and Ψ ) needed for the RPM, are shown in Table 1. As reported elsewhere [37,38], the surface area and porosity of the material after cycling were substantially reduced due to sintering.

4.2. Drop-Tube Carbonator Reactor Model Development

A one-dimensional (1D), steady-state carbonation model was developed to describe the physical and chemical phenomena taking place in a downflow carbonator reactor. The reduced order mathematical model solved mass, energy and momentum balances along the axial direction of the reactor for the gas and solid phases using the Eulerian expression for both and treating them as interpenetrating continua. The model solution provided cross-sectional averaged values of the state variables of each phase. The Eulerian–Eulerian approach defines each phase as a separate fluid with its own properties (i.e., temperature, velocity, density, etc.). The model also included a validated RPM model for the reaction kinetics developed experimentally in a laboratory-scale fixed-bed reactor.
The following assumptions were considered for the carbonator model development:
  • One-dimensional (1D) reaction model. The radial dispersions of mass, energy and momentum are neglected. The reaction model is solved along the z-axis of the reactor.
  • Steady-state plug flow reactor model assumption, which is verified by independent experimental studies [25,29,39].
  • The entrained-flow system is assumed to be very dilute in the solid phase, such that the particle-wall and interparticle interactions may be neglected. Consequently, the conductive heat transfer mechanism between single particles and particles to the wall is neglected [22].
  • Solids are spherical, with uniform sizes and temperatures. Change in the particle size during carbonation reaction is assumed negligible [16].
  • Kinetic energy and work forces of the system are negligible in comparison with thermal energy due to the high temperature in the reactor [18].
  • The gas phase is modelled after the ideal gas equation of state.
  • The wall temperature of the reactor is defined explicitly by constant values.
  • Due to the small particle sizes, particle–particle heat exchanges with radiation are not considered. Furthermore, gas phase (CO2) as a triatomic molecule takes part in radiative heat transfer due to its high temperature. According to the literature [40], a value of 0.7 is realistic for the reactor’s internal skin, based on stainless steel material.

4.2.1. Continuity Equations

The continuity equations for the gas and solid phases are obtained, respectively [41], as
d ε s z ρ s z u s z d z = Γ ˙ g s z
d ε g z ρ g z u g z d z = Γ ˙ g s z
where ε s , ρ s , u s are the volume fraction, density and velocity of solid phases, respectively, and ε g , ρ g , u g are the volume fraction, density and velocity of gas phases, respectively. Γ ˙ g s is the net mass transfer rate per unit volume from one phase to another due to the heterogeneous reaction [19,42].

4.2.2. Momentum Balance Equations

The momentum balance equations were developed for one dimension, originating from classic Navier–Stokes equations describing the relationship between the changing rate of momentum for each phase and the forces acting on them. In this study, drag force between phases ( F D ), friction forces due to wall shear ( F s w & F g w ), gravitational force acting downwards and force due to the addition of mass (in our case, mass is added to the solid phase due to the formation of CaCO3 on CaO surface) from gas phase to solid phase ( F m a s s ) are considered to be the dominant terms for the momentum conservation, while pressure drop is included as the simplest expression for the surface stress in the gas phase [41].
d ε s z ρ s z u s 2 z d z = F D z F s w z + ε s z ρ s z g + F m a s s z
d ε g z ρ g z u g 2 z d z = d P z d z F D z F g w z + ε g z ρ g z g F m a s s z .  
The terms related to the momentum balance equations [43] are summarized in Appendix A.

4.2.3. Energy Balance Equations

Equations (18) and (19) are the energy balance equations for the gas and solid phases. Changes in total enthalpy of the gas and solid phases per unit volume of the reactor are related to the thermal power transferred from the sods to the gas with convection ( Q s g   c o n v ), from the gas to the wall with convection ( Q g w c o n v ) and radiation mechanisms ( Q g w r a d ), to the thermal power generated by the carbonation reaction ( Q r x n ) and to the power associated with the reacting CO2 ( Q C O 2 , f l o w ) that is removed from the gas phase and transferred to the solids.
d ε s z u s z ρ s z c p , s z T s z d z = Q s g c o n v z + Q r x n z + Q CO 2 , f l o w z
d ε g z u g z ρ g z c p , g z T g z d z = Q s g c o n v z + Q g w c o n v z Q g w r a d z Q CO 2 , f l o w z
where a g s and a g w are the external surface area between gas and particles and between gas and the wall, respectively. Chemical reactions proceed on the particle’s surface wherein heat is generated. The produced heat is then transferred by convection towards the gas phase. h g s and h g w are the convective heat transfer coefficients for gas–solids and gas–wall, respectively, and are valid for all length pipes with constant or variant wall temperatures and during thermal and hydrodynamic development flow [40].
Q s g c o n v z = a g s z h g s z T s z T g z
Q g w c o n v z = a g w z h g w z T w z T g z
Q r x n z = Δ H r x n d X CaO t d t ρ s z M W CaO 1 ε g z
Q CO 2 , f l o w z = Γ ˙ g s z 298 K T c p d T
Reaction rate d X CaO t d t (Section 4.1. refers to the molecular rate of CaO consumption, while Γ ˙ g s refers to the mass transfer rate from gas to solid phase per unit volume due to carbonation reaction. Moreover, the radiation heat transfer term is calculated for the emission of energy from the gas phase to the wall. It is thus assumed that the whole energy is extracted only from the gas due to the very diluted solid phase. A correlation for concentric pipes is used to express the transfer of radiation between gas and the surface of the inner wall (Appendix B). For computer-based calculations, the total emissivities and absorptivities of real gases can be determined using gray-and-clear gas approximation [40]. Gas-to-wall and particles-to-gas convective heat transfer coefficients are computed as seen in Appendix C.

4.2.4. Properties of Gas and Solid Phases

The values of the thermophysical properties of CO2 were taken from NIST data adopted from Aspen Plus software (AspenTech, Bedford, MA, USA) [44]. Specific heat capacity c p , viscosity μ and thermal conductivity correlations k were inferred from the quadratic or linear regressions of the estimated values referred to above. Specific heat capacity of CO2 follows a non-linear correlation based on the NIST Aly–Lee equation for ideal gases [45]
c p , g z = 3 · 10 7 T g 2 z + 9 · 10 4   T g z + 0.6316
Viscosity of CO2 was computed based on the NIST ThermoML Polynomial Equation [46], while thermal conductivity was linearly calculated by the same equation.
μ g z = 9 · 10 12 T g 2 z + 5 · 10 8   T g z + 10 6
k g z = 8 · 10 5   T g z 0.007
The aforementioned equations were validated within a wide range of temperatures. Heat capacity and viscosity were valid in a range of 270–1607 K, while thermal conductivity was valid in a range of 270–951 K. In cases where the reaction temperature exceeded the limit of 951 K (~678 °C), a linear interpolation is used for the calculation of k g .
The gas phase was modelled as a compressible gas obeying the ideal gas law, and its density was calculated from the following equation:
d ρ g z d z = M W g R d P z T g z d z
where M W g is the molecular weight of the gas phase and R is the ideal gas constant.
The model takes into consideration the modifications of particle characteristics as the carbonation reaction proceeds. The particle density of a specific calcination/carbonation cycle ( ρ s ) continuously varies between the initial density of CaO particles ρ CaO and that of CaCO3 formed after carbonation ρ CaCO 3 . These values are highly dependent on a material’s origin, on the number of calcination/carbonation cycles and on the reaction conditions.
d ρ s z d z = ρ CaCO 3 ρ CaO d X CaO z d z

4.2.5. Temperature Effect on the Conversion

The effect of temperature on the conversion level achieved during the surface reaction-controlled regime is significant and related to the aforementioned nucleation phenomena taking place. From the results of Criado et al. [47], who investigated this effect in a Thermogravimetric Analysis (TGA) apparatus, the following correlation was extracted for a temperature range of 450–725 °C:
X k N T = 1 1 1 β r exp E h R T + N a k exp E h R T + β r exp E h R T
where X k Ν is the conversion during the fast reaction regime in cycle N and Eh is the activation energy related to the formation of CaCO3 islands.
Summarizing, the mass balances of solid and gas phases are described by Equations (30) and (31), wherein the variation of conversion along the reactor’s length is related to the sorbent conversion rate, reactor cross-section area, density of the solid phase and molecular weight of the CaO.
d X CaO z d z = A F CaO , 0 d X CaO t d t ρ s z M W CaO 1 ε g z
d X CO 2 z d z = F CaO , 0 F CO 2 , 0 d X CaO z d z
The power produced from the carbonation reaction at the solid’s surface per length of reactor can be calculated from the following equation using the rate of converted CaO and the heat of the reaction:
Q r x n z = F CaO , 0 d X CaO z d z Δ H r x n
The total power produced at the end of reaction can be computed by employing the final solids conversion as follows:
Q r x n t z = F CaO , 0 1 X CaO z Δ H r x n

5. Carbonator Reactor Simulation—Solving Strategy

5.1. Model Analysis and Solution

In this study the process model consisted of a system of differential algebraic equations (DAEs) integrated simultaneously using a first‑order backward finite difference method. MATLAB (MathWorks, Natick, MA, USA) solver for stiff differential equations with a multistep integration option was implemented for the numerical computations. The mathematical model comprising of a set of DAEs was treated as the initial value problem. The integration process was initiated by incorporating the initial values of all differential variables.

5.2. Simulation Parameters—Operating Conditions

Although the mathematical model for a carbonator reactor is developed in a generic form that can be implemented in different reactor sizes, in this study the simulation refers to reactor geometry that was designed and developed within the SOCRATCES project [17,31]. The process parameters used for the current simulation as well as the operating conditions are summarized in Table 2 and Table 3, respectively, and were set in accordance with the specific reactor designed for the production of 10 kWth energy via the exothermic carbonation reaction.
Process simulation activities were performed for a wide range of operating conditions through parametric studies in order to evaluate the carbonator’s performance under different regimes. In the beginning, the operating strategies were envisioned with the target of producing 10 kWth of thermal energy via the carbonation reaction. Given this, and considering that an exothermic reaction is highly dependent on the solid’s initial conditions, a “fresh CaO” (produced after the calcination of fresh limestone) and a “sintered CaO” (produced after 10 calcination/carbonation cycles) were tested. Under these circumstances, theoretically, around 19 kg/h of fresh CaO (Xk ~ 0.60) should enter the reactor in order to produce 10 kWth, while on the other hand, for sintered CaO (Xk ~ 0.20), theoretically, around 60 kg/h of solids should enter to produce the same amount of heat. Based on this, the flow of CO2 was determined to range between 10–20 kg/h, as higher flows would lead to shorter residence times in the reactor. A reference inlet temperature of 200 °C was set for the reactants, while the introduction of reactants at ambient conditions was also evaluated (Table 3). A wall temperature profile of 400–800 °C was implemented, as certain amounts of heat must be provided initially to the reactants until reaction is triggered. Finally, carbonation pressure was set at atmospheric, as is commonly applied to calcium looping applications for thermochemical energy storage, but also smaller values were applied to mitigate the instantaneous high reaction rate.

6. Results and Discussion

6.1. Carbonation Kinetics Modeling

Limestone-derived CaO was subjected to carbonation at T = 820   ° C and flows of pure CO2 or mixtures of N2, with CO2 partial pressures of 1.25 atm, 0.90 atm, 0.70 atm and 0.50 atm. The conversion-versus-time curves are shown in Figure 3; in all cases, carbonation reaction refers to the first cycle. The final conversion achieved during the reaction-controlled regime was approximately 0.6. As was expected, increasing the surrounding CO2 gas concentration also increased the rate of carbonation reaction.
The fast regime was completed within 5 s for carbonation under pure CO2. On the other hand, the diffusion-controlled regime was much slower, and was difficult to detect using the current experimental set up due to the very small change of CO2 flow resulting from capture, compared to the total flow passing through the reactor bed. Nevertheless, by far the largest part of CO2 was captured during the fast regime, which was the useable part of the conversion from a practical point of view. Two factors affected the critical conversion value at which the transition from the fast surface reaction to the slow diffusion-controlled regime took place, namely, the pore blockage and critical product layer thickness. The effect of the latter depends on the reaction temperature, as described by Equation (29), while the former is dominant if the product layer thickness is larger than the pores’ width. It is clear that under the studied conditions, the carbonation reaction was extremely fast, leading to short residence times comparable to the ones achieved in a drop-tube reactor. Figure 3a presents the conversion evolution during the carbonation along with the fitting curves of RPM (Equation (4)) during the fast initial stage. The fitted values of r , which represents the rate of the carbonation-reaction front movement, are presented in Table 4 for each test.
This rate could be related to the formation of the CaCO3 product layer, and it should be considered that the molar volume of CaCO3 (0.037 m3/kmol) was almost double the molar volume of CaO (0.017 m3/kmol). This implies that the product layer thickness is also twice the reaction front movement during the reaction. For example, for carbonation under 1.25 atm of CO2, the reaction front moved with a rate of 4.5 nm/s, thus CaCO3 product layer grew with a rate of approximately 9 nm/s. It has been mentioned by other researchers that the maximum product layer thickness during the reaction-controlled regime is around 49 nm [48]. Accordingly, it can be roughly estimated that this regime will be completed in 5 s, which is in agreement with the experimental results shown in Figure 3a.
Assuming a first-order reaction with respect to CO2 partial pressure, Equation (10) is transformed to
r T ,   P CO 2 = k s P e R T P CO 2 P e 1
where P e is the equilibrium CO2 partial pressure calculated by [49]
P e = 4.083 × 10 7   e 20,474 T ,       atm
The reaction constant k s can be extracted from the slope of r vs. the P e R T P CO 2 P e 1 curve, as presented in Figure 3b. Adopting an activation energy of E a K = 20.3   kJ / mol [36], the pre-exponential factor is k s = 3.75 × 10 6   m 4 / kmol   s , which is close to the values referred to in other widely accepted works (5 × 10⁻⁶ m4/(kmol s) by Grasa et al. [36]; 6 × 10⁻⁶ m4/(kmol s) by Bhatia and Perlmutter [34]). The first-order reaction assumption was validated through this linear dependence. This result is in agreement with Grasa et al. [36], but in contrast to Sun et al. [50], who found a first-order relation up to 0.1 atm and zero dependence for higher CO2 partial pressures.

6.2. Reactor Performance Under “Fresh CaO”

In this section, the carbonator reactor performance is investigated under a regime of “fresh CaO” using simulations. Table 5 shows the reference operating conditions, as well as the conditions selected for the investigation of the wall temperature and CO2 flow-rate effect.

6.2.1. Reactor Simulation under Reference Conditions

In the reference conditions, CaO and CO2 enter the reactor at equal mass flow rates. As expected, due to the difference in molar mass of the two reactants, the molar conversion values were not identical (Figure 4a).
Initially, reactants were preheated at a sensible temperature while travelling across the reactor with the reaction rate progressively increasing. In the upper carbonator section, the heat transfer from the wall to the inner side of the reactor was controlled by the radiation mechanism, while along the reactor where higher temperatures are also observed, due to reaction, convection terms prevail. At low temperatures (i.e., 200–400 °C), the conversion rate was negligible, as inferred by Equation (29), while at temperatures higher than 500 °C the carbonation reaction proceeded at a high rate. Due to the very small particle sizes used in the simulation, the heat produced in the solid’s surface was transferred instantaneously in the gas phase, resulting in a uniform temperature profile of both phases across the reactor (Figure 4b). As the reaction progressed, the temperature of solids approached equilibrium, thus resulting in a considerable decrease in the reaction rate, which was illustrated by the linear trajectory of the reactant conversion (Figure 4a). Pressure inside the reactor remained almost steady with an increasing downwards trend mainly due to the hydrostatic pressure of gas (Figure 4c). Under these operating conditions, the reactor bed was considered very diluted, as the volume of solids was remarkably lower compared to the gas volume, as illustrated by the gas voidage values (Figure 4c). A notable decreasing trend of gas voidage would be expected from the model, with higher solid flow rates in a denser bed. Velocity profiles of both phases followed the hydrodynamics, while the relative difference of the velocities of the two phases depended on the particles’ sizes (Figure 4d). With coarser particles, a higher velocity difference would be anticipated.

6.2.2. Effect of Reactor Wall Temperature

The temperature of the reactor’s inner wall proved to be a critical process parameter, as it highly affected the carbonation progress. In particular, a very high temperature in the inner wall (i.e., 800–700 °C) would induce a severe inhibition of the reaction rate as equilibrium was quickly reached (Figure 5b). This is evident while looking the dragging linear trajectory of CaO conversion corresponding to the equilibrium regime (Figure 5a at 700–800 °C). Consequently, an efficient management of the wall temperature profile, by keeping it under 700 °C, would be a proper way to control the very fast carbonation reaction.

6.2.3. Effect of CO2 Flow Rate

Another critical process variable for an optimum drop-tube carbonator reactor operation is the CO2 flow rate. Literally, flow-rate selection depends mostly on capacity, but from an engineering perspective CO2 should be in excess to accomplish carbonation (although constrained by inducing very short solid residence times). Thus, it was observed that flows from 10–30 kg/h resulted in a velocity range of 0.25–0.85 m/s, corresponding to mean solids residence times of ~16–5 s (Figure 6d), which is in agreement with the results of kinetic experiments (Figure 3a) where carbonation reached completion in less than 20 s. Moreover, the higher the CO2 rate, the milder the temperature profile was along the reactor. This occurs because the excess CO2 behaves like a sink for heat absorption (Figure 6b), and because the reaction takes place across a wider range inside the reactor (Figure 6c), which can result in a more efficient exploitation of the power produced. In all cases, the residence time in the reactor was enough to complete the reaction (Figure 6a).

6.3. Reactor Performance under “Sintered CaO”

In the following section, the carbonator’s performance is investigated for a case with a sintered material, while the effects of CaO flow and carbonation pressure are examined through process simulation (Table 6). The conditions selected were closer to the expected operation of the carbonator reactor using sintered CaO, resulting in a max conversion of 20% at 800 °C at a 30 kg/h CaO flow rate.

6.3.1. CaO Flow Rate Analysis

The effect of the CaO flow rate on the carbonator’s performance is depicted in the following graphs (Figure 7). The higher the flow rate of solids, the more the energy was released as a result of the exothermic reaction, and consequently the more the energy was produced per length of the reactor (Figure 7c). Moreover, as the CaO flow rate increased, a progressive delay in the initiation of the reaction was reasonably observed, as it takes more space and time to sufficiently preheat from ambient conditions (Figure 7a,b). The maximum sorbent conversion (i.e., 20%) was reached only in the cases of 25 kg/h and 30 kg/h of CaO, as in the other cases (i.e., 10–20 kg/h) the conversion was constrained by the maximum temperature reached along the reactor (Figure 7b). This is the result inferred by Equation (29). Solid phase velocity progressively decreased along the reactor’s length, as CO2 phase depleted. In case of high solid flow rates, CO2 was depleted quickly, as depicted in the final solid phase velocity (Figure 7d).

6.3.2. Carbonation Pressure Analysis

As carbonation proceeds very fast in a drop-tube reactor under thermochemical energy storage conditions, investigation of the effect of carbonation pressure is considered in this section. Experiments [39] have shown that a five-fold decrease of the reaction rate occurs with a pressure decrease from 1.0 atm to 0.5 atm. Accordingly, the simulation results revealed that a decrease in carbonation pressure flattened the reaction front, making it more feasible to control the reaction and subsequently remove the generated heat (Figure 8c). However, pressure in the reactor strongly affected gas and solid phases velocities, with a high increase observed in lower pressure cases (Figure 8d).

7. Conclusions

In the present study, a one-dimensional, steady-state mathematical model was developed for the first time for a heterogenous gas–solid carbonation reaction, in a drop-tube reactor, focusing on thermochemical energy storage conditions and based on the calcium looping process. The reactor model related mass, energy and momentum balances for both gas and solid phases under the Euler–Euler approach, while a random pore model (RPM) was developed for the kinetics and verified experimentally in a laboratory fix-bed reactor using fine particles (i.e., ~60 μm average diameter). In this manuscript, the reactor model was implemented to simulate a fix-dimensioned, drop-tube carbonator reactor prototype (i.e., 0.154 m diameter and 4 m length) with 10 kWth thermal energy that was designed and constructed as part of the SOCRATCES project [31].
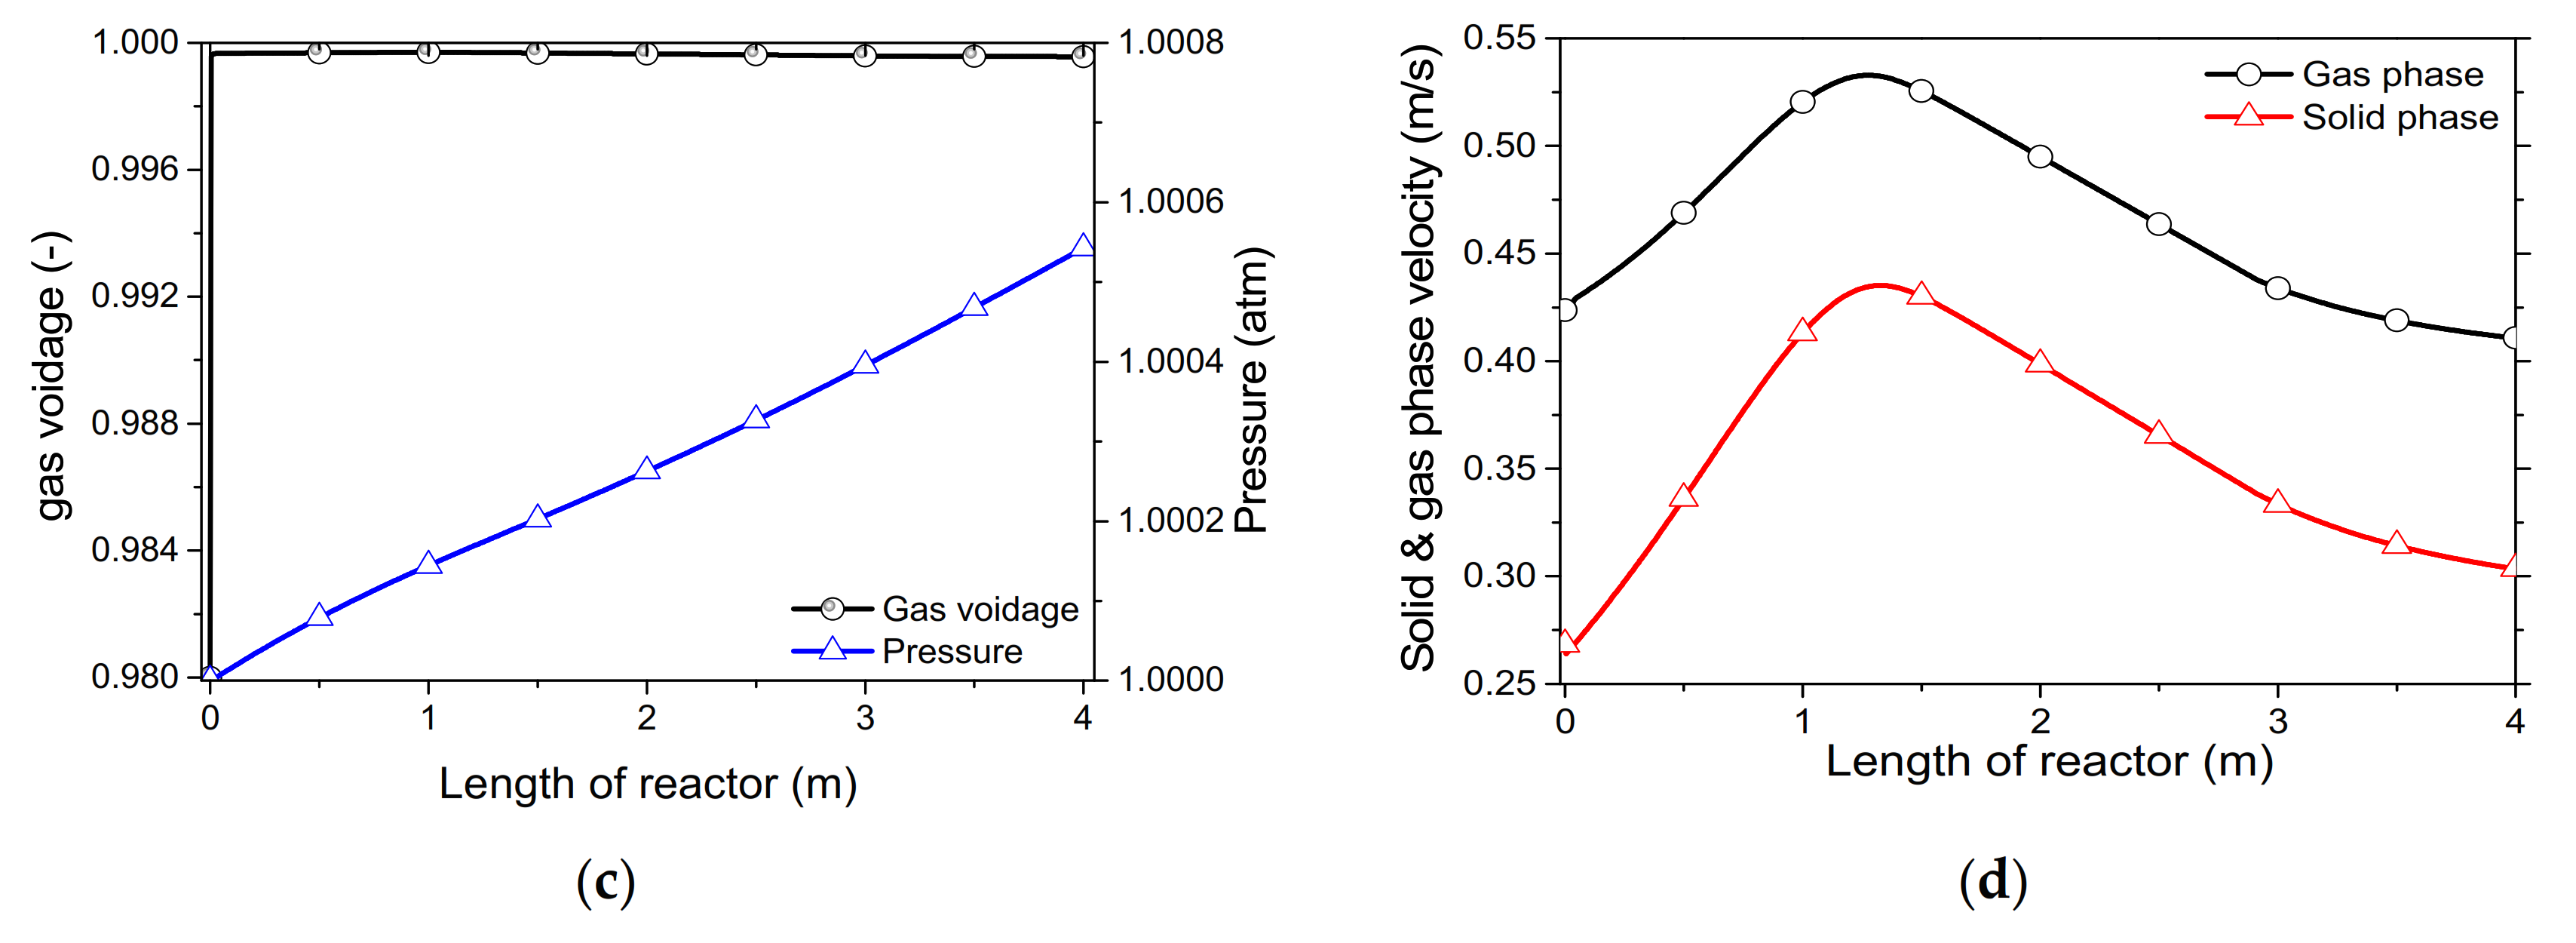
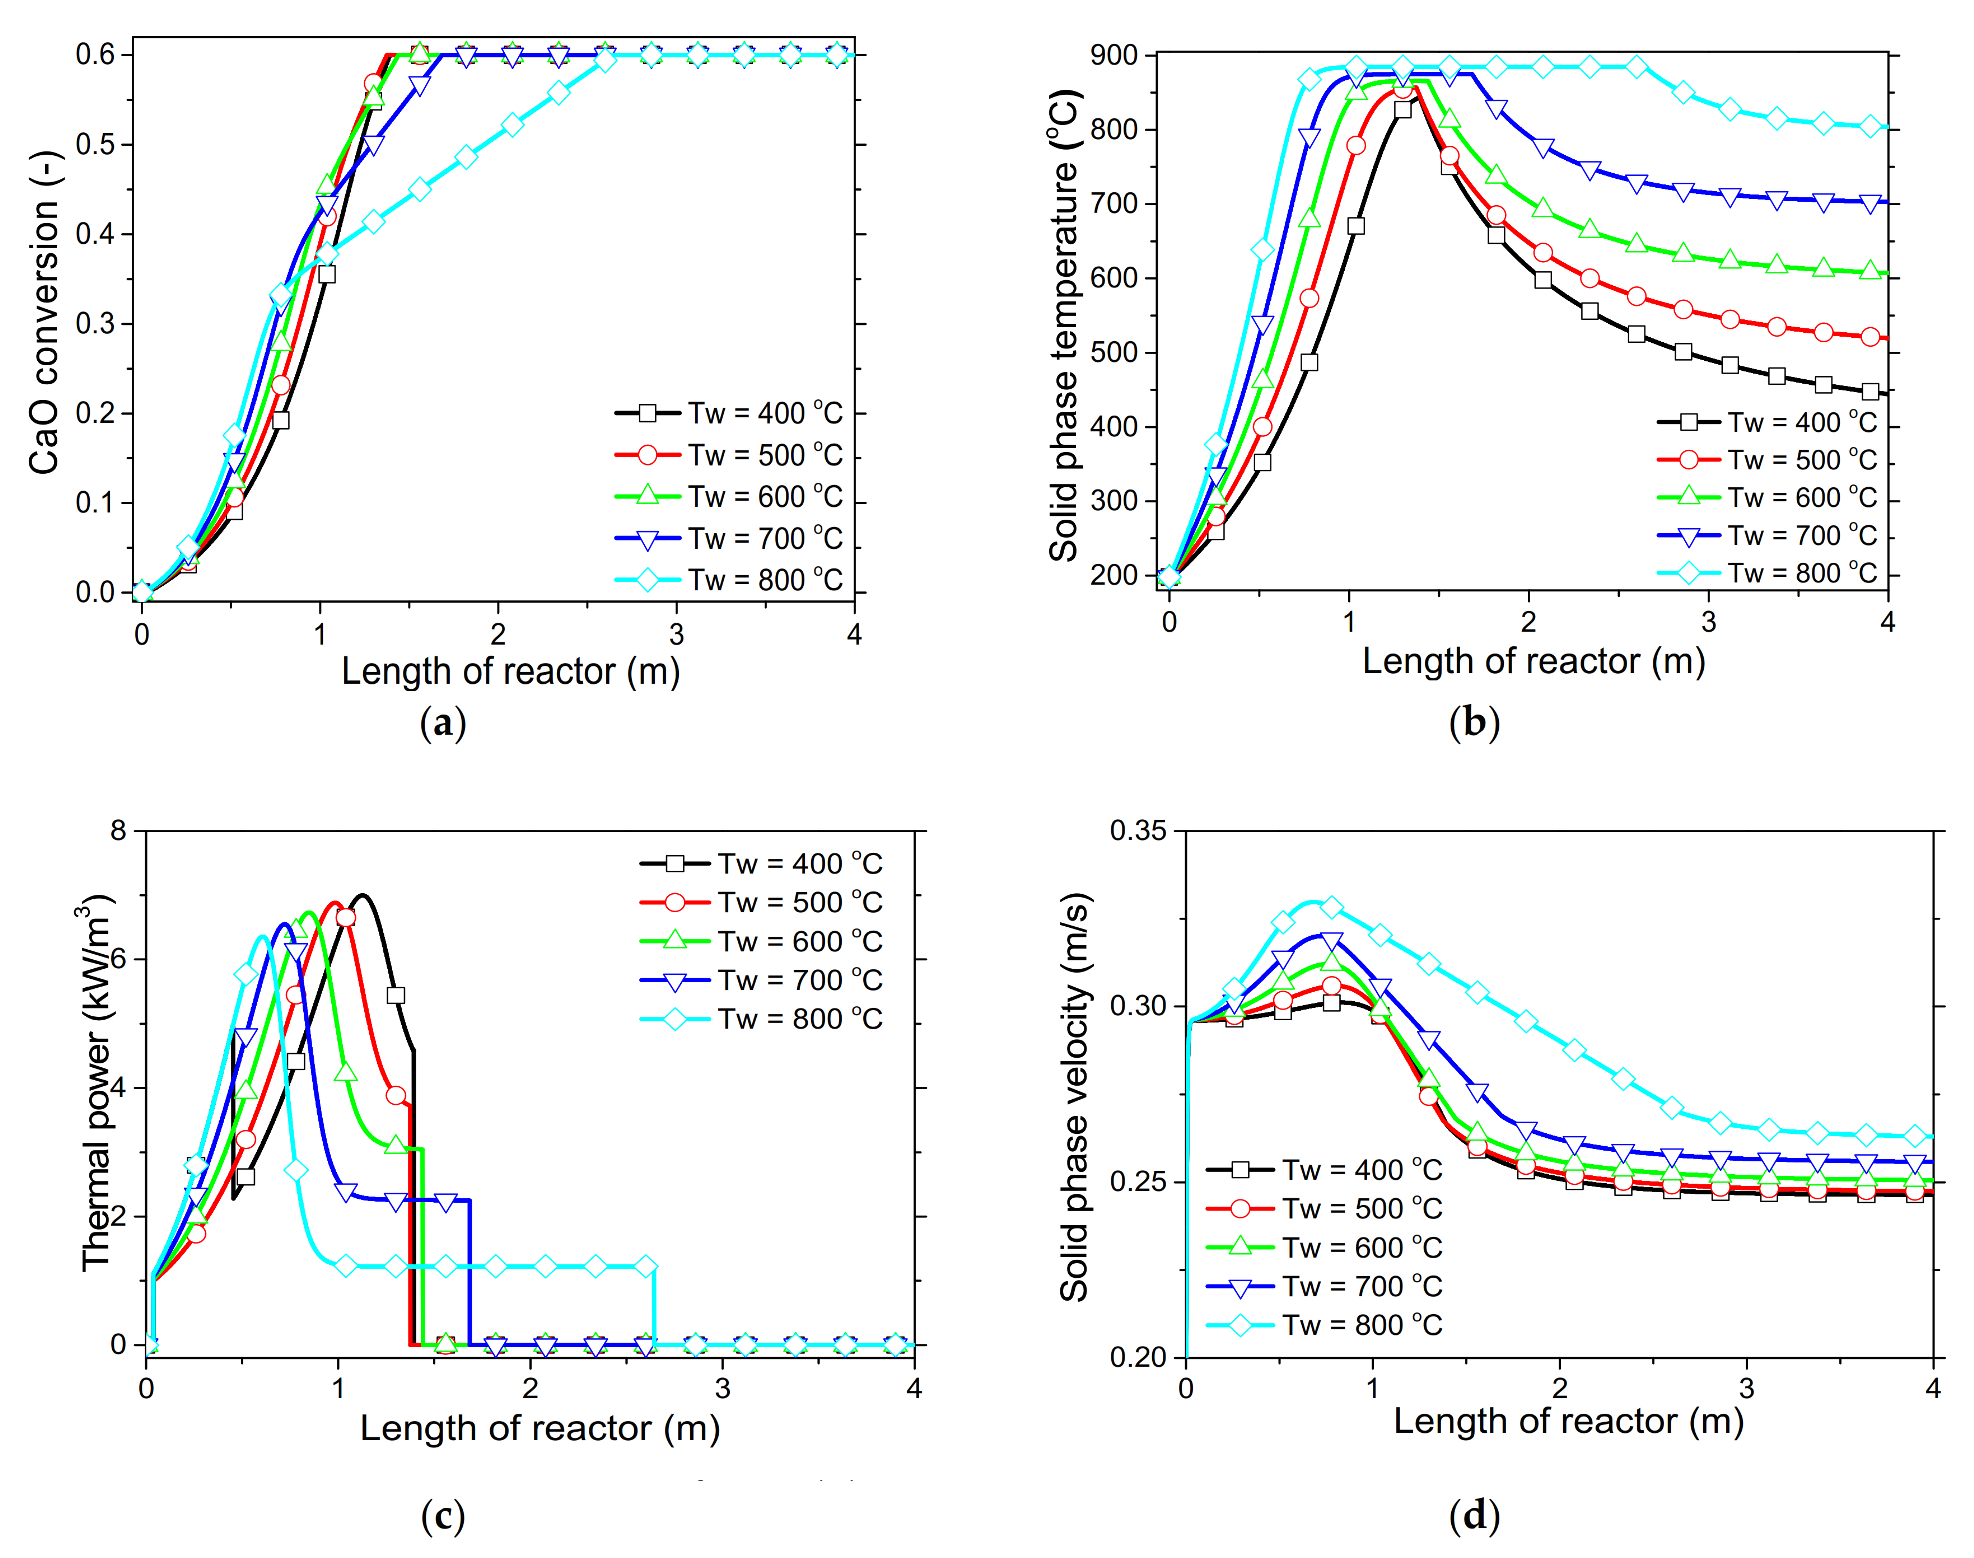
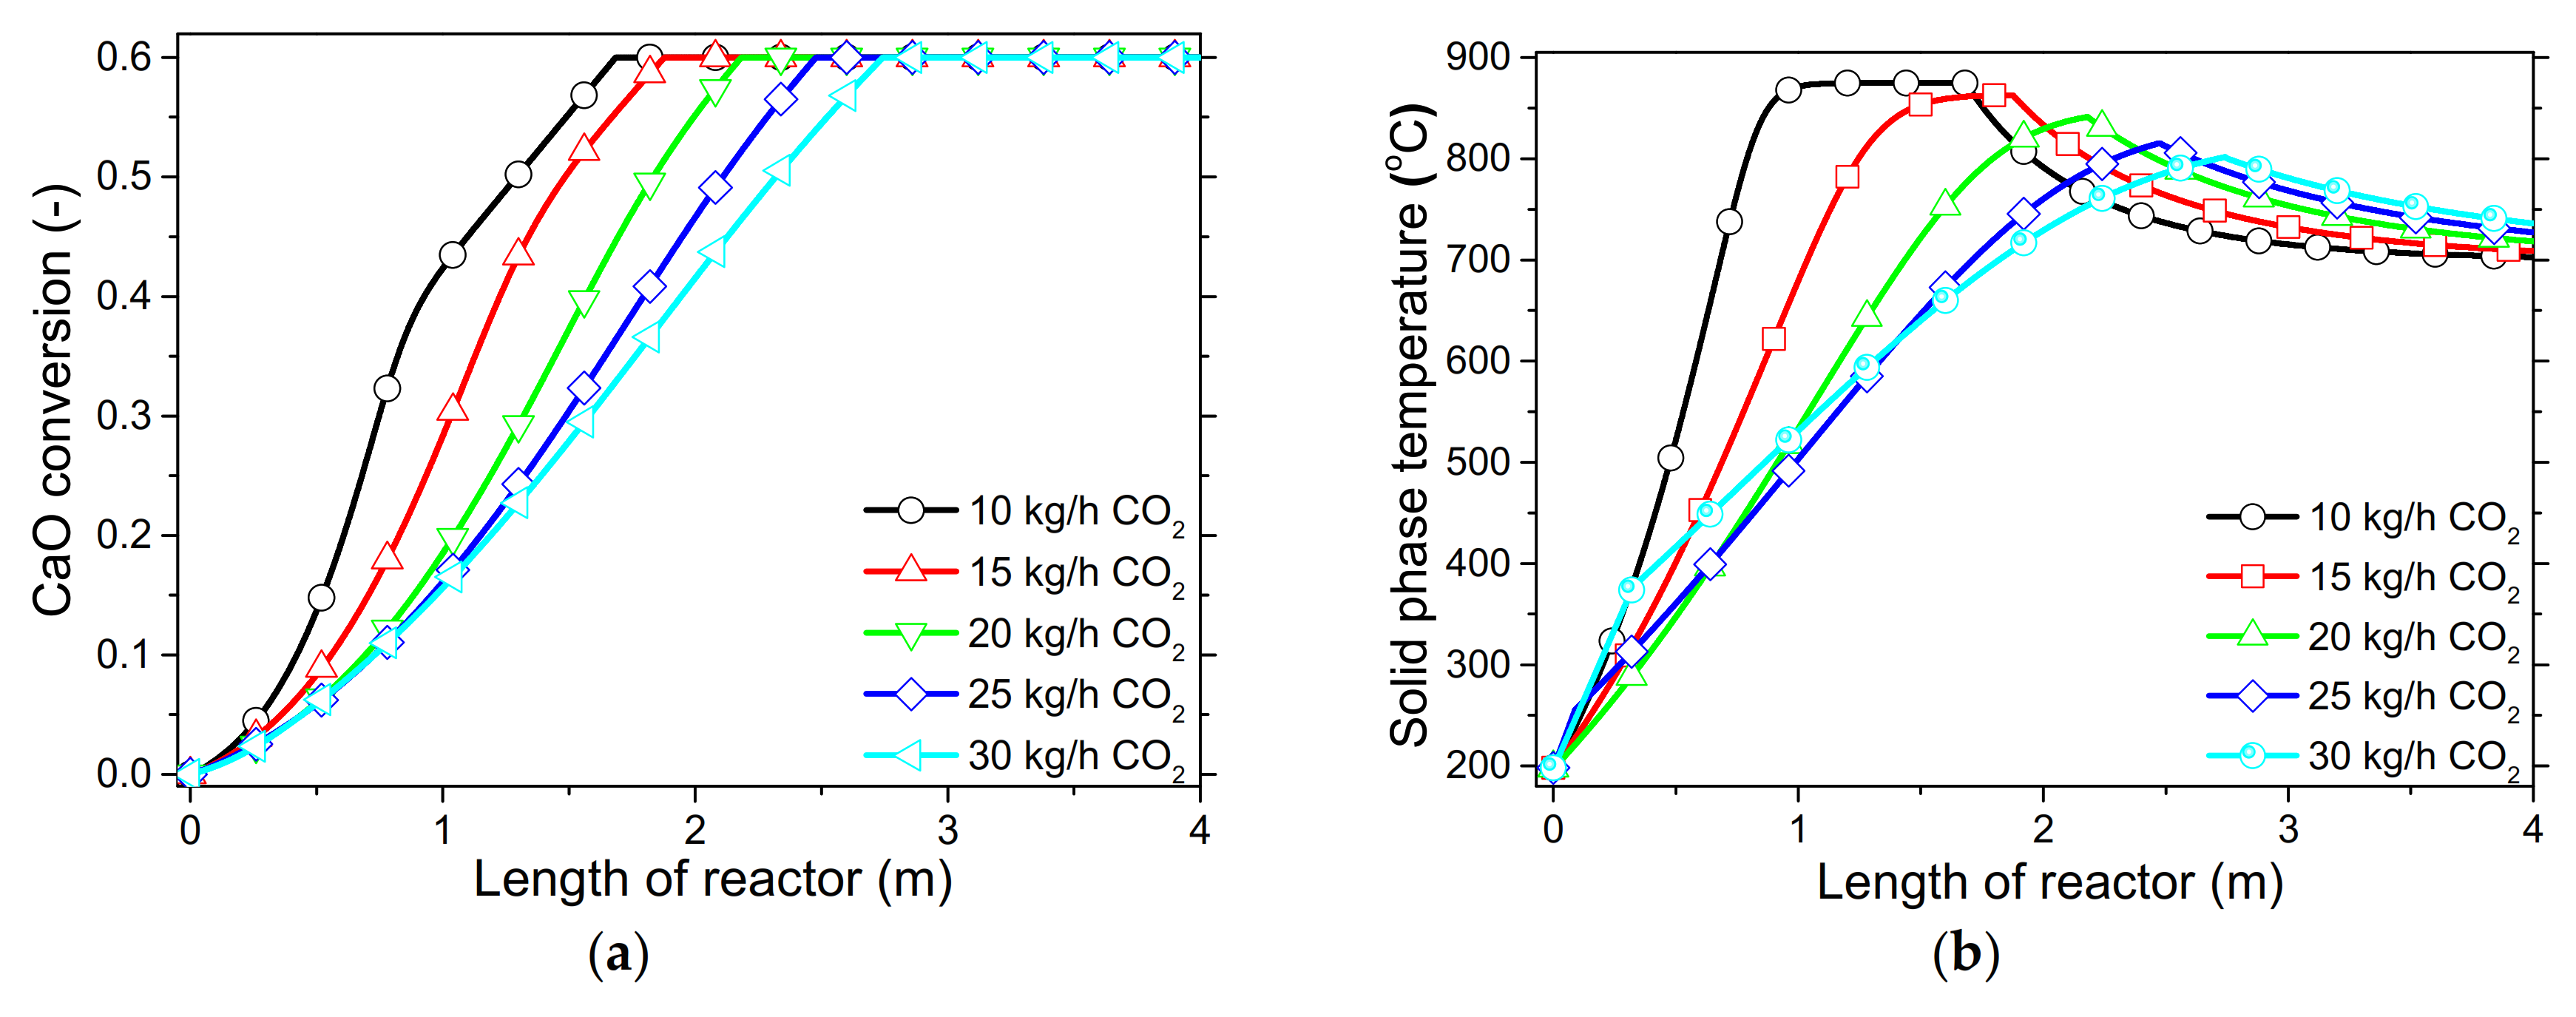
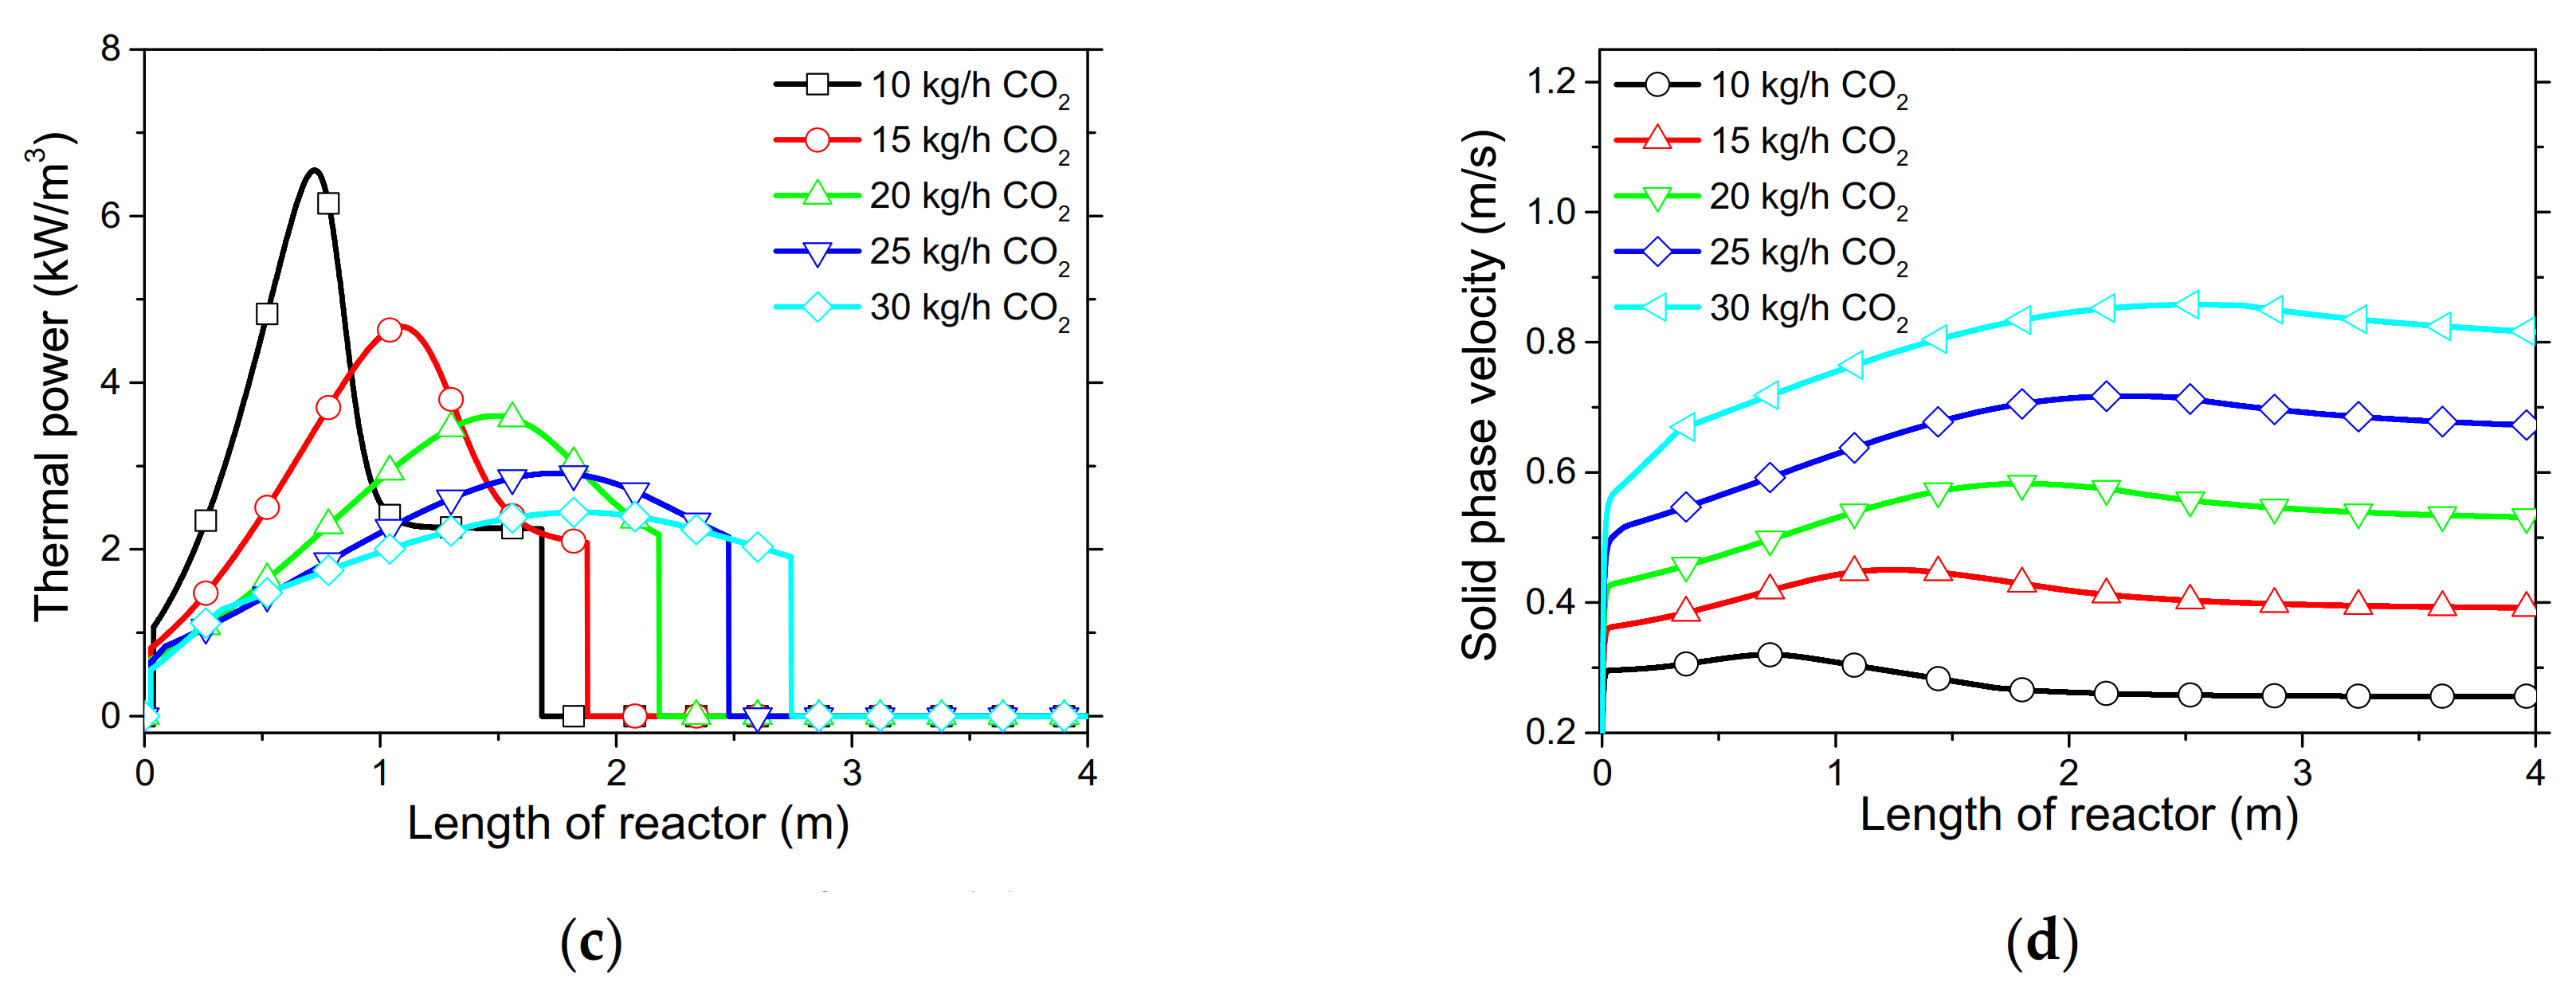
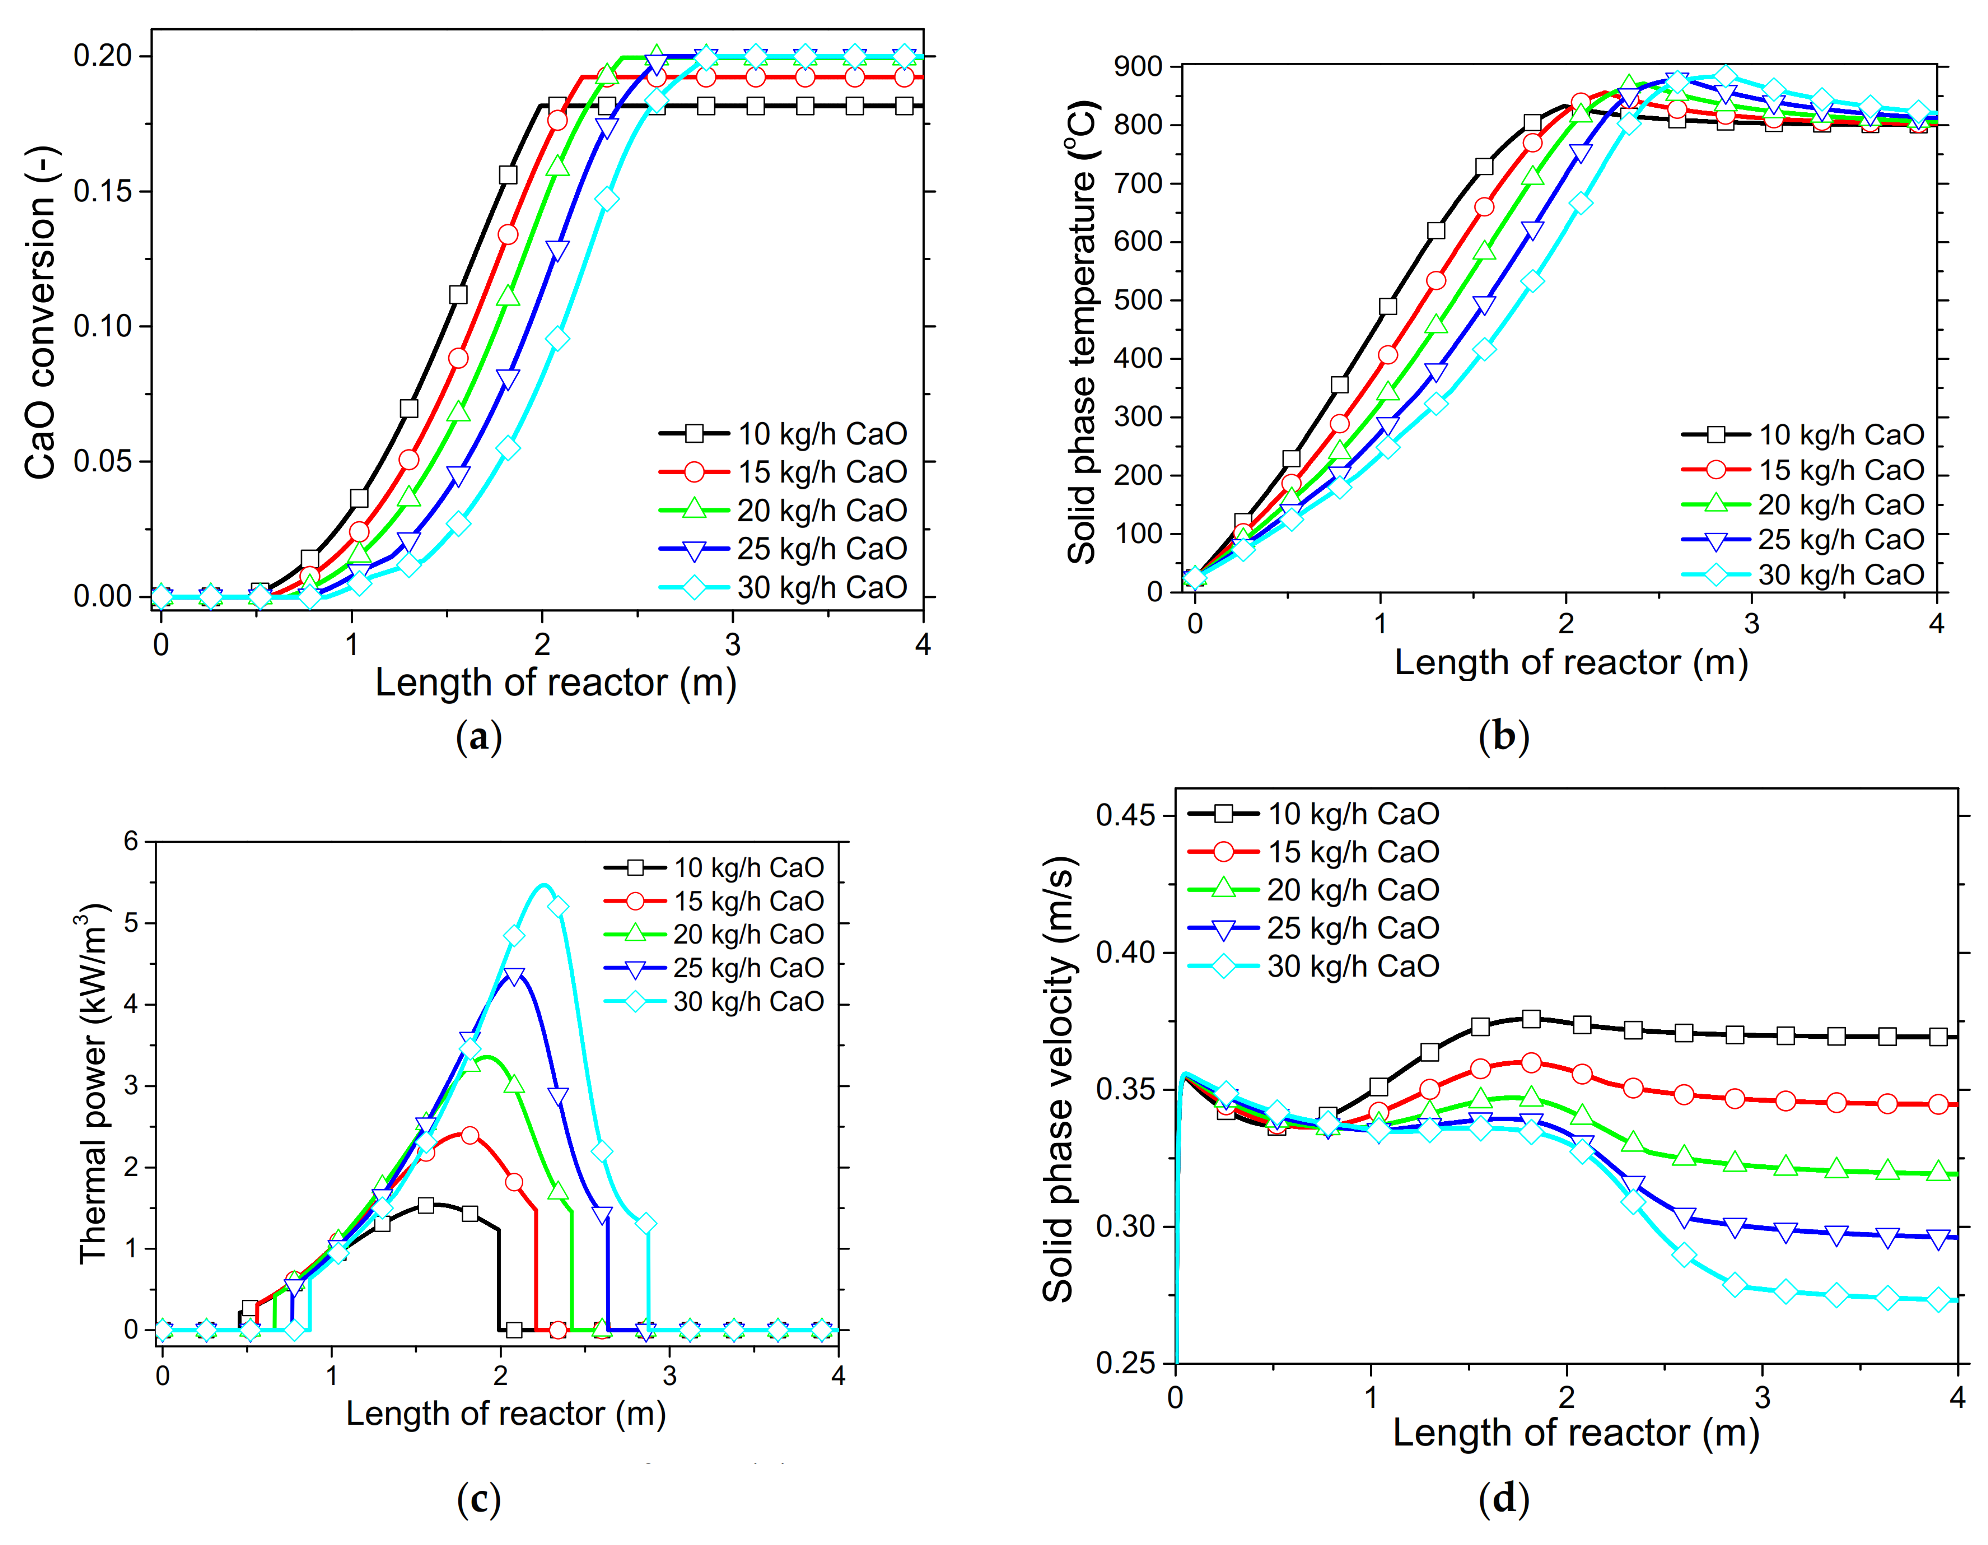
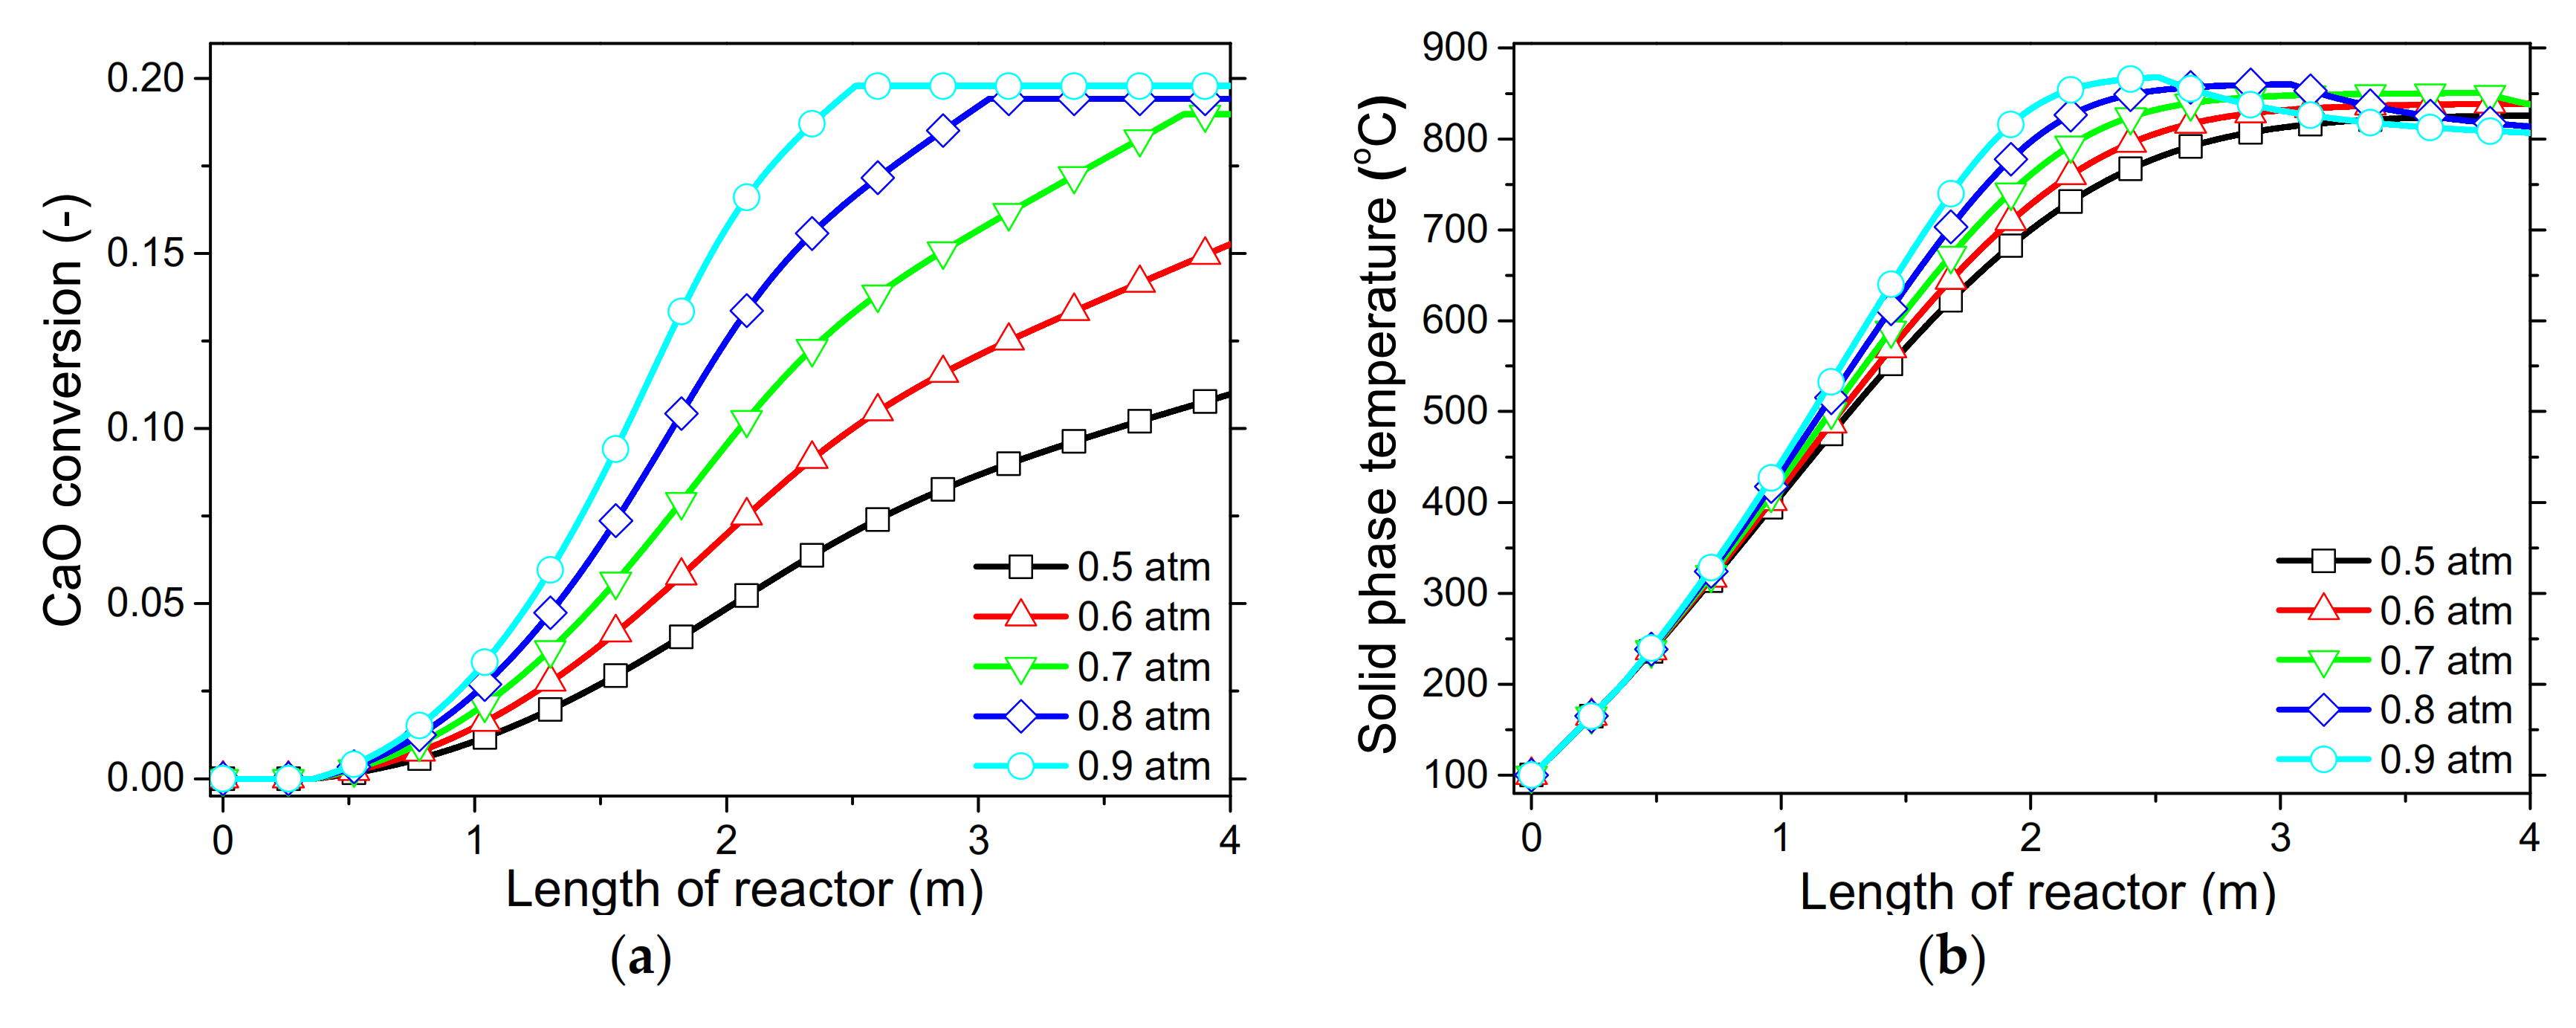
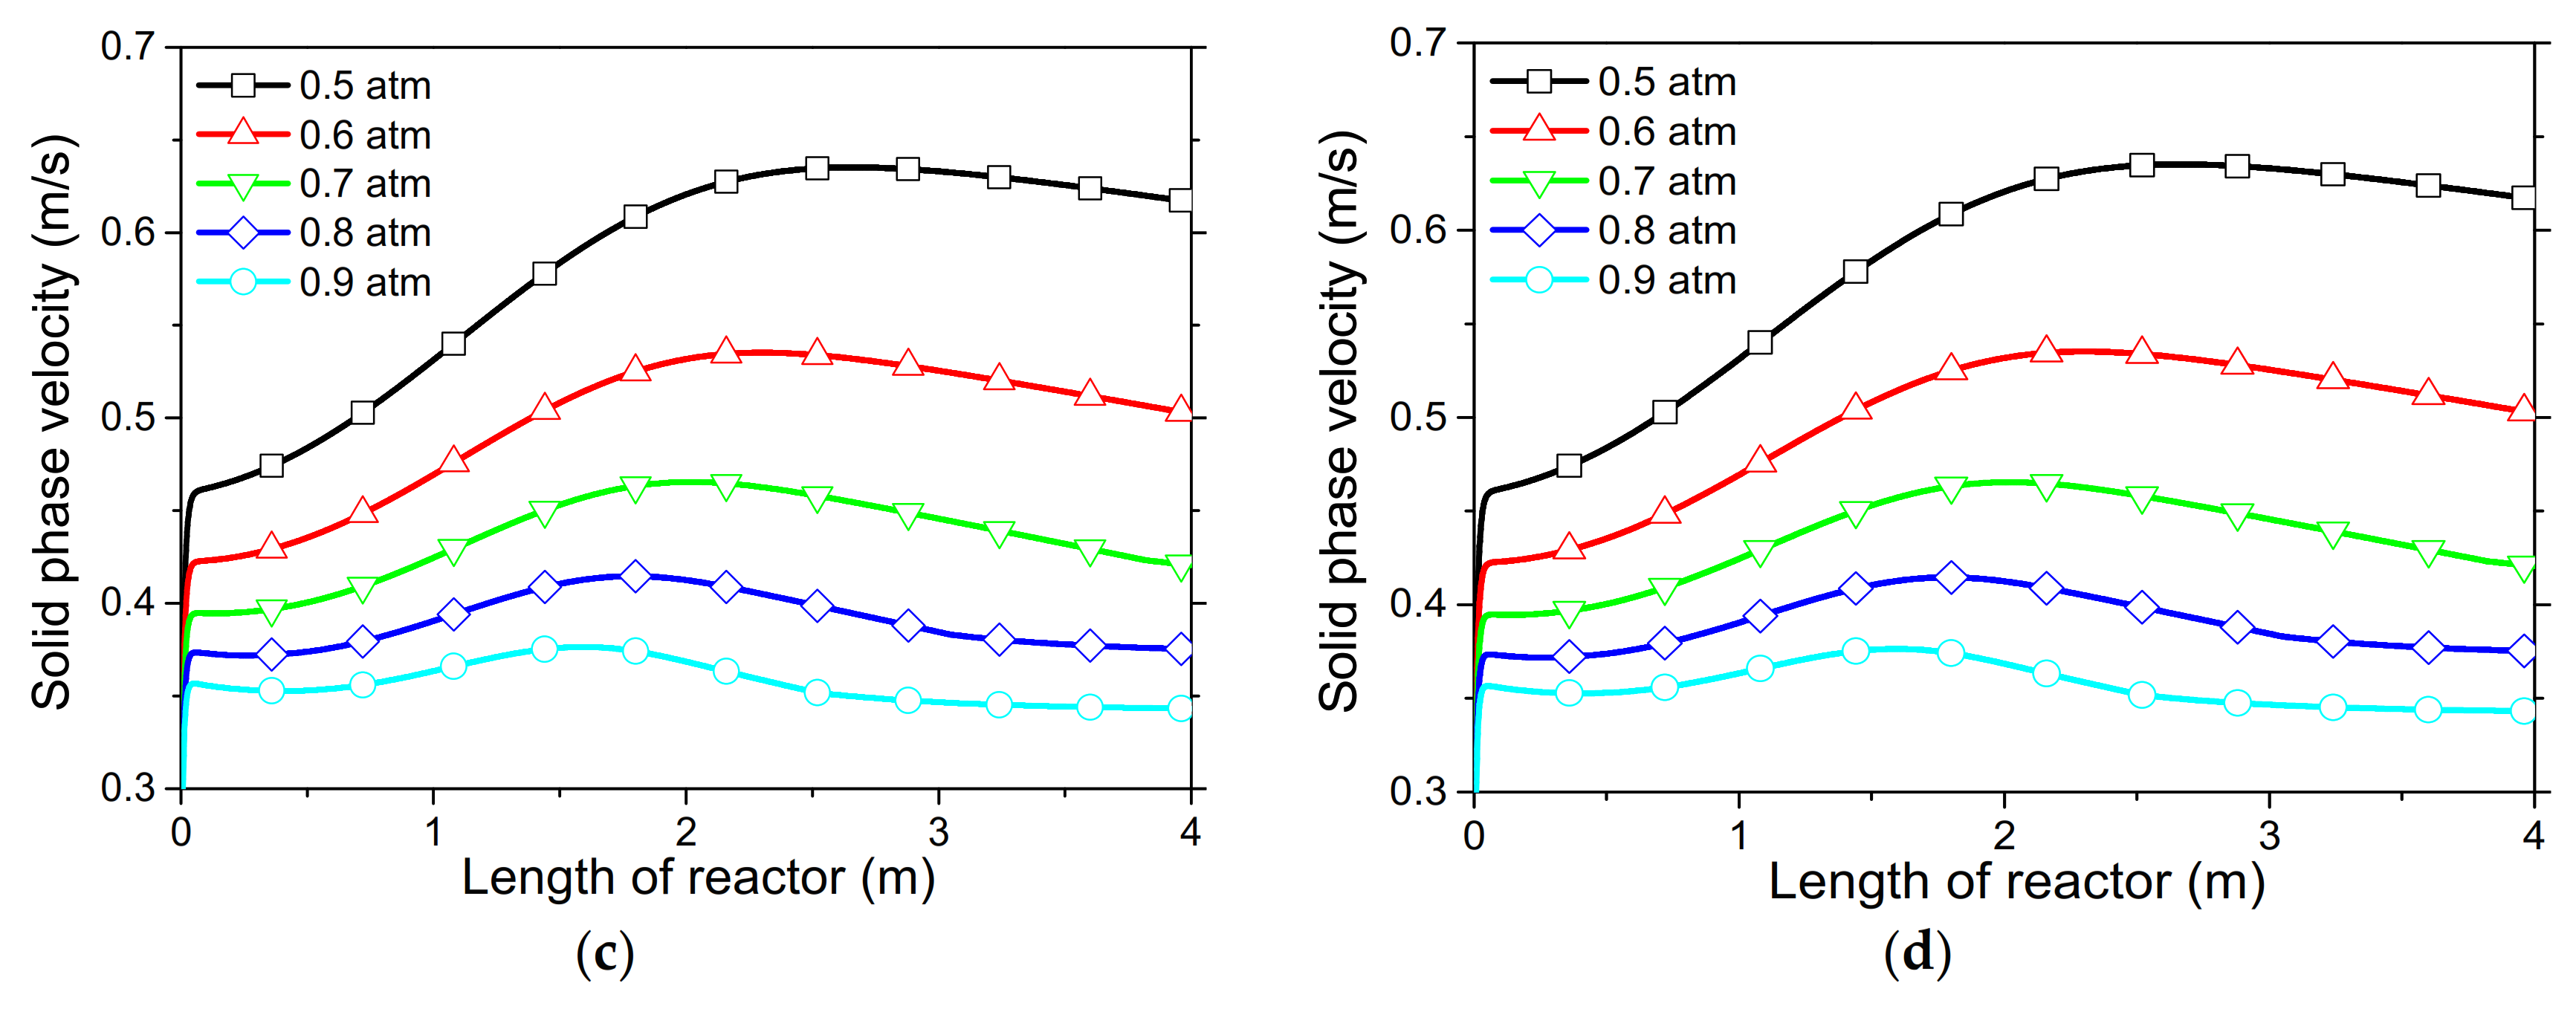
In order to demonstrate the model’s capabilities and assess the reactor’s performance concerning the conversion and distribution of thermal energy produced along the length of reactor, several simulations were performed that focused on the variations of critical process variables. Initially, the reactor’s wall temperature and CO2 flow rate were parametrically examined by means of the reactor’s performance under the condition of “fresh CaO” (lime after first calcination). Significant effects of these variables could be seen in the final CaO conversion, reaction rate variations across the reactor and temperature profiles on the inner side of the reactor. Next, the effect of CaO flow rate and carbonation pressure were investigated for the case of “sintered CaO” (lime after 10 carbonation/calcination cycles). Carbonation pressure proved to be a critical variable, as it radically affects the reaction rate.
Simulation results indicated that carbonation of fine particles can be successfully accomplished (~60% conversion for fresh CaO) in novel drop-tube reactors with a downflow gravity direction using either with fresh or sintered materials. The cooling of the outer walls of the reactor might lead to lower, safer wall temperatures (~600 °C), as it was proven that very high temperatures in the reactor inhibited the reaction rate when equilibrium was quickly reached. Moreover, the residence time of reactants constituted a decisive parameter for the process performance in regards to the deployment of the thermal energy produced along the reactor, as 20–30 kg/h of CO2 resulted in the completion of the reaction across a wider range inside the reactor. Maximum sorbent conversions (20%) were reached in the cases of 25 and 30 kg/h of sintered CaO flow rates. The above conclusions were deduced from the reactor’s specific dimensions. Lower carbonation pressures (~0.7 atm) might be used to flatten the reaction front, making it more feasible to control the extraction of the generated heat. This could steer research towards model-based optimization strategies that will enhance future design and further scale-up studies of different carbonator reactor sizes.

Author Contributions

Conceptualization, E.K. and A.S.; Funding acquisition, S.V.; Methodology, E.K., A.S., A.A., A.L. and S.P.; Project administration, A.L., S.V. and S.P.; Software, E.K. and A.S.; Supervision, A.A., A.L. and S.P.; Writing—original draft, E.K. and A.S.; Writing—review & editing, A.A., K.F., K.P., A.L. and S.P. All authors have read and agreed to the published version of the manuscript.

Funding

This research has received funding from the European Union HORIZON 2020 project SOCRATCES—SOlar Calcium‑looping integRAtion for Thermo‑Chemical Energy Storage, under Grand Agreement Number: 727348.

Conflicts of Interest

The authors declare no conflict of interest.

Abbreviations

CSPConcentrated Solar Power
TCESThermochemical Energy Storage
CaLCalcium−Looping
PCMPhase Change Materials
RPMRandom Pore Model

Nomenclature

Symbols
A Reactor cross-section area (m2)
a g s Surface area between gas and solids (m2 m−3)
a g w Surface area between gas and wall (m2 m−3)
a , b Stoichiometric coefficients of carbonation reaction (-)
C Concentration of CO2 (kmol m−3)
C D Drag force coefficient between solids and gas (-)
c p Specific heat capacity (kJ kg−1 k−1)
D Reactor diameter (m) and effective product-layer diffusivity (m2 s−1)
D 0 Pre-exponential factor of effective product-layer diffusivity (m2 s−1)
D p Apparent product-layer diffusivity (m2 s−1)
dpParticle diameter (m)
E h Activation energy related to the product layer thickness (29.3) (kJ mol−1)
E a D Activation energy for product layer diffusion (kJ mol−1)
F CO 2 , O Initial molecular flow of CO2 (kmol s−1)
F CaO , O Initial molecular flow of CaO (kmol s−1)
F D Drag force between gas and solids (kg m−2 s−2)
F g w Friction force between gas and wall (kg m−2 s−2)
F s w Friction force between solids and wall (kg m−2 s−2)
f g w Gas–wall friction coefficient (-)
f s w Solids–wall friction coefficient (-)
g Gravitational acceleration (9.81) (m s−2)
h g s Convective heat transfer coefficient between gas and solid phase (kW m−2 K−1)
h g w Convective heat transfer coefficient between gas phase and wall (kW m−2 K−1)
k Thermal conductivity (kW m−1 K−1) and deactivation constant (-)
k s Carbonation reaction constant (m4 kmol−1 s−1)
L 0 Total pore length of the material before carbonation (m m−3)
L Length of reactor (m)
M W g Molecular weight of gas (CO2) phase (44.01) (kg kmol−1)
M W CaO Molecular weight of CaO (56.07) (kg kmol−1)
M W CaCO 3 Molecular weight of CaCO3 (100.08) (kg kmol−1)
N Number of calcination/carbonation cycle (-)
N u Dimensionless Nusselt number (-)
P Total pressure of reactor (based on partial pressure of CO2) (Pa = kg m−1 s−2)
P e CO2 partial pressure at equilibrium (atm)
P CO 2 CO2 partial pressure (atm)
P r Dimensionless Prandtl number, Pr =   C p g μ g · k g (-)
P V 0 Pore volume (m3 g−1)
Q r x n Thermal power produced due to carbonation reaction per length of reactor (kW m−3)
Q r x n t Total thermal power produced due to carbonation reaction (kW)
r Reaction front velocity (m s−1)
R Ideal gas constant (R = 8.314) (m3 Pa mol−1 K−1) (R = 8314.47) (Pa m3 kmol−1 K−1)
R e s Dimensionless solids Reynolds number, R e s = ε g ρ g d p u g u s μ g (-)
R e g Dimensionless gas Reynolds number, R e g = ε g ρ g u g D μ g (-)
S B E T BET surface area (m2 g−1)
S 0 Surface area of the material before carbonation (m2 m−3)
T Temperature (K or °C)
t Time (s)
u Cross-sectionally averaged velocity (m s−1)
X r Residual carbonation conversion (-)
X k Carbonation conversion during the surface reaction-controlled regime (-)
X N Carbonation conversion of the Nth cycle (-)
X 1 Carbonation conversion of the 1st cycle (-)
X Cross-sectionally averaged conversion (-)
Z Ratio of volume of solid phase after reaction to that before reaction (2.16) (-)
z Length of reactor (m)
Greek Symbols
α κ Dimensionless constant of Equation (29) (0.0255) (-)
β Modified Biot modulus in the RPM (-)
β r Dimensionless constant of Equation (29) (1.04) (-)
Γ ˙ g s Mass transfer rate per unit volume due to the heterogeneous reaction (kg m−3 s−1)
Δ H r x n Enthalpy of reaction (kJ Kmol−1)
ε g Cross-sectionally averaged voidage (-)
ε g e Emissivity of gas phase (-)
ε s Cross-sectionally averaged solid hold-up (-)
ε w Emissivity of wall surface (-)
ε 0 Porosity of the material before carbonation (m3 m−3)
μ Viscosity (Pa s)
ρ Cross-sectionally averaged density (kg m−3)
ρ CaO Theoretical density of CaO (3340) (kg m−3)
ρ CaCO 3 Theoretical density of CaCO3 (2700) (kg m−3)
σ Stephan’s Boltzmann constant (5.6704·10−8) (kW m2 K4)
τ Dimensionless time in the RPM (-)
Ψ Structural parameter in the RPM (-)
Subscripts
CO 2 Carbon dioxide
CaO Calcium oxide
CaCO 3 Calcium carbonate
g Gas phase (CO2)
o Initial
s solid phase
w Wall

Appendix A. Algebraic Equations Related to Momentum Balances

Drag force between solids and gas [41]:
F D z = 3 4 C D z ε g z u g z u s z ρ g z 1 ε g z d p u g z u s z ε g 2.65 z
Drag coefficient [16,18,41]:
C D z = 24 R e s z 1 + 0.15 R e s 0.687 z , R e s z < 1000 0.44 , R e s z > 1000
Friction force between gas and wall [21,24,41]:
F g w z = 2 f g w z ε g z ρ g z u g 2 z D
Friction coefficient between gas and wall [21,41]:
f g w z = 16 R e g z , R e g z 2100 0.079 R e g 0.25 z , 2100 < R e g z < 100,000
Friction force between particles and wall [41]:
F s w z = 2 f s w z ε s z ρ s z u s 2 z D
Friction coefficient between particles and wall [21,41]:
f s w z = 0.0285 g D u s z
Momentum exchange between gas and solid phase due to chemical reaction [41,43]:
F m a s s z = Γ ˙ g s z u g z
Total volume conservation:
ε g z + ε s z = 1

Appendix B. Algebraic Equations Related to Radiative Heat Transfer Rate

Radiative heat transfer rate:
Q g w r a d z = σ 1 ε w + 1 ε g e z   T g 4 z T w 4 z   a g w z
Emissivity of gas phase:
ε g e z = Z z i = 1 6 a i z e k i p C O 2 S e q
Ζ z = C 1 + C 2   T g z 1000 + C 3   T g z 1000 2
a i z = b 1 i + b 2 i   T g z 1000 + b 3 i   T g z 1000 2

Appendix C. Algebraic Equations Related to Energy Balance

Surface between gas and particles [22]:
a g s z = 6 1 ε g z d p
Surface area between gas and wall [22]:
a g w z = 4 D
Convective heat transfer coefficient between gas and particles [40]:
h g s z =   k g z N u g s z d p
Convective heat transfer coefficient between gas and wall [40]:
h g w z =   k g z N u g w z D
Gas–particles Nusselt number [40]:
N u g s z = 2 + N u g s , l 2 z + N u g s , t 2 z
N u g s , l z = 0.644 R e s z 1 2 Pr z 1 3
N u g s , t z = 0.0374 R e s 0.8 z Pr z 1 + 2.443 R e s 0.1 z Pr z 2 3 1
Gas–wall Nusselt number [40]:
N u g w z = 3.66 3 + 0.7 3 + N u 1 z 0.7 3 + N u 2 3 z 1 3 , R e g z 2300 1 γ z N u l z + γ N u t z , 2300 < R e g z < 10,000

References

  1. Gielen, D. Irena Working Paper: Concentrating Solar Power (Volume 1: Power Sector Issue 2/5); IRENA: Abu Dhabi, United Arab Emirates, 2012; Available online: https://www.irena.org/-/media/Files/IRENA/Agency/Publication/2012/RE_Technologies_Cost_Analysis-CSP.pdf (accessed on 10 July 2020).
  2. Pardo, P.; Deydier, A.; Anxionnaz-Minvielle, Z.; Rougé, S.; Cabassud, M.; Cognet, P. A review on high temperature thermochemical heat energy storage, Renew. Sustain. Energy Rev. 2014, 32, 591–610. [Google Scholar] [CrossRef] [Green Version]
  3. Kearney, D.; Kelly, B.; Herrmann, U.; Cable, R.; Pacheco, J.; Mahoney, R.; Price, H.; Blake, D.; Nava, P.; Potrovitza, N. Engineering aspects of a molten salt heat transfer fluid in a trough solar field. Energy 2004, 29, 861–870. [Google Scholar] [CrossRef]
  4. Vignarooban, K.; Xu, X.; Arvay, A.; Hsu, K.; Kannan, A.M. Heat transfer fluids for concentrating solar power systems—A review. Appl. Energy 2015, 146, 383–396. [Google Scholar] [CrossRef]
  5. Chacartegui, R.; Alovisio, A.; Ortiz, C.; Valverde, J.M.; Verda, V.; Becerra, J.A. Thermochemical energy storage of concentrated solar power by integration of the calcium looping process and a CO2 power cycle. Appl. Energy 2016, 173, 589–605. [Google Scholar] [CrossRef]
  6. Perejón, A.; Romeo, L.M.; Lara, Y.; Lisbona, P.; Martínez, A.; Valverde, J.M. The Calcium-Looping technology for CO2 capture: On the important roles of energy integration and sorbent behavior. Appl. Energy 2016, 162, 787–807. [Google Scholar] [CrossRef] [Green Version]
  7. Ortiz, C.; Valverde, J.M.; Chacartegui, R.; Perez-maqueda, L.A.; Giménez, P. The Calcium-Looping (CaCO3/CaO) process for thermochemical energy storage in Concentrating Solar Power plants. Renew. Sustain. Energy Rev. 2019, 113, 109252. [Google Scholar] [CrossRef]
  8. Karasavvas, E.; Panopoulos, K.D.; Papadopoulou, S.; Voutetakis, S. Design of an integrated CSP-calcium looping for uninterrupted power production through energy storage. Chem. Eng. Trans. 2018, 70, 2131–2136. [Google Scholar] [CrossRef]
  9. Edwards, S.E.B.; Materić, V. Calcium looping in solar power generation plants. Sol. Energy 2012, 86, 2494–2503. [Google Scholar] [CrossRef]
  10. Karasavvas, E.; Panopoulos, K.D.; Papadopoulou, S.; Voutetakis, S. Exergy analysis of the integration of a concentrated solar power plant with calcium looping for energy storage. In Proceedings of the 32nd International Conference on Efficiency, Cost, Optimization, Simulation and Environmental Impact of Energy Systems, Wroclaw, Poland, 23–28 June 2019; pp. 4345–4355. [Google Scholar]
  11. Karasavvas, E.; Panopoulos, K.D.; Papadopoulou, S.; Voutetakis, S. Energy and exergy analysis of the integration of concentrated solar power with calcium looping for power production and thermochemical energy storage. Renew. Energy 2020, 154, 743–753. [Google Scholar] [CrossRef]
  12. Alovisio, A.; Chacartegui, R.; Ortiz, C.; Valverde, J.M.; Verda, V. Optimizing the CSP-Calcium Looping integration for Thermochemical Energy Storage. Energy Convers. Manag. 2017, 136, 85–98. [Google Scholar] [CrossRef]
  13. Ortiz, C.; Chacartegui, R.; Valverde, J.M.; Alovisio, A.; Becerra, J.A. Power cycles integration in concentrated solar power plants with energy storage based on calcium looping. Energy Convers. Manag. 2017, 149, 815–829. [Google Scholar] [CrossRef]
  14. Martínez, I.; Grasa, G.; Parkkinen, J.; Tynjälä, T.; Hyppänen, T.; Murillo, R.; Romano, M.C. Review and research needs of Ca-Looping systems modelling for post-combustion CO2 capture applications. Int. J. Greenh. Gas Control 2016, 50, 271–304. [Google Scholar] [CrossRef]
  15. Manovic, V.; Charland, J.P.; Blamey, J.; Fennell, P.S.; Lu, D.Y.; Anthony, E.J. Influence of calcination conditions on carrying capacity of CaO-based sorbent in CO2 looping cycles. Fuel 2009, 88, 1893–1900. [Google Scholar] [CrossRef]
  16. Ju, Y.; Lee, C.H. Dynamic modeling of a dual fluidized-bed system with the circulation of dry sorbent for CO2 capture. Appl. Energy 2019, 241, 640–651. [Google Scholar] [CrossRef]
  17. Karasavvas, E.; Panopoulos, K.D.; Papadopoulou, S.; Voutetakis, S. Study of a Drop−Tube Carbonator Reactor for CSP−Calcium Looping Based on a Heterogeneous Reaction Model. Chem. Eng. Trans. 2019, 76, 877–882. [Google Scholar] [CrossRef]
  18. Kasule, J.S.; Turton, R.; Bhattacharyya, D.; Zitney, S.E. Mathematical modeling of a single-stage, downward-firing, entrained-flow gasifier. Ind. Eng. Chem. Res. 2012, 51, 6429–6440. [Google Scholar] [CrossRef]
  19. Zeneli, M.; Nikolopoulos, A.; Nikolopoulos, N.; Grammelis, P.; Karellas, S.; Kakaras, E. Simulation of the reacting flow within a pilot scale calciner by means of a three phase TFM model. Fuel Process. Technol. 2017, 162, 105–125. [Google Scholar] [CrossRef]
  20. Spinelli, M.; Martínez, I.; Romano, M.C. One-dimensional model of entrained-flow carbonator for CO2 capture in cement kilns by Calcium looping process. Chem. Eng. Sci. 2018, 191, 100–114. [Google Scholar] [CrossRef]
  21. Chuachuensuk, A.; Paengjuntuek, W.; Kheawhom, S.; Arpornwichanop, A. A systematic model-based analysis of a downer regenerator in fluid catalytic cracking processes. Comput. Chem. Eng. 2013, 49, 136–145. [Google Scholar] [CrossRef]
  22. Schöß, M.A.; Schulenburg, F.; Turek, T. Oxidation of copper at high temperature as an example for gas-solid reactions in a downer reactor—Experiments and model-based analysis. Chem. Eng. Sci. 2016, 151, 116–129. [Google Scholar] [CrossRef]
  23. Guizani, C.; Valin, S.; Billaud, J.; Peyrot, M.; Salvador, S. Biomass fast pyrolysis in a drop tube reactor for bio oil production: Experiments and modeling. Fuel 2017, 207, 71–84. [Google Scholar] [CrossRef] [Green Version]
  24. Deng, R.; Liu, H.; Wei, F.; Jin, Y. Axial flow structure at the varying superficial gas velocity in a downer reactor. Chem. Eng. J. 2004, 99, 5–14. [Google Scholar] [CrossRef]
  25. Bolkan, Y.; Berruti, F.; Zhu, J.; Milne, B. Modeling circulating fluidized bed downers. Powder Technol. 2003, 132, 85–100. [Google Scholar] [CrossRef]
  26. Zhang, H.; Zhu, J. Hydrodynamics in downflow fluidized beds (2): Particle velocity and solids flux profiles. Chem. Eng. Sci. 2000, 55, 4367–4377. [Google Scholar] [CrossRef]
  27. Vaishali, S.; Roy, S.; Mills, P.L. Hydrodynamic simulation of gas-solids downflow reactors. Chem. Eng. Sci. 2008, 63, 5107–5119. [Google Scholar] [CrossRef]
  28. Kasule, J.S.; Turton, R.; Bhattacharyya, D.; Zitney, S.E. One-dimensional dynamic modeling of a single-stage downward-firing entrained-flow coal gasifier. Energy Fuels 2014, 28. [Google Scholar] [CrossRef]
  29. Turrado, S.; Arias, B.; Fernández, J.R.; Abanades, J.C. Carbonation of Fine CaO Particles in a Drop Tube Reactor. Ind. Eng. Chem. Res. 2018, 57, 13372–13380. [Google Scholar] [CrossRef]
  30. Plou, J.; Martínez, I.; Grasa, G.S.; Murillo, R. Experimental carbonation of CaO in an entrained flow reactor. React. Chem. Eng. 2019, 4, 899–908. [Google Scholar] [CrossRef] [Green Version]
  31. Socratces Project, (n.d.). Available online: https://socratces.eu/ (accessed on 10 July 2020).
  32. Bhatia, S.K.; Perlmutter, D.D. A random pore model for fluid-solid reactions: I. Isothermal, kinetic control. AIChE J. 1980, 26, 379–386. [Google Scholar] [CrossRef]
  33. Bhatia, S.K.; Perlmutter, D.D. A random pore model for fluid-solid reactions: II. Diffusion and transport effects. AIChE J. 1981, 27, 247–254. [Google Scholar] [CrossRef]
  34. Bhatia, S.K.; Perlmutter, D.D. Effect of the product layer on the kinetics of the CO2-lime reaction. AIChE J. 1983, 29, 79–86. [Google Scholar] [CrossRef]
  35. Li, Z.S.; Fang, F.; Tang, X.Y.; Cai, N.S. Effect of temperature on the carbonation reaction of CaO with CO2. Energy Fuels 2012, 26, 2473–2482. [Google Scholar] [CrossRef]
  36. Grasa, G.; Murillo, R.; Alonso, M.; Abanades, J.C. Application of the random pore model to the carbonation cyclic reaction. AIChE J. 2009, 55, 1246–1255. [Google Scholar] [CrossRef]
  37. Grasa, G.S.; Abanades, J.C. CO2 capture capacity of CaO in long series of carbonation/calcination cycles. Ind. Eng. Chem. Res. 2006, 45, 8846–8851. [Google Scholar] [CrossRef]
  38. Sarrion, B.; Valverde, J.M.; Perejon, A.; Perez-Maqueda, L.; Sanchez-Jimenez, P.E. On the Multicycle Activity of Natural Limestone/Dolomite for Thermochemical Energy Storage of Concentrated Solar Power. Energy Technol. 2016, 4, 1013–1019. [Google Scholar] [CrossRef]
  39. Zhang, H.; Zhu, J.X.; Bergougnou, M.A. Hydrodynamics in downflow fluidized beds (1): Solids concentration profiles and pressure gradient distributions. Chem. Eng. Sci. 1999, 54, 5461–5470. [Google Scholar] [CrossRef]
  40. Kabelac, S.; Vortmeyer, D. VDI Heat Atlas Part K—Radiation. In VDI Heat Atlas, 2nd ed.; VDI, Ed.; Springer: Berlin/Heidelberg, Germany, 2010. [Google Scholar]
  41. Gidaspow, D. Multiphase Flow and Fluidization: Continuum and Kinetic Theory Descriptions; Academic Press: London, UK, 1994. [Google Scholar] [CrossRef]
  42. Fan, L.-S.; Zhu, C. Principles of Gas-Solid Flows; Cambridge University Press: Cambridge, UK, 2005. [Google Scholar] [CrossRef]
  43. Zhang, Y.; Zhao, Y.; He, X. Modeling coal pyrolysis in a cocurrent downer reactor. Particuology 2015, 21, 154–159. [Google Scholar] [CrossRef]
  44. Aspen Technology. Aspen Plus® User Guide; Aspen Technol. Inc.: Bedford, MA, USA, 2000. [Google Scholar]
  45. Aly, F.; Lee, L. Self-consistent equations for calculating the ideal gas heat capacity, enthalpy, and entropy. Fluid Phase Equilib. 1981, 6, 169–179. [Google Scholar] [CrossRef]
  46. Reid, R.C.; Prausnitz, J.M.; Sherwood, T.K. The Properties of Gases and Liquids; Mc Graw Hill: New York, NY, USA, 1987. [Google Scholar]
  47. Criado, Y.A.; Arias, B.; Abanades, J.C. Effect of the Carbonation Temperature on the CO2 Carrying Capacity of CaO. Ind. Eng. Chem. Res. 2018, 57, 12595–12599. [Google Scholar] [CrossRef] [Green Version]
  48. Alvarez, D.; Abanades, C.J. Determination of the Critical Product Layer Thickness in the Reaction of CaO with CO2. Ind. Eng. Chem. Res. 2005, 44, 5608–5615. [Google Scholar] [CrossRef]
  49. Ortiz, C.; Valverde, J.M.; Chacartegui, R.; Perez-Maqueda, L.A. Carbonation of Limestone Derived CaO for Thermochemical Energy Storage: From Kinetics to Process Integration in Concentrating Solar Plants. ACS Sustain. Chem. Eng. 2018, 6, 6404–6417. [Google Scholar] [CrossRef] [Green Version]
  50. Sun, P.; Grace, J.R.; Lim, C.J.; Anthony, E.J. Determination of intrinsic rate constants of the CaO-CO2 reaction. Chem. Eng. Sci. 2008, 63, 47–56. [Google Scholar] [CrossRef]
Figure 1. Conceptual process flow diagram of the SOCRATCES prototype plant (10 kW scale). Reprinted with permission, Elsevier, 2020 [11].
Energies 13 05905 g001
Figure 2. Drop-tube carbonator reactor assembly according to the SOCRATCES prototype plant [17].
Energies 13 05905 g002
Figure 3. (a) Conversion vs. time (experimental data and RPM) for carbonation reaction of limestone-derived CaO under P CO 2 = 1.25 ,   0.9 ,   0.70   and   0.50   atm at T = 820   ° C . (b) Reaction rate r vs. P e R T P CO 2 P e 1 for the carbonation reaction of limestone-derived CaO under P CO 2 = 1.25   atm ,   0.9   atm ,   0.70   atm   and   0.50   atm at T = 820   ° C .
Energies 13 05905 g003
Figure 4. Process variable profiles of reference conditions under a “fresh CaO” regime with respect to the (a) CaO and CO2 conversion, X CaO & X CO 2 ; (b) solid and gas phase temperatures, T s & T g ; (c) pressure and gas voidage, P   &   ε g ; (d) solid and gas phase velocities, u s & u g .
Energies 13 05905 g004aEnergies 13 05905 g004b
Figure 5. Process variable profiles with wall temperatures under the “fresh CaO” regime with respect to the (a) CaO conversion, X CaO ; (b) solid phase temperature, T s ; (c) thermal power produced, Q r x n ; (d) solid phase velocity, u s .
Energies 13 05905 g005
Figure 6. Process variable profiles with CO2 flow rate under a “fresh CaO” regime with respect to (a) CaO conversion, X CaO ; (b) solid phase temperature, T s ; (c) thermal power produced, Q r x n ; (d) solid phase.
Energies 13 05905 g006aEnergies 13 05905 g006b
Figure 7. Process variable profiles with CaO flow rate under a “sintered CaO” regime with respect to the (a) CaO conversion, X CaO ; (b) solid phase temperature, T s ; (c) thermal power produced, Q r x n ; (d) solid phase velocity, u s .
Energies 13 05905 g007
Figure 8. Process variable profiles with carbonation pressure under a “sintered CaO” regime with respect to the (a) CaO conversion, x CaO ; (b) solid phase temperature, T s ; (c) thermal power produced, Q r x n ; (d) solid phase velocity, u s .
Energies 13 05905 g008aEnergies 13 05905 g008b
Table 1. Properties values of fresh and sintered lime used in RPM.
PropertyFresh CaOSintered CaO
BET surface area (m2/g)16.974.36
Mean particle diameter, dp (×10−6 m)6060
Pore volume, PV0 (×10−6 m3/g)0.1730.075
Pore surface area, S0 (×107 m2/m3)3.581.16
Total pore length, L0 (×1014 m/m3)2.790.54
Porosity, ε00.370.20
Ψ1.723.99
Table 2. Process parameter values for the carbonator model.
Process ParametersValue
d p (m)60 × 10−6
ρ CaO (kg m−3)3340
ρ CaCO 3 (kg m−3)2700
D (m)0.1541
L (m)4.0
c p , s (kJ kg−1 K−1)1.00
Δ H r x n (kJ mol−1)178.7
ε w 0.7
σ 5.6704 × 10⁻⁸
Table 3. Operating conditions for the simulation of the carbonator.
Operating ConditionsReference ValueRange in Sensitivity Analysis
Inlet reactants temperature (°C)20025–200
Carbonator pressure (atm)1.00.5–1.0
Inlet solids flow rate (kg/h)2010–30
Initial gas flow rate (kg/h)2010–20
Reactor’s inner wall temperature 700400–800
Table 4. Reaction rate r values for carbonation of limestone derived CaO under different P CO 2 conditions at T = 820   ° C obtained from RPM.
P CO 2   ( atm ) 1.250.90.70.5
r (nm/s)4.52.51.60.7
Table 5. Input data for the carbonator simulation under “fresh CaO”.
Operating ConditionsReference ConditionsWall Temperature EffectCO2 Flow Rate Effect
Inlet reactants temperature (°C)200200200
Carbonator pressure (atm)1.01.01.0
Inlet solids flow rate (kg/h)201010
Initial CO2 flow rate (kg/h)201010–30
Reactor’s inner wall temperature700400–800700
Maximum sorbent conversion70%70%70%
Table 6. Input data for carbonator simulation under “sintered CaO”.
Operating ConditionsCaO Flow Rate StudyCarbonation Pressure Study
Inlet reactants temperature (°C)25100
Carbonator pressure (atm)1.00.5–0.9
Initial solids flow rate (kg/h)10–3020
Initial CO2 flow rate (kg/h)1010
Reactor’s inner wall temperature800800
Maximum sorbent conversion20%20%
Publisher’s Note: MDPI stays neutral with regard to jurisdictional claims in published maps and institutional affiliations.

