Article

Optimization of Spatial Configuration of Multistrand Cable Lines

1
Omega Projekt s.j., ul. Topolowa 1, 43-100 Tychy, Poland
2
Faculty of Electrical Engineering, Częstochowa University of Technology, Al. Armii Krajowej 17, 42-201 Częstochowa, Poland
*
Author to whom correspondence should be addressed.
Energies 2020, 13(22), 5923; https://doi.org/10.3390/en13225923
Submission received: 27 September 2020 / Revised: 5 November 2020 / Accepted: 11 November 2020 / Published: 13 November 2020
(This article belongs to the Special Issue Power System Simulation, Control and Optimization)

Abstract

:
Skin and proximity effects have a considerable impact on current distribution in multistrand cable lines. Under unfavorable heat exchange conditions, some strands may be subject to excessive overheating, which may lead to serious malfunctions or even fires of the installation. The paper proposes a new criterion for a quick choice of spatial configurations, for which the effect might be minimized. A comprehensive analysis of literature cases is provided, including the recommendations of the U.S. National Code and the Canadian standard.

Graphical Abstract

1. Introduction

Delivery of electrical energy often requires cables with high current-carrying capacity, that is, ampacity. In some situations it is necessary to use multistrand cables connected in parallel. Since 1957, the publication year of the seminal paper by Neher and McGrath [1], much attention was paid by the engineering community to the problems related to computations of current distribution in such systems. Murgatroyd developed a method to compute total proximity loss per unit length in multistrand bunch conductors of arbitrary shape [2]. Dawson et al. carried out a simplified analysis of nonuniform current sharing based on a coupled circuit model [3]. An analysis of their results, pertaining to DC systems, allowed us to formulate a useful criterion for selecting the most promising spatial configurations of cables after a generalization to three-phase systems. Petty presented a matrix algebra method for solving current distribution among phase conductors [4]. Ghandakly et al. provided current sizing information for bundled cables in high-current applications in the form of ampacity tables [5]. Sellers and Black proposed several improvements to the Neher–McGrath model: a new parameter accounting for unequal heating among the cables, some improved relationships for thermal resistance for the fluid layer existing in pipe-type cables and cables installed in ducts, as well as a modified model for thermal resistance of concrete duct banks with nonsquare cross-sections [6]. Du and Burnett developed a general prediction method for current distribution and examined its usefulness on data concerning supply of Hong Kong office building installations [7]. The textbook by Anders [8] is a comprehensive source of information on steady-state and transient ampacity calculations for electric power cables, in particular for the cases not covered in IEC 60287 standard (derived from the Neher–McGrath paper). Special attention was paid to such problems as derating considerations for cables crossing thermally unfavorable regions and for deeply buried cables. The thermal effect on cable ampacity in multistrand cable systems has also been considered in several recent papers published in MDPI Energies [9,10].
Generally speaking, current distribution in multistrand cable systems is uneven due to several factors, such as skin and proximity effects related to strand geometry [3,5], the conditions of heat exchange with the neighborhood [8,9,10], soil inhomogeneity, moisture, installation depth (if the cables are buried), harmonic spectrum of currents flowing through the cables (cf. e.g., [11]), and the presence of buried metal objects, to mention but a few. Analytical treatment of all these factors is hardly possible [12], therefore numerical methods, in particular the Finite Element and the Finite Volume methods, have found wide use for engineering purposes.
At the same time, it should be stated that the problem is not merely a theoretical one; as pointed out by Čiegis et al. [13], many existing power lines are overdimensioned by up to 60% in terms of transmitted power, which means additional costs and waste of deficit core material (e.g., copper). Desmet et al. [14] estimate that cable losses reach 5% of the total power consumption. On the other hand, the infrastructure grid has to be redesigned constantly in order to adapt to new conditions resulting from installation of new distributed generating capacities like wind farms and so forth. The wide use of power electronics devices both in industry and at households results in the presence of highly distorted current spectra. All these challenges have to be faced by the designers of cable supply systems. Their negligence may lead to serious malfunctions [11,15] or even fires of cable installations [9]. Such a situation has occurred during professional activities of the first author of the present paper. Despite considerable efforts aimed at a correct choice of cables supplying the main low-voltage switchboard in a car hood factory, after putting the installation into operation, a fire resulting from overloading one phase of the supply system has destroyed completely the cable installation (Figure 1). The considered system was designed in accordance with the guidelines included in the Polish standard PN-IEC 60364-5-523:2001 (derived from translation from IEC 60364-5 part 52 International Standard) and was supposed to withstand a 10% safety margin, however, as pointed out previously, the system experienced a serious fault soon after being put into operation. This fact has inspired the first author to carry out additional studies on current distribution of multibundle cable systems. It was found during a “postmortem” analysis that in the considered system, considerable differences between phase current values were present due to the proximity and skin effects [16].
The aim of the present paper is to propose a simple approach to identify the most promising configurations of low-voltage multibundle cable systems, for which the skin and proximity effects are minimized. The original concept of the paper is to avail of some routines available in MATLAB Graph and Network Toolbox [17] in order to facilitate the description of interactions between the cables. It should be remarked that in this manuscript, a simplified model for current distribution is considered. It assumes that current distribution is a function of spatial geometry only. Therefore, the use of procedures related to graph theory is somewhat limited, that is, we use nonoriented graphs as a smart, easily scalable method to separate the description of cable geometry in real-life conditions from the abstract layer that specifies interactions between graph nodes (represented by the cables in the bundle). In this context, we believe the use of adjacency function allows one to simplify the notation and to avoid mistakes. Moreover, we think that the use of notation borrowed from the graph theory allows one to simplify the analysis in those cases when the direct application of barycenter criterion (described in detail in Section 2.3 of the present paper) is not possible (e.g., due to constraints introduced by real-life geometry of the ducts, limited space for cable location, etc.). Then the description of mutual interactions between the strands in the form of a graph may be incorporated as a fragment of some relevant optimization algorithm applied (e.g., to a circuit-based model similar to the one considered by Lee [18]). The full potential of graph theory, which incorporates powerful, highly optimized algorithms for computation of maximal flow between graph nodes (e.g., the Ford–Fulkerson algorithm), is still to be explored in a subsequent publication.
The paper is structured as follows. Section 2 describes the developed laboratory stand. The results of measurements carried out using a single-phase excitation for several cable configurations are presented. A simplified method to determine current distribution using the distance criterion is proposed. Section 3 includes a brief literature review concerning methods of computation of current distribution in multibundle cable systems. Subsequently, a generalization of the results is presented, indicating that in the cases considered as optimal ones, some spatial symmetry patterns may be found. A practical conclusion is the formulation of a criterion, which allows one to choose preliminary configurations to be examined in subsequent steps during an in-depth FEM-based analysis. Section 4 provides a verification of the proposed criterion using the freeware FEMM software for some simple cases.
The ultimate goal of the paper is to provide the designers of cable systems a really simple criterion, which can be easily implemented in a spreadsheet or verified “by hand” computations, allowing them to choose the most promising spatial configurations for subsequent analysis using coupled electromagnetic-thermal FEM calculations.

2. Materials and Methods

2.1. Experimental Determination of Current Asymmetry for Single-Phase Systems

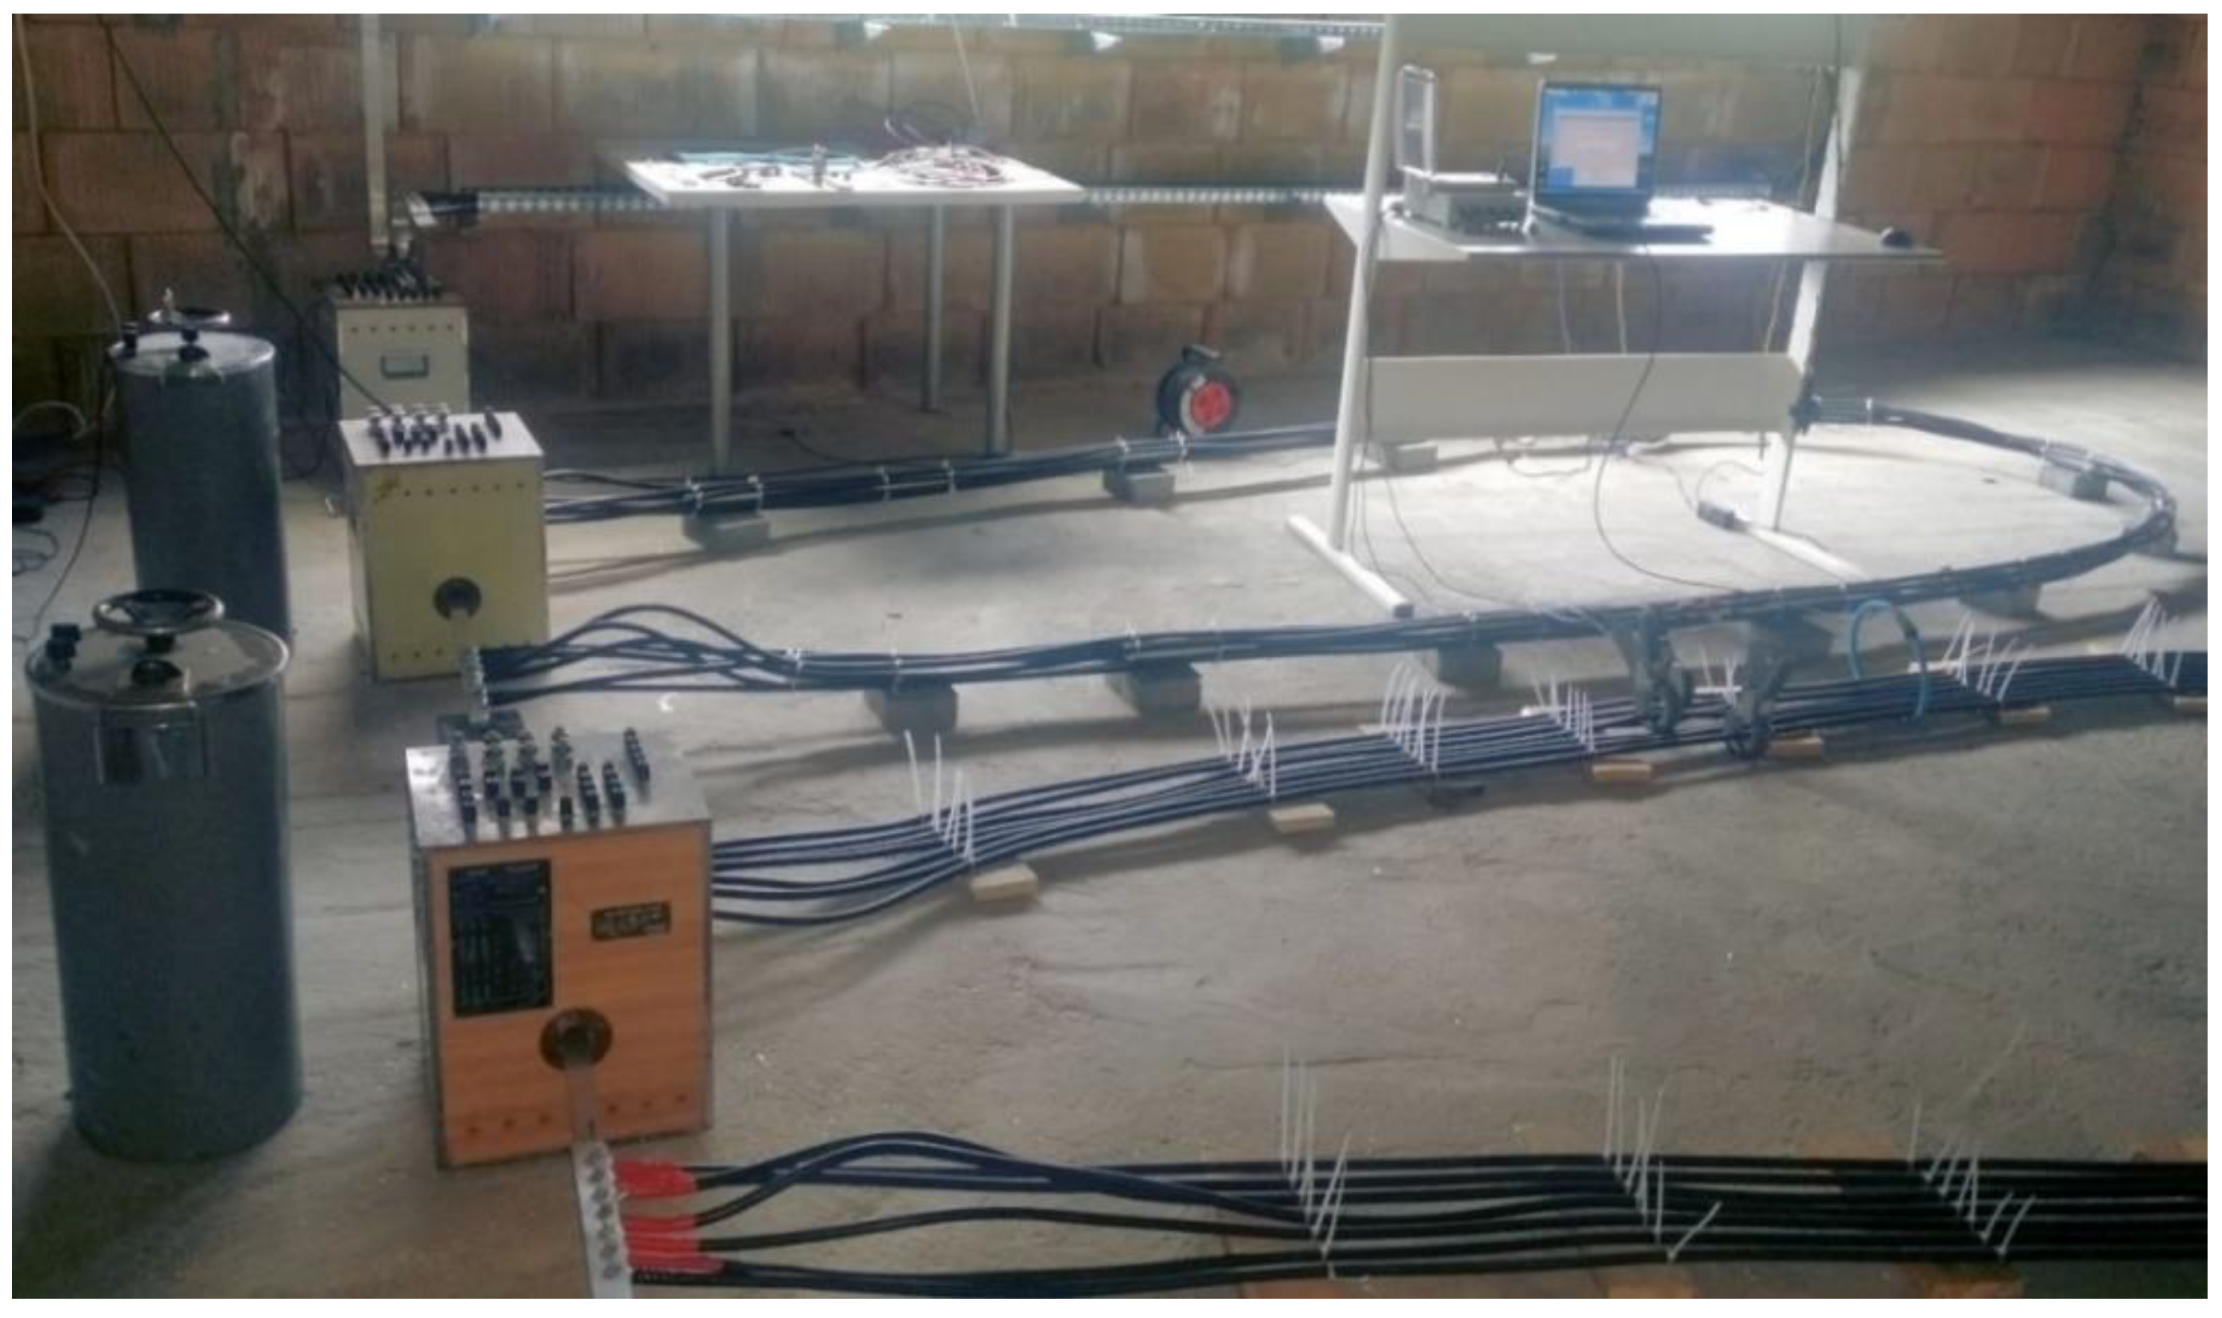
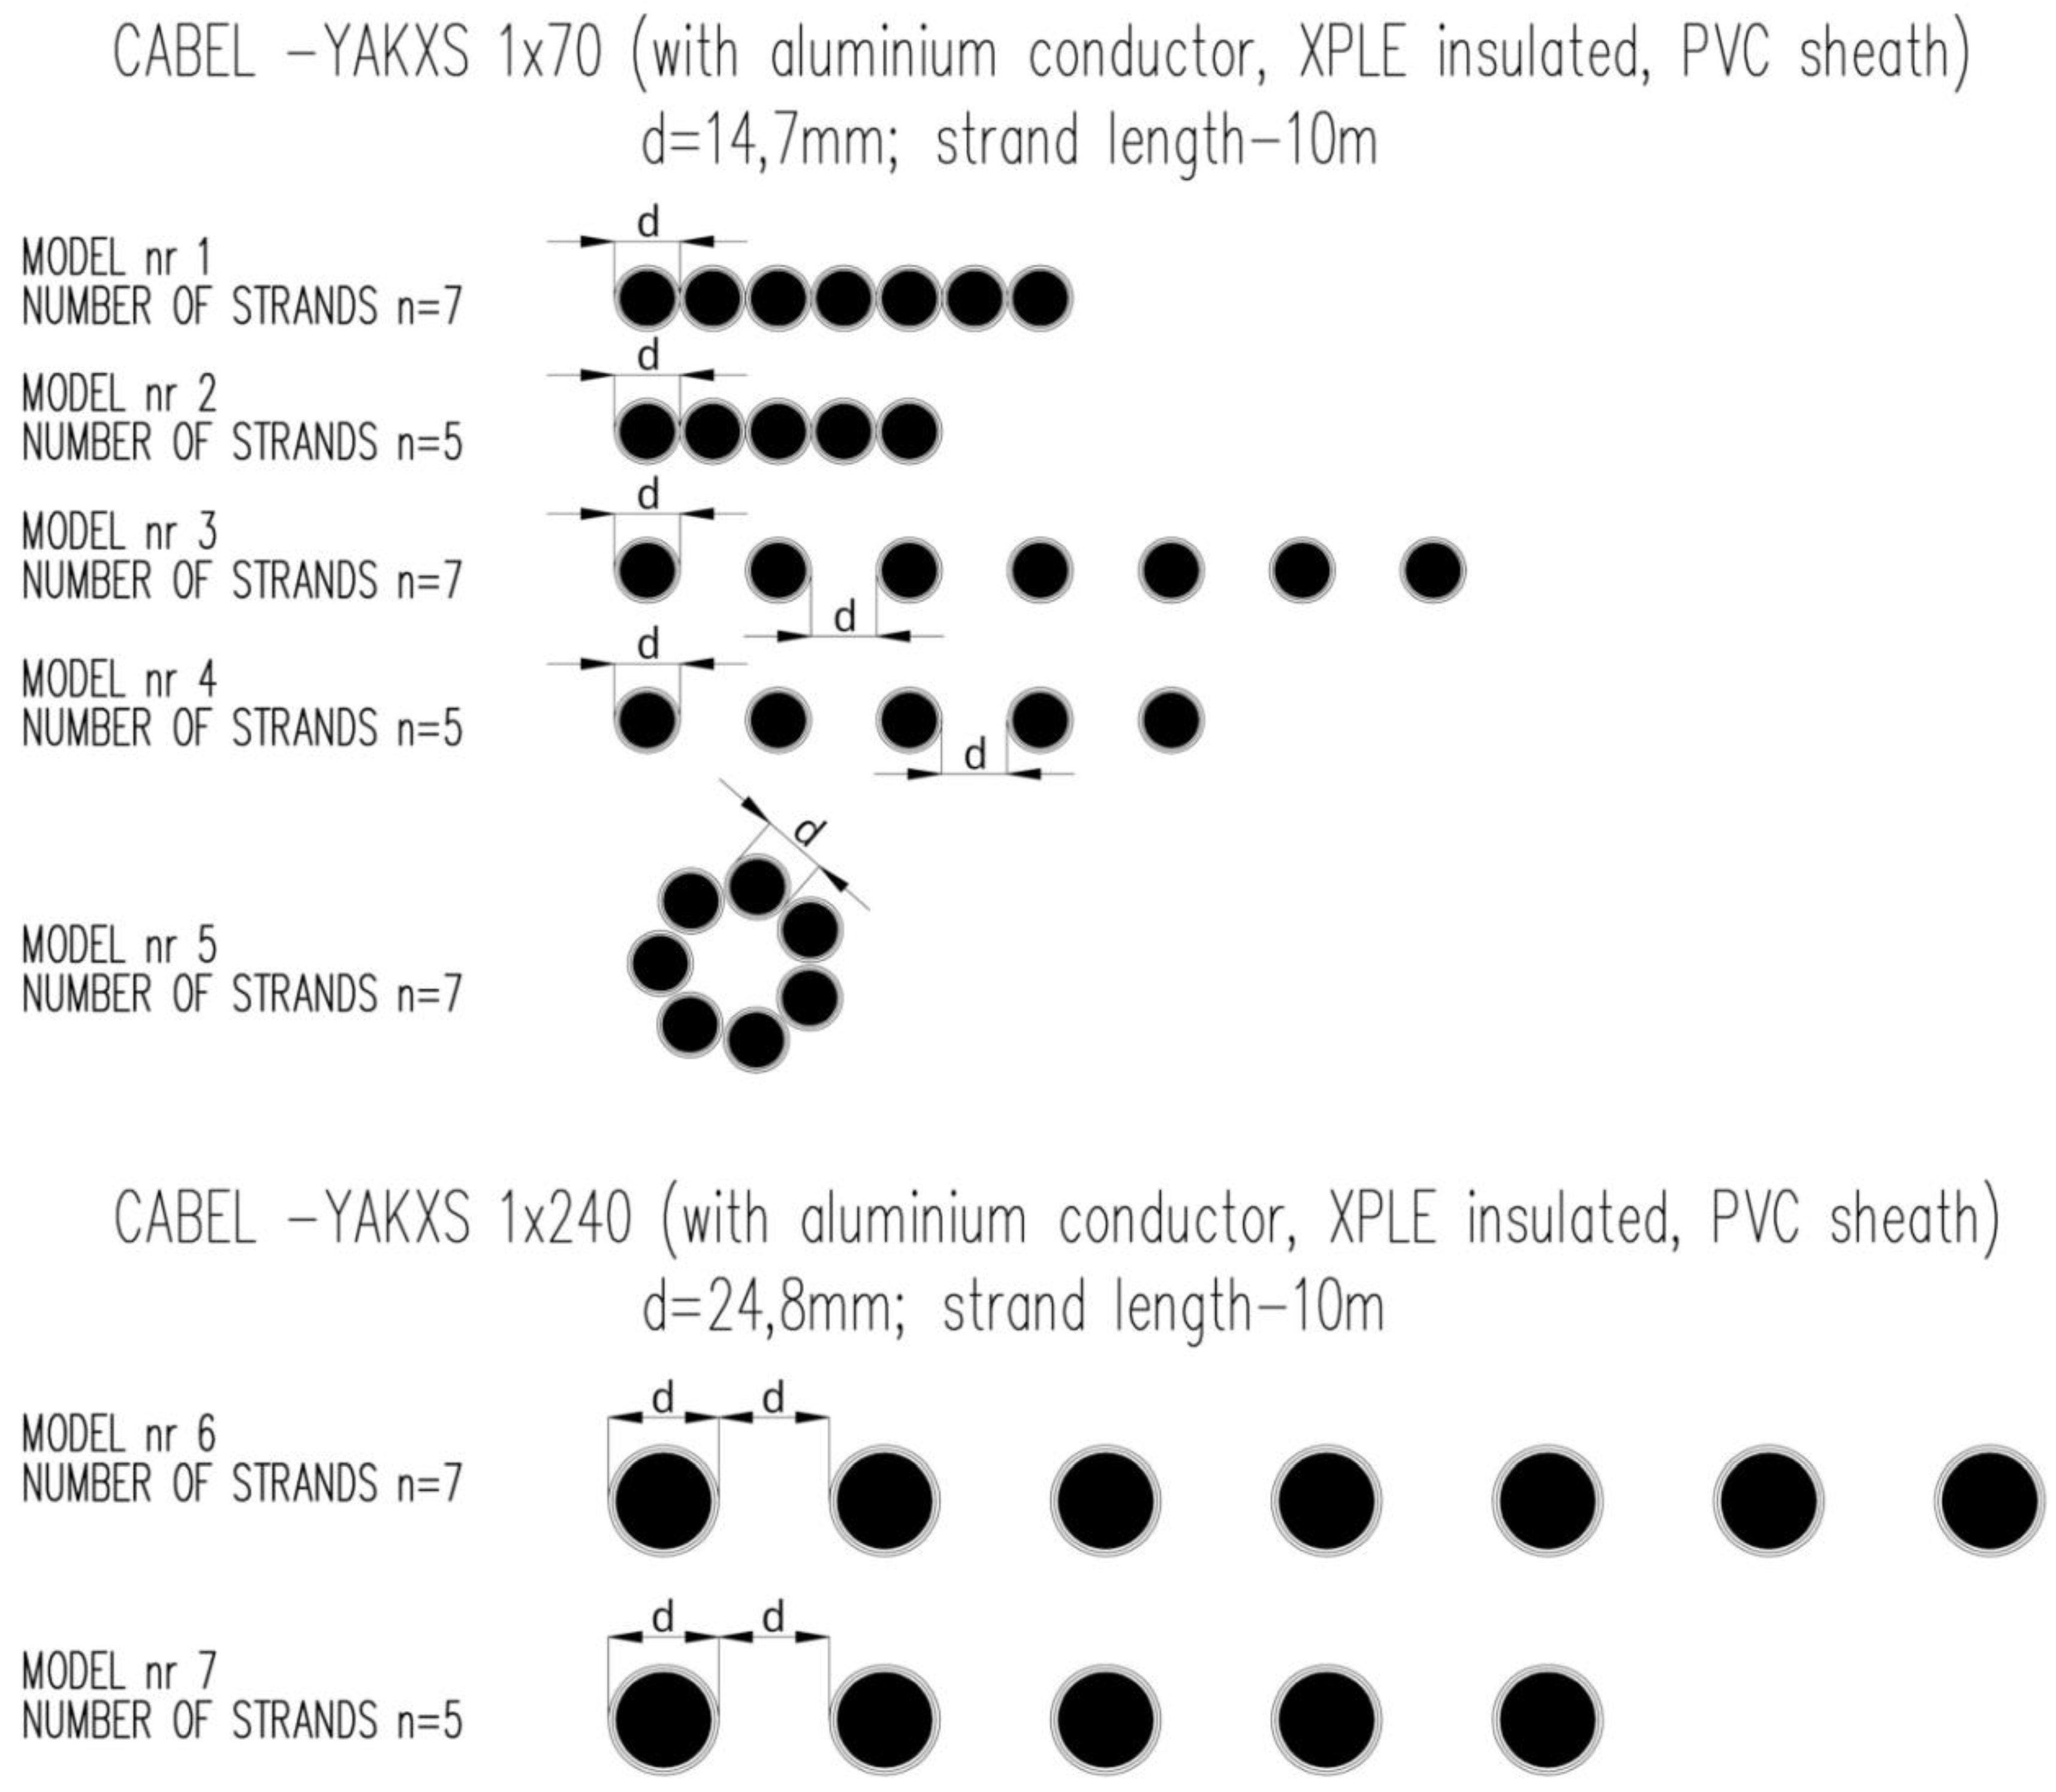
A laboratory stand was developed for the experimental examination of several spatial configurations of single-phase cable systems. The photograph of the stand is shown in Figure 2, whereas in Figure 3, the considered configurations are depicted. Five of them included the strands made of YAKXS 1 × 70 cables, whereas the remaining two were made using YAKXS 1 × 240 cables. All considered configurations were excited from a single phase. For each setup, three values of excitation current were preset, that is, 200 A, 300 A, and the maximal value, possible to be obtained for the transformer used.
Ahead of the current measurements, the measurements of resistances of individual strands were carried out. The difference between extreme values was smaller than 1%. The measurements were made using the MMR-620 device from Sonel. The temperature of each strand before the measurements was the same and remained practically constant during the measurements (taking into account relatively small current magnitudes and short measurement time). Temperature recording for each strand was made individually for each phase. A control measurement of the ambient temperature was also carried out. Considering very small values of cable resistances (4.42 mΩ for YAKXS 1 × 70 cables, 1.21 mΩ for YAKXS 1 × 240 cables), it was crucial to prepare the cable endings properly and to minimize the values of contact resistances. The screw connections were applied and the cable endings were pressed from both sides using aluminum bars. Additionally, between the cable ending and the bar, the silver-based contact paste MG Chemicals 8463 was applied. After the connections were made, the measurements of contact resistance were carried out using the MMR-620 device. The average value of resistance for the 70 mm2 cable ending was 27.6 µΩ, for the 240 mm2 cable ending—15.4 µΩ. The deviation between the measured extreme values did not exceed 5%.
In order to compare the obtained measurement results for each spatial configuration, the ratio of currents in the extremely loaded strands (the asymmetry coefficient) was determined, as in Equation (1):
C AS = I max I min ,
where I max is RMS current value in the most loaded strand and I min is RMS current value in the least loaded strand.
Table 1 presents the measurement results for the maximal attainable excitation current value, whereas Table 2 includes the values of asymmetry coefficient for different models, both for the maximal excitation current value and for the preset value 200 A. (Notation: S1—strand 1, etc., M1—model 1, etc.)
The analysis of the obtained measurement results indicates that the current distribution in parallel lines is highly dependent on spatial configuration. More uneven distributions are obtained for bigger cable cross-sections. Strand separation, as well as the increase of their amount in the flat configuration, leads to the increase of asymmetry coefficient. For the considered physical models, the most uniform current distribution was obtained for model No. 5.

2.2. Distance-Based Criterion

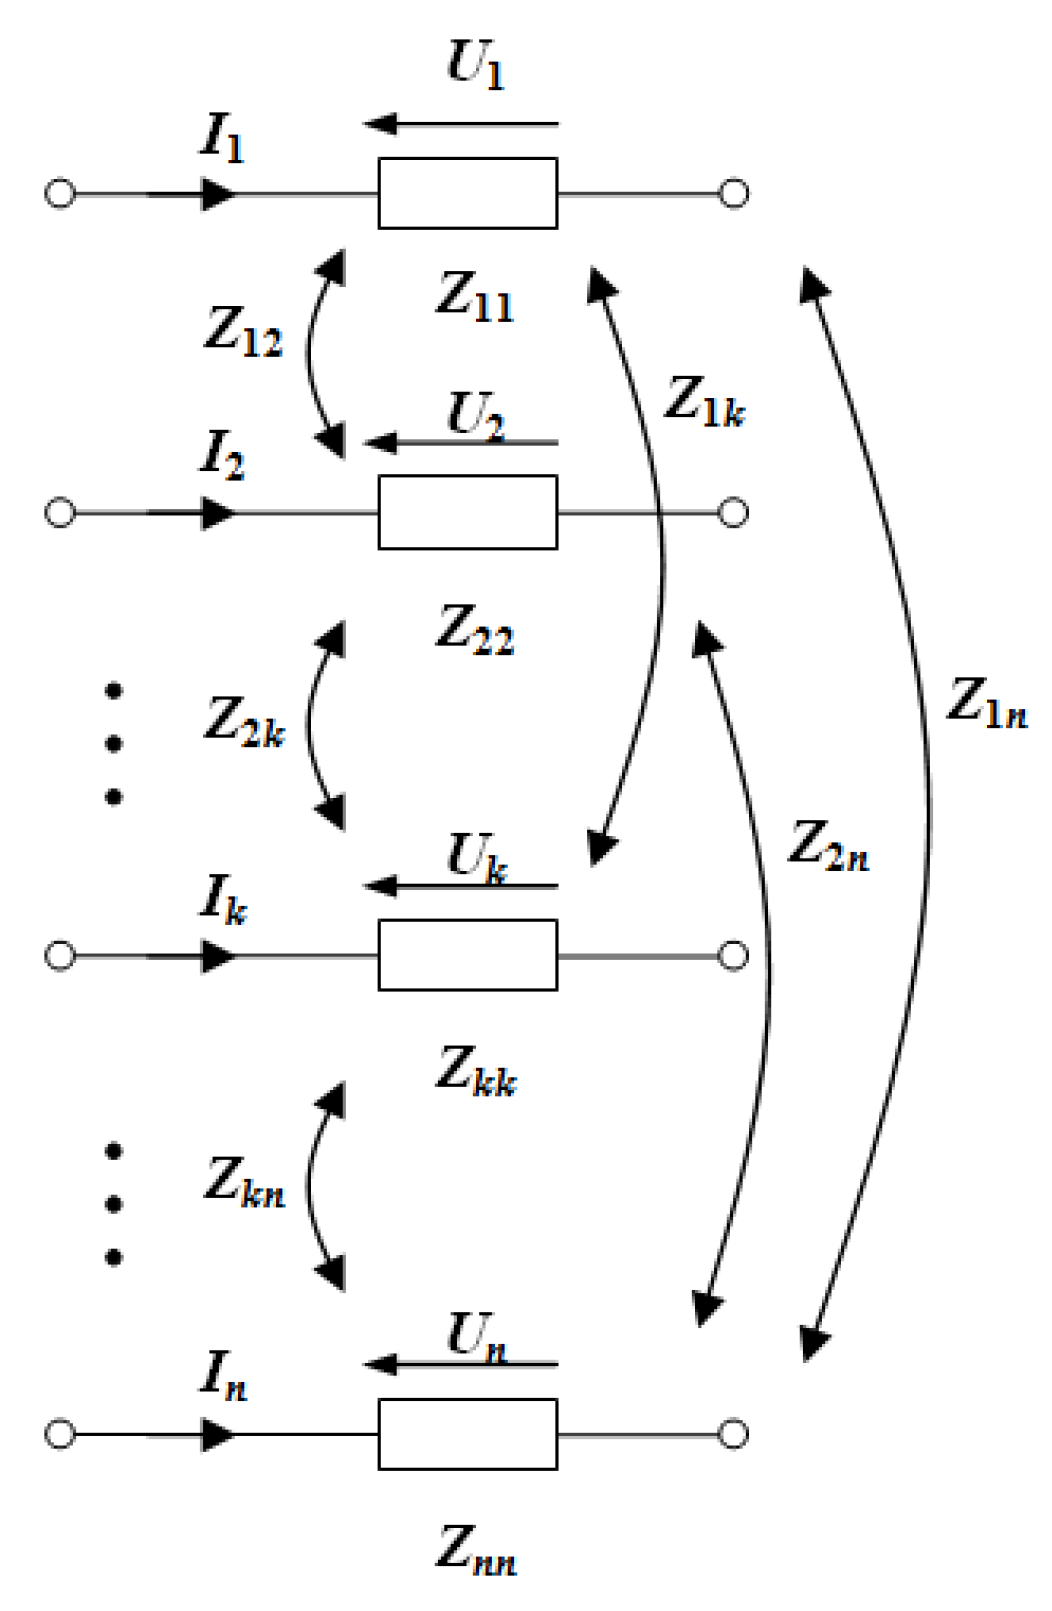
Lee considered a cable configuration technique for the balance of current distribution in parallel three-phase cables in [18]. The method requires the computation of self- and mutual impedances of the cables, which are geometry-dependent. Figure 4 depicts schematically the couplings between individual strands.
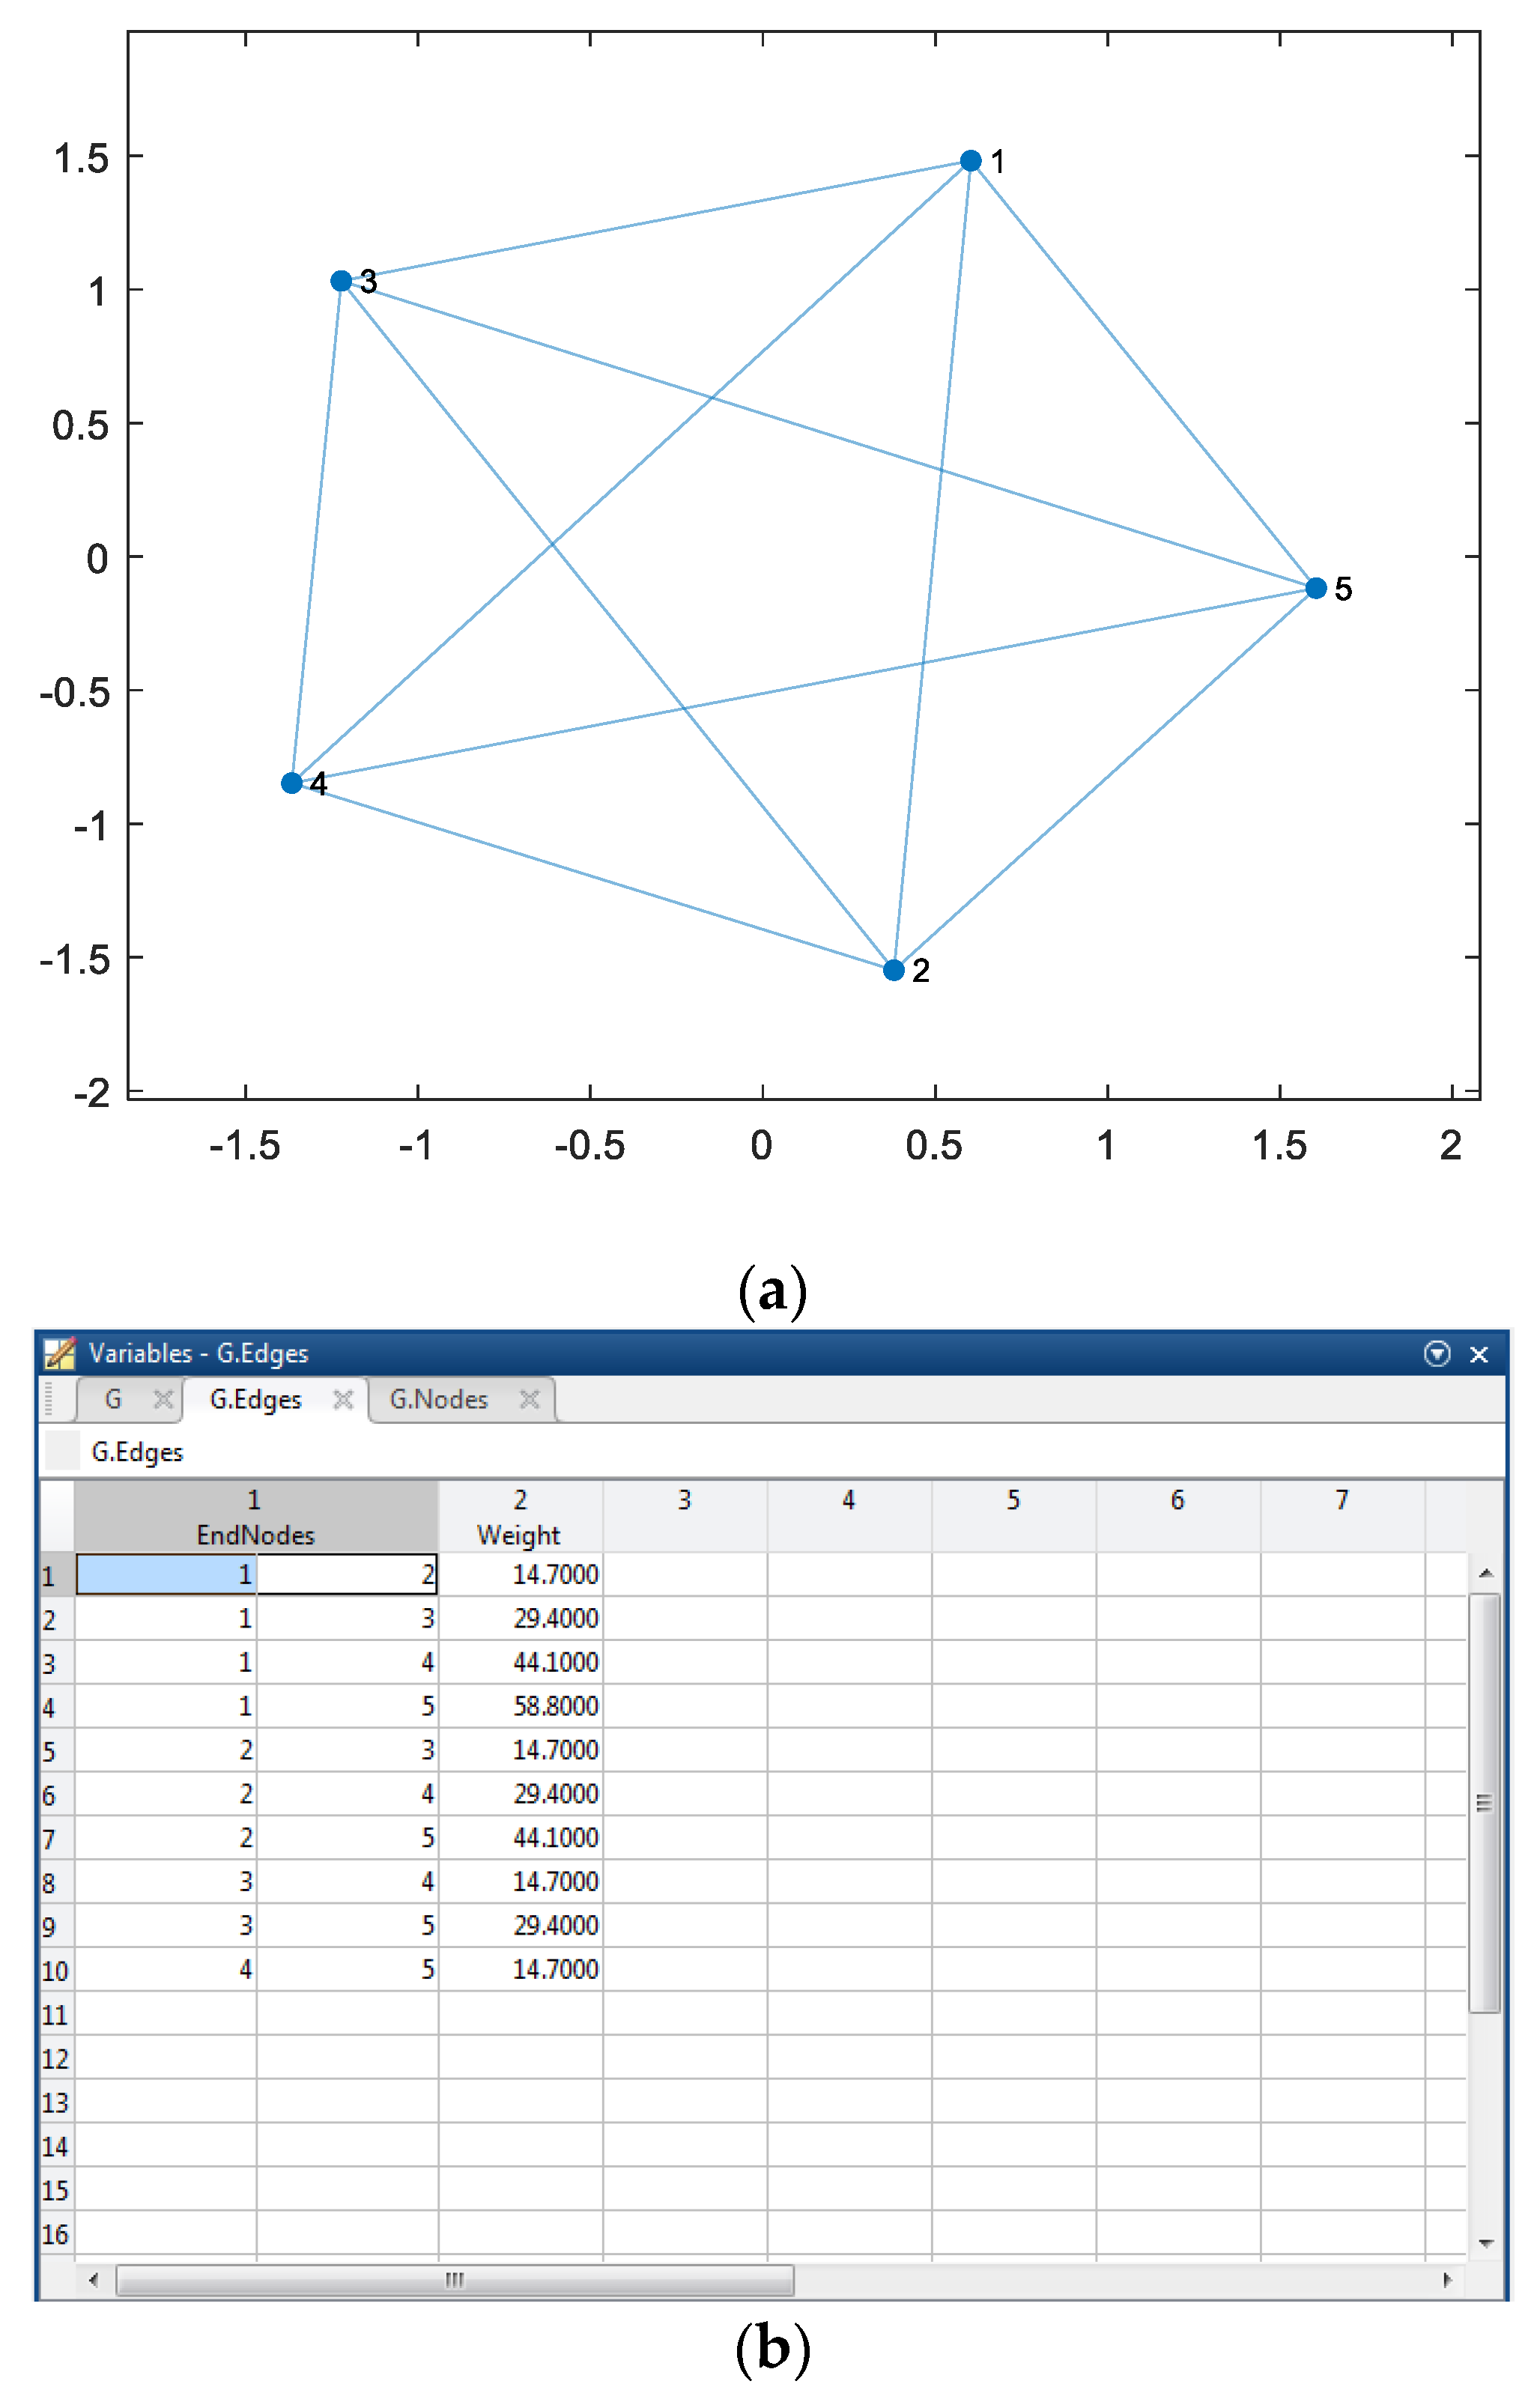
The problem with the method is that the resulting impedance matrix is a full matrix containing imaginary numbers (the elements on the main diagonal are complex numbers, since they include the strand resistances). Moreover, the computed values are relatively small in most practical cases, which causes some numerical problems with the precise determination of the inverse matrix needed in the subsequent computation step. This has led us to the formulation of a simplified method to determine current distribution, relying only on mutual distances between the strands. We have assumed that the current in the individual strand may be approximately proportional to the sum of distances of the strand to its neighbors. We have used the Graph and Network MATLAB toolbox [17] in order to introduce an abstract, geometry-independent layer, which facilitates the computations. An exemplary graph corresponding to model 2 or 4 is depicted in Figure 5a. The strand centers are represented as graph nodes and the distances between them may be written as appropriate weights for the edges (Figure 5b).
The number of all graph edges in the considered case is ( 5 2 ) = 10 (the appropriate MATLAB command is nchoosek (5, 2)). Let us notice that in this case, the size of adjacency matrix is moderate (i.e., 10 × 10), but in practice for fewer cables per bundle in three-phase systems, it becomes large and the procedure of writing down the connection list becomes error-prone.
Some MATLAB code snapshots are given below:
  • points = [points_x points_y]; % node coordinates
  • distances = squareform(pdist(points));
  • G = graph(distances); G.Nodes.x=points(:,1); G.Nodes.y=points(:,2);
  • A = full(adjacency(G, G.Edges.Dist));
  • Currents = zeros(length(points_x),1);
  • for i = 1:length(Currents) Currents(i)=sum(A(i,:)); end
  • Currents = Currents./sum(sum(A));
A comparison of the values of computed and experimentally determined currents for the preset excitation current 200 A is given in Table 3. The discrepancies between the corresponding values do not exceed 21%.
An interesting case is when the cables are placed on a circle radius (model 5), when the uniform current distribution was obtained. The simplified computational model also indicates that such spatial configuration is close to optimum. The results are the premise for further examination of cases, where the cables are placed in the nodes of equilateral polygons.

2.3. Barycenter-Based Criterion

Let us notice that in this case, the size of adjacency matrix is moderate (i.e., 10 × 10), but in practice for several cables per bundle in three-phase systems, it becomes large and the procedure of writing down the connection list becomes error-prone. When analyzing current distributions in cables with multiple strands, an important factor to be accounted for seems to be the symmetry. Intuitively, the arrangements with certain symmetry lead to even current distribution between the strands. To a certain extent, the symmetry can be taken into account by analyzing the barycenters (gravity centers) of strand groups. Therefore, we propose another simplified criterion for preliminary selection of the most promising arrangements of strands. It is based on minimizing distances between barycenters of strands belonging to individual phases. If (xk, yk) are coordinates of the center of strands consisting of phase A (k = 1, 2, 3, … n), then the barycenter of phase A equals x A = ( k = 1 n x k ) / n and y A = ( k = 1 n y k )   / n . Analogous formulas are used for phases B and C. Then we build a triangle of vertices ( x A , y A ) , ( x B , y B ) , ( x C , x C ) and calculate its area as follows:
S = 1 2 d e t [ x A y A 1 x B y B 1 x C y C 1 ]
By analyzing several examples offered by literature in the subsequent section, we are convinced that the arrangements with as small S as possible are good candidates to keep a high degree of symmetry for current distribution. This criterion has to be modified when the phase barycenters are collinear, because then the triangle area is zero. Without loss of generality, we can assume then that Y A = Y B = Y C . In such a case, it is convenient to introduce discrepancy between phase barycenters as follows:
D = max ( X A , X B , X C ) min ( X A , X B , X C )
The analysis of several examples in the subsequent section indicates that “good” arrangements have D as low as possible.

3. Relevant Case Studies from Literature

In the paper [3], Dawson and Jain have analyzed chosen methods to balance current distribution in DC circuits (hot wire + earth). The authors have suggested the following methods to obtain more uniform current distributions:
  • adding series resistance (not recommended, due to increased losses)
  • adding series reactance (enhances the self-inductance/mutual inductance ratio. In this way, the effect of asymmetries in mutual inductance values is diminished. The method is not recommended for circuits operating at higher frequencies).
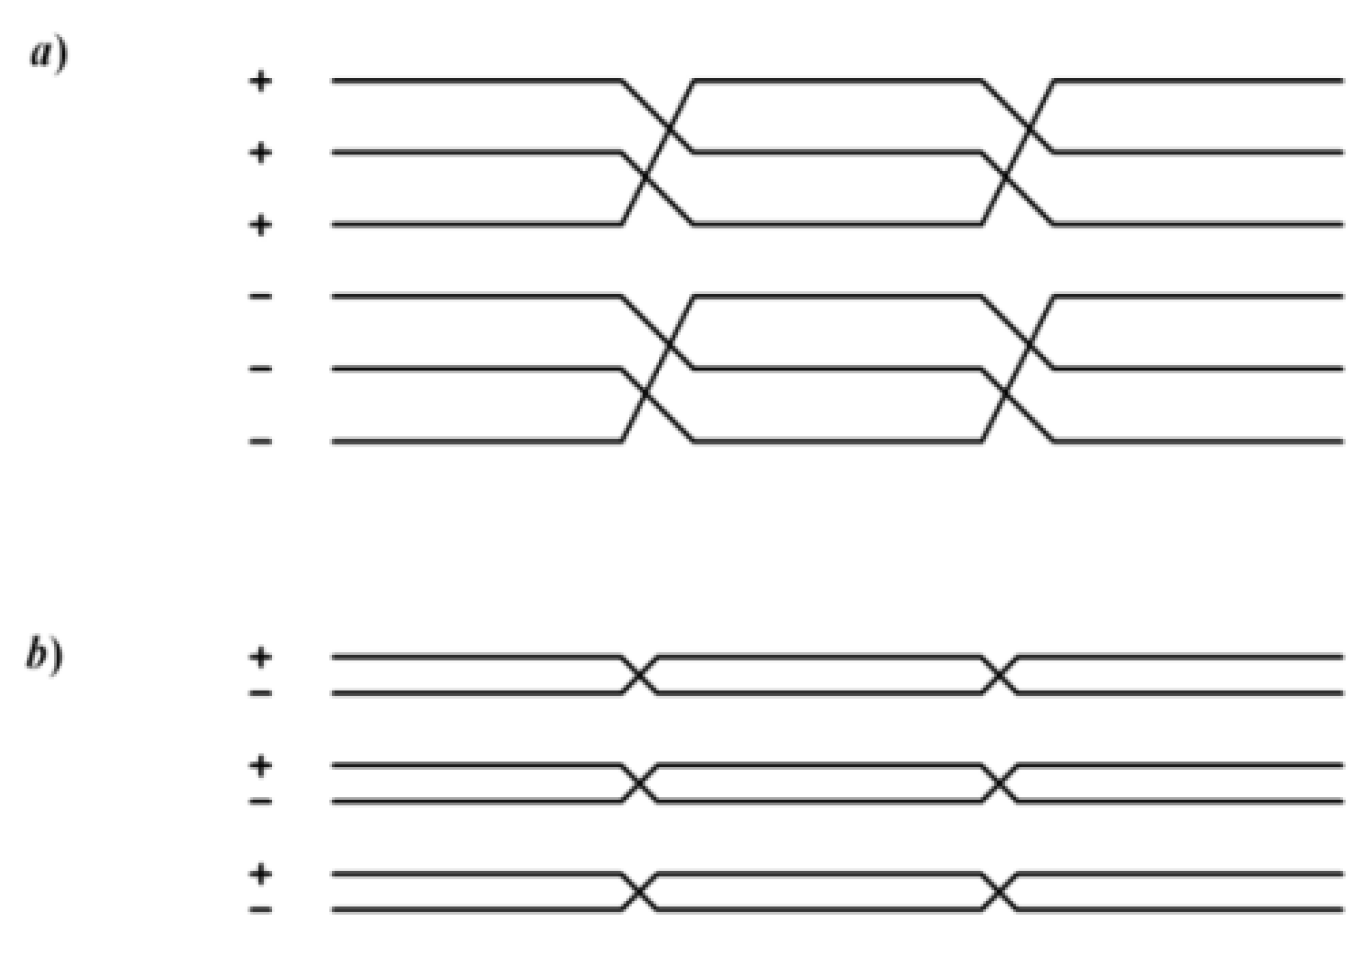
  • transposition either of cables with the same polarity (Figure 6a) or of each pair of cables (Figure 6b)
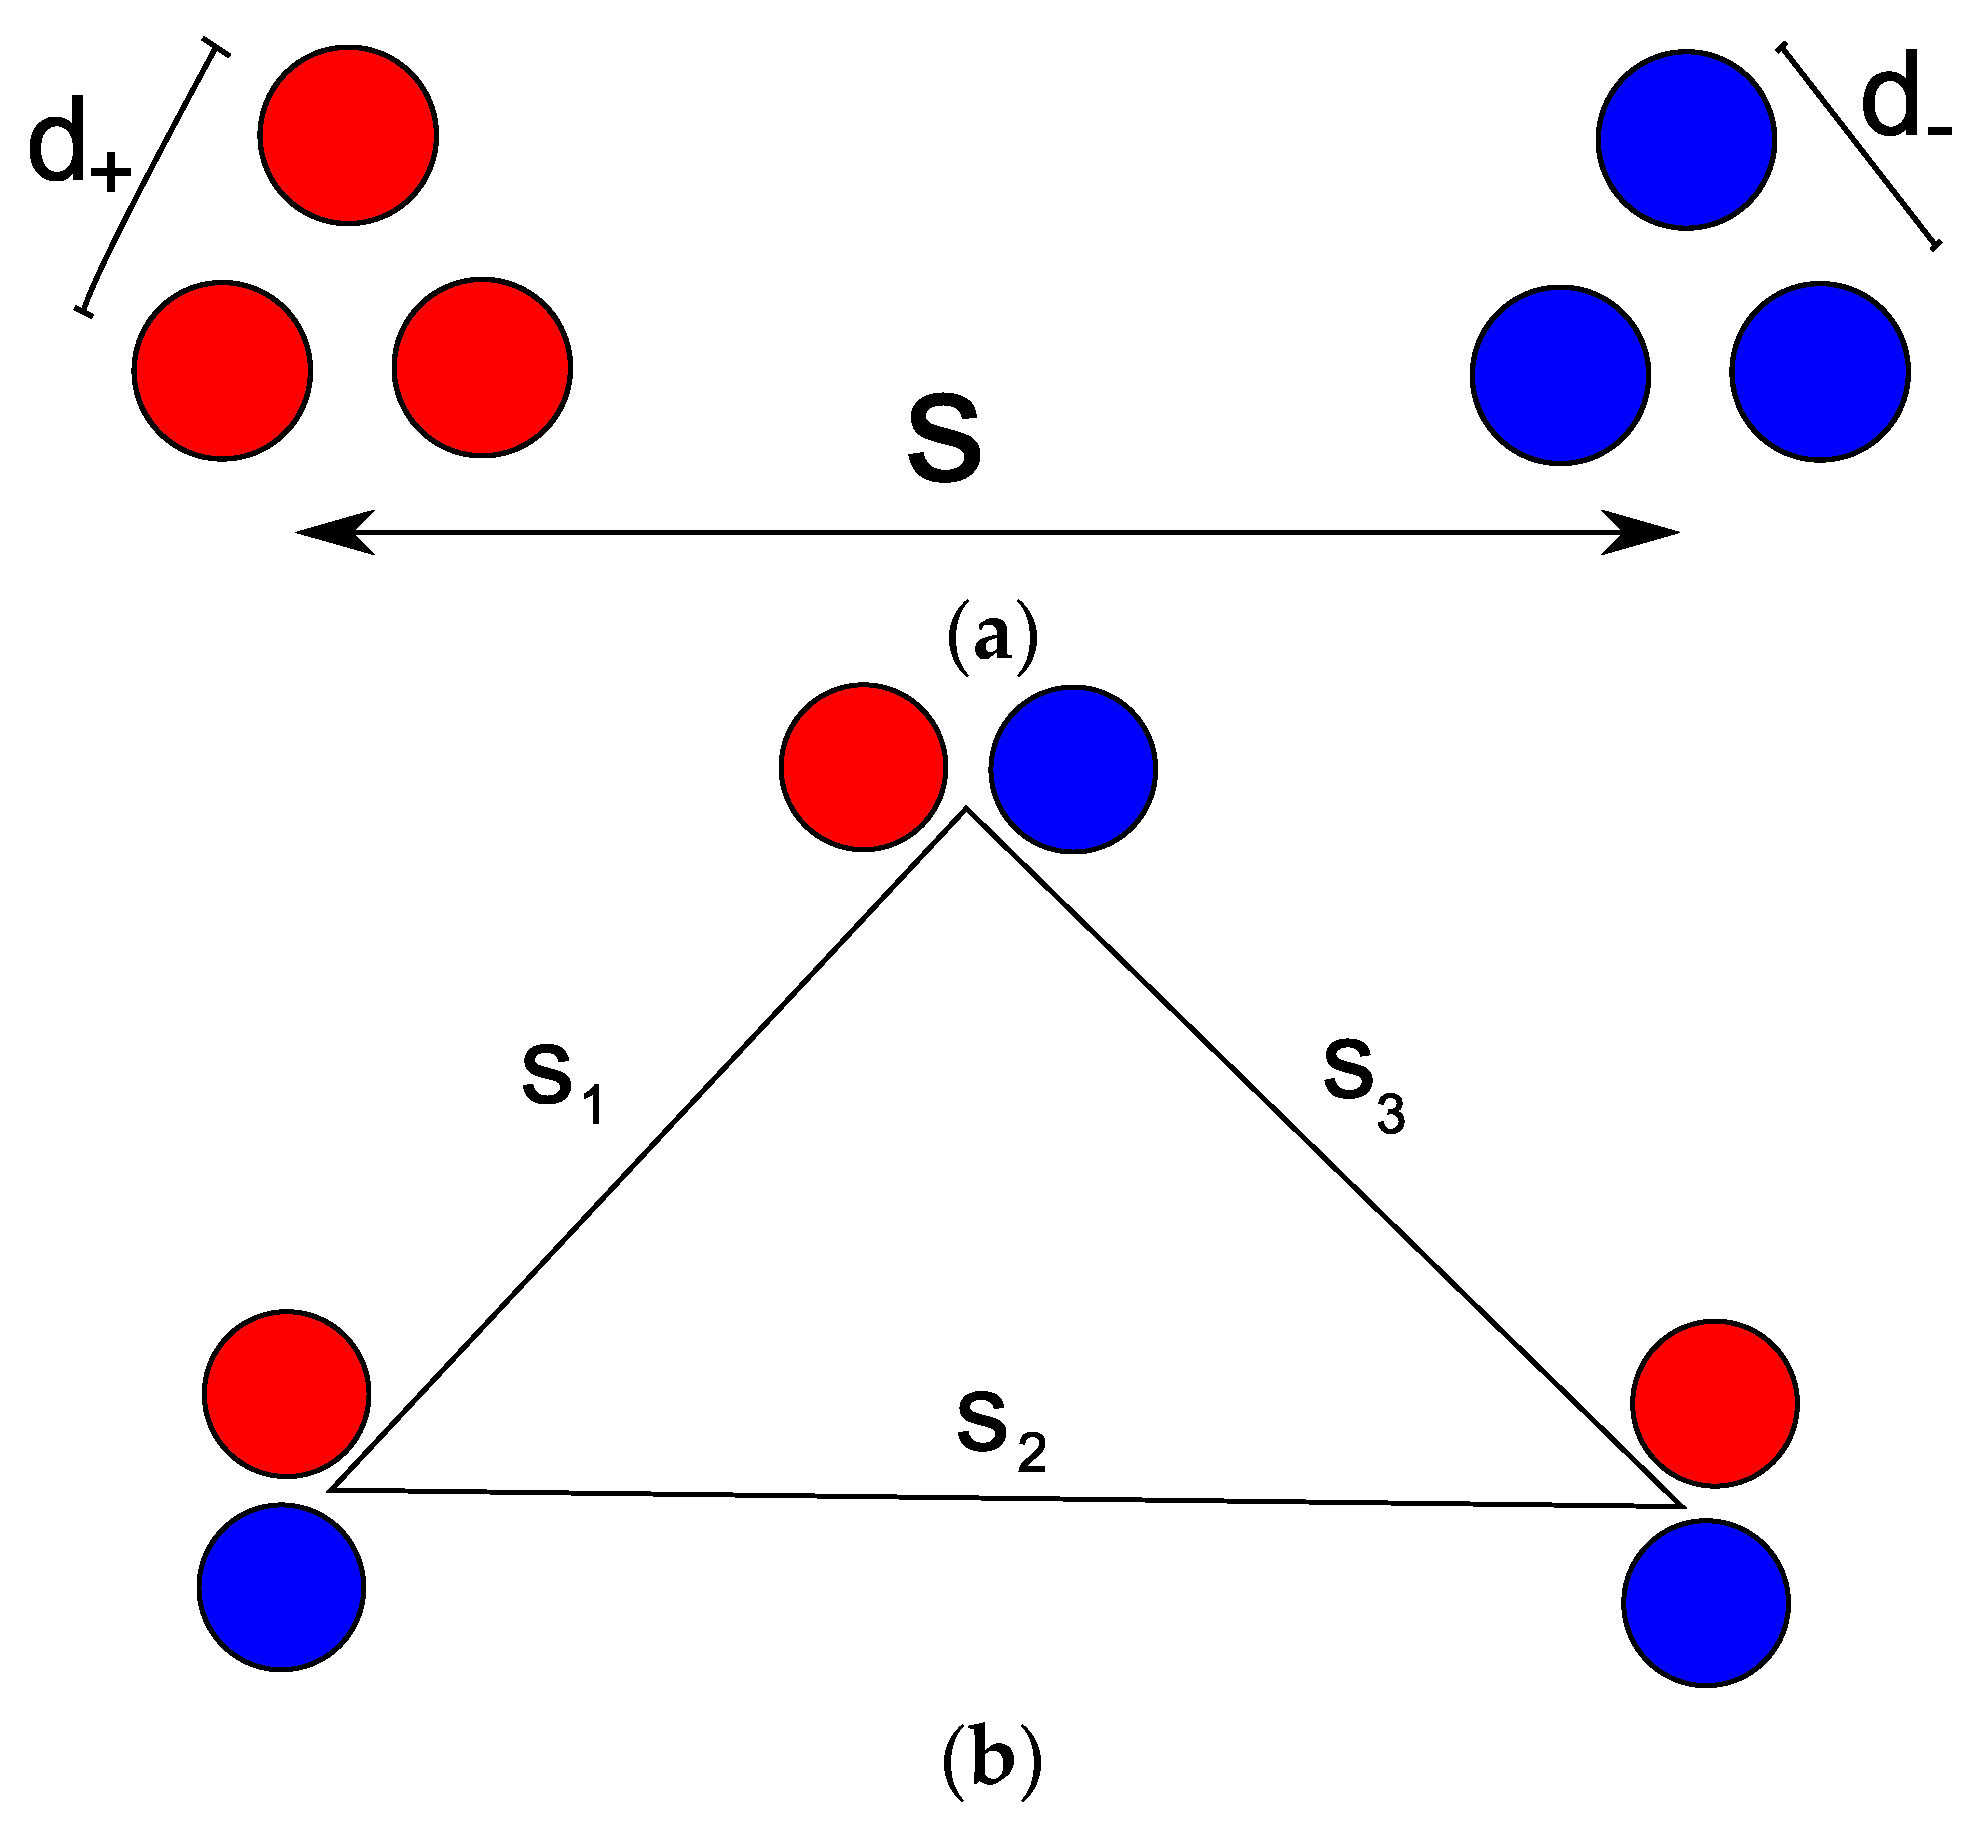
  • separation of cables with complementary polarizations or of groups of cable pairs (Figure 7). Red circle—“hot” (phase) wire, blue circle—return wire.
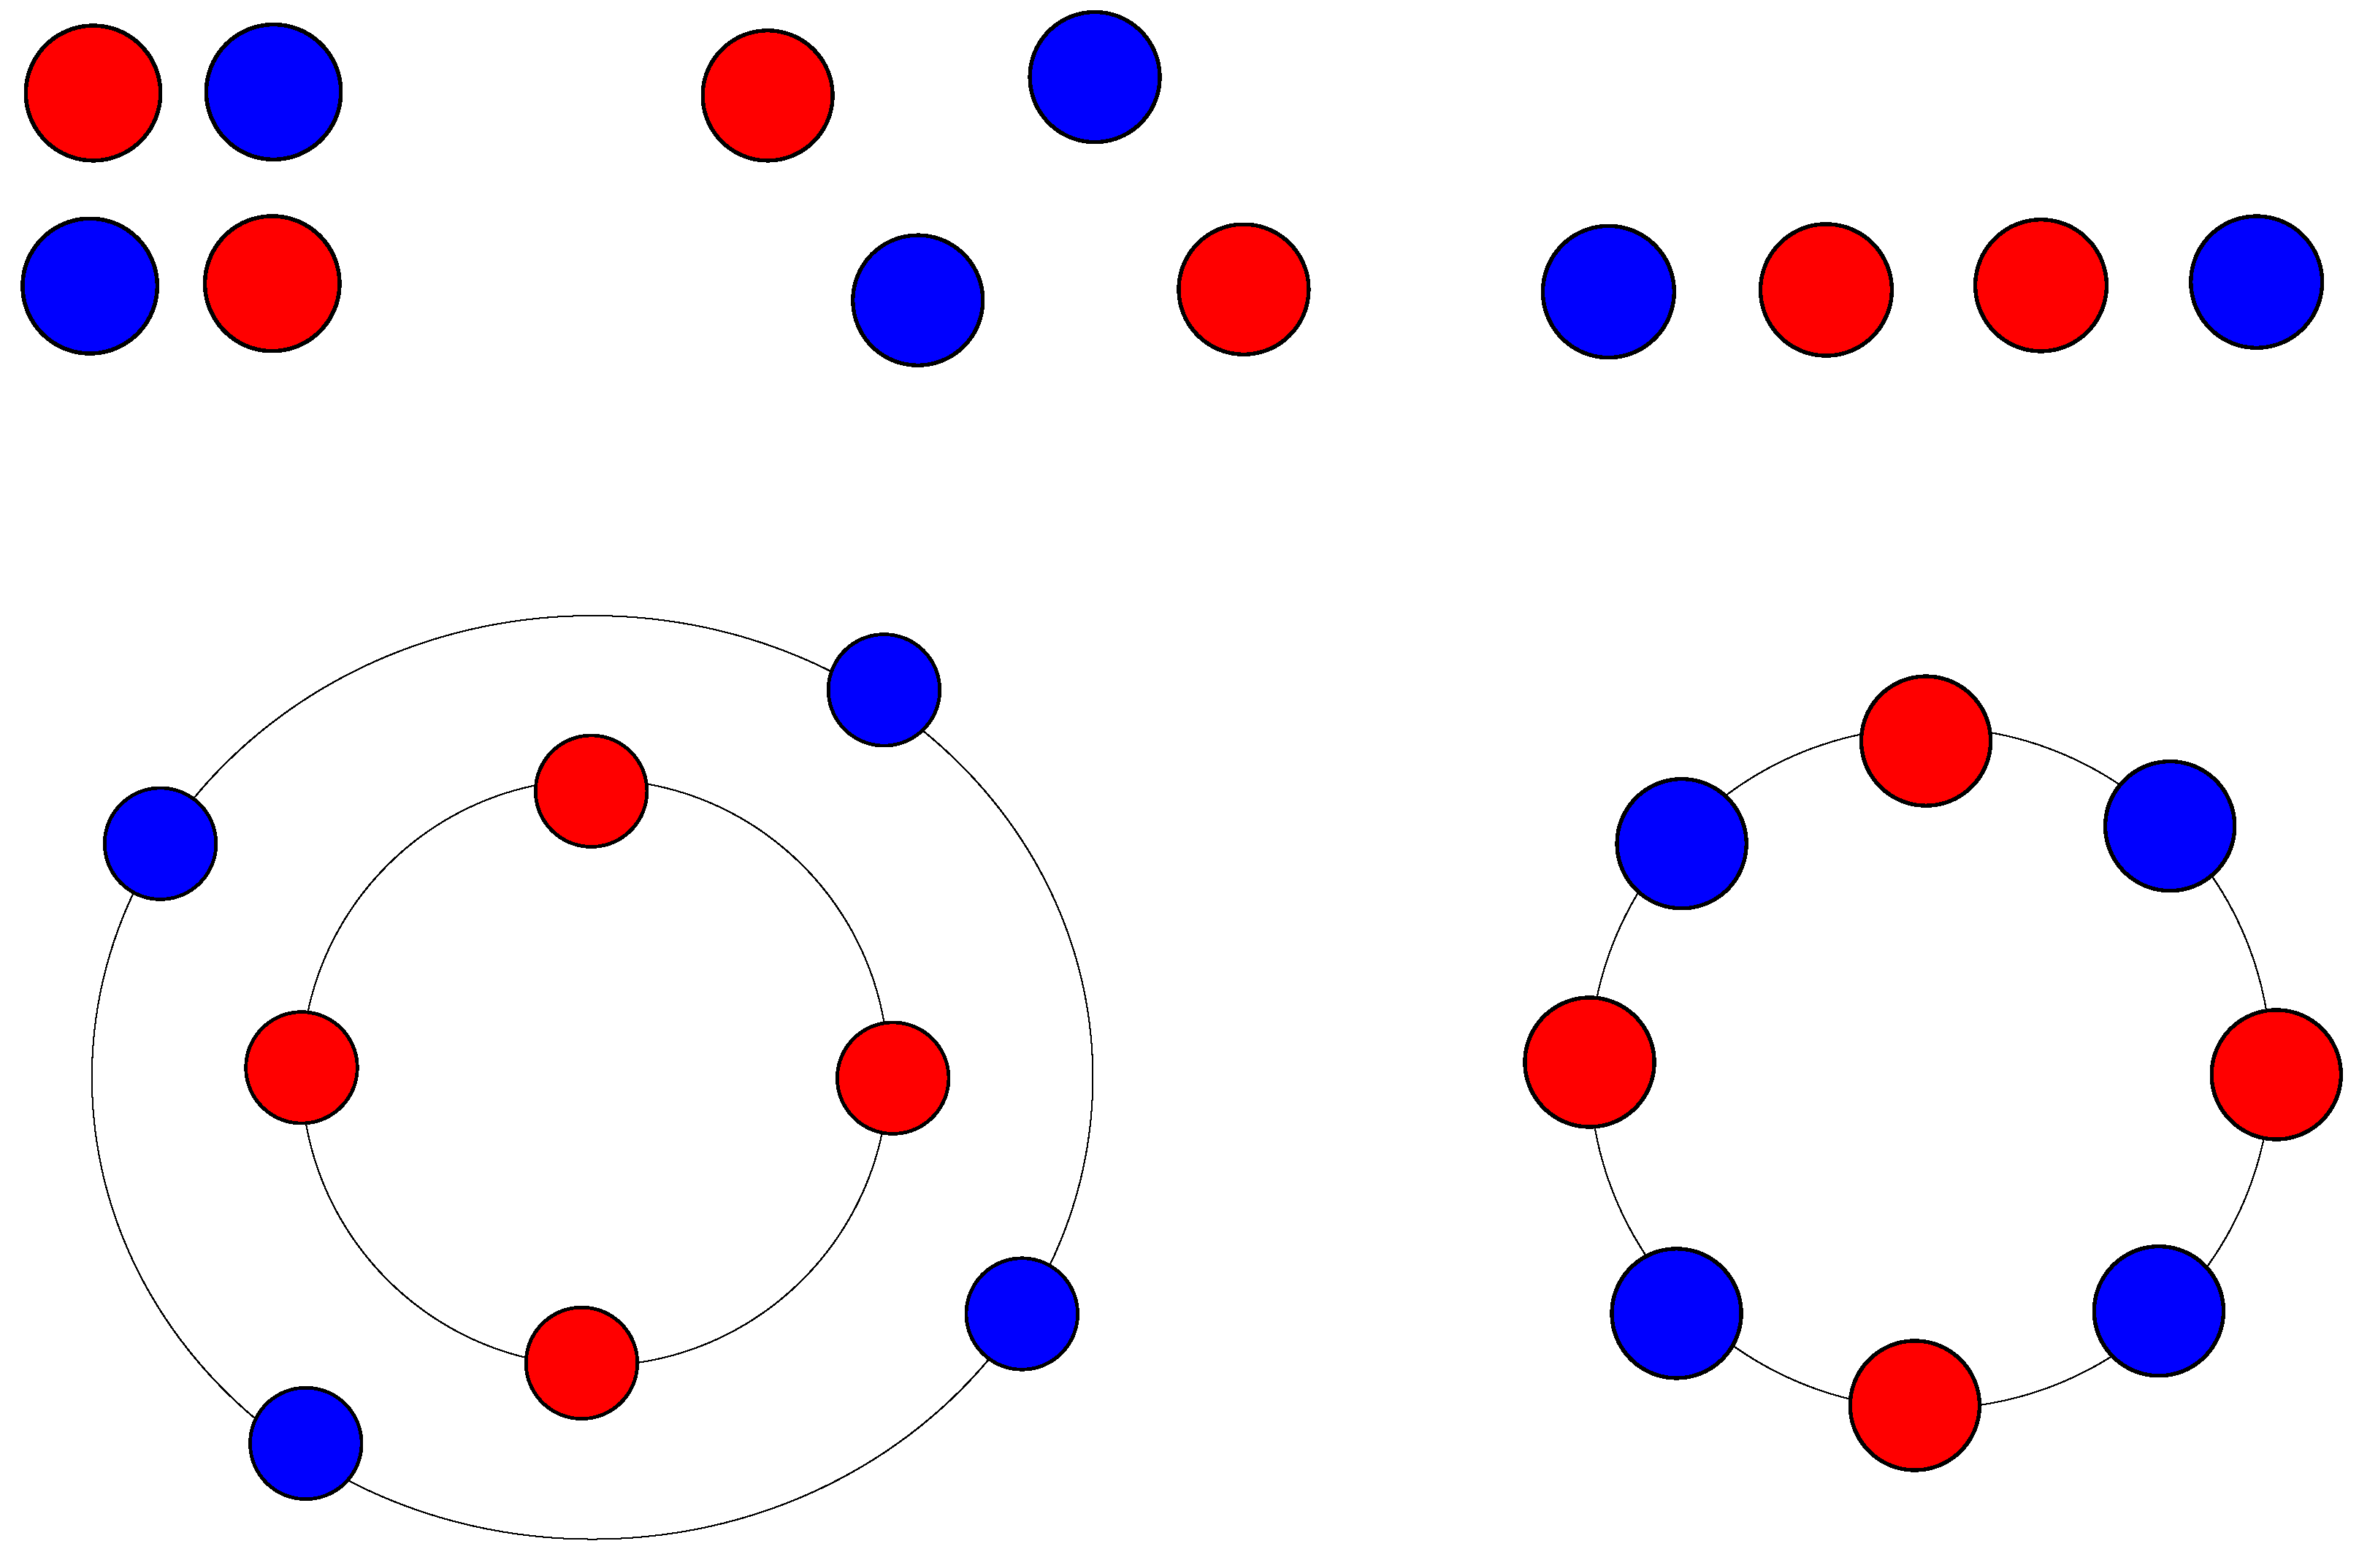
The authors have also pointed out some examples of optimal spatial configurations, providing uniform current sharing. Some examples are listed below in Figure 8:
Let us notice that all above-given configurations exhibit a common feature, namely the barycenters of supply and return wires approximately overlap. It is evident that there exists a certain symmetry of cable placement in each considered case. At the same time, highly asymmetric layouts (referred to as asymmetry of the first (Figure 9) and the second (Figure 10) kind) are not recommended.
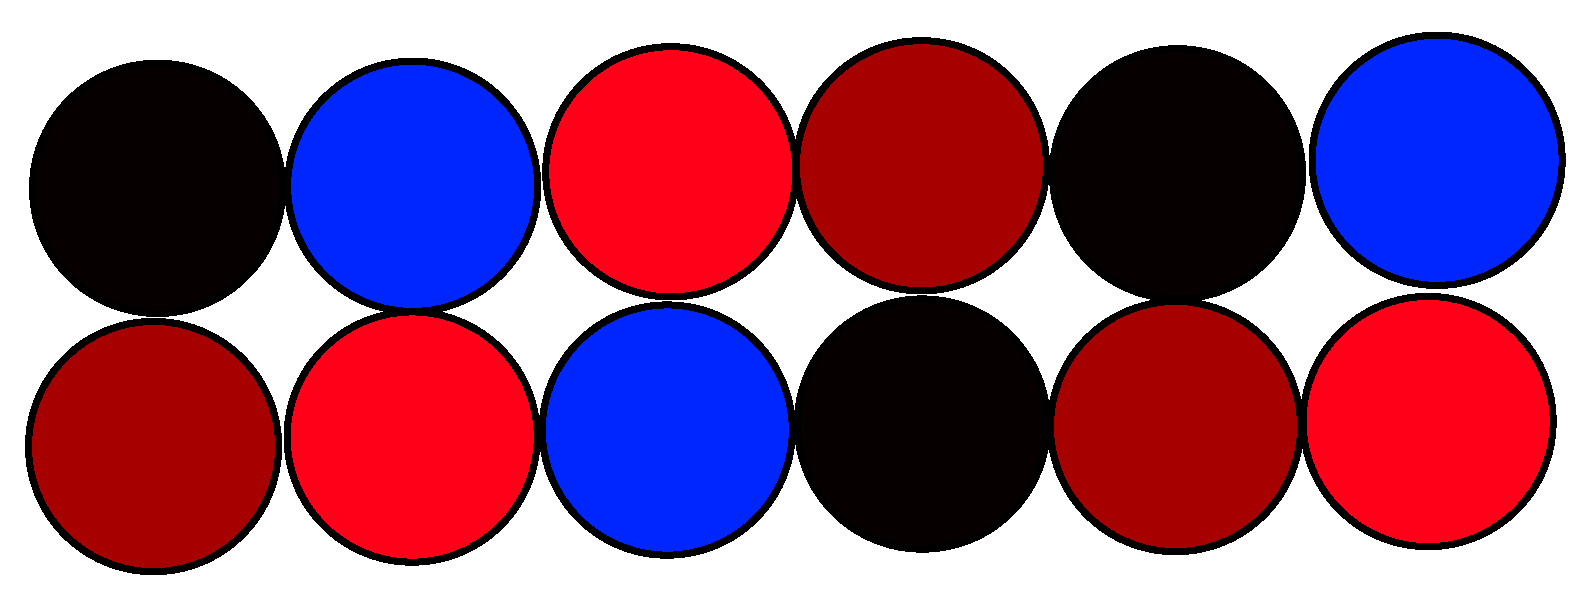
Lee has analyzed optimal configurations for three-phase three- and four-wire systems [18]. An exemplary optimal configuration for the flat layout is listed below in Figure 11. Colors brown, black, and red denote successive phases.
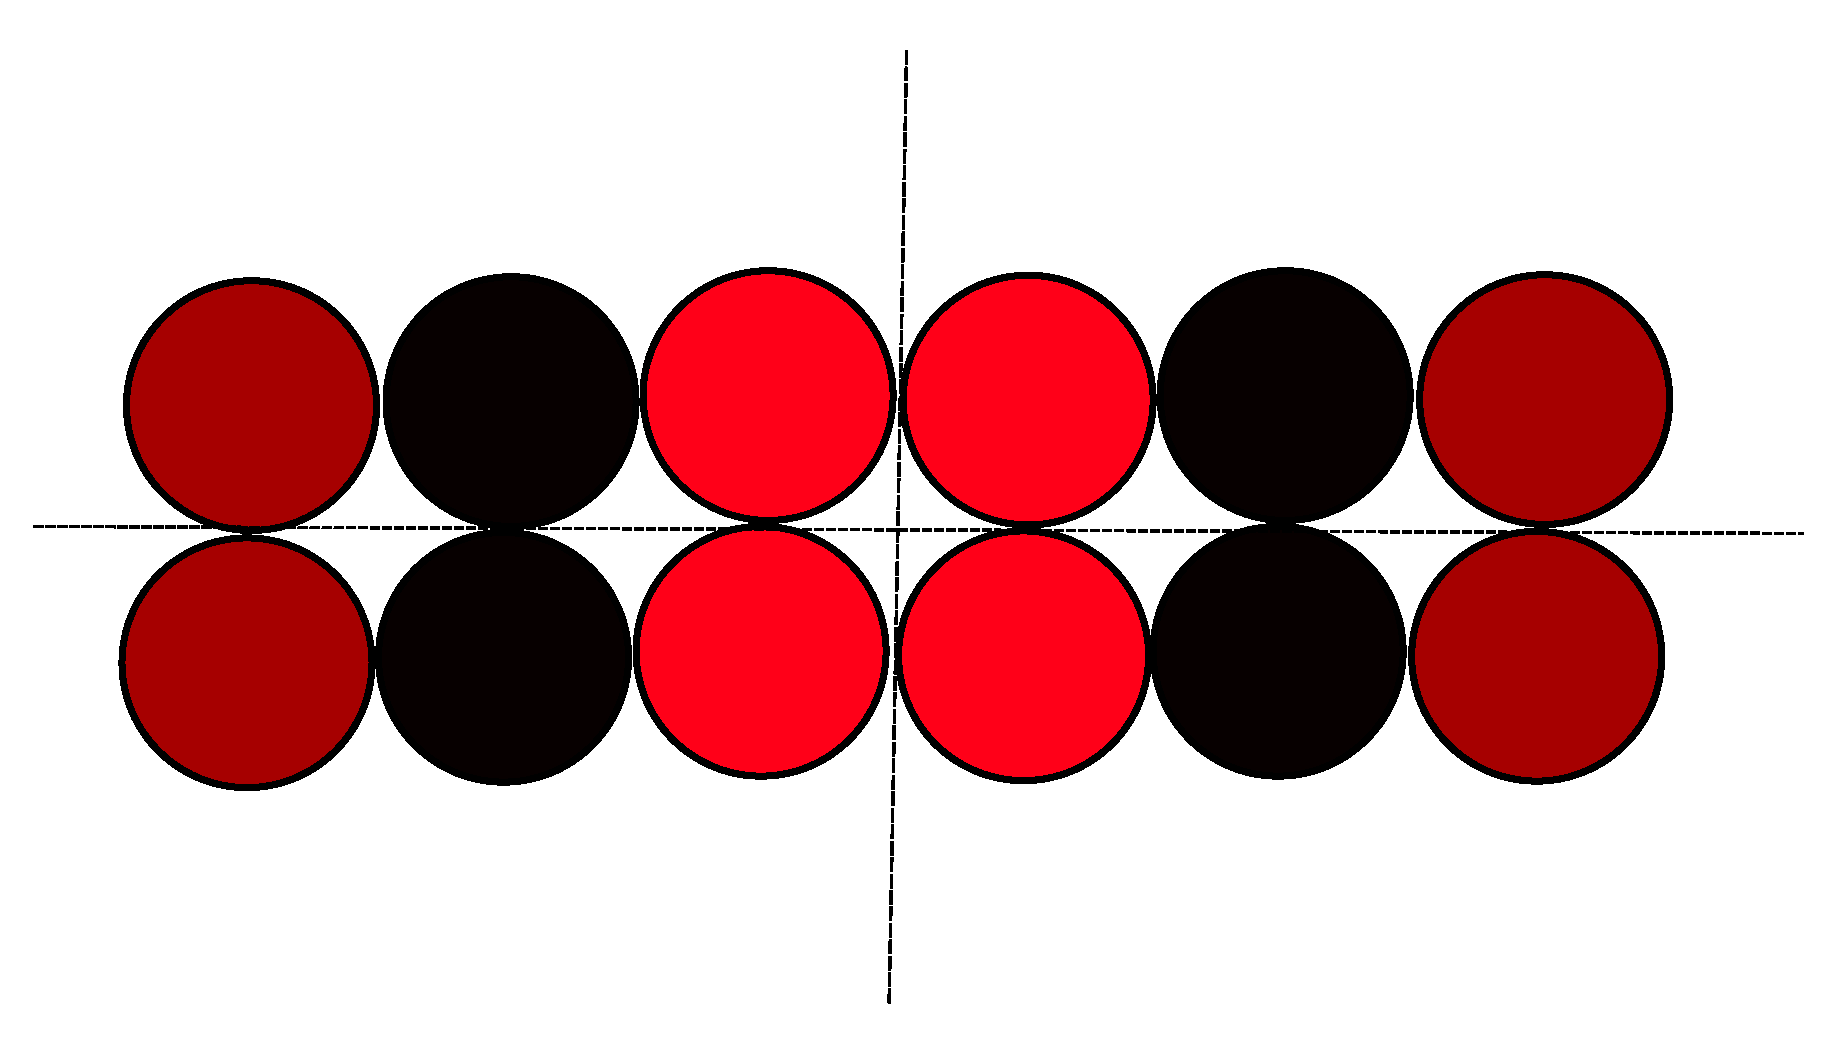
If we assume that the center of the leftmost wire has the coordinate x = 0, the distance between the centers of successive wires is equal to unity, and the phase currents have the same amplitudes, then the gravity center for the phase L1 (A) is found at the point 1 3 ( 0 + 5 + 6 ) 3.67 , for the phase L2 (B) at the point 1 3 ( 1 + 4 + 7 ) = 4 , and for the phase L3 (C) at the point 1 3 ( 2 + 3 + 8 ) 4.33 .   The discrepancy between the barycenter coordinates does not exceed 17%.
For the “two shelves” layout, the optimal spatial configuration is suggested as in Figure 12.
If, similar to the previous case, we assume that the distance between the cable centers is equal to unity and we set the coordinate of the center of the leftmost cable on the lower shelf as (0,0), then it is trivial to compute (e.g., the coordinates of the center of the leftmost cable on the upper shelf as ( 3 / 2 , 1)). The barycenter of the phase L1 is located approximately in the point (1.956, 0.333), for the phase L2 in the point (2.244, 0.667), for the phase L3 in the point (2.577, 0.333). The whole area of interest is the area of the rectangle with dimensions 5 × 2. The area of the triangle determined by the barycenters of individual phases may be computed using the well-known dependence given by Equation (1). In the considered case, S = 0.0503, which may be referred to as the area of the rectangle ( 5 · 2 = 10 ) , means the triangle area is only 0.5%. Let us notice the vertical symmetry axis passing through the center of the black wire on the lower shelf. The horizontal symmetry could not be fulfilled because of the odd number of considered wires.
Another recommended layout for the nine-cable setup is shown below in Figure 13.
The coordinates of the barycenter for the phase L1 (A) are x A = 1 3 ( 0 + 2 + 3 ) 1.667 ,   y A = 1 3 ( 0 + 1 + 0 ) 0.333 , for the phase L2 (B) x B = 1 3 ( 0 + 2 + 3 ) 1.667 , y B = 1 3 ( 1 + 0 + 1 ) 0.667 , and for the phase L3 (C) x C = 1 3 ( 1 + 1 + 4 ) = 2 , y C = 1 3 ( 0 + 1 + 0 ) 0.333 . The area determined by the barycenters of individual phases is slightly higher than in the previous case, S = 0.0556, however, it remains at an acceptable level. It should be remarked that this configuration is slightly worse than the previous one, which can be confirmed with the results obtained by Lee himself (cf. the values of indicators δ T and δ M listed in Table 2 and Table 3 in the paper [12]).
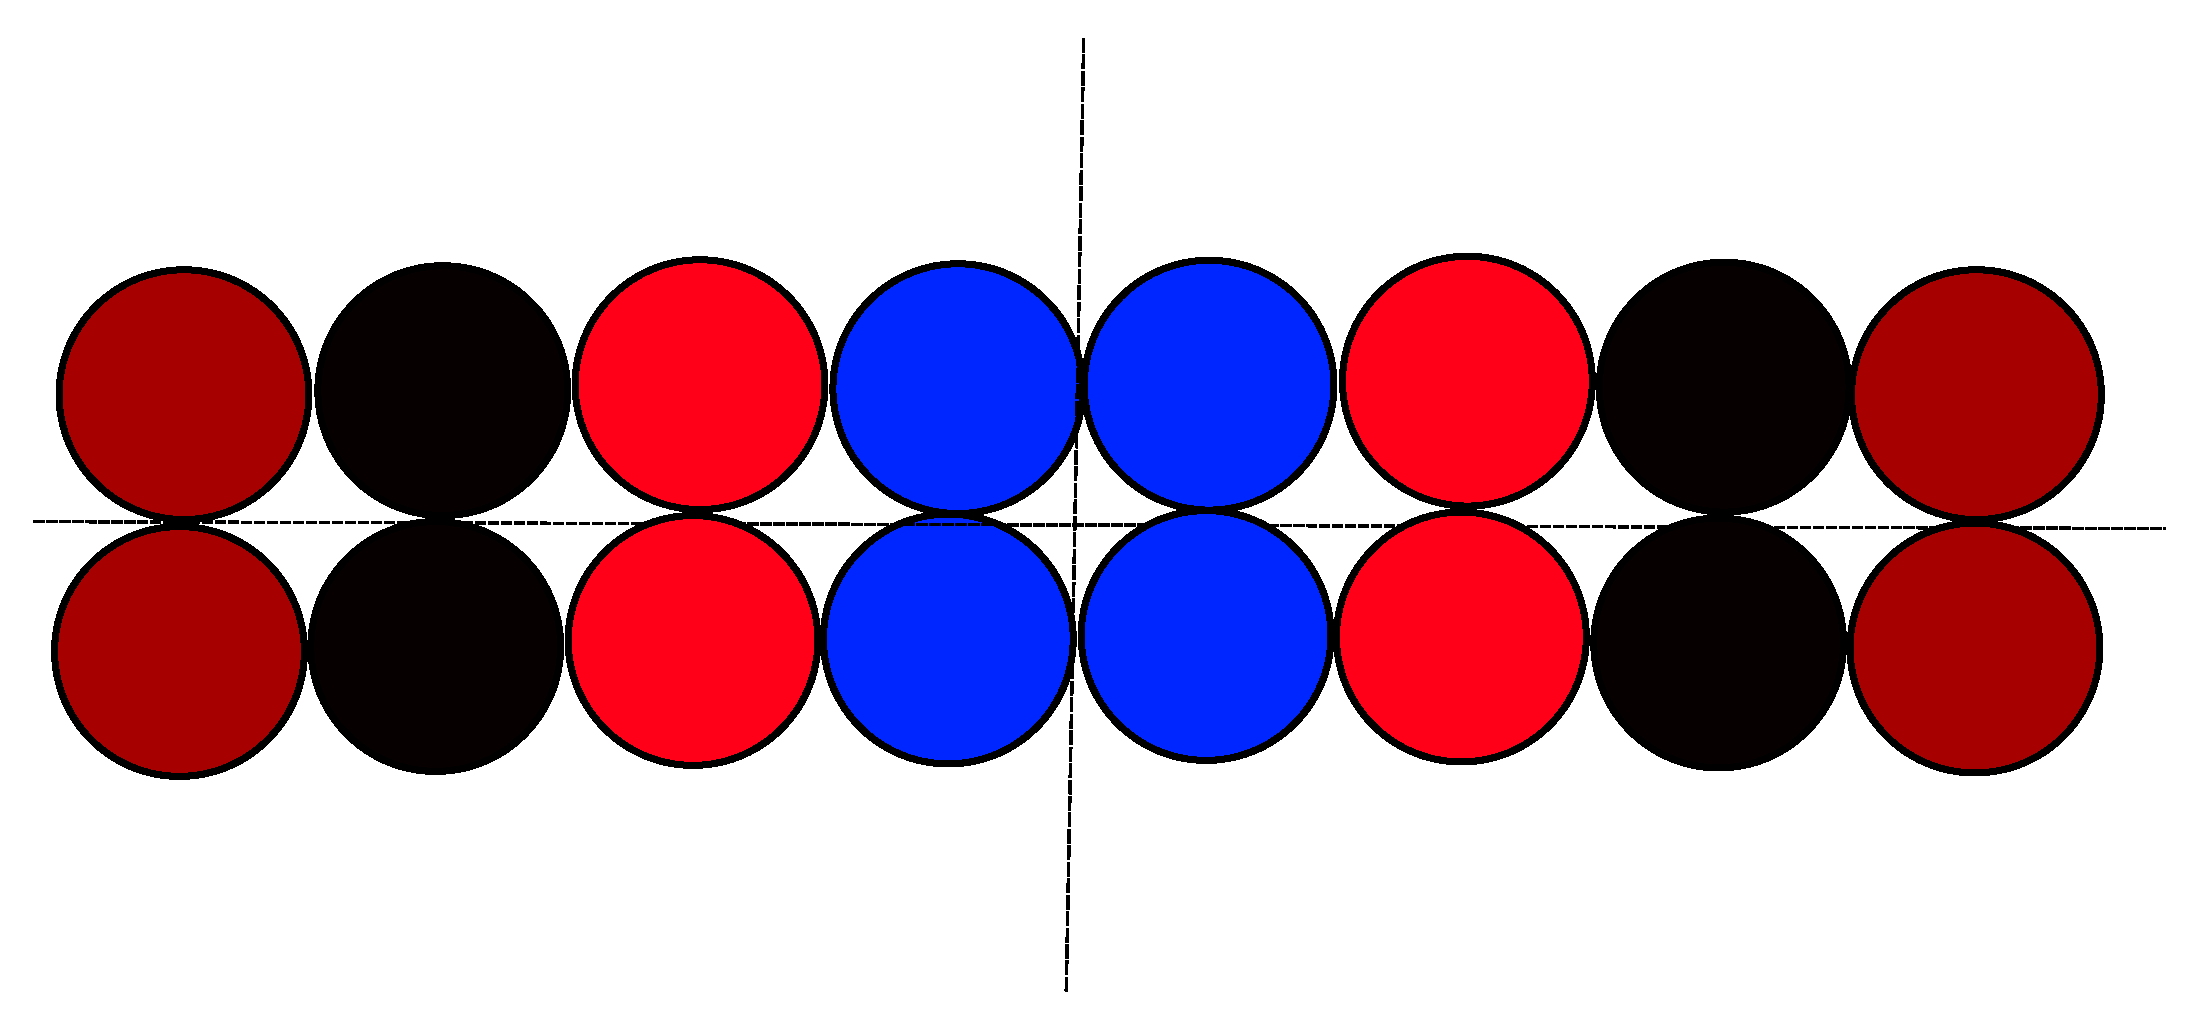
In the case of three-phase systems with neutral wire, the recommended layouts are depicted below in Figure 14, Figure 15, Figure 16, Figure 17 and Figure 18:
-
Three strands per phase
(a) The flat system
x A = 1 3 ( 0 + 7 + 8 ) = 5 ,   x B = 1 3 ( 1 + 6 + 9 ) 5.333 ,   x C = 1 3 ( 2 + 5 + 10 ) 5.667 .
x N = 1 3 ( 3 + 4 + 11 ) = 6 .
The maximal discrepancy between the gravity centers for individual phases is equal to 0.667, which, referring to the shelf width (11), is only 6.06%. The gravity center for the neutral wire may be a little distant from the other ones, because under operating conditions (under standard assumptions concerning symmetries of supply and load), the current flowing through the neutral strands takes negligible values with respect to the phase currents.
(b) the layout “two shelves with offset”
x A = 1 3 ( 0 + 4 + 3 + 3 / 2 ) 2.622 ,   y A 0.333 ,   x B = 1 3 ( 3 / 2 + 3 + 4 + 3 / 2 ) 2.911 ,
y A 0 , 667 , x C = 1 3 ( 1 + 5 + 3 / 2 + 2 ) 2.955 ,   y C 0.333 ,
x N = 1 3 ( 3 / 2 + 1 + 2 + 3 / 2 + 5 ) 3.244 ,   y N 0.667 .
The area determined by the barycenters for individual phases is equal to 0.0073, which, referring to the area of the region with dimensions 5   + 3 / 2 × 1, is only 0.12%.
(c) the layout “two shelves without offset”
x A 2.333 ,   y A 0.333 ,   x B 2.333 ,   y B 0.667 ,   x C 2.667 ,   y A 0.333 ,
x N 2.667 ,   y N 0.667
The area determined by the gravity centers for individual phases is equal to 0.0558, which means 1.12% of the whole area for admissible solutions.
-
Fours strands per phase
The layout symmetry is evident. For the odd number of strands, it was impossible to achieve an optimal placement for two shelves, but in this case, it is feasible. The presented layouts provide a full load symmetry for the strand wires.
-
Recommendations concerning spatial layouts in the North American and the Canadian standards
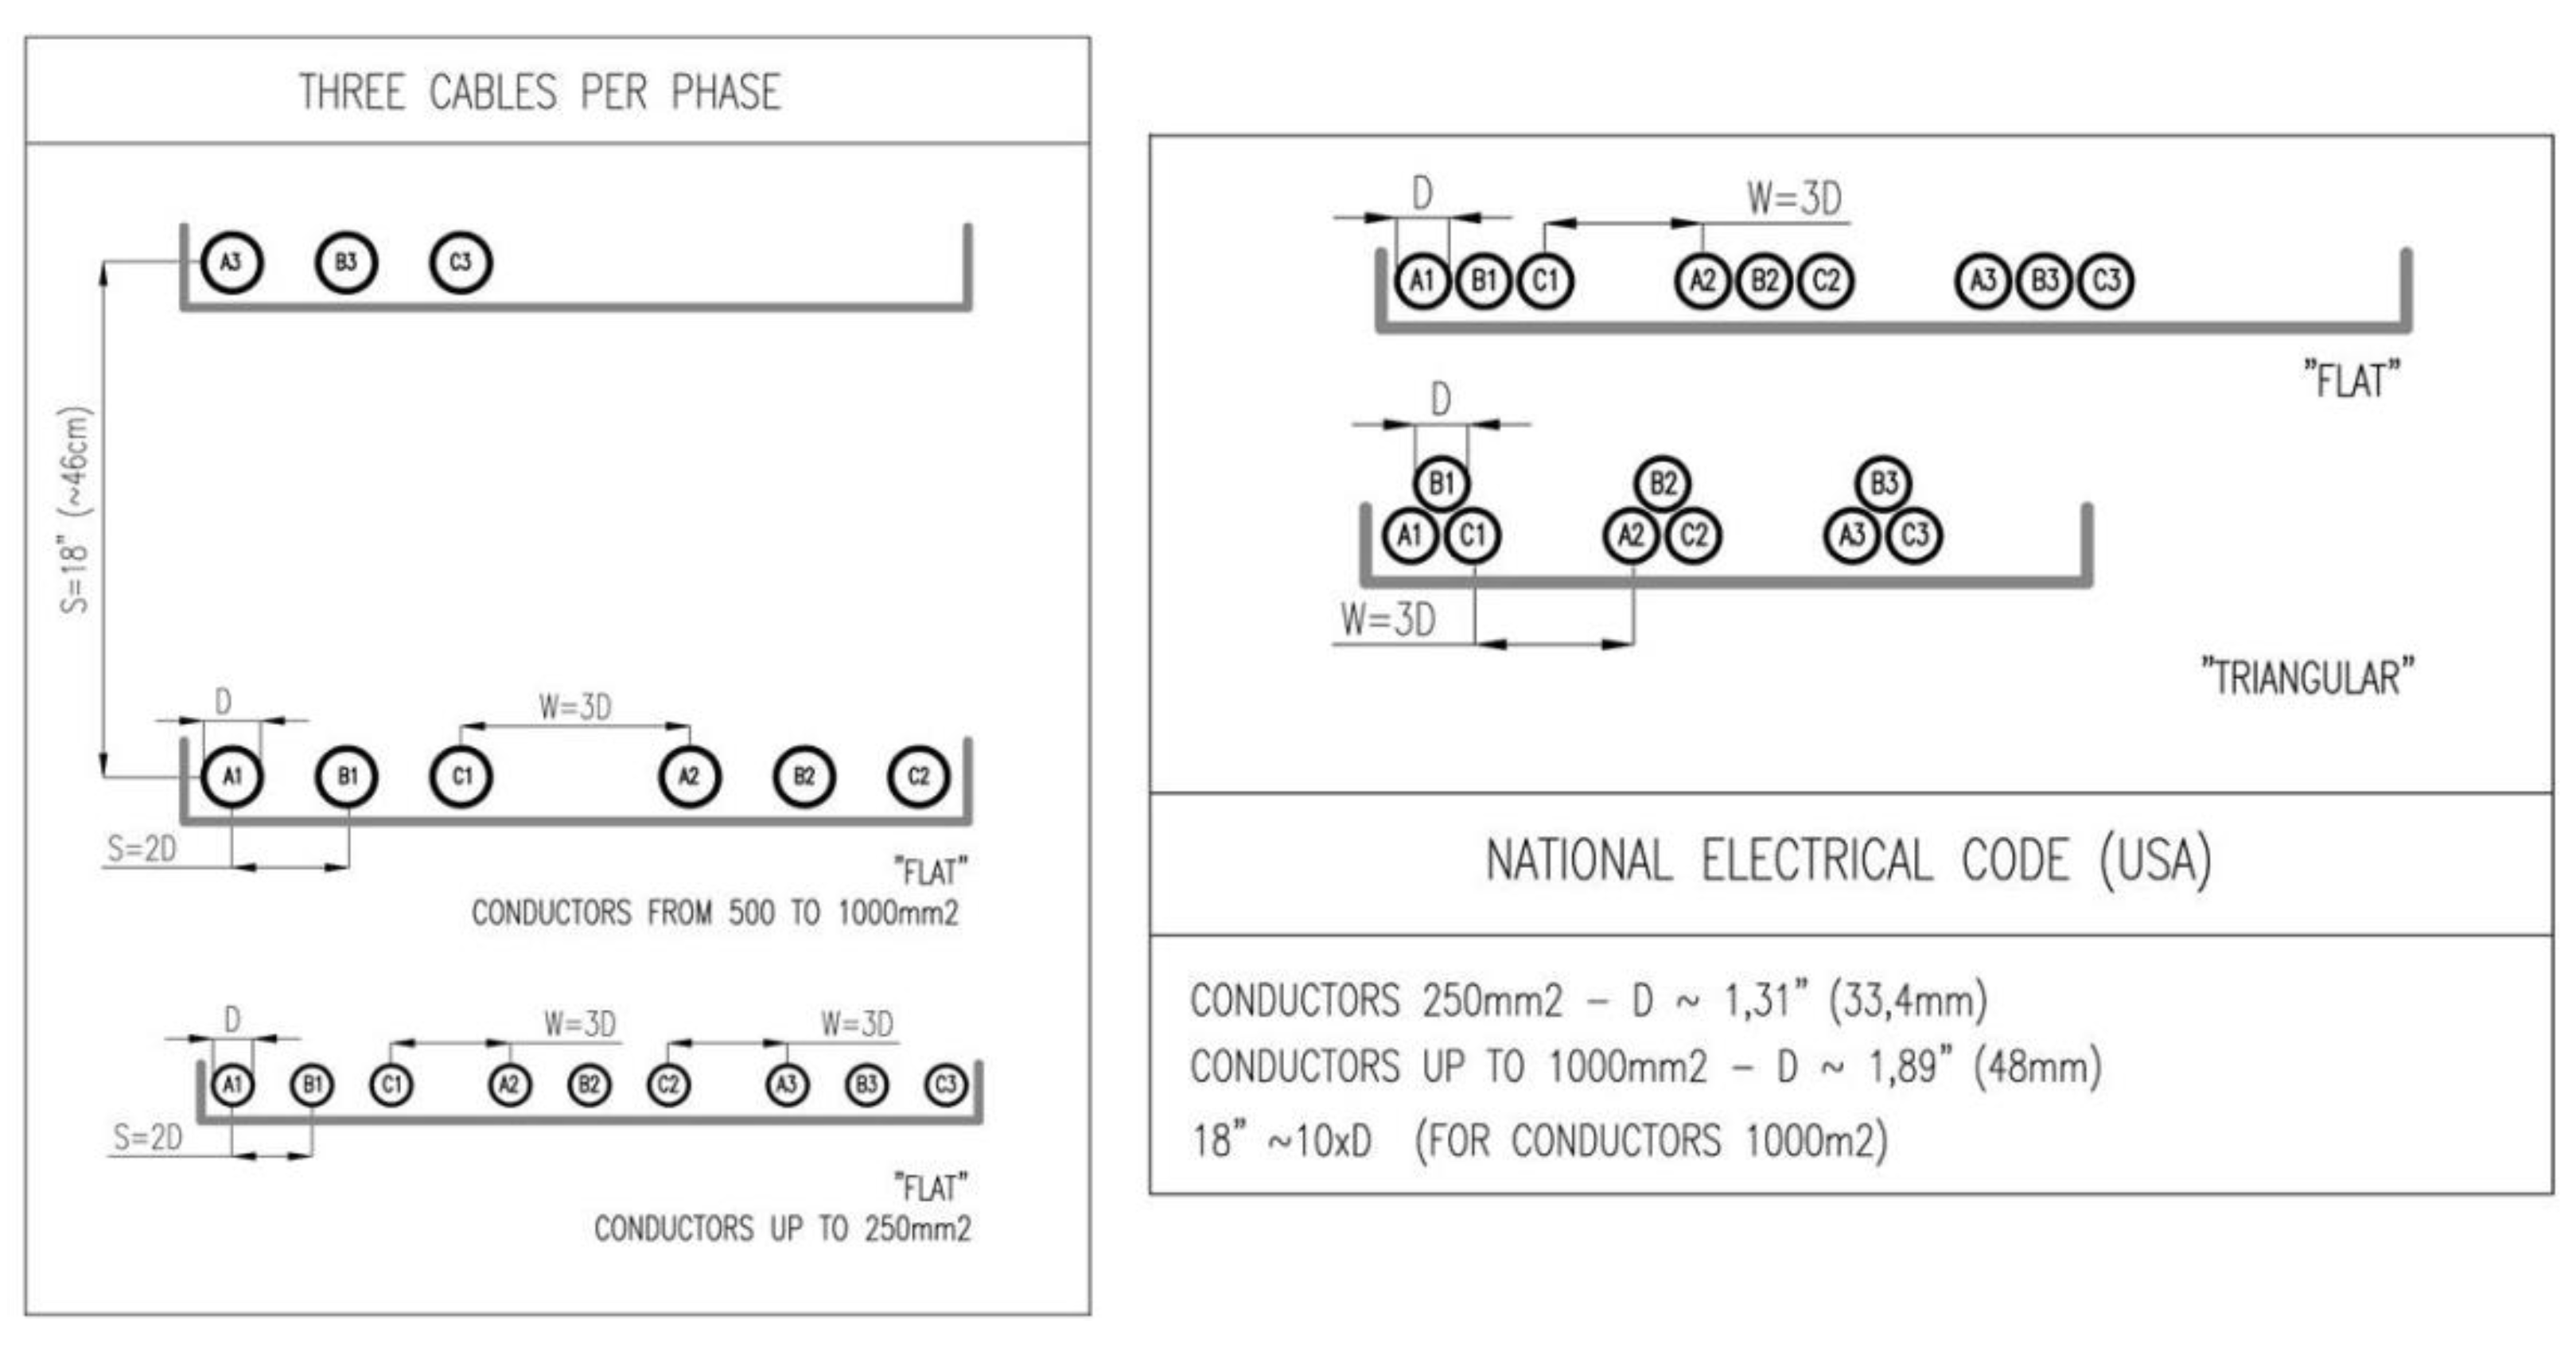
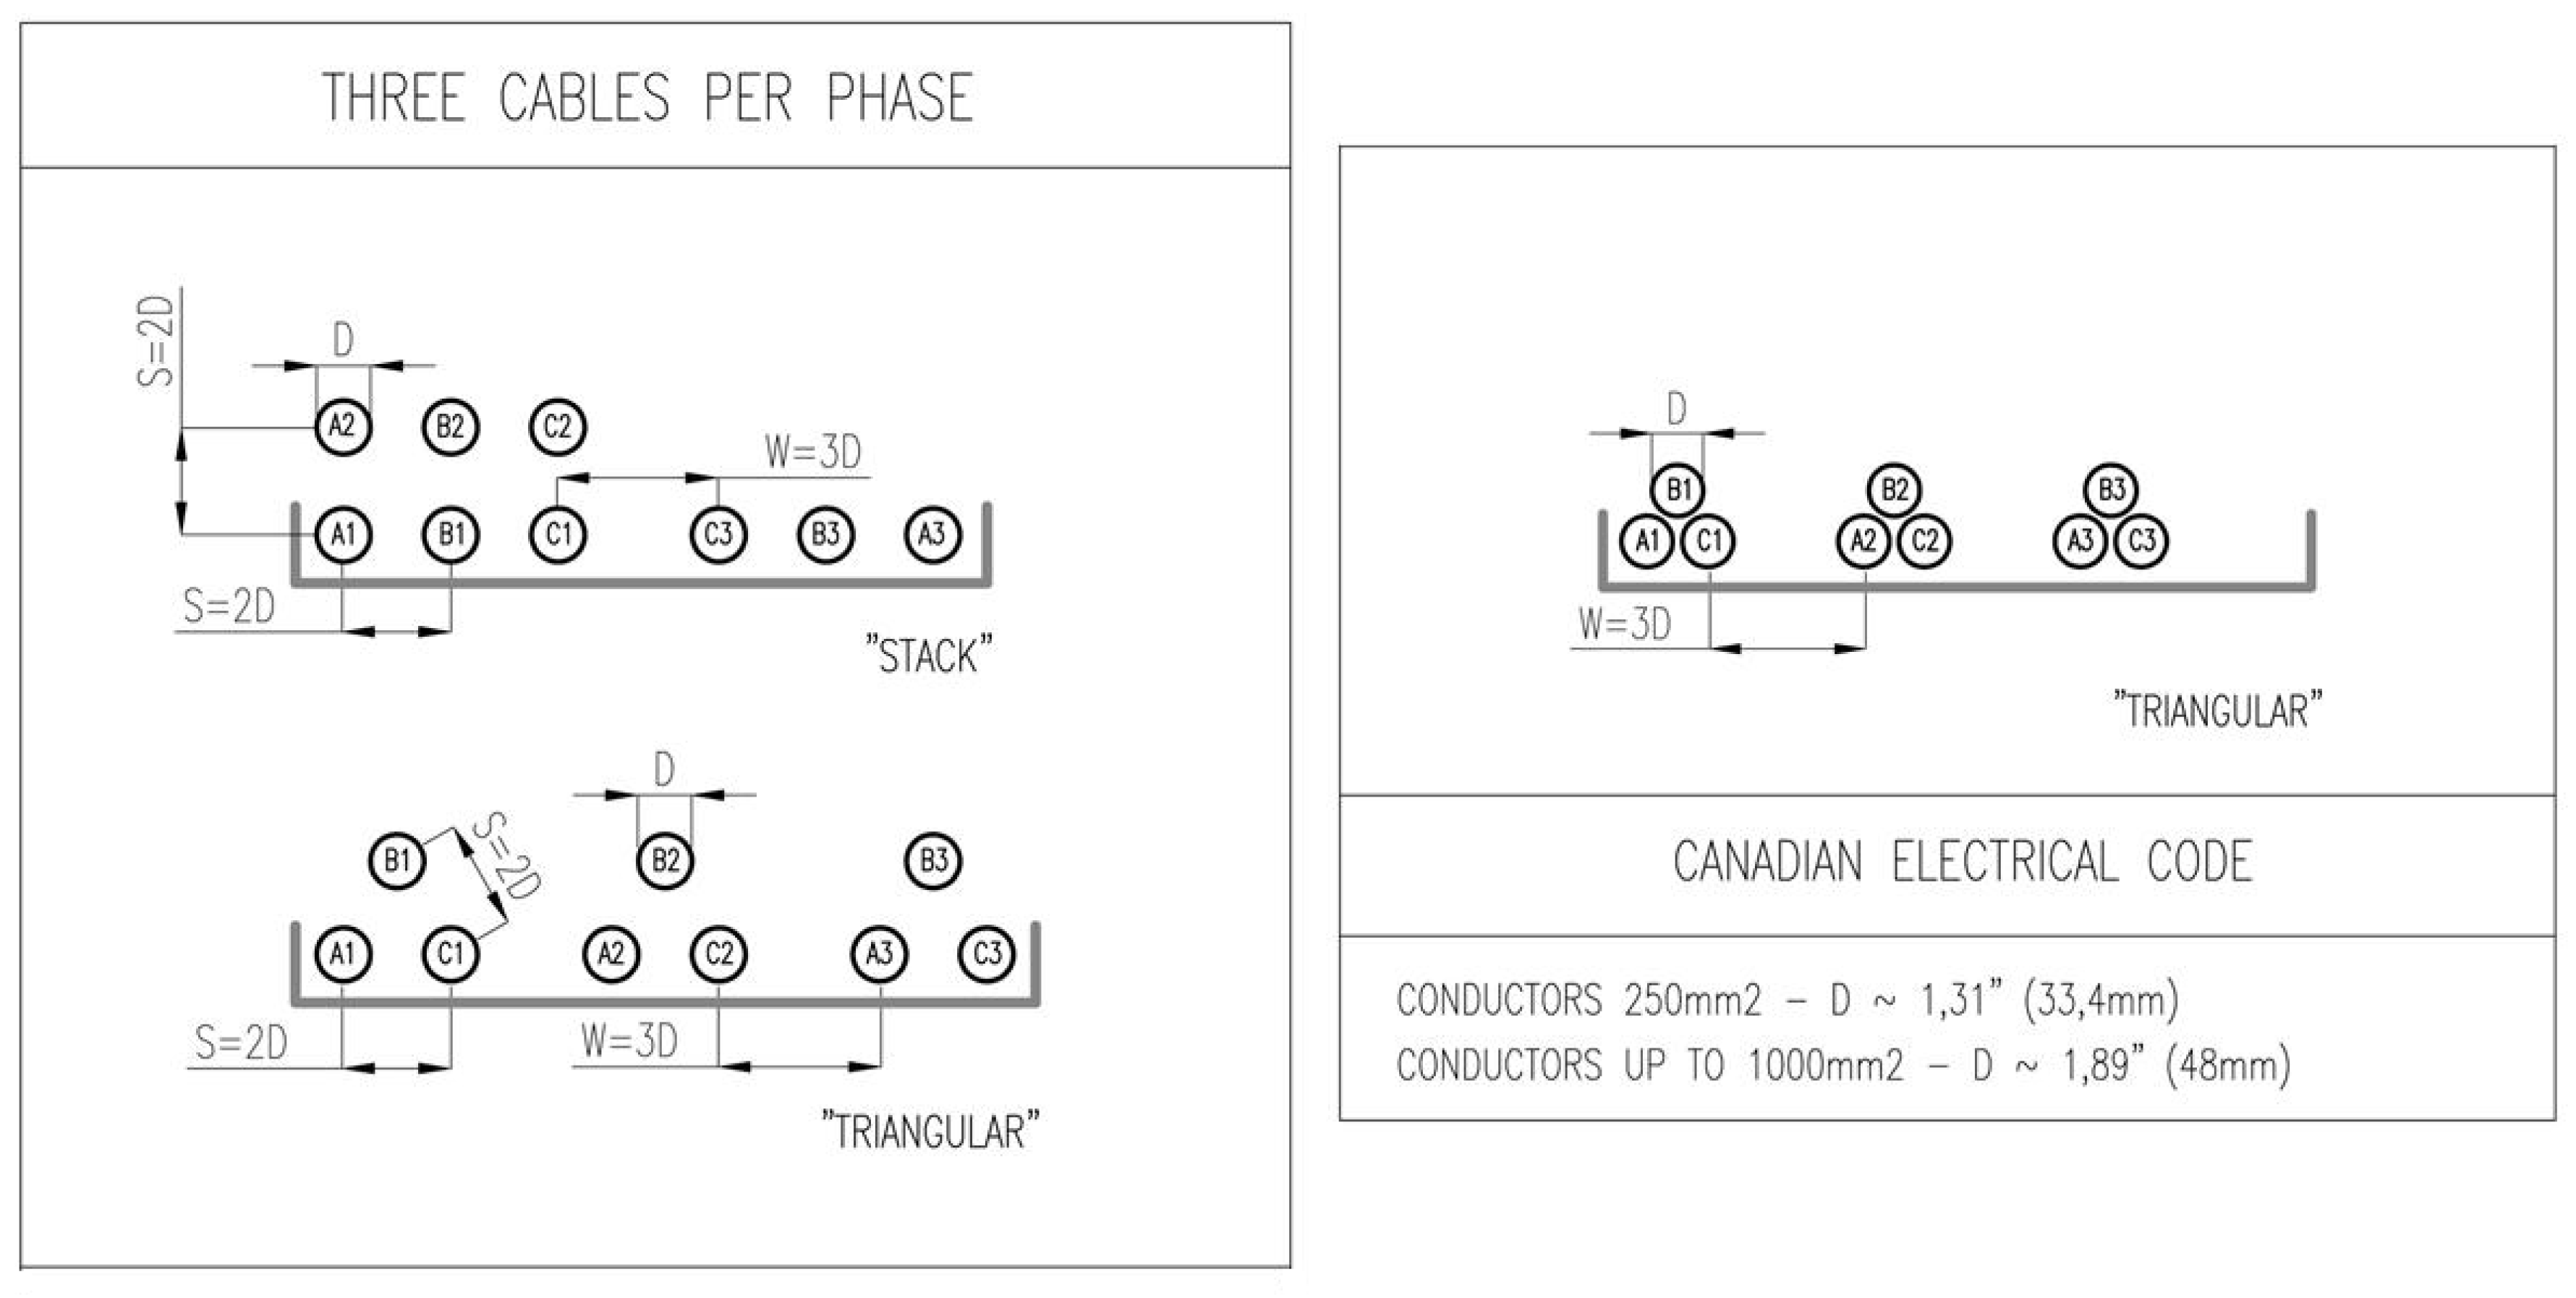
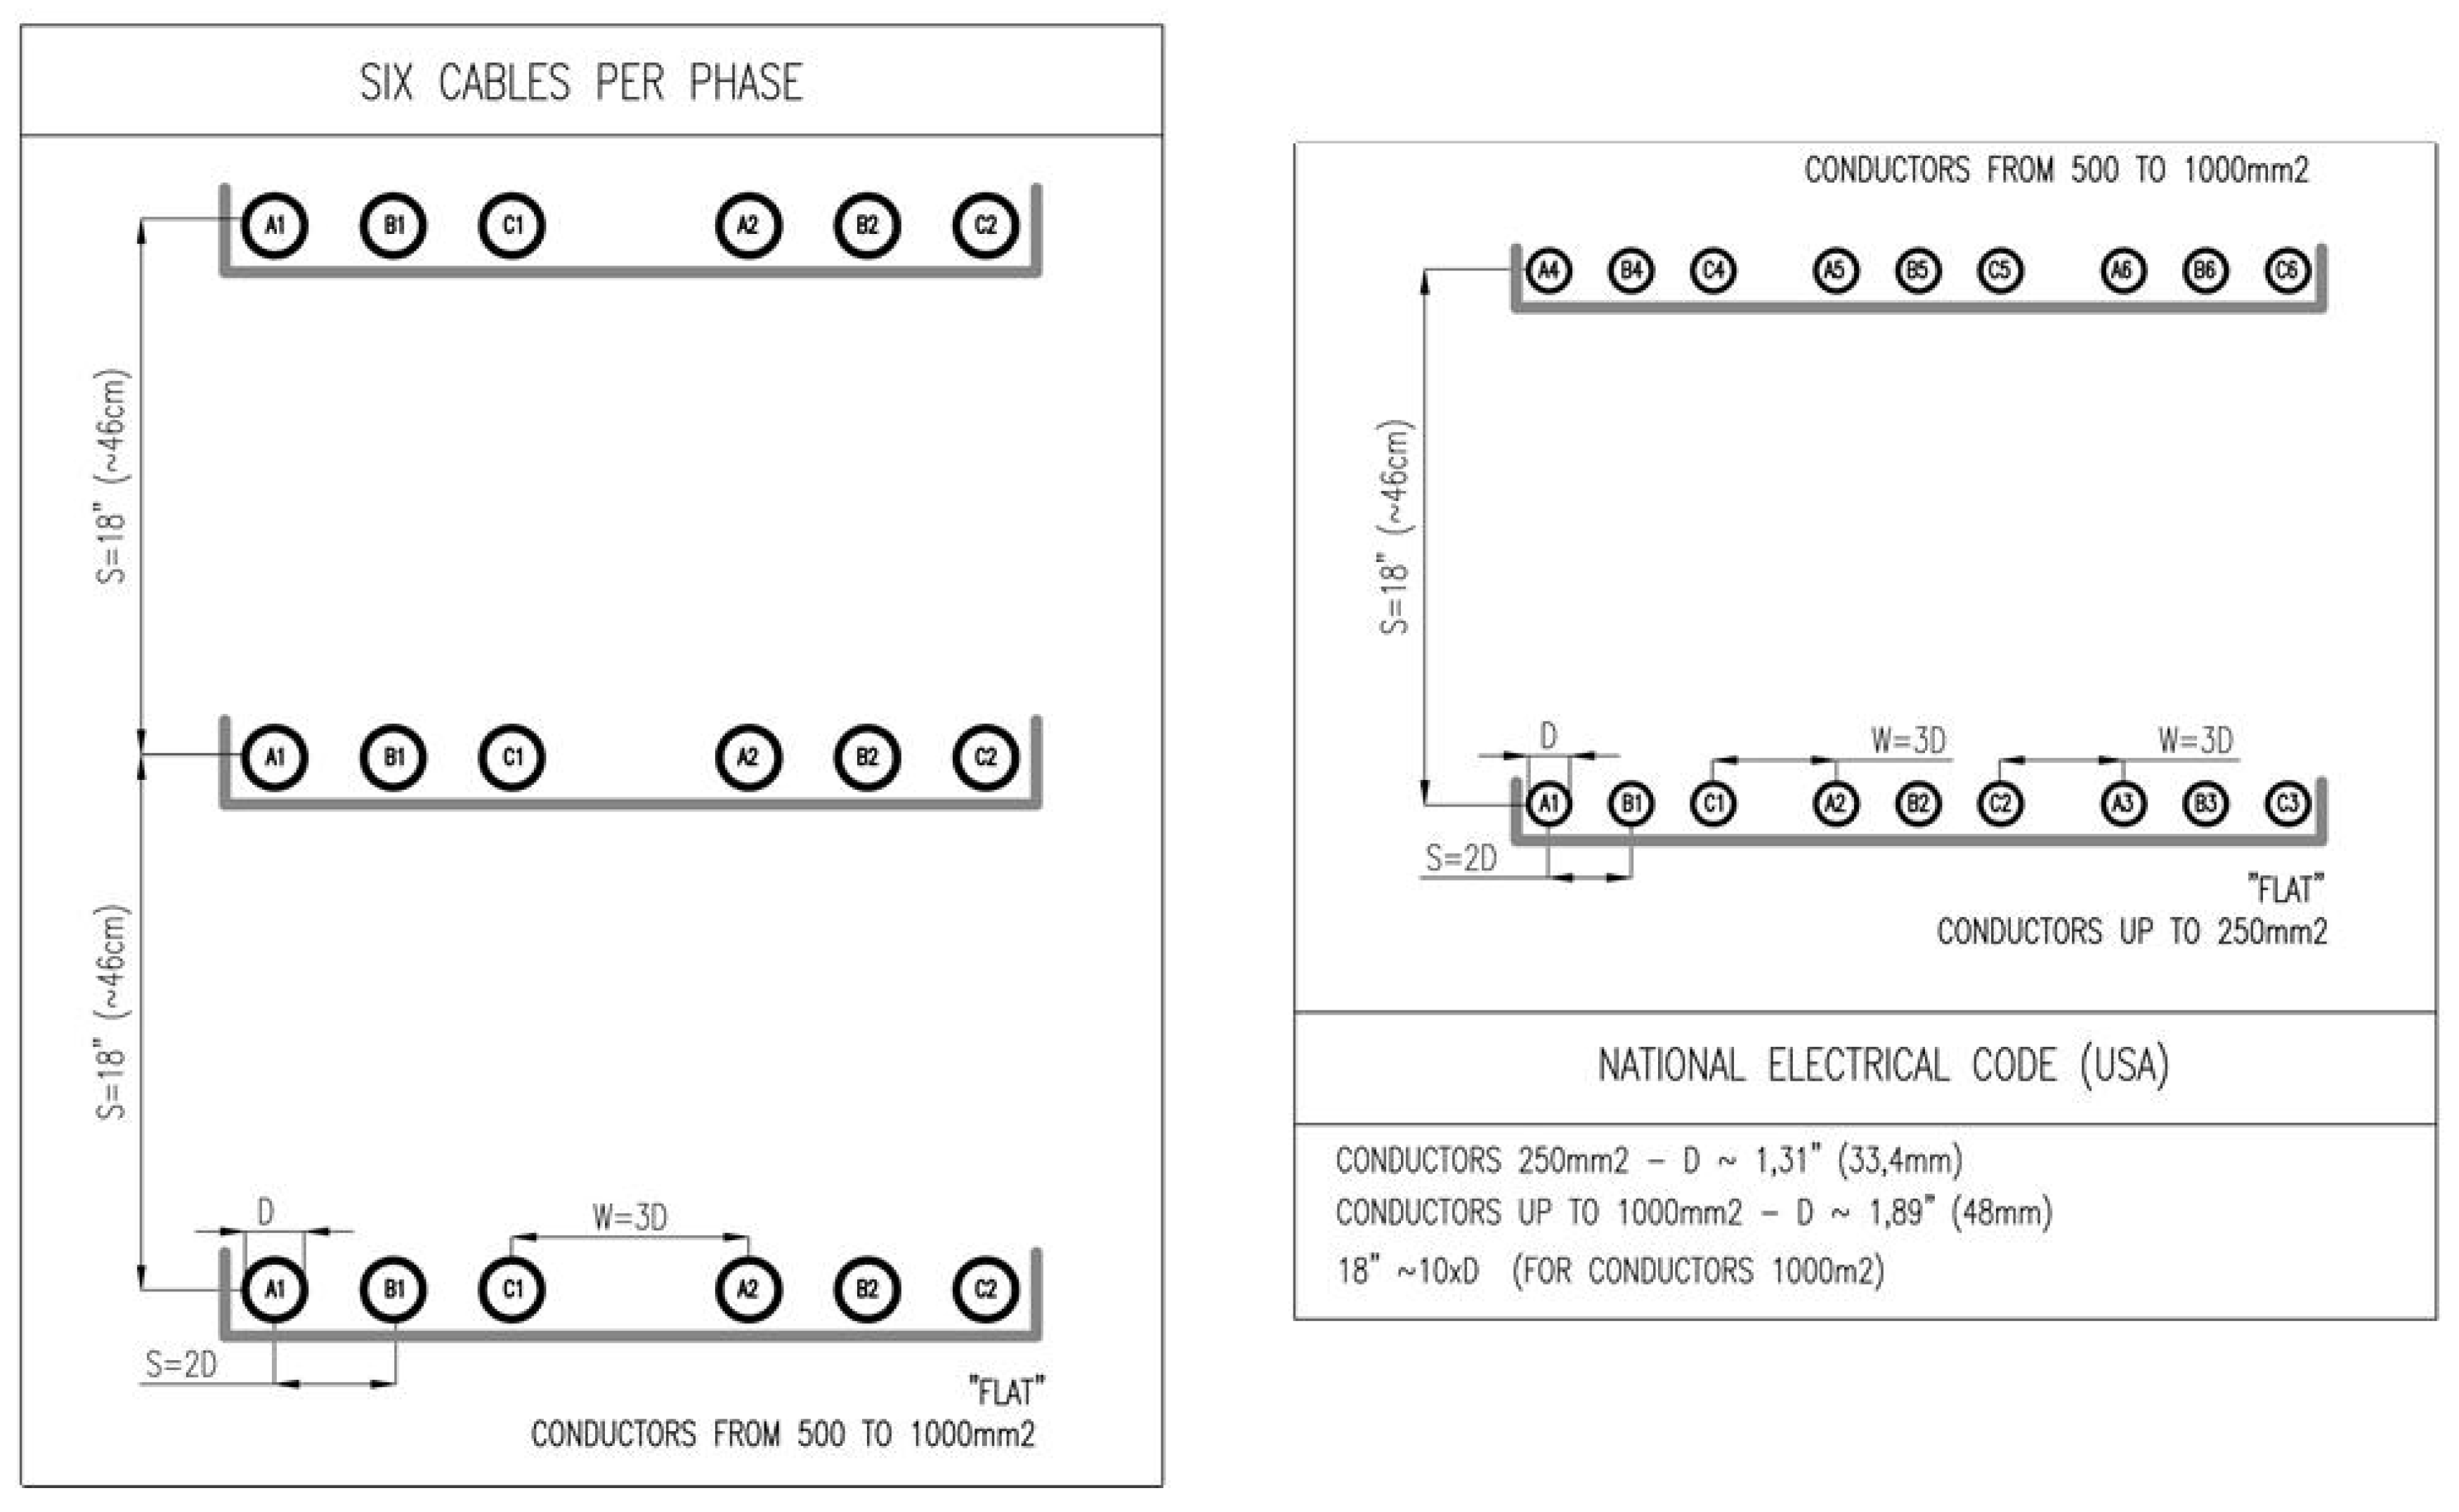
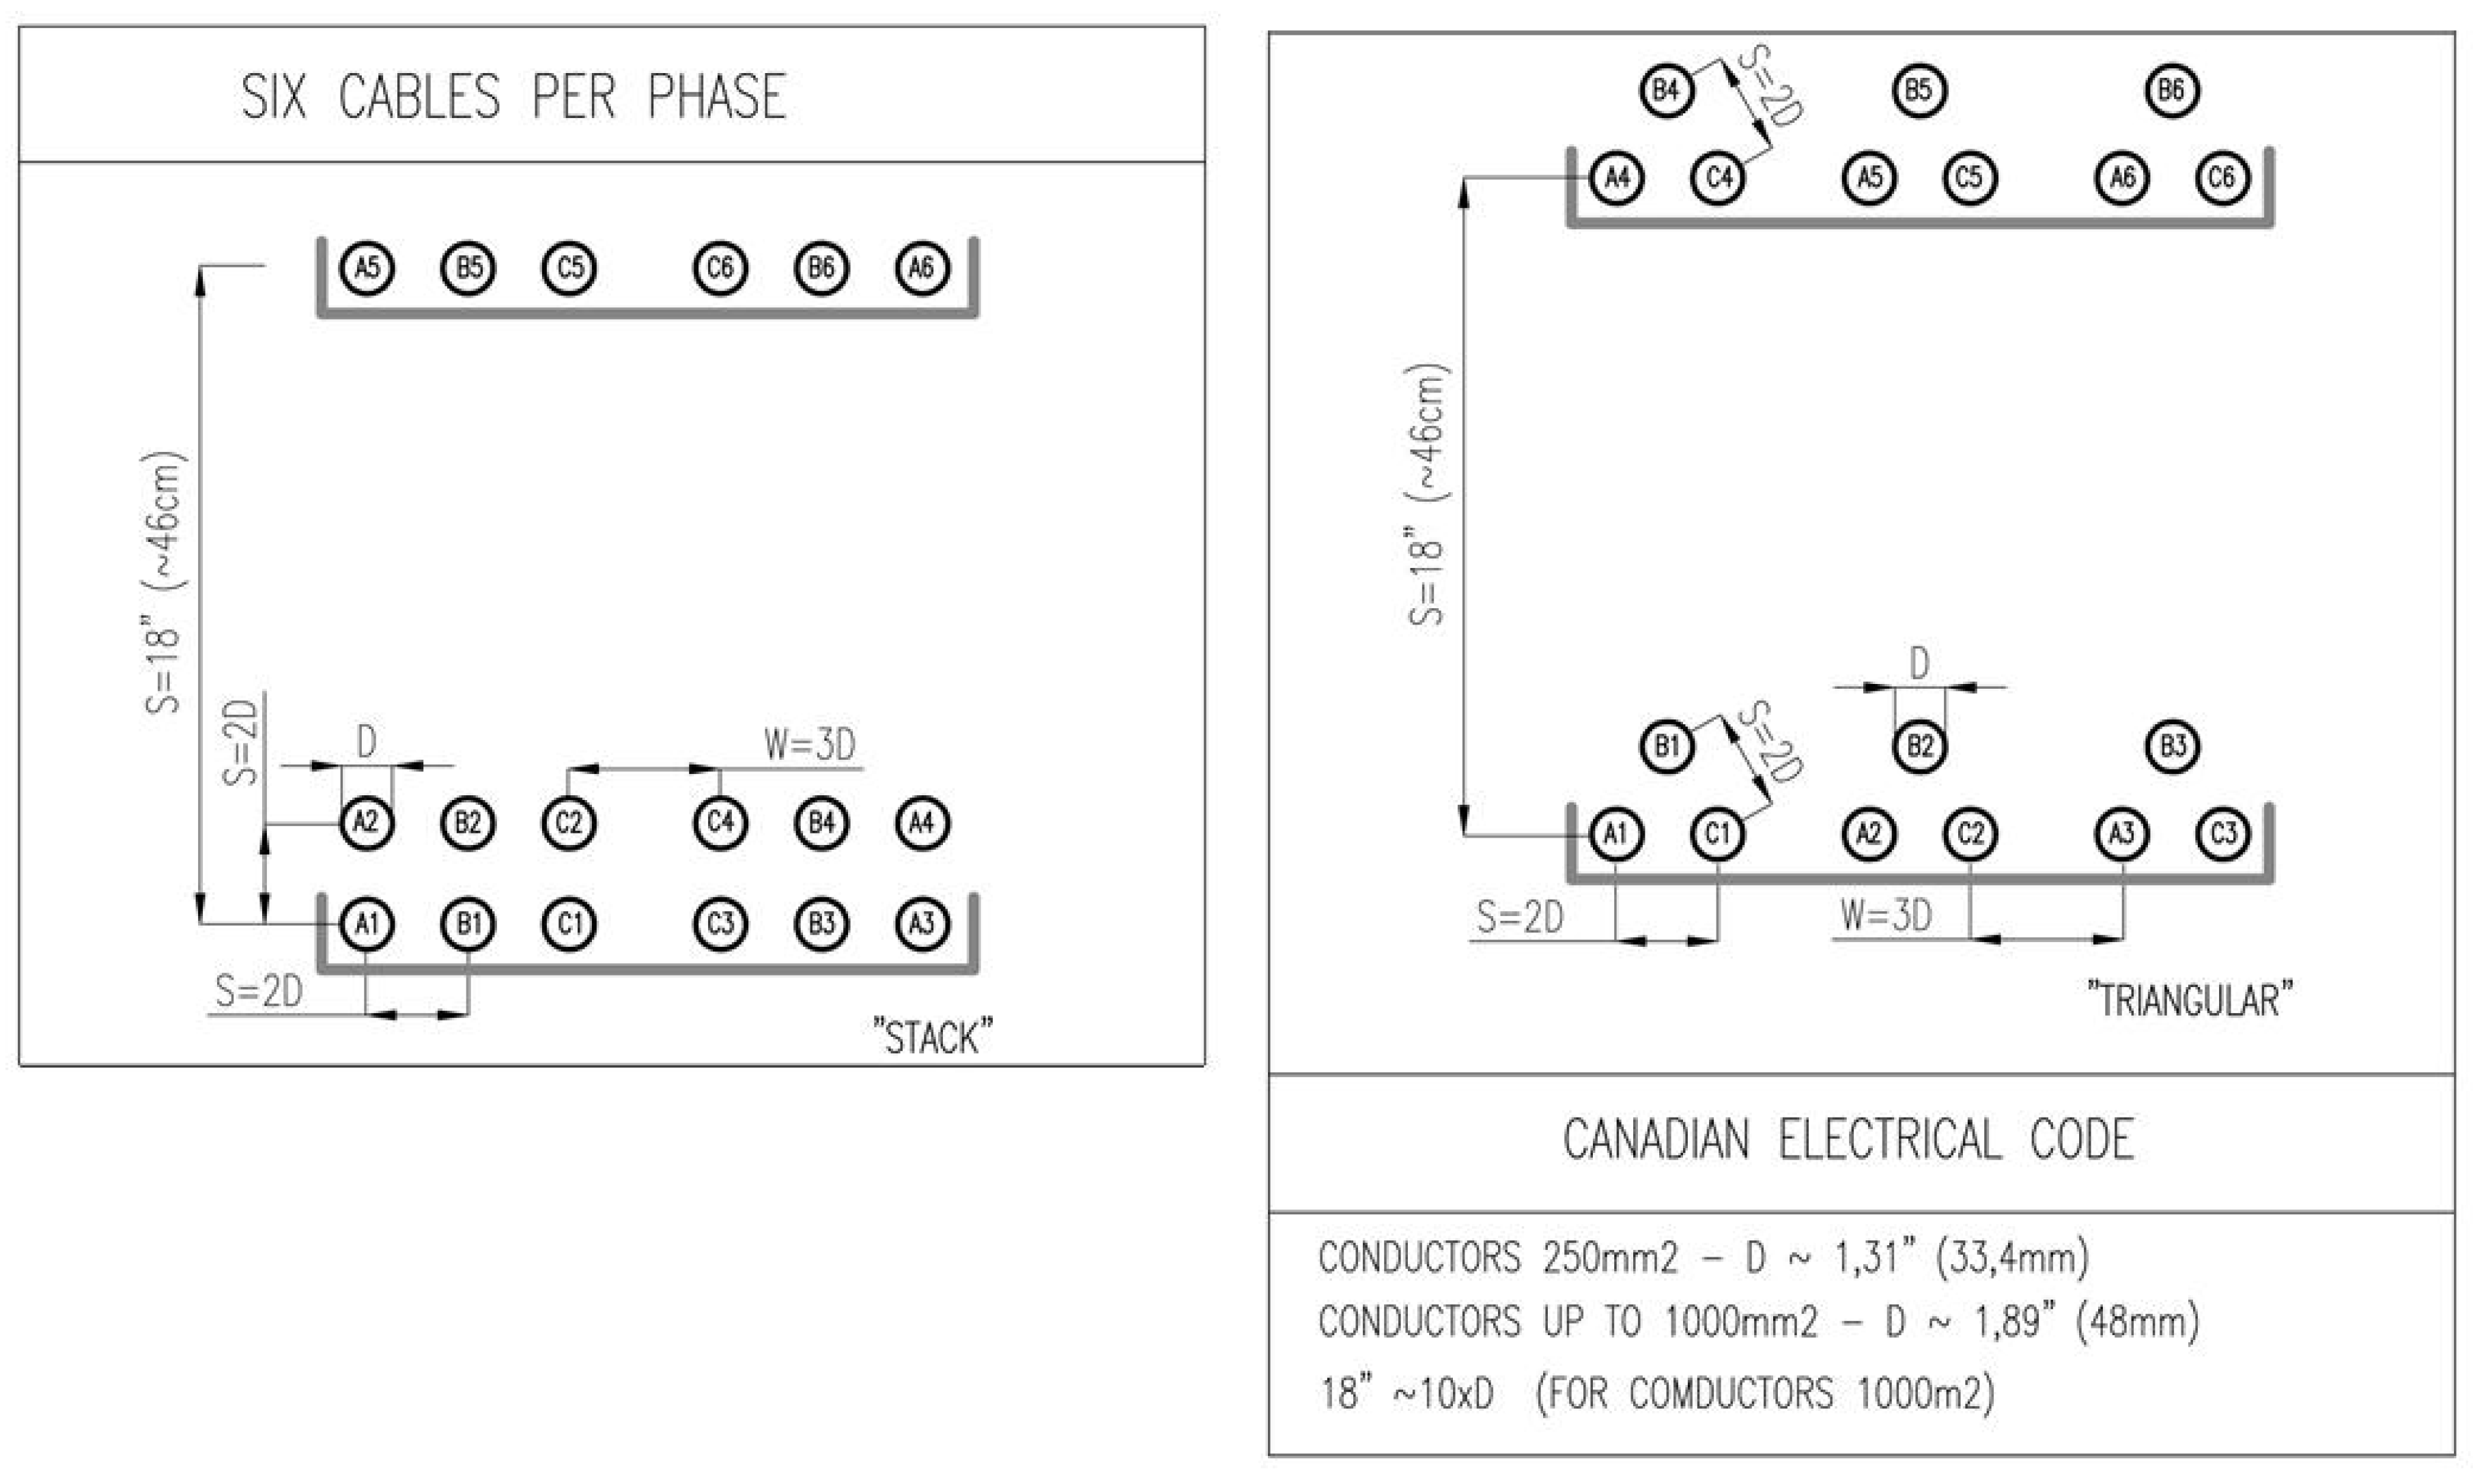
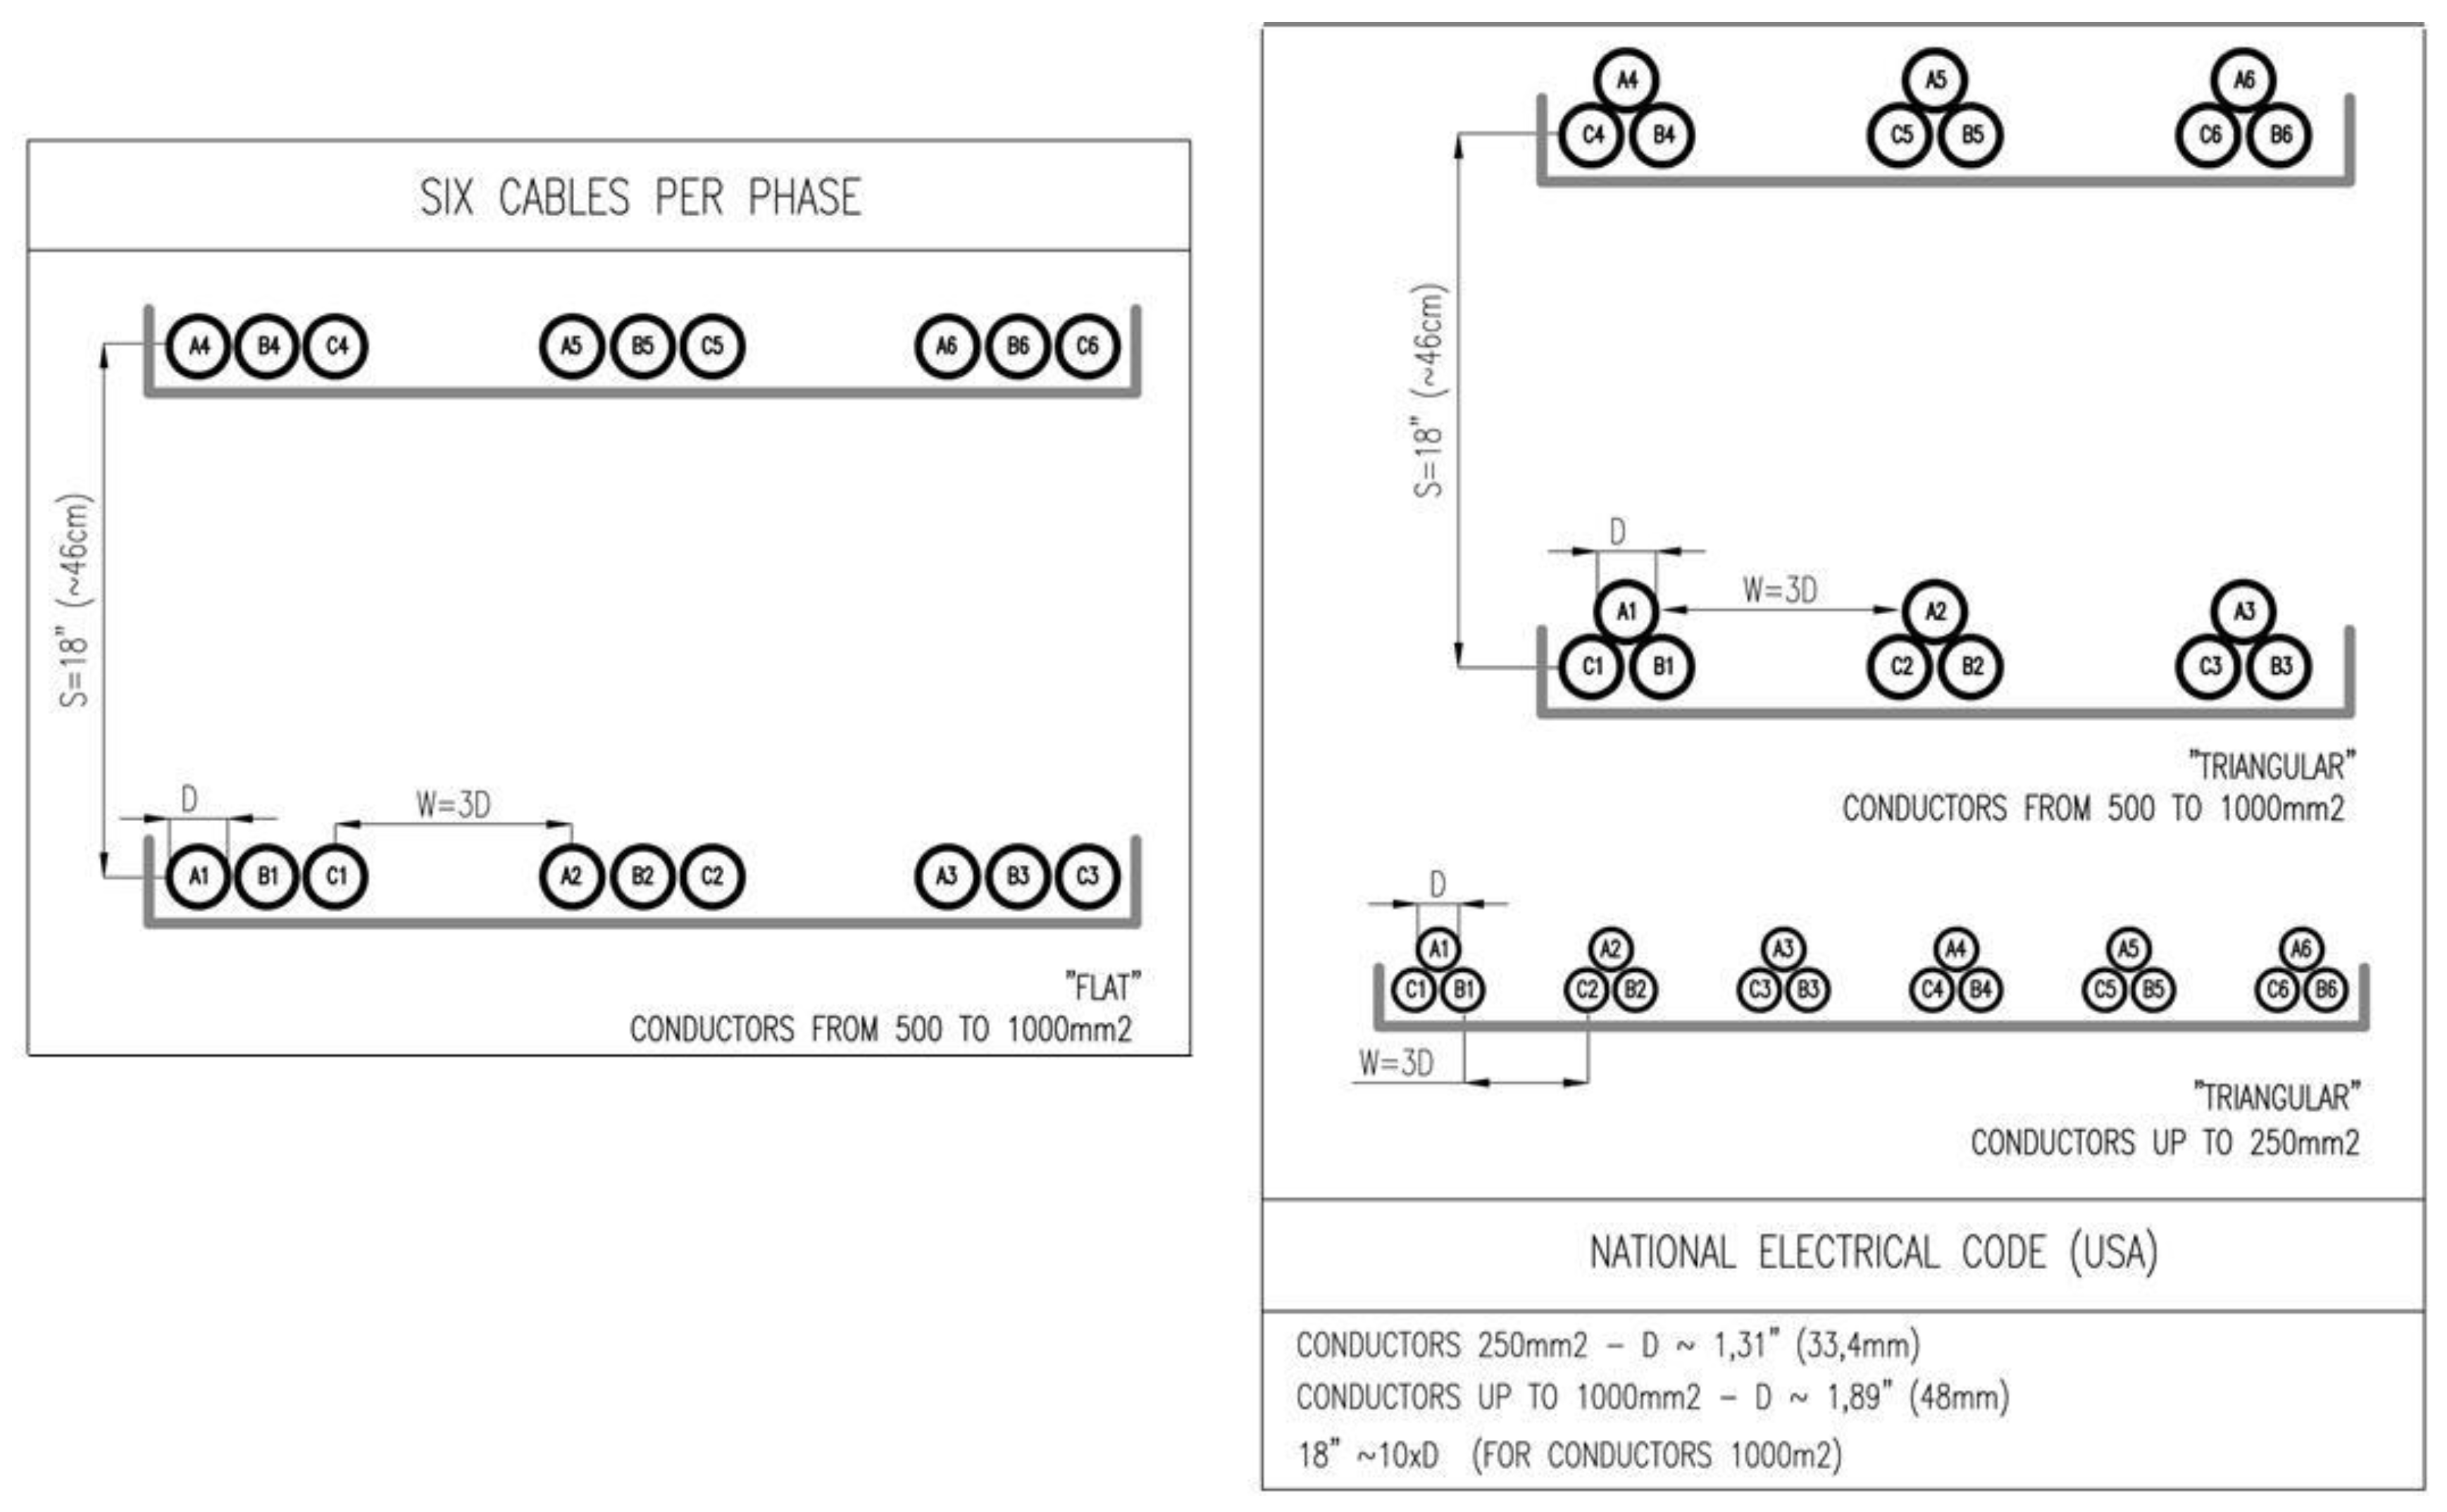
Wu [20] has compiled a summary of configurations recommended by the U.S. and the Canadian standards for 2…6 strands per phase. We have chosen for the analysis those cases, which are most often used in the practice. Analyzing the cases depicted in Figure 19, Figure 20, Figure 21, Figure 22, Figure 23 and Figure 24, we can draw the following conclusions:
  • the U.S. standards include flat configurations; such solutions are not used in Canada;
  • the lumped triangular layout is used both in the U.S. and in Canada;
  • the layout with strands lumped within a group (three phases close to each other, either in the flat or in the triangular configuration) may be perceived as three-phase equivalents of the recommended DC layouts, discussed previously;
  • interesting conclusions may be arrived at when one analyzes the results illustrating the current nonuniformity for the lumped and dispersed triangular layouts (Table X in [20]). Setting the cables apart is used in practice in order to improve the heat exchange conditions. From the point of geometry, both layouts are equivalent, however, Wu has noticed that, paradoxically, the geometry with dispersed cables is worse, since the indicator I max / I min takes a higher value (1.59 for the dispersed cables, 1.31 for the lumped cables). It is remarkable that phase C features the highest current asymmetry in both cases, which is most probably due to an additional effect related to phase rotation sequence;
  • for six strands per phase, there are some layouts recommended by the U.S. standards, which are not in use in Canada (the cables dispersed in a nonuniform manner, placed on three shelves for wire diameter in the range of 500–1000 mm2, on two shelves for wire diameter up to 250 mm2). The first aforementioned configuration features a very balanced current distribution (Tables XI and XII in [20]). The values of nonuniformity indicator I max / I min do not exceed 1.04.
For the first aforementioned configuration (depicted in the leftmost part of Figure 21), we have determined the barycenter location for each phase. If we assume that the origin of the coordinate system (point (0,0)) is placed in the middle of the wire A1, and the distance between the shelves (i.e., 18″) is approximately 10 times the wire diameter, then the coordinates of the other wires are: B1(2,0), C1(4,0), A2(10, 0), B2(8,10), C2(6,0), A3(0,10), B3(2,10), C3(6,10), A4(10,10), B4(8,10), C4(6,10), A5(0,20), B5(2,20), C5(4,20), A6(10,20), B6(8,20), C6(6,20).
It is straightforward to compute that the barycenter coordinates for each phase are then the same and they are equal to (5, 10). It means that the proposed criterion for choosing the optimal spatial configuration is fulfilled in this case.
It should be noticed that not all spatial configurations from those depicted in Figure 19, Figure 20, Figure 21, Figure 22, Figure 23 and Figure 24 result in a fully balanced load of individual strands. A practical conclusion resulting from the analysis of cases listed in [20] is that it is necessary to carry out detailed computations for each scenario, and the entries in the standards should be treated as recommended under certain circumstances.
-
Other cases of interest analyzed in the literature
  • the case of supply of a textile factory in Greece [21]
Two cable groups consisting of 18 flat-laid, single-conductor cables were laid on a metallic tray in free space, each with 300 mm2 cross-section, cf. Figure 25. We assume a unit distance between the cable centers, a similar distance assumed between the cables on the internal edges and the compartment bar.
The “x” coordinates of the barycenters for the case depicted in Figure 25 were as follows:
phase A
1 5 ( 3 + 4 + 5 + 6 + 9 ) = 5.4
phase B
1 5 ( 10 + 11 + 12 + 13 + 14 ) = 12
phase C
1 5 ( 15 + 16 + 17 + 18 + 19 ) = 17
For the optimized case (see Figure 26), the corresponding values were, respectively,
phase A
1 5 ( 3 + 10 + 11 + 16 + 17 ) = 11.4
phase B
1 5 ( 5 + 6 + 13 + 14 + 19 ) = 11.4
phase C
1 5 ( 4 + 9 + 12 + 15 + 18 ) = 11.6
The dispersion between the extreme current values was minimized from 11.6 (which was about 61% of total length considered) down to 0.2 (about 0.61%).
  • The case of Teatro Regio in Turin, Italy [15]
The configuration recommended by the authors for the system with six strands per phase plus three neutral wires is depicted in Figure 27.
Let us assume that the coordinates of B wire in the leftmost downward edge are (0; 0). Let us assume that the distance between the strand centers in the vertical direction is equal to unity, similarly for the horizontal direction, apart from the upmost row, where the distance is equal to two units, that is, the coordinates of phase A wires are (0; 4), (2; 4), and (4; 4), respectively. The barycenter coordinates are: for phase A (2; 2.5), for B and C phases (2; 5.1), for neutral wires (3; 1). The state close to the optimal one was achieved, and the full symmetry was unreachable due to the presence of neutral wires, which occupied some space. For neutral wires, the barycenter does not have to match the barycenter for phase wires, since under normal operating conditions and supply symmetry, the currents flowing through neutral wires are insignificant.
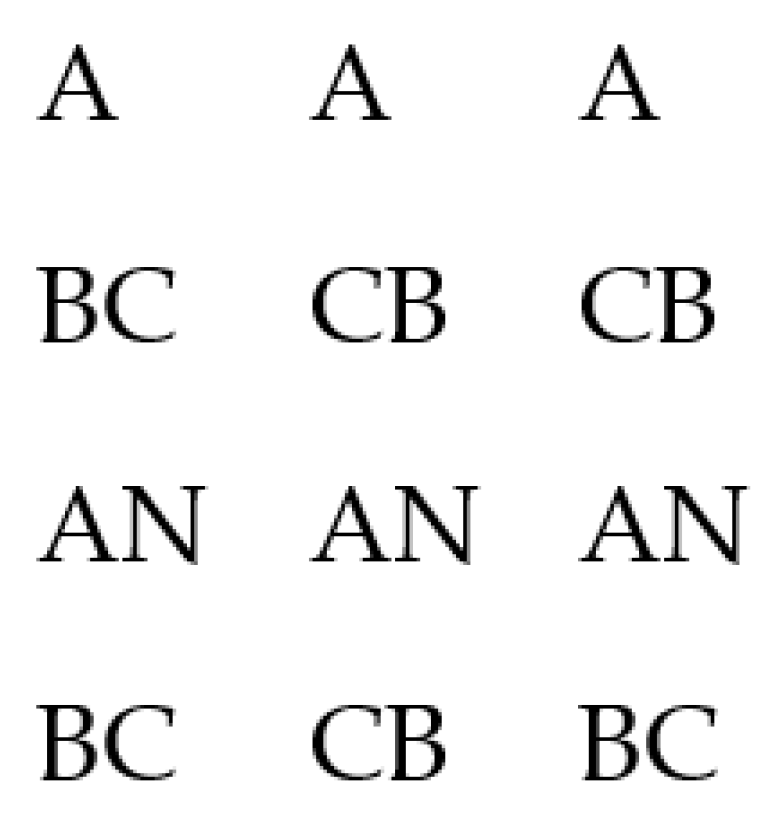
  • Canova et al. have considered the optimal layout of cables using the Vector Immune System algorithm [22]. The case considered was six strands per phase, lack of neutral wire. The configuration indicated by the authors as the optimal one, featuring both the most uniform current partition and the lowest value of magnetic induction, was:
    BCAACBBCA
    ACBBCAACB
If we assume that the coordinates of the center of the leftmost downward A wire were (0;0) and the distance between successive wire centers was equal to three units both for the vertical and the horizontal directions, it is straightforward to compute that the barycenter location for each phase was (12; 1.5). It means that the configuration found by the optimization algorithm is indeed the optimal one and the symmetry state was achieved.
  • Lee has considered a similar case (six wires per phase, two shelves), but with neutral wires [18]. Let us assume that the origin of the coordinate system was placed in the center of the leftmost downward wire (phase A) and that the distance was equal to unity.
    ABCNNCBANABC
    ABCNNCBANABC
The barycenter coordinates for phases A and B were equal to (5.67; 0.5), for phase C (6; 0.5), for the neutral wire (5; 0.5). The state close to the optimal one was achieved, and the full symmetry was unreachable due to the presence of neutral wires, which occupied a part of available space. For the neutral wires, the barycenter location does not have to correspond to the barycenter locations for phases since under normal operating conditions and for supply symmetry, the current values flowing though neutral wires are insignificant.

4. Verification of the Proposed Criterion for Optimal Current Distribution Using FEM

Taking into account the computation results from the last section, we can draw a conclusion that the criterion based on barycenter location might be useful for quick selection of potentially optimal spatial configurations, which might be helpful for the designers of cable systems. Additional verification for some simple scenarios is provided in this section, using the freeware FEMM software [23].
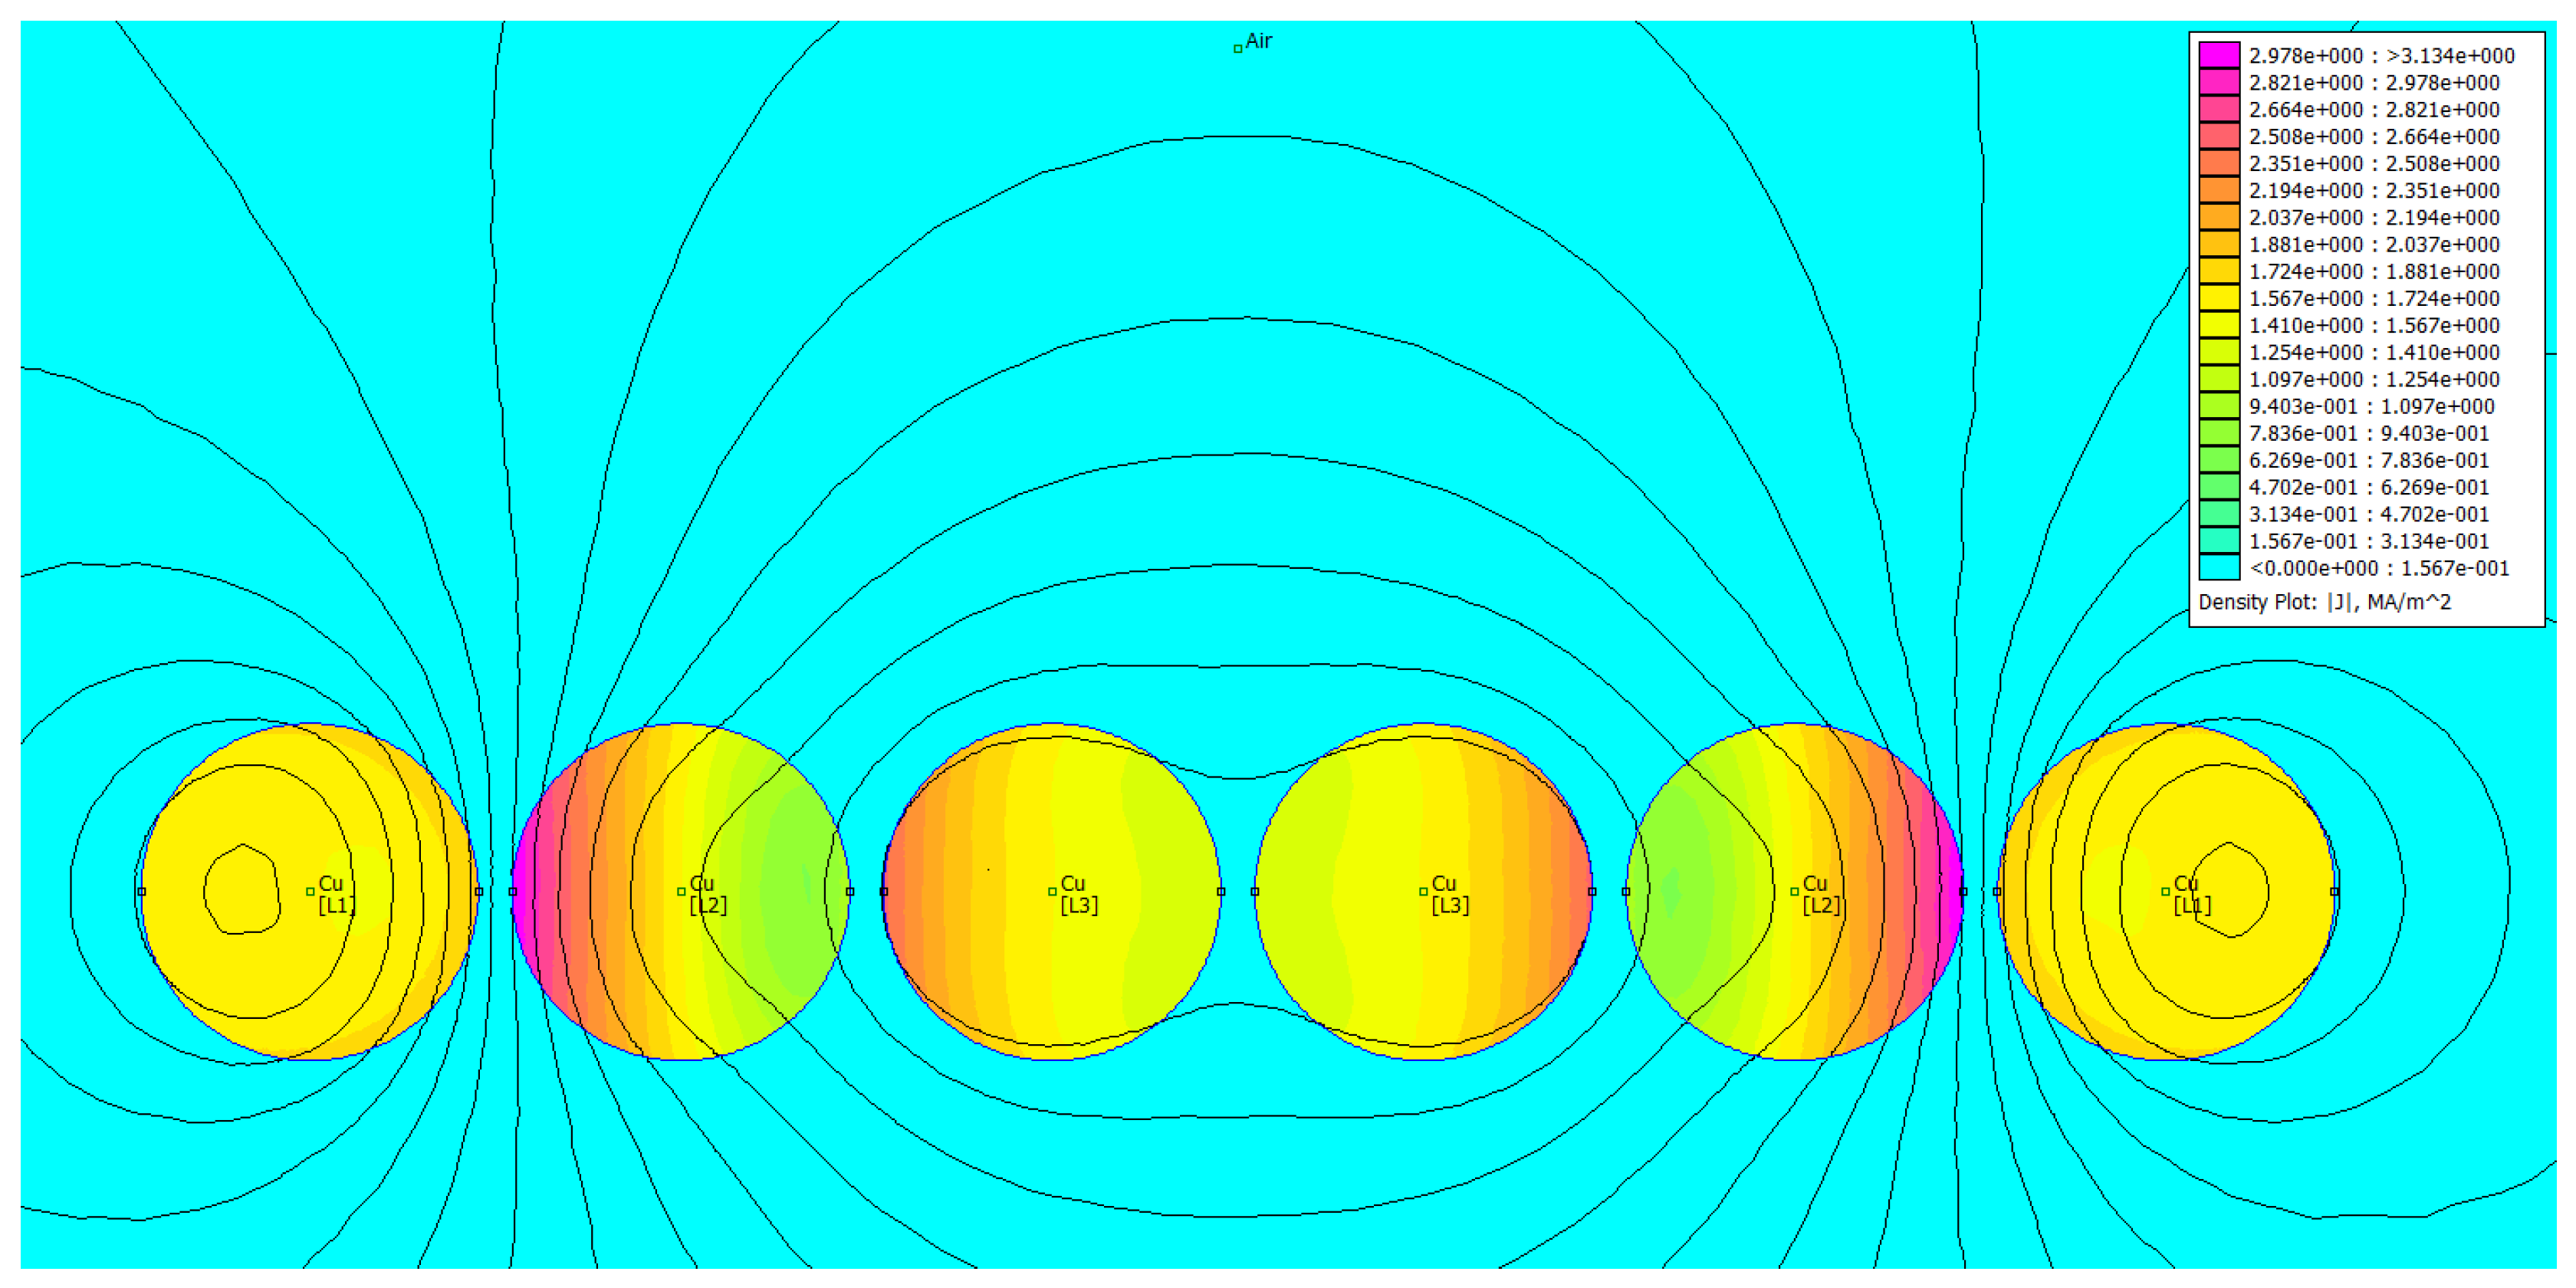
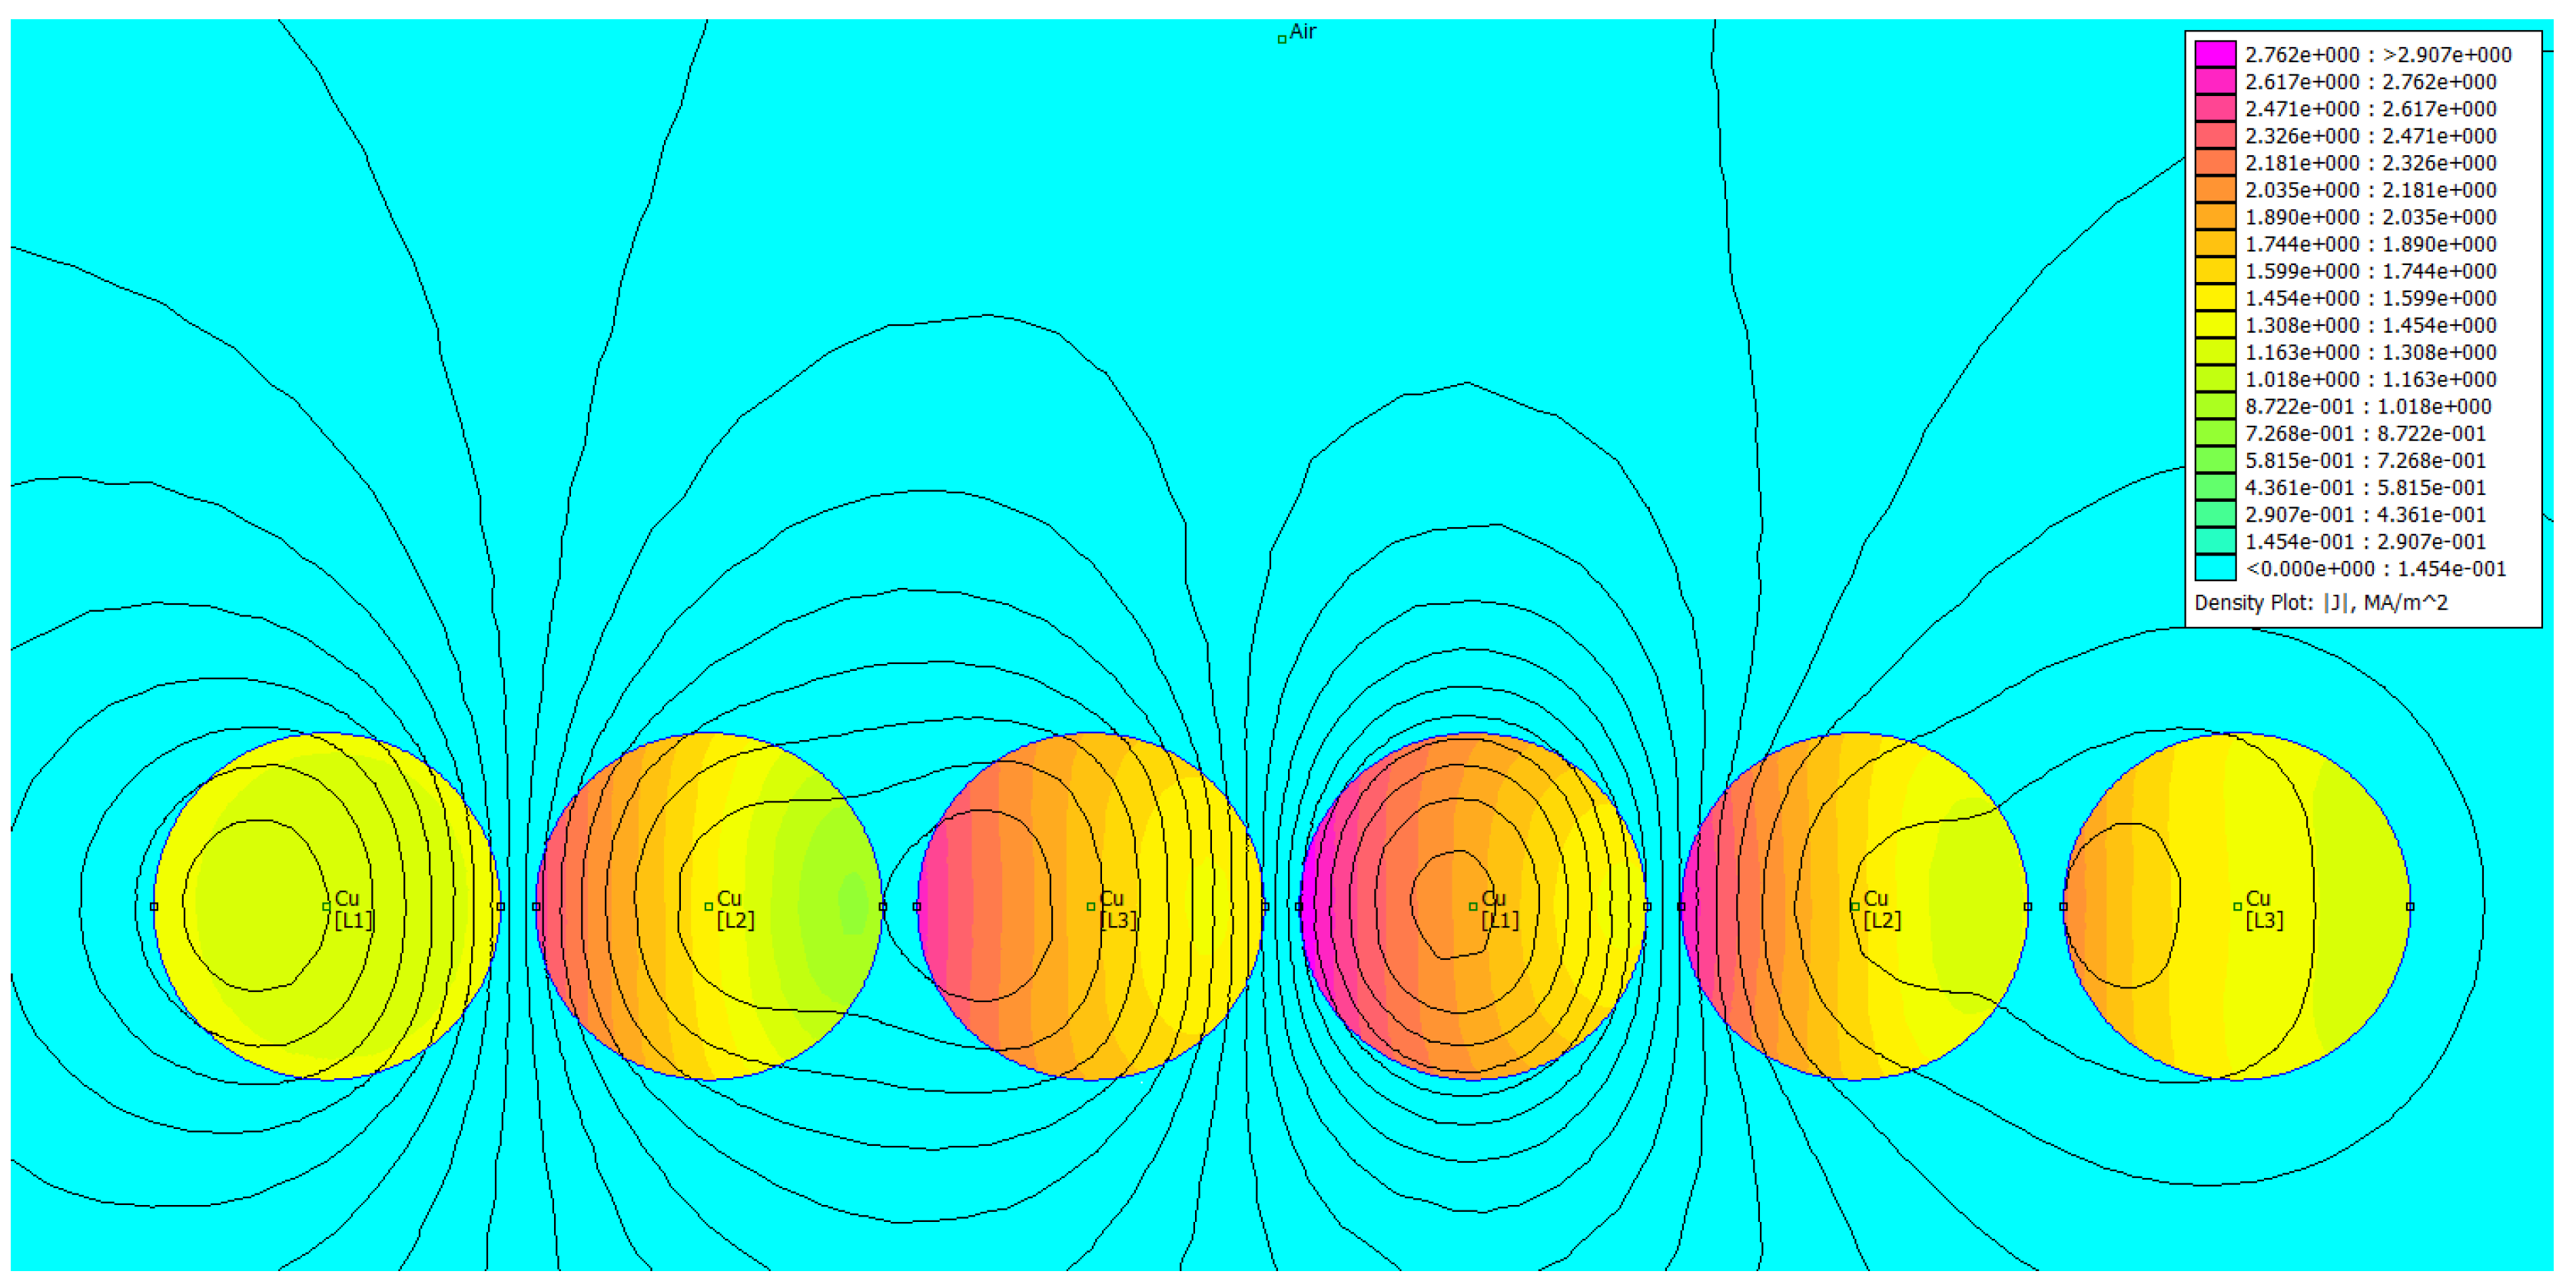
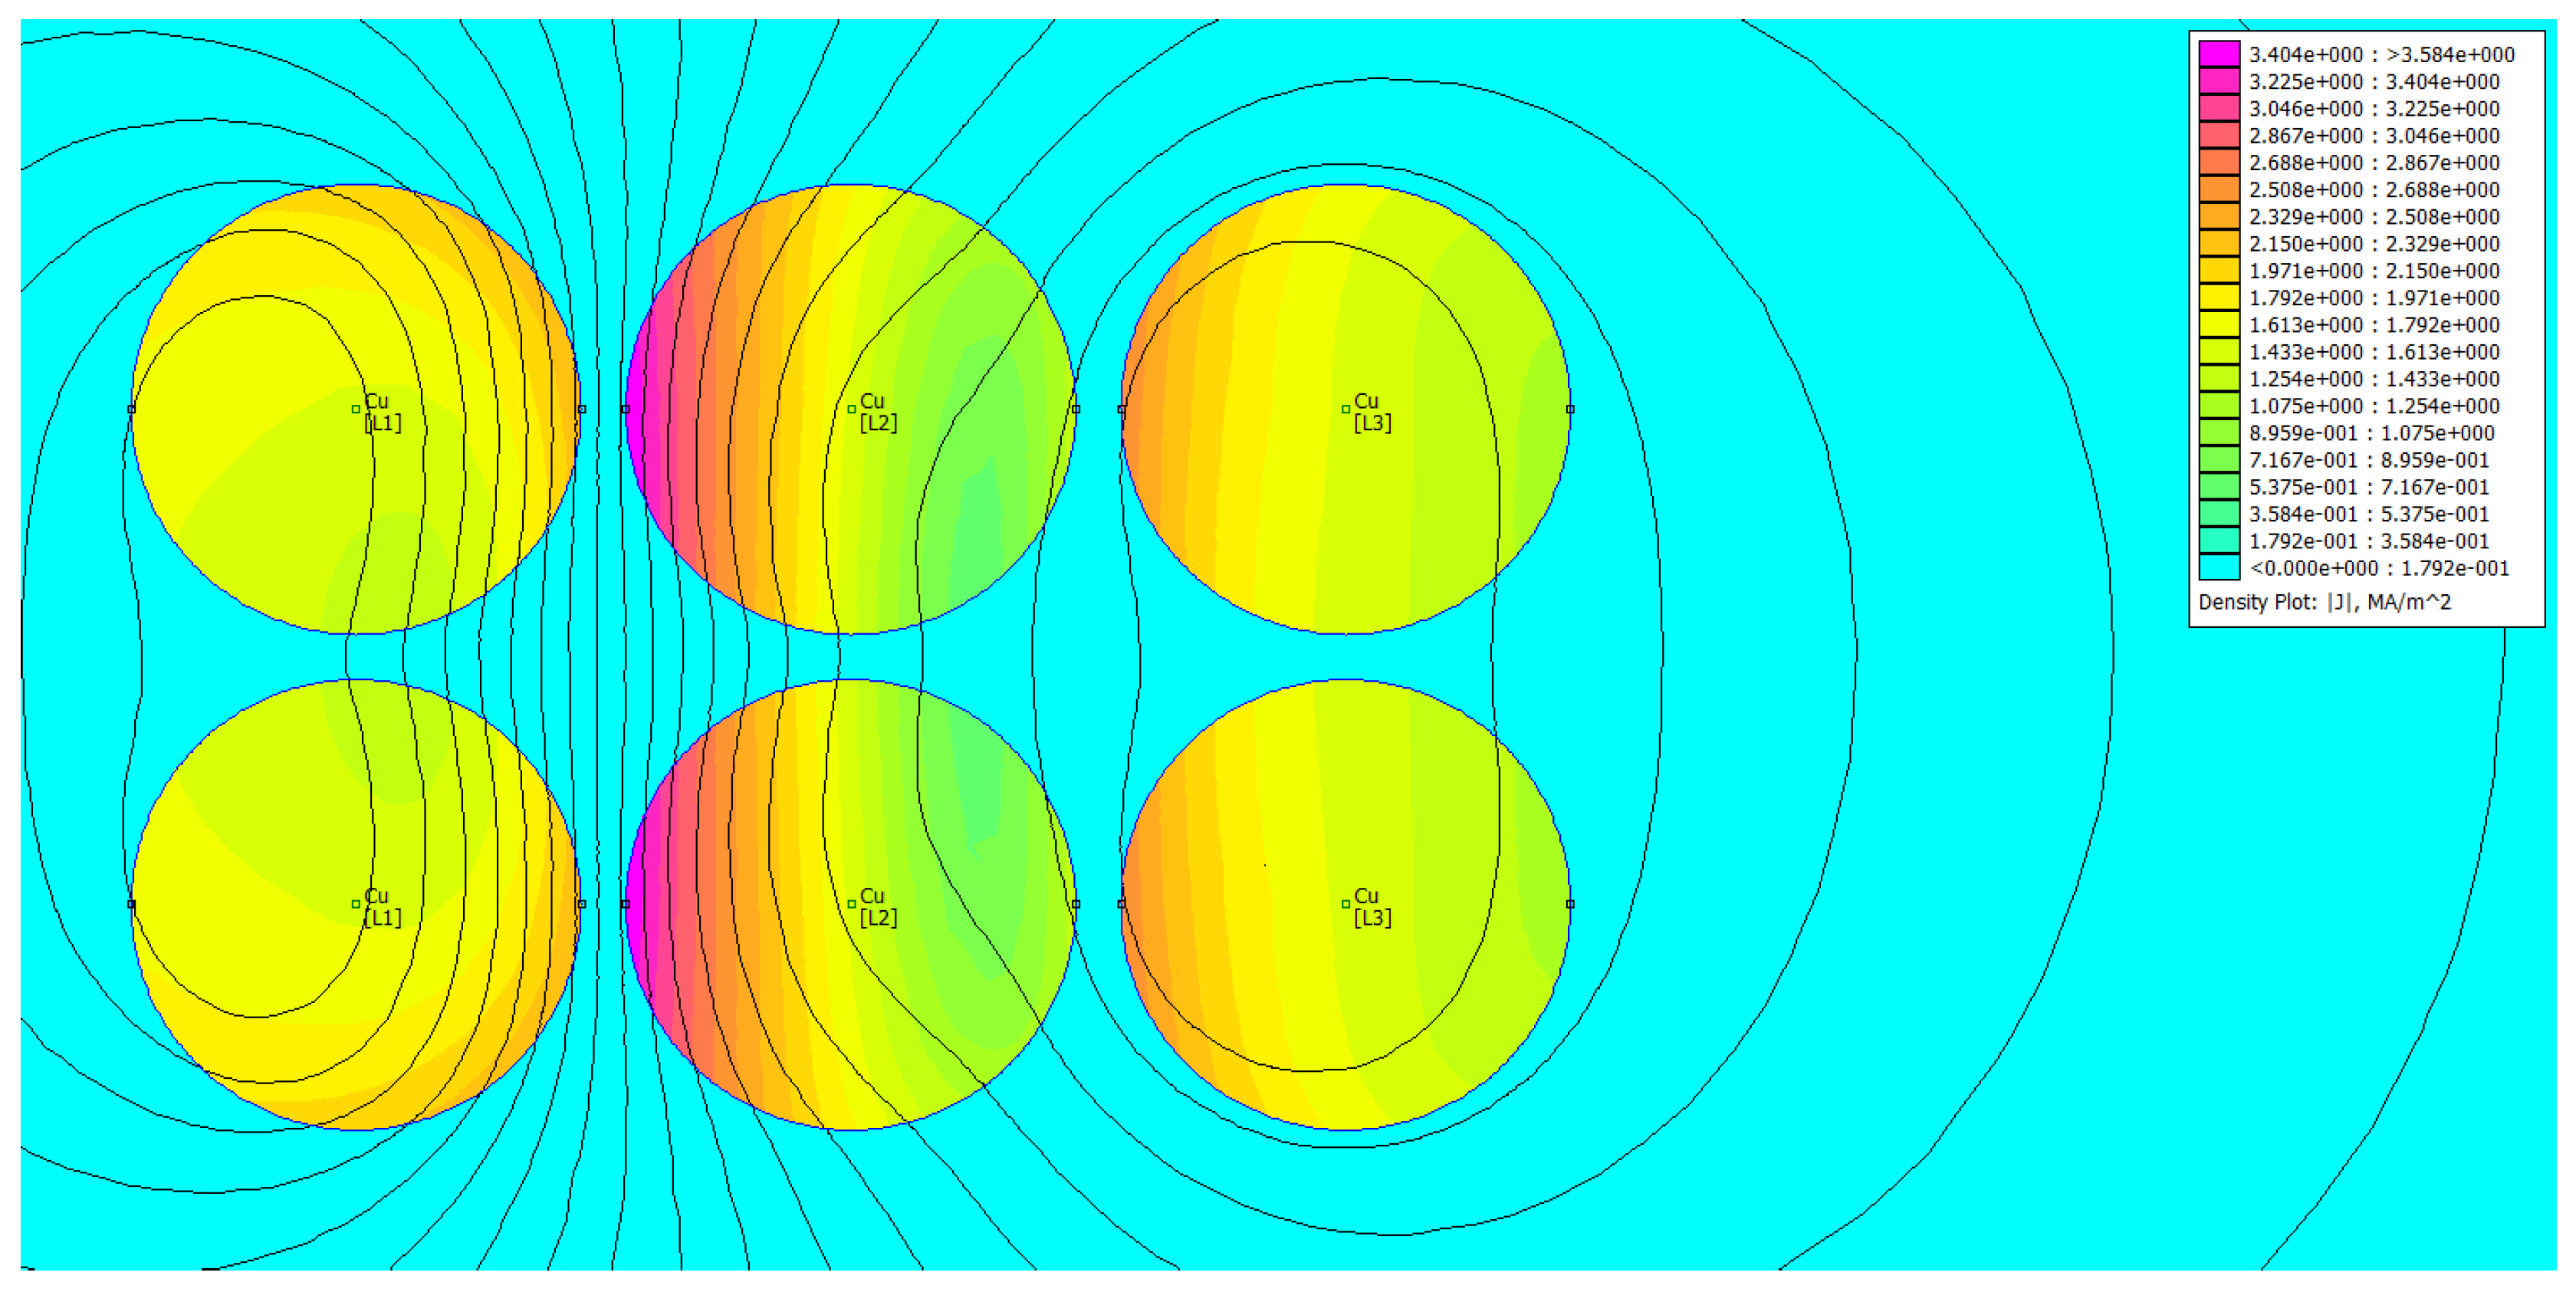
Comparing three cases depicted in Figure 28, Figure 29 and Figure 30, it can be stated that the current uniformity is obtained for the system ABCCBA, for which the phase barycenter locations overlap. For the other two configurations, the current distribution is nonuniform. Table 4 contains the results of FEM-based computations for individual phases. The subscript “1” denotes the leftmost wire, the subscript “2” the rightmost one.
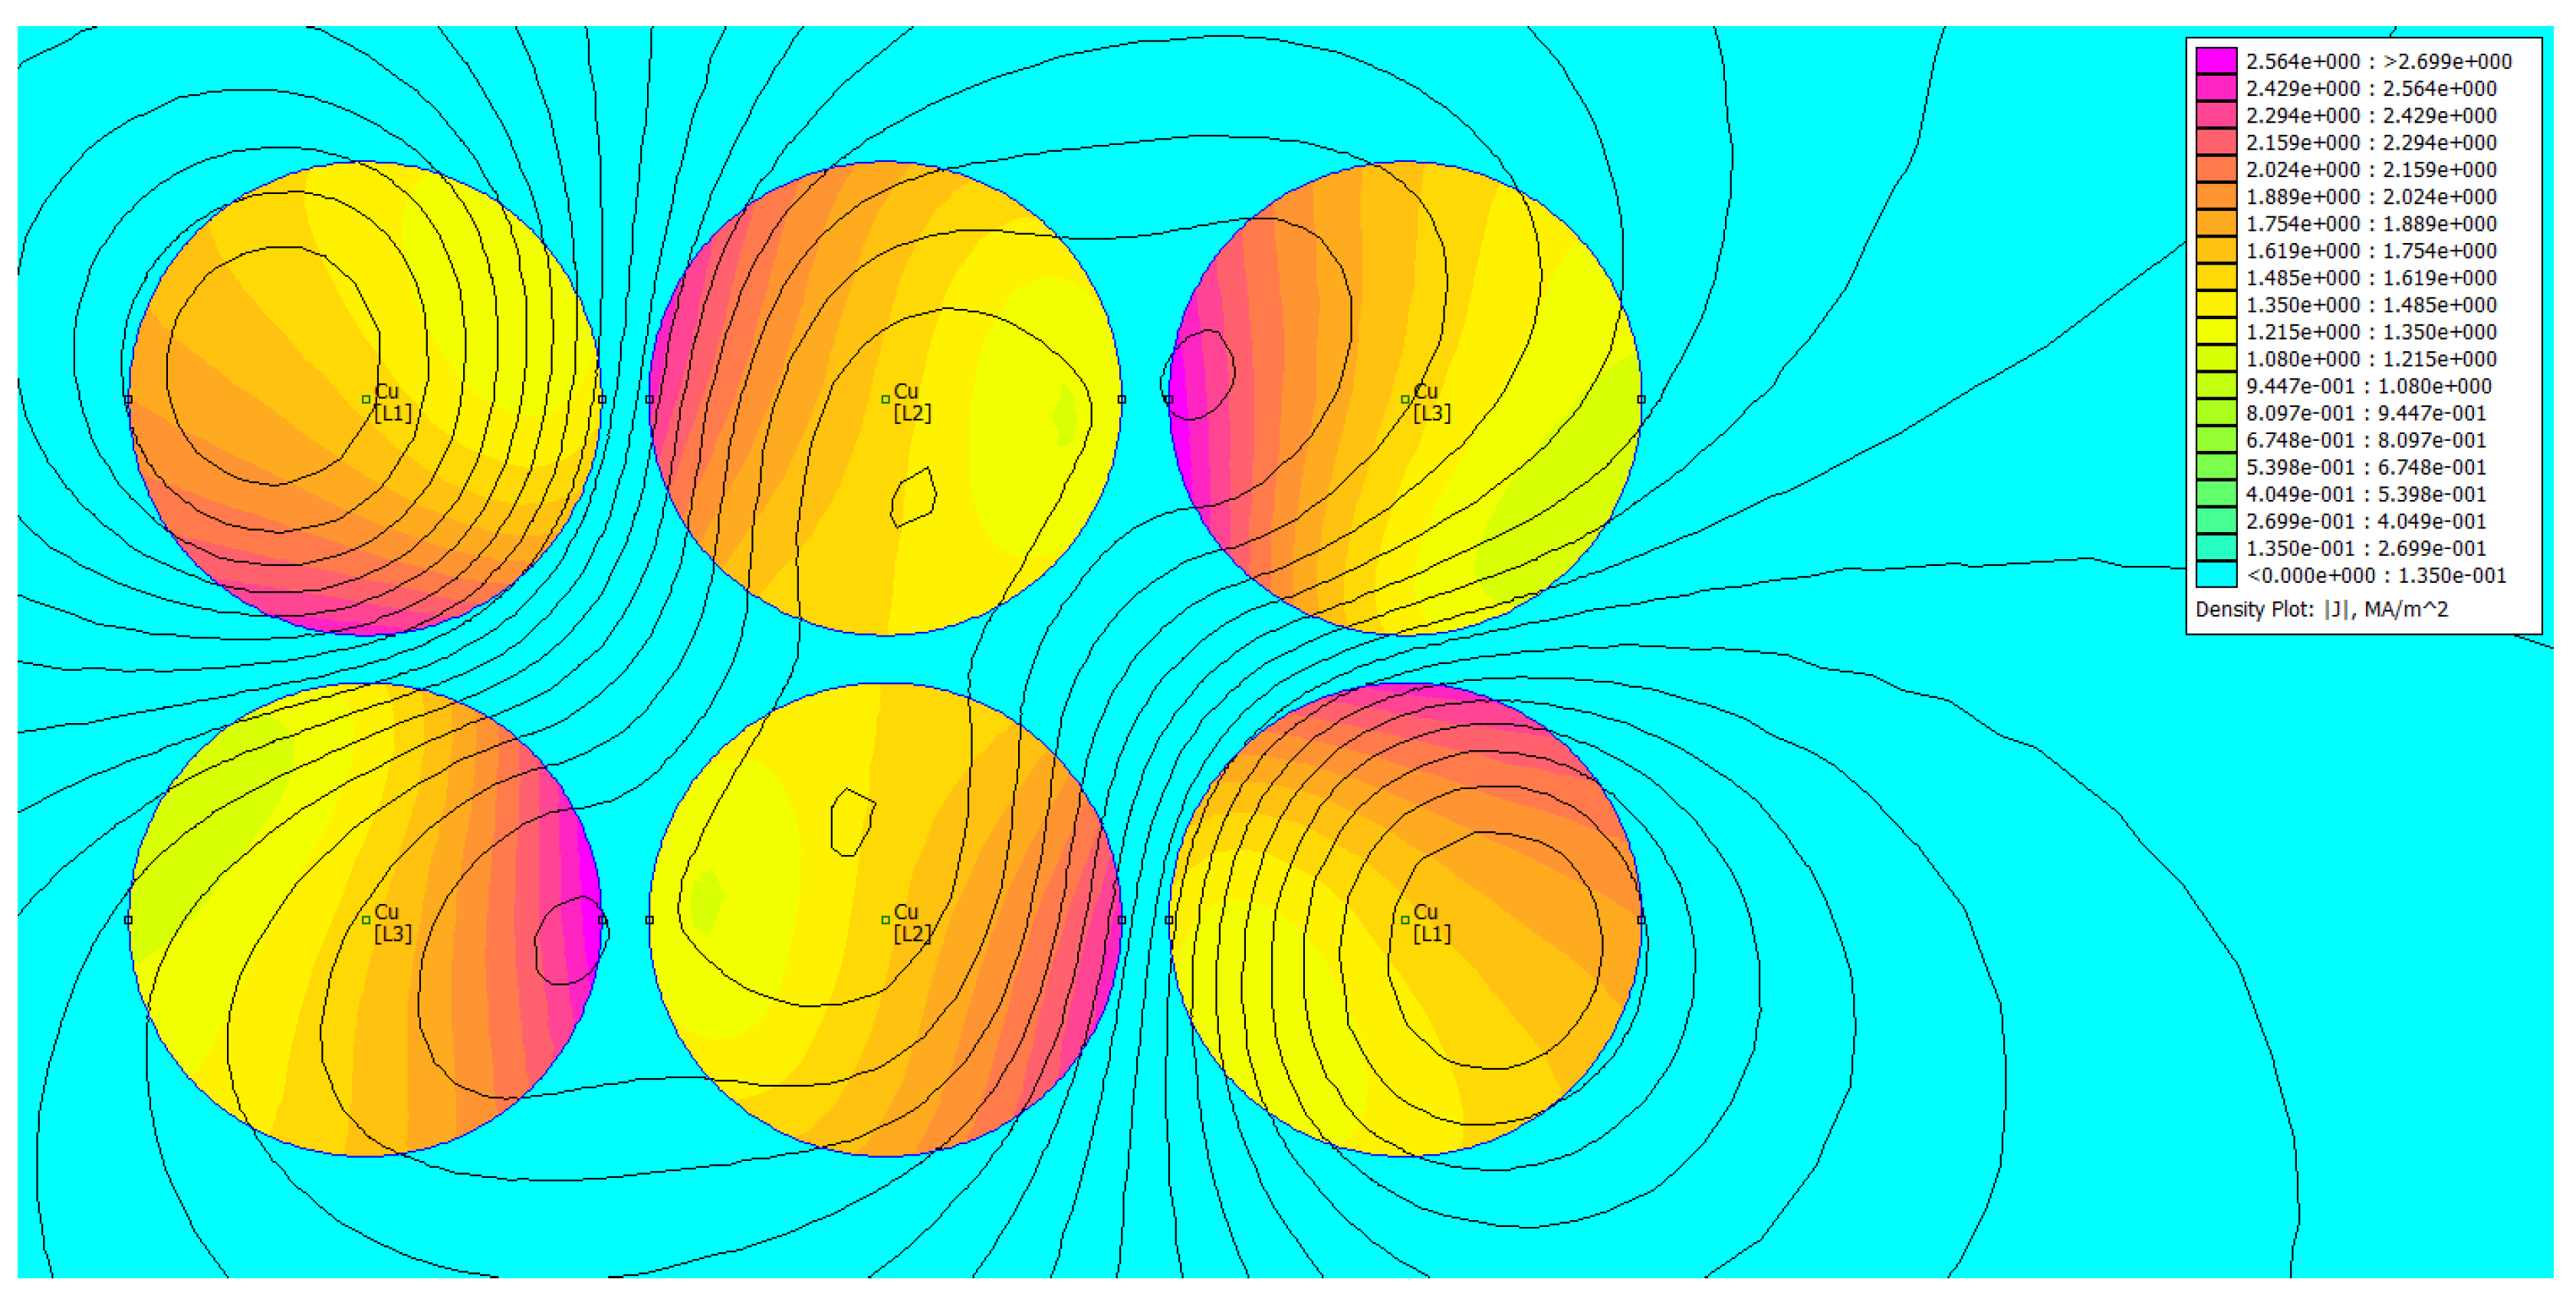
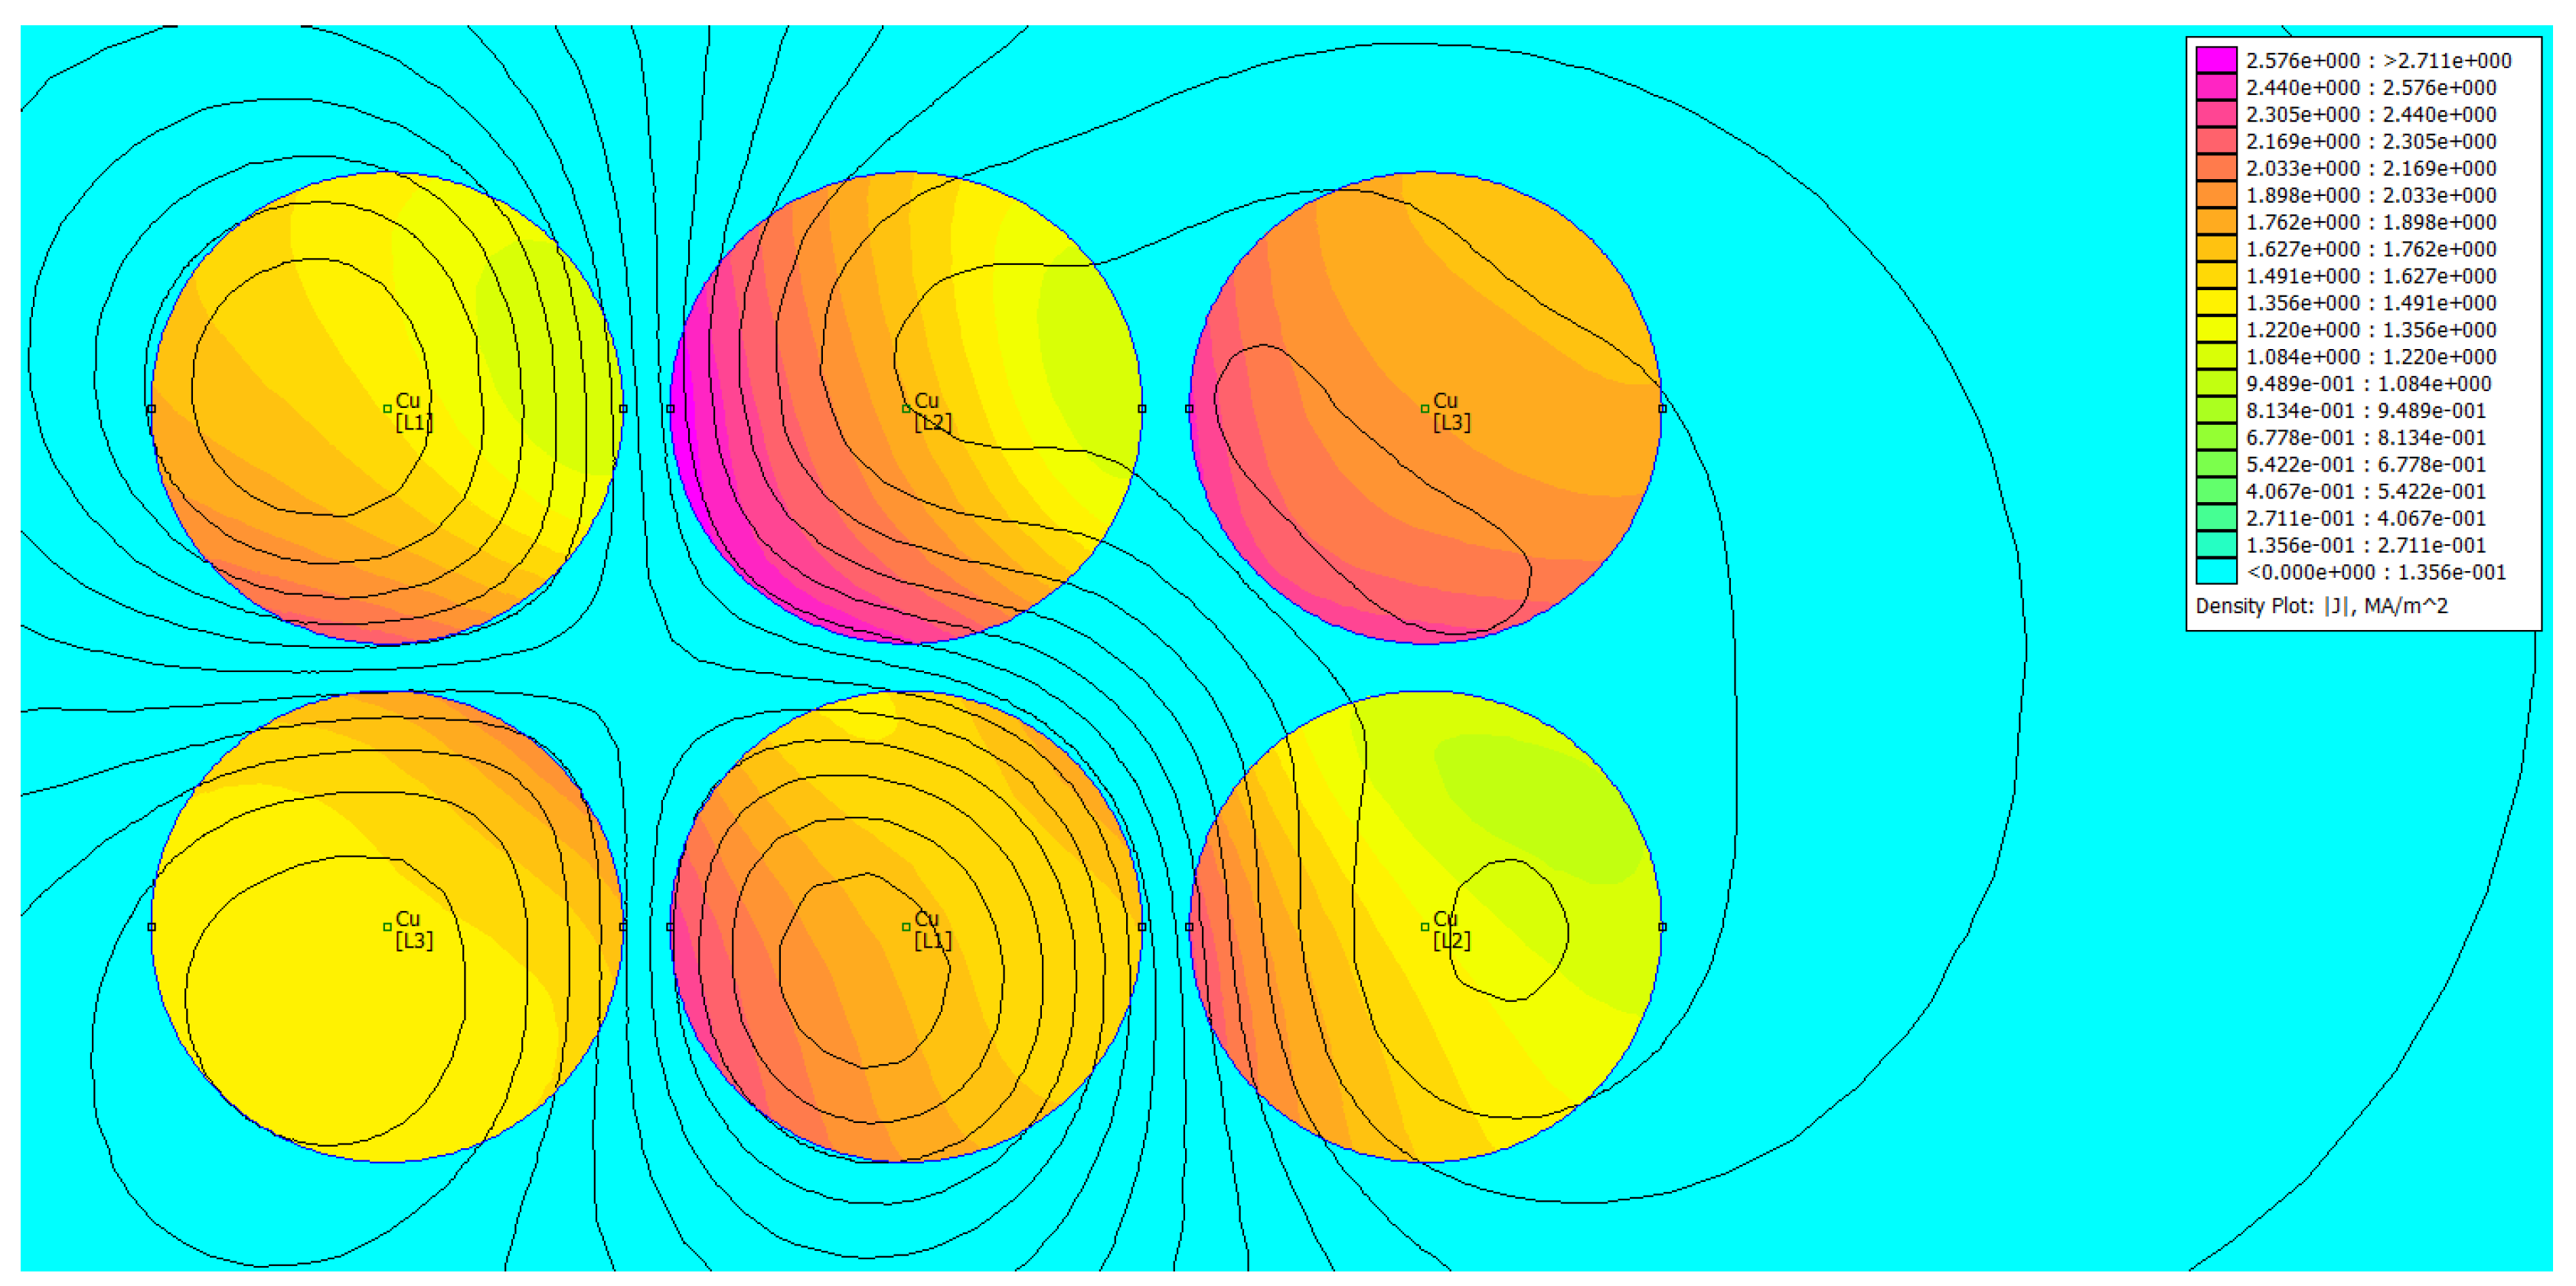
Comparing three cases depicted in Figure 31, Figure 32 and Figure 33, it can be stated that the current uniformity is obtained for the system ABC/CBA, for which the phase barycenter locations overlap. For the other two configurations, the current distribution is nonuniform. Table 5 contains the results of FEM-based load computations for individual phases. The subscript “1” denotes the upper wire, the subscript “2” the lower one.
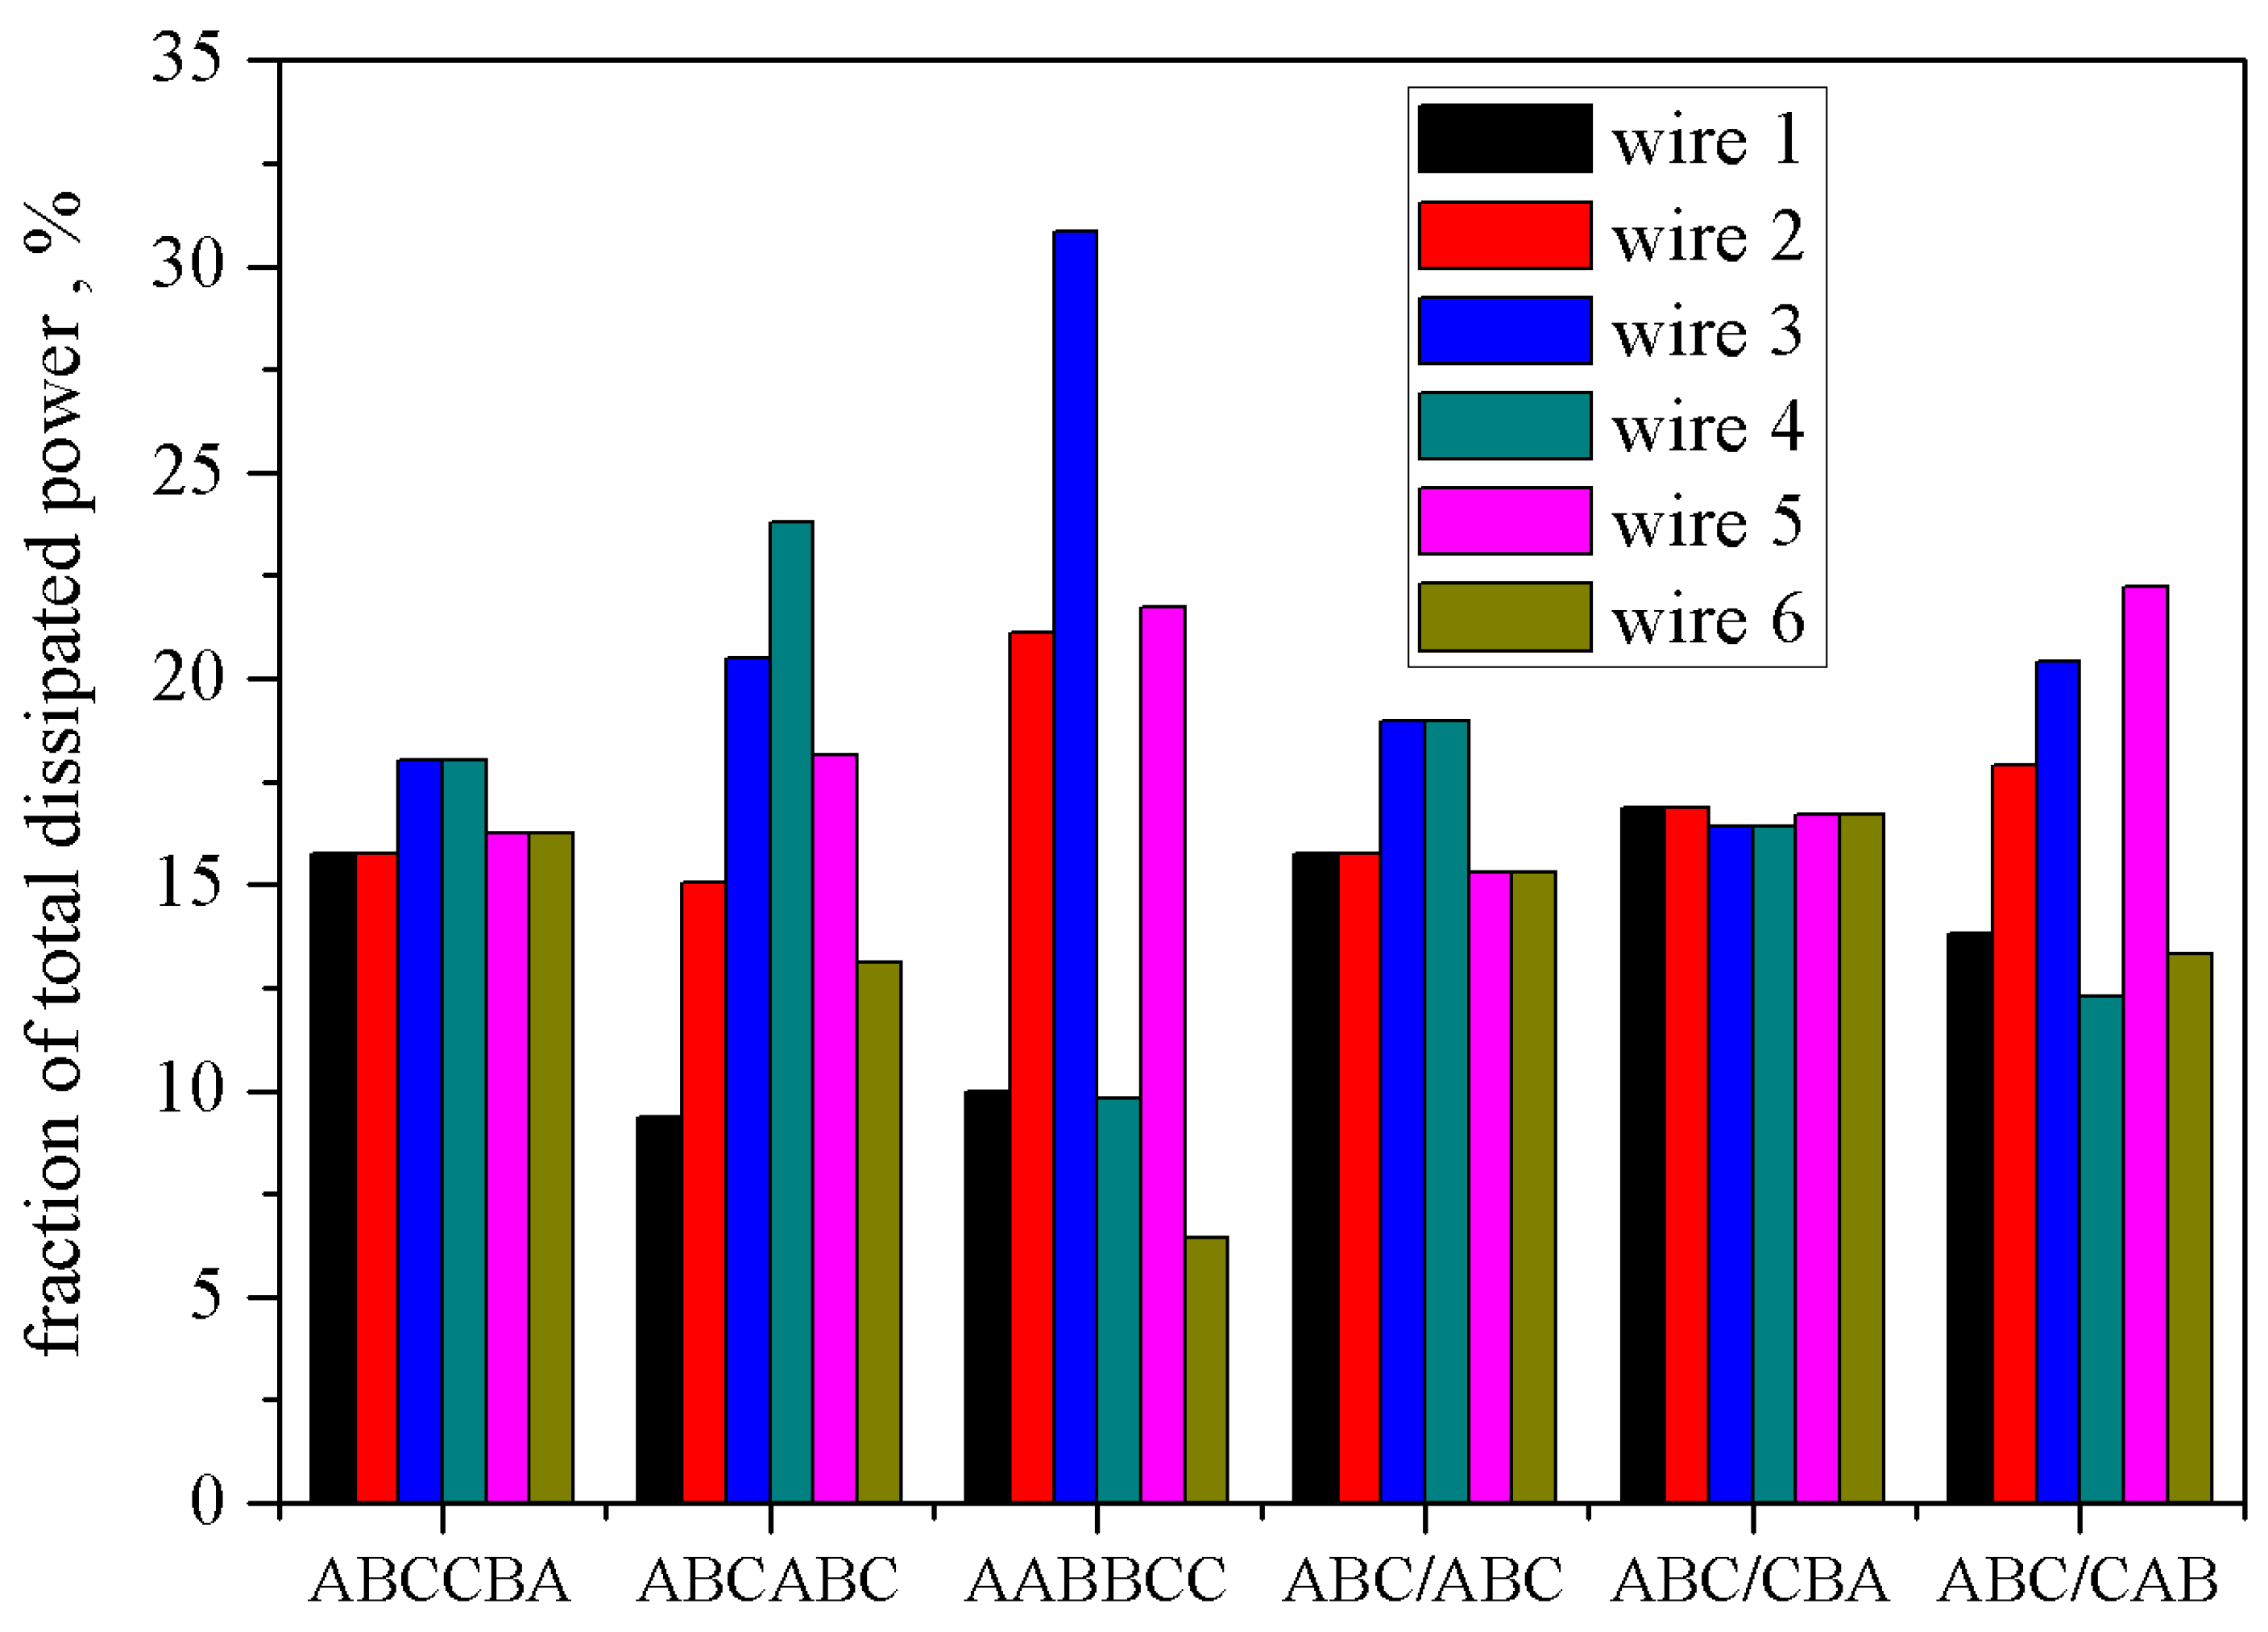
If the loss distribution shall be taken into account for individual phases, the best configuration of the six ones considered in this section shall be the layout ABC/CBA. Fractions of total loss dissipated in the wires are depicted graphically in Figure 34. Wire numbering goes from left to right for the flat layouts, for “two shelves” it is given as: wire 1–6.

5. Conclusions

The paper covers the following issues related to current distribution in multistrand cables:
  • for the single-phase excitation case, a description of experimental stand was presented and several cable configurations were considered;
  • we suggested to avail of MATLAB routines related to nonoriented graphs, in particular the adjacency function, in order to simplify the analysis;
  • a simplified relationship for determination of current distribution based on the distance of the cable to its neighbors was proposed;
  • several practical solutions found in the literature, including recommendations of the National U.S. Code and Canadian standard, were analyzed;
  • a common feature of all optimal configurations was found, namely the barycenter locations for individual phases should overlap in order to provide uniform current distribution in the strands;
  • a FEM-based verification of the proposed criterion was carried out for simple cases using the freeware FEMM software.
The proposed criterion might be useful for the designers of multistrand cable systems in order to reject some less optimal layouts quickly. It should be remarked that a final in-depth analysis of the performance of the multistrand cable systems should rely on FEM computations taking into account coupled electromagnetic-thermal phenomena. This issue shall be the subject of forthcoming research.

Author Contributions

Conceptualization, A.C. and K.C.; methodology, K.C.; software, D.K.; validation, A.C., K.C., and D.K.; formal analysis, P.J.; investigation, A.C.; resources, A.C.; data curation, K.C.; writing—original draft preparation, K.C.; writing—review and editing, A.C. and P.J.; visualization, A.C., K.C., and D.K; supervision, P.J.; project administration, K.C.; funding acquisition, K.C. and P.J. All authors have read and agreed to the published version of the manuscript.

Funding

This research received no external funding.

Conflicts of Interest

The authors declare no conflict of interest.

References

  1. Neher, J.; McGrath, M. The calculation of the temperature rise and load capability of cable systems. AIEE Trans. Part III 1957, 76, 752–757. [Google Scholar] [CrossRef]
  2. Murgatroyd, P.N. Calculation of proximity losses in multistranded conductor bunches. IEE Proc. 1989, 126, 115–120. [Google Scholar] [CrossRef]
  3. Dawson, F.P.; Jain, P.K. A simplified approach to calculating current distribution in paralleled power buses. IEEE Trans. Magn. 1990, 26, 971–974. [Google Scholar] [CrossRef]
  4. Petty, K.A. Calculation of current division in parallel single-conductor power cables for generating station applications. IEEE Trans. Power. Deliv. 1991, 6, 479–483. [Google Scholar] [CrossRef]
  5. Ghandakly, A.A.; Curran, R.L.; Collins, G.B. Ampacity ratings of bundled cables for heavy current applications. IEEE Trans. Ind. Appl. 1994, 30, 233–238. [Google Scholar] [CrossRef]
  6. Sellers, S.M.; Black, W.Z. Refinements to the Neher-McGrath model for calculating the ampacity of underground cables. IEEE Trans. Power Del. 1996, 11, 12–30. [Google Scholar] [CrossRef]
  7. Du, Y.; Burnett, J. Current distribution in single-core cables connected in parallel. IEE Proc.-Gener. Transm. Distrib. 2001, 148, 406–412. [Google Scholar] [CrossRef]
  8. Anders, G.J. Rating of Electric Power Cables in Unfavorable Thermal Environment; J. Wiley & Sons, Inc.: Hoboken, NJ, USA, 2005. [Google Scholar]
  9. Xiong, L.; Chen, Y.; Jiao, Y.; Wang, J.; Hu, X. Study on the Effect of Cable Group Laying Mode on Temperature Field Distribution and Cable Ampacity. Energies 2019, 12, 3397. [Google Scholar] [CrossRef] [Green Version]
  10. Zhu, W.W.; Zhao, Y.F.; Han, Z.Z.; Wang, X.B.; Wang, Y.F.; Liu, G.; Xie, Y.; Zhu, N.X. Thermal Effect of Different Laying Modes on Cross-Linked Polyethylene (XLPE) Insulation and a New Estimation on Cable Ampacity. Energies 2019, 12, 2994. [Google Scholar] [CrossRef] [Green Version]
  11. Rasoulpoor, M.; Mirzaie, M.; Mirimani, S.M. Calculation of losses and ampacity derating in medium-voltage cables under harmonic load currents using finite element method. Int. Trans. Electr. Energ. Syst. 2017, 27, e2267. [Google Scholar] [CrossRef]
  12. Jabłoński, P.; Szczegielniak, T.; Kusiak, D.; Piątek, Z. Analytical–Numerical Solution for the Skin and Proximity Effects in Two Parallel Round Conductors. Energies 2019, 12, 3584. [Google Scholar] [CrossRef] [Green Version]
  13. Čiegis, R.; Jankevičiūtė, G.; Bugajev, A.; Tumanova, N. Numerical simulation of heat transfer in underground electrical cables. In Progress in Industrial Mathematics at ECMI 2014, Mathematics in Industry 22; Russo, G., Vincenzo, C., Giuseppe, N., Vittorio, R., Eds.; Spring Nature: Cham, Switzerland, 2014; pp. 1111–1119. [Google Scholar] [CrossRef]
  14. Desmet, J.; Vanalme, G.; Belmans, R.; Van Dommelen, D. Simulation of Losses in LV Cables due to Nonlinear Loads. In Proceedings of the 2008 IEEE Power Electronics Specialists Conference, Rhodes, Greece, 15–19 June 2008; Volumes 1–10, pp. 785–3182683. Available online: http://hdl.handle.net/1854/LU-3182683 (accessed on 1 September 2020).
  15. Freschi, F.; Tartaglia, M. Power lines made of many parallel single-core cables: A case study. IEEE Trans. Ind. Appl. 2013, 49, 1744–1750. [Google Scholar] [CrossRef]
  16. Borowik, L.; Cywiński, A. Current-carrying capacity parallel single-core LV cable. Przegl. Elektrotechn. 2016, 1, 71–74. [Google Scholar] [CrossRef] [Green Version]
  17. Mathworks. MATLAB Toolbox for Graph and Network Algorithms; Mathworks: Natick, MA, USA, 2015. [Google Scholar]
  18. Lee, S.-Y. A cable configuration technique for the balance of current distribution in parallel cables. J. Marine Sci. Techn. 2010, 18, 290–297. [Google Scholar]
  19. Jabłoński, P.; Kusiak, D.; Szczegielniak, T.; Piątek, Z. Reduction of impedance matrices of power busducts. Przegl. Elektrotechn. 2016, 12, 49–52. [Google Scholar] [CrossRef]
  20. Wu, A. Single-conductor cables in parallel. IEEE Trans. Ind. Appl. 1984, 20, 377–395. [Google Scholar] [CrossRef]
  21. Gouramanis, K.; Demoulias, C.; Labridis, D.; Dokopoulos, P. Distribution of non-sinusoidal currents in parallel conductors used in three-phase four-wire networks. Electr. Power Syst. Res. 2009, 79, 766–780. [Google Scholar] [CrossRef]
  22. Canova, A.; Freschi, F.; Tartaglia, M. Multiobjective optimization of parallel cable layout. IEEE Trans. Magn. 2007, 43, 3914–3920. [Google Scholar] [CrossRef]
  23. Meeker, D. Available online: http://www.femm.info (accessed on 1 September 2020).
Figure 1. A destroyed cable supply system [16].
Energies 13 05923 g001
Figure 2. A photograph of the laboratory setup for examination of current distribution in the flat setup.
Energies 13 05923 g002
Figure 3. The considered cable configurations.
Energies 13 05923 g003
Figure 4. The couplings between individual strands (taken from [19]).
Energies 13 05923 g004
Figure 5. (a) An exemplary graph corresponding to model 2 or 4. (b) An exemplary list of edge connections and distances (in mm) between graph nodes.
Energies 13 05923 g005
Figure 6. Strand transposition. Own work, based on [3].
Energies 13 05923 g006
Figure 7. Separation: (a) of cables with complementary polarizations, (b) of groups of cable pairs. Own work, based on [3].
Energies 13 05923 g007
Figure 8. Spatial configurations considered by Dawson and Jain as optimal ones. Own work, based on [3].
Energies 13 05923 g008
Figure 9. Asymmetric configuration of the first kind. I 1 = I 3 > I 2 . Own work, based on [3].
Energies 13 05923 g009
Figure 10. Asymmetric configuration of the second kind. I 2 > I 1 . Own work, based on [3].
Energies 13 05923 g010
Figure 11. Optimal flat configuration suggested in [18].
Energies 13 05923 g011
Figure 12. Optimal configuration “two shelves with offset” suggested in [18].
Energies 13 05923 g012
Figure 13. Optimal configuration “two shelves” suggested in [18].
Energies 13 05923 g013
Figure 14. Optimal flat configuration (with neutral wires) suggested in [18].
Energies 13 05923 g014
Figure 15. Optimal configuration “two shelves with offset” (with neutral wires) suggested in [18].
Energies 13 05923 g015
Figure 16. Optimal configuration “two shelves without offset” (with neutral wires) suggested in [18].
Energies 13 05923 g016
Figure 17. Fully optimal configuration “two shelves without offset” suggested in [18].
Energies 13 05923 g017
Figure 18. Fully optimal configuration “two shelves without offset” (with neutral wires) suggested in [18].
Energies 13 05923 g018
Figure 19. Layouts recommended by the U.S. standard. Own work, based on [20].
Energies 13 05923 g019
Figure 20. Layouts recommended by the Canadian standard. Own work, based on [20].
Energies 13 05923 g020
Figure 21. Layouts recommended by the U.S. standard. Own work, based on [20].
Energies 13 05923 g021
Figure 22. Layouts recommended by the Canadian standard. Own work, based on [20].
Energies 13 05923 g022
Figure 23. Layouts recommended by the U.S. standard. Own work, based on [20].
Energies 13 05923 g023
Figure 24. Layouts recommended by the Canadian standard. Own work, based on [20].
Energies 13 05923 g024
Figure 25. Preliminary cable configuration] (a) and the initial current distribution (b) [21].
Energies 13 05923 g025
Figure 26. Current and temperature after system layout optimization. Own work, based on [21].
Energies 13 05923 g026
Figure 27. Configuration recommended by the authors of [15].
Energies 13 05923 g027
Figure 28. Current densities for the flat ABCCBA configuration.
Energies 13 05923 g028
Figure 29. Current densities for the flat ABCABC configuration.
Energies 13 05923 g029
Figure 30. Current densities for the flat AABBCC configuration.
Energies 13 05923 g030
Figure 31. Current densities for the ABC/CBA configuration.
Energies 13 05923 g031
Figure 32. Current densities for the ABC/CAB configuration.
Energies 13 05923 g032
Figure 33. Current densities for the ABC/ABC configuration.
Energies 13 05923 g033
Figure 34. Loss distribution in individual wires for the configurations depicted in Figure 28, Figure 29, Figure 30, Figure 31, Figure 32 and Figure 33.
Energies 13 05923 g034
Table 1. Current of individual strands—summary for the maximal attainable excitation current.
YAKY 1 × 70YAKY 1 × 240
M1M2M3M4M5M6M7
S1116 A138 A94 A104 A66 A128 A148 A
S2104 A128 A84 A94 A66 A106 A126 A
S398 A126 A76 A86 A66 A76 A86 A
S492 A128 A70 A92 A66 A67 A122 A
S598 A140 A72 A104 A66 A76 A146 A
S6102 A 84 A 68 A108 A
S7116 A 106 A 66 A128 A
EXCITATION726 A660 A586 A480 A465 A689 A628 A
Table 2. The values of asymmetry coefficient for two values of excitation current.
PHYSICAL MODEL
M1M2M3M4M5M6M7
CAS1.261.111.511.201.001.911.69
CAS for 200 A1.281.131.501.131.001.501.50
Table 3. The percentage error values for the maximal attainable current values.
ConfigurationPercentage Error for Current
S1S2S3S4S5S6S7
M117.22.0−10.7−14.3−10.72.017.2
M219.0−7.9−21.0−10.316.3
M3−16.9−0.3−10.5−10.3−5.5−0.33.7
M419.0−7.9−21.0−10.316.3
M500000−3.00
M60.9−7.25.210.25.2−8.90.9
M76.0−12.89.5−9.97.5
Table 4. The current percentage values in individual phases (flat configurations).
ConfigurationPhase APhase BPhase C
A1A2B1B2C1C2
ABCCBA50%50%50%50%50%50%
ABCABC38%62%48%53%57%46%
AABBCC46%61%78%37%64%36%
Table 5. The current percentage values in individual phases (“two shelves” configurations).
ConfigurationPhase APhase BPhase C
A1A2B1B2C1C2
ABC/ABC50%50%50%50%50%50%
ABC/CBA50%50%50%50%50%50%
ABC/CAB47%54%57%43%60%46%
Publisher’s Note: MDPI stays neutral with regard to jurisdictional claims in published maps and institutional affiliations.