Article

Characteristics of Aerosol Formation and Emissions During Corn Stalk Pyrolysis

1
School of Agricultural Engineering and Food Science, Shandong University of Technology, Zibo 255049, China
2
Shandong Research Center of Engineering and Technology for Clean Energy, Zibo 255049, China
*
Author to whom correspondence should be addressed.
Energies 2020, 13(22), 5924; https://doi.org/10.3390/en13225924
Submission received: 7 October 2020 / Revised: 11 November 2020 / Accepted: 11 November 2020 / Published: 13 November 2020
(This article belongs to the Section B: Energy and Environment)

Abstract

:
The inevitable emission of aerosols during pyrolysis can negatively affect the downstream process and even pollute the environment. In this work, the characteristics of aerosols were investigated during corn stalk pyrolysis at 400–900 °C. The effects of other operation conditions on the aerosol emissions were also probed with online and offline instruments. Results show the yield of aerosol presents a regular change with temperature in a wide range ratio of 3.4–8.7 wt.%. The aerosol size distribution reveals a unimodal form mainly in the 1.1–2.1 μm accumulation range and the maximum emission achieved is about 35 mg/g for SR and SP at 500 °C. Nevertheless, SL gives about 34 mg/g at 600 °C. High temperature promotes the decomposition of polymers into partciles with small diameter (less than PM1.0). The microtopography of aerosol presents spherical droplets, elongated-like liquid and solid particles that form heterogenous or homogeneous aggregations, that also happen on account of collisions. Aerosols contain mostly organic matter, a small amount of salt and over 50% of volatile organic carbon molecules (VOCs) in the total organic carbon (OC). Proper gas flow, high vapor concentration and longer path way boost the yield of bio-oil and reduce the emission of aerosols. The direct contact is beneficial for adequate extraction, but also causes additional solvent emissions.

1. Introduction

Biomass-derived fuels are recyclable, abundant, multiduty and CO2 neutral energy sources that amount to approximately 10 times the world’s current energy consumption (1.08 × 10¹⁰ tons of oil/year) [1,2] and half of that amount can be sourced from lignocellulosic wastes [3]. Faced with such vast resource reserves, simple and inefficient household combustion is the initially dominant mode for cooking and heating [4]. To promote the utilization value and extend service life, many technologies [5,6,7] were created and invented in recent years, especially for thermal chemical conversion in a broad field of techniques including pyrolysis liquefaction and gasification that provide solid (char), liquid (oil) and gas products, which can be used as biofuels, high value chemicals and carbon materials [8,9]. For any of the above, production of the target is usually accompanied by additional problems, i.e., impure products, interruption of equipment operation and high investment and therein, the formation and emission of persistent aerosols is an inevitable aspect [10]. Usually, aerosols are transported into the downstream process steps by non-condensable gas and then cause corrosion and deposition on the surface of equipment that accelerates the damage to facilities and reduces the quality of the bio-oil and synthesis products [11] which increases the demand for removal equipment [12]. Simultaneously, if not properly handled, the emitted aerosols are also considered to be a vital source of environmental pollution and harmful to health on account of the respiratory deposition of fine particulate matter [13,14].
Generally, aerosols are also basically termed as particulate matter (PM, i.e., PM2.5 and PM1.0), and include solid particles that consist of soot (called “black carbon” or BC) and fine char; condensable organic carbon compounds (COC), also called organic droplets or brown carbon (BrC); ash constituents, made up of inorganic elements and toxic gases, such as NOx, SO2 or NH3 [15,16]. Temperature is the critical factor in the thermal treatment for the release of inorganic elements and bond-breaking of organic polymers that determines the formation of primary aerosols. Other operational factors, such as gas media, raw materials and devices used, e.g., reactors or condensers, also affect the interactions and evolution of particle growth. A number of studies have been performed to identify and evaluate the characterization of PM in biomass combustion or high temperature pyrolysis (>1000 °C), via particle size, concentration, morphology and chemical composition of the aerosols that are important criteria for their subsequent elimination and evaluation of their potential influence on the environment and human beings [17]. Soot is a health-threatening substance formed during organic matter pyrolysis or incomplete combustion by the dehydrogenation of polyaromatic hydrocarbons (PAHs). The spherical primary particulates were further agglomerated to cluster-like particles [16] that has strong light absorption to reduce the intensity of surroundings [18]. Yan et al. [19] and Wang et al. [20] investigated the evolution of PM2.5 in an entrained flow reactor. When wheat straw was pyrolyzed at high temperature (900 °C–1300 °C), generated PM2.5 is at the range of 0.7%–3.4% and at >1000 °C, the main phase composition evolved from carbonaceous matter to more obstinate soot that varies from 10 nm to 180 nm. The longer the residence time of volatile is, more PAHs and soot can be formed on account of secondary reaction. Patiño et al. [16] also found the primary soot diameter of about 20 nm, similar to the above. The cluster growth of fine particle collision happens in the compaction inside the facility. As the precursor of soot, the condensable organic compounds of PAHs also presents strong toxicity, especially for the benzo(a)pyrene [21]. Schmidt et al. [22] investigated the influence of washing pretreatment on gas and particulate emission that shows distinct reduction of PAHs (96%) such as benzene, toluene and trimethylbenzene and it has an important inhibitory effect on the toxic gas and total suspended particles. The appropriate proportion between primary and secondary air is essential to control the emission of particulate matter and higher content of later caused rapid removal of fine particle from combustion zone that the emission factor of 0.47–10 μm was generally improved [23]. Inorganic elements usually released through the salts steam or ash entrained by gases, and at high temperature (>800 °C), low molten AAEMs easily reacts with silico-aluminate oxides to stable compounds [24]. Morgalla et al. [25] in a bubbling fluidized bed gasification-combustion furnace found that the homogeneous nucleation of heavy tars or the condensation of alkali nuclei is responsible for the fine mode (15 < dae < 140 nm); mentioned above fine particles further experience the collision and aggregation to be the intermediate mode (140 < dae < 670 nm); nevertheless, ashes, char and bed materials are entrained by gas in the dynamic diameter of dae > 670 nm. Nevertheless, in the inert atmosphere and 400 °C–900 °C, inorganic elements significantly released and transformed in the inherent char. Less than 700 °C, less AAEMs was stable in the char and at 900 °C, more than 80% AAEMs released from char. The presence of CO2 atmosphere obviously promotes the release of K about 5% via further reaction with char, but it has a little effect on the release of Ca and Mg. It is the main release route that the cracking of oxygen-containing functional group and the direct evaporation [26,27]. Yang et al. [28] studied characteristics of particle matter during the gasification of Na-rich char. The Na and Cl species govern the quantity and morphology of PM. Higher temperature and water-washing treatment are beneficial to particle growth in the range of 0.6–1.2 μm. Generally, the release of AAEMs is calculated by the balance of before and after experiment and authors focused more on the interaction and transformation inside the bio-char. However, the transportation and distribution of AAEMs released is still ambiguous in different products.
A limited amount of researches have investigated the aerosol emission of pyrolysis at mediate temperature. Organic aerosol is the most common and predominant substance. Even though in combustion process, the ratio of organic carbon in emitted carbonaceous aerosol has exceeded to 50% [29]. Teixeira et al. [30] and Dauenhauer et al. [31] used high-speed photography and laser diffraction light scattering to have a visualization of microcrystalline cellulose pyrolysis. The primary liquid immediate forms and subsequent degradation occurs to vapors and non-condensable gas. After bubble ruptures on the melt cellulose, nonvolatile oligomers were entrained accompanied with inorganic elements. The primary aerosol existing in the range of 10–200 nm in diameter and about 3% of raw material emitted at 500 °C. In the process of flow and condensation, aerosol particles grow up consecutively owing to the collision and aggravation. It usually consists of volatile and non-volatile compounds. Jendoubi et al. [32] has got the aerosol yield of 26.2% and 13.3% for beach wood and straw pyrolysis, respectively, supported by ESP. Even, Iisa et al. obtained more than 40% aerosol oil [10]. ESP and oil mist separator are efficient to capture the aerosol less than 10 μm and reduced the concentration for all range diameter. The composition of aerosol fraction is comprehensive which were richer in lignin derivatives, anhydrosugars and small cellulose-derived oxygenates such as carbonyls compared with oil. Ko et al. [33] investigated the effects of gas flow and heating rates on PM emissions. PM generation varied from 1.14 wt.% to 6.33 wt.% with increasing temperature and high gas flow rates result in larger aerosol formation.
As the initial and retreatment stage of gasification and combustion or for liquid fuel [32,34,35], pyrolysis plays an important role in the primary formation and further evolution of aerosols under different parameters that directly impact downstream and even the subsequent utilization. However, there is a lack of literature to comprehensively study the characterization of aerosol from pyrolysis vapors release to condensation process. The objective of this paper is to probe characteristics of aerosol via analysis of mass-based and number-based size distribution, morphology, inorganic element distribution and organic and elemental carbon (OC/EC) during the rich AAEMs of annual straw pyrolysis at 400–900 °C. To avoid the entrained of fine char particle, a fixed-bed reactor was utilized to purely study of the formation of aerosol. Simultaneously, the effect of condensation way, gas flow and mass of feedstock per reaction on the aerosol emission are also investigated.

2. Materials and Methods

2.1. Materials

Because different fractions of corn stalk have various texture structures, constitutions and compositions, a manual stripping treatment was carried out for neutrally dried raw material in season. Then, three tissues, including stalk rind (SR), leaf (SL), stalk pith (SP), were crushed and sieved in the 0.18–0.25 mm range. The SR and LE present acicular and powdery forms, respectively. However, SP shows more laminary tissue and less filiform tissue (see Figure S1 in the Supplementary Data). After drying at 105 ± 1 °C for 12 h in the thermostatic air-blower-driven drying oven, samples were kept in an airtight bag. The ultimate analysis (GB/T 20731-2012) and proximate analysis (Vario EL Cube, Elementar, Waldbronn, BW Germany), inorganic composition (700 series, Agilent Technologies Inc., Langenselbold, CA USA) and chemical composition (A200i, ANKOM Technology, Macedon, NY, USA) are shown in Table 1. Obviously, the basis properties of corn stalk reveal significant differences. Hence, it is necessary to investigate the thermal behavior respectively that can help to obtain precise information about aerosols.

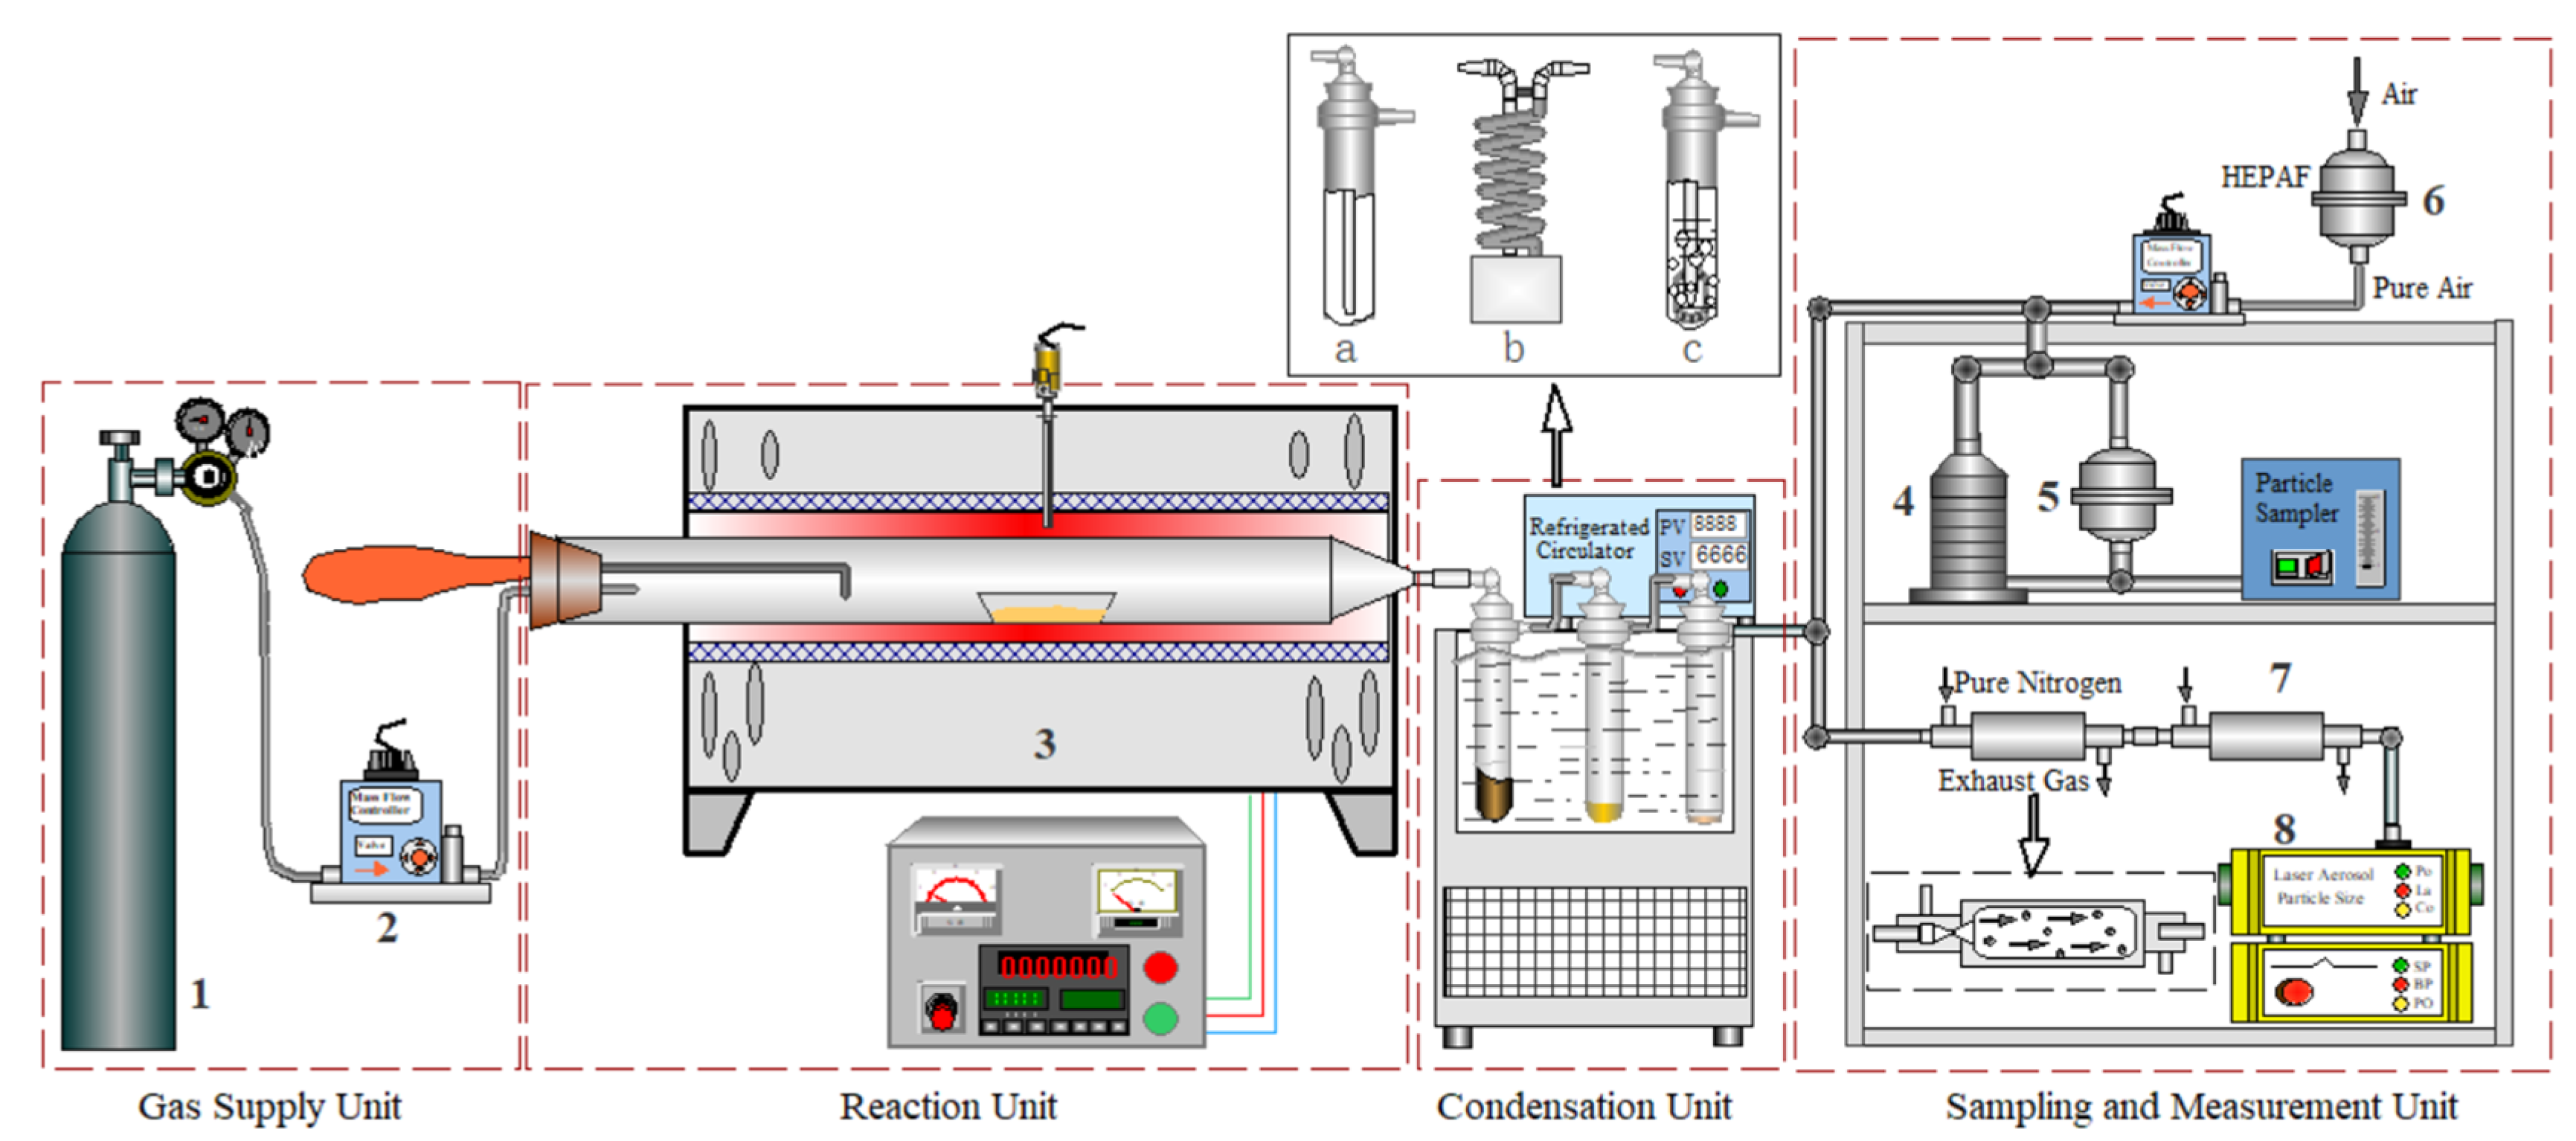
2.2. Experimental Process

A detailed and vivid description of experimental system was shown in the schematic construction of Figure 1. It fundamentally consisted of four parts: gas supply unit, reaction unit, condensation unit, sampling and measurement unit. Among, to guarantee the accuracy of experiment, nitrogen (99.99%) (1) and mass flow meter (2) were used. An electric resistance furnace-pipe with a horizontal working chamber (SK2-4-138) equipped with a programmable temperature regulator (KSY-6D-16) (3) was carried out which was produced by the YaHua Experimental Electric Furnace Co., Ltd. (Wuhan, China). The reactor tube and boat were made of quartz (60 mm inner diameter × 950 mm length; 50 mm inner diameter × 95 mm length, respectively). To facilitate the sample taken and set rapidly, an elastic device with a push rod was installed. Three-stage condensers in series were selected to collect bio-oil and three different condensers were applied that was direct tube (a) and helical tube (b) as indirect heat transfer and steam bubble as direct condensation (c). In the indirect condenser, low-boiling point and high absorption of methanol was used to extract the condensable components. The aerosol collection and analysis apparatus include Anderson impactor (4), particle size spectrometer (8) and aerosol filter (5) for particulate capture. All pyrolysis experiments were operated in a mass flow of material 0.5 g or 1.5 g at the range 400–900 °C and at 0.2 Standard Liter per Minute (SLM), 1 SLM and 2 SLM of nitrogen. When temperature reached the set value, reaction chamber was purged by nitrogen for 5 min. Then, feedstock was rapidly pushed into heating zone and vapors were taken along with carrier gas into condensers.

2.3. Sampling Characterization

An Anderson eight-stage cascade impactor with 81 mm diameter glass fibre membranes was performed to distinguish the mass distribution of different dynamic diameter of aerosol at a flow rate of 28.3 dm3·min−1. The stage number corresponds to the size range as follows: 0—9.0~10.0 μm, 1—5.8~9.0 μm, 2—4.7~5.8 μm, 3—3.3~4.7 μm; 4—2.1~3.3 μm; 5—1.1~2.1 μm; 6—0.65~1.1 μm; 7—0.43~0.65 μm and 8—<0.43 μm. A quartz filter (Ø 81 mm, MK360) was the collection of total particle matters of aerosol that is more efficient for above 0.2 μm. Before sampling, glass filter and quartz filter were pre-treated at 350 °C and 550 °C, respectively, under the atmosphere for 5 h that can remove the organic matter and excess moisture. Owing to the lack of gas flow from reactor, the efficient filtration of air of HEPAF is necessary to maintain the demand of additional gas supplementation and avoid the interference of experiment results.
After each sampling, part of filter cut by Teflon scissors was used to afterwards analysis. Scanning electron microscopy and energy dispersive spectrometry (SEM-EDS) (EFI, Quanta 250 FEG, Waltham, MA USA) was used to observe the micromorphology of aerosol and elements distribution. The quantification of AAEMs released to bio-oil and aerosol was also determined by inductively coupled plasma optical emission spectrometer (ICP-OES) (700 series, Agilent Technologies Inc., Langenselbold, CA USA) coupled with acidic digestion that consists of 3 mL HNO3 and 2 mL HF. To maintain the accuracy of experiment, vessel was rinsed more than 3 times with HNO3 after every time of liquid transfer and ultrasonic oscillations are used. Finally, all extracts were filtered by a 5 mL syringe filter with 0.2 μm pore size and acid removal and dissolution of deionized water to the mass of approximately 50 g.
Organic carbon and element carbon (OC/EC) in PM samples were analyzed using a Thermal and Optical Carbon Analyzer (Model 5L, Sunset Laboratory Inc., Tigard, OR USA). For the comparability of results, sample for each test is a membrane filter of 10 mm × 10 mm. Due to the existence of volatile organic compounds (VOCs) in the total OC matter, it can lead to the secondary pollution and further reaction. Based on before researches [33,34], VOC could be removed at 170 °C under an inert nitrogen atmosphere. VOCs and non-volatile organic compounds (NVOCs) in OC matter can be divided to discuss the composition, evaluate the influence and have the insight of the emission characteristic.
To avoid the concentration of aerosol exceeding the detection limits and reduce particle coagulation, aerosol was first diluted by injecting overflow of nitrogen in two-staged diluters (7). Before sampling, nitrogen sweeps off the residual aerosol of diluter for 2 min. And then, the quantitative concentration of aerosol was detected by particle size spectrometer (LAP-322, TOPAS-GMBH, Dresden, SE Germany). After experiment, cleaning gas was continuously supplied.
The yield of release volatile matter, oil and aerosol was calculated by mass balance and the raw material, bio-char, condenser and filter were separately weighed before and after experiments. However, due to the eruption of bubbles on the liquid surface, a portion of the solvent becomes fine droplets mixed with aerosol to be transported into aerosol phase, so in the direct condensation experiment, so 20 mL of methanol was inserted in the last two condensers and a perforated hat was installed for the more amount and smaller diameter of bubbles produced that can promote the condensation effect. After each experiment, the thermal treatment in an inert atmosphere at 70 °C eliminates the mixed methanol for the sample complete or hierarchical filter. All above detections were repeated for three times and averaged.

3. Results

3.1. The Thermal Conversion and Particle Size Distribution at Different Temperature

Figure 2 reveals the total mass loss ratio, bio-oil and aerosol yield of different tissues at 400–900 °C. With temperature increase, the ratio of volatile release rises at a similar linear rate and have a growth ratio of over 20%. Compared with SR and SL, the mass loss of SP presents a distinct variation at relative temperature and reaches approximately 91 wt.% at 900 °C. However, SL and SP reveal similar curves and the yield of the former is slightly lower than the latter. More loose structures and shallower longitudinal thickness (SP > SR > SL) are responsible for the thermal decomposition. Accordingly, it is advantage to the release of vapors in a short time. Hence, the yield of bio-oil and aerosol show corresponding trend that climbs up and then declines with temperature increase. The bio-oil yield of SR and SP are the most, separately 39.6 wt.% and 41.7 wt.% at 500 °C. Nevertheless, at 600 °C, the yield of bio-oil of SL is the maximum of 36.1 wt.%. Compared with bio-oil, the content of aerosol is relatively low at the range of 3.4 wt.% and 8.8 wt.%. Jendoubi et al. [32] obtained more than 13 wt.% aerosol yield in a fluidized bed reactor and the high speed of carrier gas was responsible for that. Oppositely, Teixeira et al. [30] studied the aerosols emitted in a vertical reactor and obtained data indicating approximately 3 wt.% organic and inorganic aerosols were transported into gas phase.
The particle-size mass distribution of aerosols emitted at different pyrolysis temperatures was contrasted and is presented in Figure 3. Generally, aerosols can be divided into Aitken mode (<50 nm), accumulation mode (50–2000 nm) and coarse mode (>2000 nm). It is revealed that the size distribution in different tissue pyrolysis products shows a similar trend with unimodal form. The smaller diameter particle accumulation mode is dominant and especially for the 1.1–2.1 μm, at 500 °C. SR and SP have the high mass as 35.58 mg/g and 35.45 mg/g, respectively. However, for SL, a yield of 34 mg/g was obtained. A coarse mode aerosol fraction can exist too. The distribution of coarse mode is concentrated in the 2.1–3.3 μm range. The aerosols between 3.3 and 10 μm shows a lower yield and with temperature increase, it maintained a relatively stable value of about 5 mg/g. As the temperature rises, the amount of accumulation mode aerosol, even for the fine particles, continuously rises. At 900 °C, the percent of SL aerosol reached to 89 wt.%, while during SR pyrolysis, it is approximately half of the total particulate matter (48.8 wt.% at 400 °C).
As can be seen from Figure 4, the proportions of different sized aerosol change with rising temperature. Overall, before 5 size-staged as >1.1 μm, there is a downward trend in the mass ratio that appears a tendency to accumulate as ultra-fine particles. At a medium temperature (≤700 °C), especially for the SP, a significant transition from coarse mode to accumulated mode is revealed. At higher temperature, the percent of aerosol in the range lower than 2.1 μm was obviously increased. Especially for SL, the percent of aerosol in the range of 0.65–1.1 μm increases by about 30%, whereas, at 0.43–0.65 μm, the content of aerosol continues to grow at a modest pace and changes from 6% to 13%. Perhaps a high particle number concentration per volume is responsible for the possibility of collisions that directly lead to the primary formation and distribution of aerosols. The number concentration of aerosols in Figure 5 represents the corresponding trend with the mass distribution. A more nuanced distinction is detected based on the wide range of the mass size distribution. Simultaneously, two smaller peaks also occur in the range of 0.2–1.0 μm and 3.0–4.0 μm. Through the pretreatment with two-staged diluter, the measured number was 80,000 at 500 °C for SR; that is 111,000 at 600 °C for SL; and that is 133,000 at 500 °C for SP. The dominant range of 1.1–2.1 μm of mass-based aerosol approaches the smaller diameter limit of about 1.1 μm. The high ratio of volatiles to gas enhances a larger formation of aerosols. Hence, the whole number concentration of aerosols is higher in the range of >2.0 μm. Emissions of submicron aerosols can deposit in the lungs by breathing and can even enter the blood circulation system of human beings that results in health problems [36]. Yao et al. [36] compared the particulate emissions from gasification and pyrolysis at 500–700°C. Particulate matter emitted from both processes was mainly at the size range of 0.25–1.0 μm and 1.0–2.5 μm and with increasing temperature, the particulate concentration increased continuously and particulate matter emitted from gasification was 1.1 times more than that from a pyrolysis process [36].

3.2. The Morphologies and Compositions of Aerosols Produced during Biomass Pyrolysis

For the other material, the color variance and micromorphology show a similar trend and thus can be represented by the analysis of SL aerosols. As it is seen, aerosols captured by a quartz fiber filter reveal coloration dependence with temperature increase that ranges from faint yellow to dark brown. Compared with the yield of aerosol shown in Figure 2, the composition of aerosol is responsible for the color variation. The bottom of Figure 6 presents SEM images of aerosols emitted at 700 °C and 900 °C. Three different diameter of fiber were visible: small (~0.15 µm), medium (~0.5 µm), and large (~1.2–2.5 µm) and they were interlaced and maintain the trapping effect for particulate matter [37]. At a low temperature, aerosols show a number of different dynamic droplet diameters. Parts of them show a bead-like form strung on fine fibers like spot 1 to spot 3. Others appear elongated-like and even an irregular fluid on the coarse fibres or the intersections of fibre like spot 4 and spot 5. At a higher temperature, aside from the original aerosol, inorganic particles can also be seen for a high level content like (2) that adheres on the surface of fibre. From the enlarged photo of the selected regions shown in (3) and (4), spot 1, the bead droplets of spot 1, spot 2 and spot 3 are double-decked, which was caused by the collision of homogeneous organic aerosols. Moreover, like spot 6, the aerosol mixture of inorganic and organic matter impacts on the fibre and the fluidity of droplets leads to the exposure of the droplet surface. These heterogeneous aerosols may be caused by the collision of inorganic salt and organic droplets and go through an annexation process that results in a nucleus of inorganic salt that becomes encircled by organic droplets. Simultaneously, a deeply embedded aerosol was also found and the crisscrossed fibers guarantee that aerosols over 0.2 μm in size can be efficiently captured. In the right column of Figure 6, like spot 7, abundant cubic KCl crystals of uniform size deposited on the surface of fibre can also form a coarse mode which primarily come from the salt steam release during the char pyrolysis stage. Spheroidal particles also occur and a few mounds of NaCl appear mixed in the agglomerate matter. Likewise, in the bottom-right column, like spot 8, the formed mixture was made up of an organic aerosol and inorganic matter during the devolatilization stage. The EDS shows the high content of AAEMs and oligomers consisting of C and O. High viscosity organic aerosols hold the AAEMs firmly on the surface of the tube that aggravates the deposition and corrosion.
Table 2 shows the mass of OC and EC per square centimeter from the aerosol from a 1.5 g feedstock pyrolysis. As the temperature increases, the mass of OC plays an important role in the medium temperature (500 °C) range. In the whole pyrolysis, the emission of EC is relatively low compared with biomass combustion [23]. At 900 °C, the masses of EC are 8.44 μg·cm−1, 4.78 μg·cm−1 and 2.11 μg·cm−1 for SR, SL and SP, respectively. Due to the broken bonds of organic macromolecules, the molecular weight varies greatly and small molecular weight VOCs are unstable based on the temperature, concentration and saturation pressure [33] and are easily transported by non–condensable gas. At low pyrolysis temperatures, the formation of small molecules leads to a high emission of VOCs and at 500 °C, the VOCs of SR and SL are about two times higher than NVOCs. However, the content of VOCs in SP is almost the same amount compared with NVOCs. On the contrary, there is no obvious increase in the content of NVOCs, but the content of VOCs shows a steep decline, especially for SP pyrolysis where it is only 35.85 μg·cm−1. The small molecules further break and react to escape to the gas. The high content of gas affects the primary aerosol formation that determines the transformation of aerosol with gas. BC has a strong absorption at visible wavelengths that is important for radiative forcing from solar energy, whereas OC like BrC have an impact on the absorption of radiation at low-visible (blue) and ultra-violet (UV) wavelengths [35], but it contains a large group of organic compounds and the absorption varies [34]. There is no definite way to measure it [34,38], so it also further promotes the complicated impact on the environment and difficulty of evolution.
The existence of inorganic matter has a far-reaching influence from the decomposition of polymers to the release and incorporation of particles during aerosol migration. In a fixed bed reactor, there are no collisions between char and the fluidizing medium, hence the transportation of fine particulate matter can be ignored. As can be seen in Table 3, more AAEMs are released with rising pyrolysis temperature. There are some researchers who have reported that the combination of AAEMs with -COO- [39,40] or low-melting point salts such as NO3 is the main factor [41], but due to the dense structure and secondary reactions, AAEMs are stable in the bio-char and the original occurrence mode plays a decisive role in the course of aerosol release. At ≥700 °C, it is released in the form of salt steam as Cl and Mg and Ca can be emitted by way of broken bonds in oxygen-containing functional groups. Vitally, the small size and open structure weaken the release constraints and the possibility of secondary capture on the bio-char surface [42]. At 500 °C, there is a small amount of AAMEs release and Ca and Mg in the SR and SL are stable inside the char. At 900 °C, more content of AAEMs can be detected in aerosols and bio-oil. For SP, there is about 2428.5 μg·g−1 and 10,928.0 μg·g−1 for K, 28.1 μg·g−1 and 77.6 μg·g−1 for Na, respectively. Moreover, the Ca and Mg content in bio-oil and aerosols can be measured as 304.3 μg·g−1 and 640.3 μg·g−1, 243.8 μg·g−1 and 585.4 μg·g−1, respectively. An obvious phenomenon can be found that aerosols contains more content of migrated AAEMs than that in bio-oil, especially at the main release temperature of AAEMs. This is responsible for the fact that the release time of vapors and inorganic matter do not coincide completely. The former occurs during the devolatilization stage, while the latter mainly happens in the char decomposition stage. A high concentration of organic aerosol droplets can be beneficial to help the aggregation for the nucleation of inorganic crystals that can be mixed in bio-oil. However, in the bchar pyrolysis stage, a greater distance between aerosols reduces the possibility of collisions and no organic or inorganic matter can easily escape from the condenser to the gas phase in the form of suspended aerosols.

3.3. The Effects of Gas Flow, Mass of Feedstock and Condensation Method on the Balance of Bio-Oil and Aerosols

To obtain high yield and better quality of liquid or gas, an excellent and sufficient condensation is equally important as a quick purge flow. At present, indirect and direct cooling are the two main ways used to collect the vapors [43]. Indirect cooling like fractional condensation can separate the bio-oil by boiling point to obtain different types of chemicals. On the basis of the different structures of designed condensers, Allihn condensers and spiral condensers as two typical condensers have different advantages: the Allihn condenser has a wide pathway that avoids the blockage caused by the high viscosity of bio-oil and particles, but straight tube structure takes up more space [44]; spiral condensers have longer travel time and sufficient vapor contact time that provides a good cooling capacity. However, the slender and revolving tube increases the difficulties of clean-up [45].
Direct condensation has a higher heat exchanger efficiency due to the contact between vapor and the cooling medium, so different gas flows, feedstock masses and condensation methods were investigated to reveal the influence on the bio-oil and aerosol distribution. Figure 7 shows the effect of different gas flows on the distribution of bio-oil and aerosol.
At a low gas flow (about 0.2 SLM), the yield of bio-oil and aerosol presents an obviously depression, especially for aerosol. The slow gas cannot be discharged in time and a proportion of it such as macromolecular matter happens to cool before entering the condenser. At 900 °C, much more gas was generated and aerosols were diluted to be in a stable condition. High gas flow about 2 SLM sweeps up the vapors out of the reaction zone so the total collected vapors gives a similar yield but more content of aerosol was emitted outside. However, the longer spiral condenser captures more vapors as bio-oil and a little amount of aerosol is emitted, especially for a high instantaneous concentration of volatiles. As for SR, SL and SP, the maximum reduction ratios are 2.3 wt.%, 1.8 wt.% and 3.3 wt.%, respectively. With increasing temperature, the influence is weakened by the generation of more non-condensable gas that initially widens the aerosol spacing. In each experiment, more feedstock was pyrolyzed that leads to more concentration of vapors and meets the saturability condition. The high possibility of collisions between aerosols causes the fine particles to transfer to the accumulation or coarse mode. More bio-oil and aerosols can be obtained which is maybe caused by the collision of ultrafine particles to grow larger droplets. Hence, the yield of bio-oil increases distinctly about 4 wt.% at 500 °C during SP pyrolysis. Compared with the reduction of gas flow, the promoted feedstock ensures a higher yield. As can be seen in Figure 8, organic solvent extraction is an excellent way to capture the organic substances. Compared with indirect condensation, there is a reduction ratio about 1.5 wt.% at 500 °C during SR and SP pyrolysis. Although efficiency in the collection of vapors was achieved, high emissions of solvent were also caused by the high carrying capacity of bubble formation. The longer the time of gas flow, the more content of solvent was carried out, as shown in Table S1. At 900 °C, there is a 1.1–1.5 wt.% increase for SR, SL and SP pyrolysis. Volatile methanol perhaps forms nanoscale ultrafine particles that bring up another removal problem by the traditional method.

4. Conclusions

The characteristics of aerosols formed from different tissues during corn stalk pyrolysis were investigated at 400–900 °C in a fixed bed reactor. Likewise, the effects of other conditions on the emission of aerosols were studied, including the carrier gas flow rate, feedstock mass and different condensers. Based on the information of size concentration, microtopography and composition, the following main conclusions can be drawn:
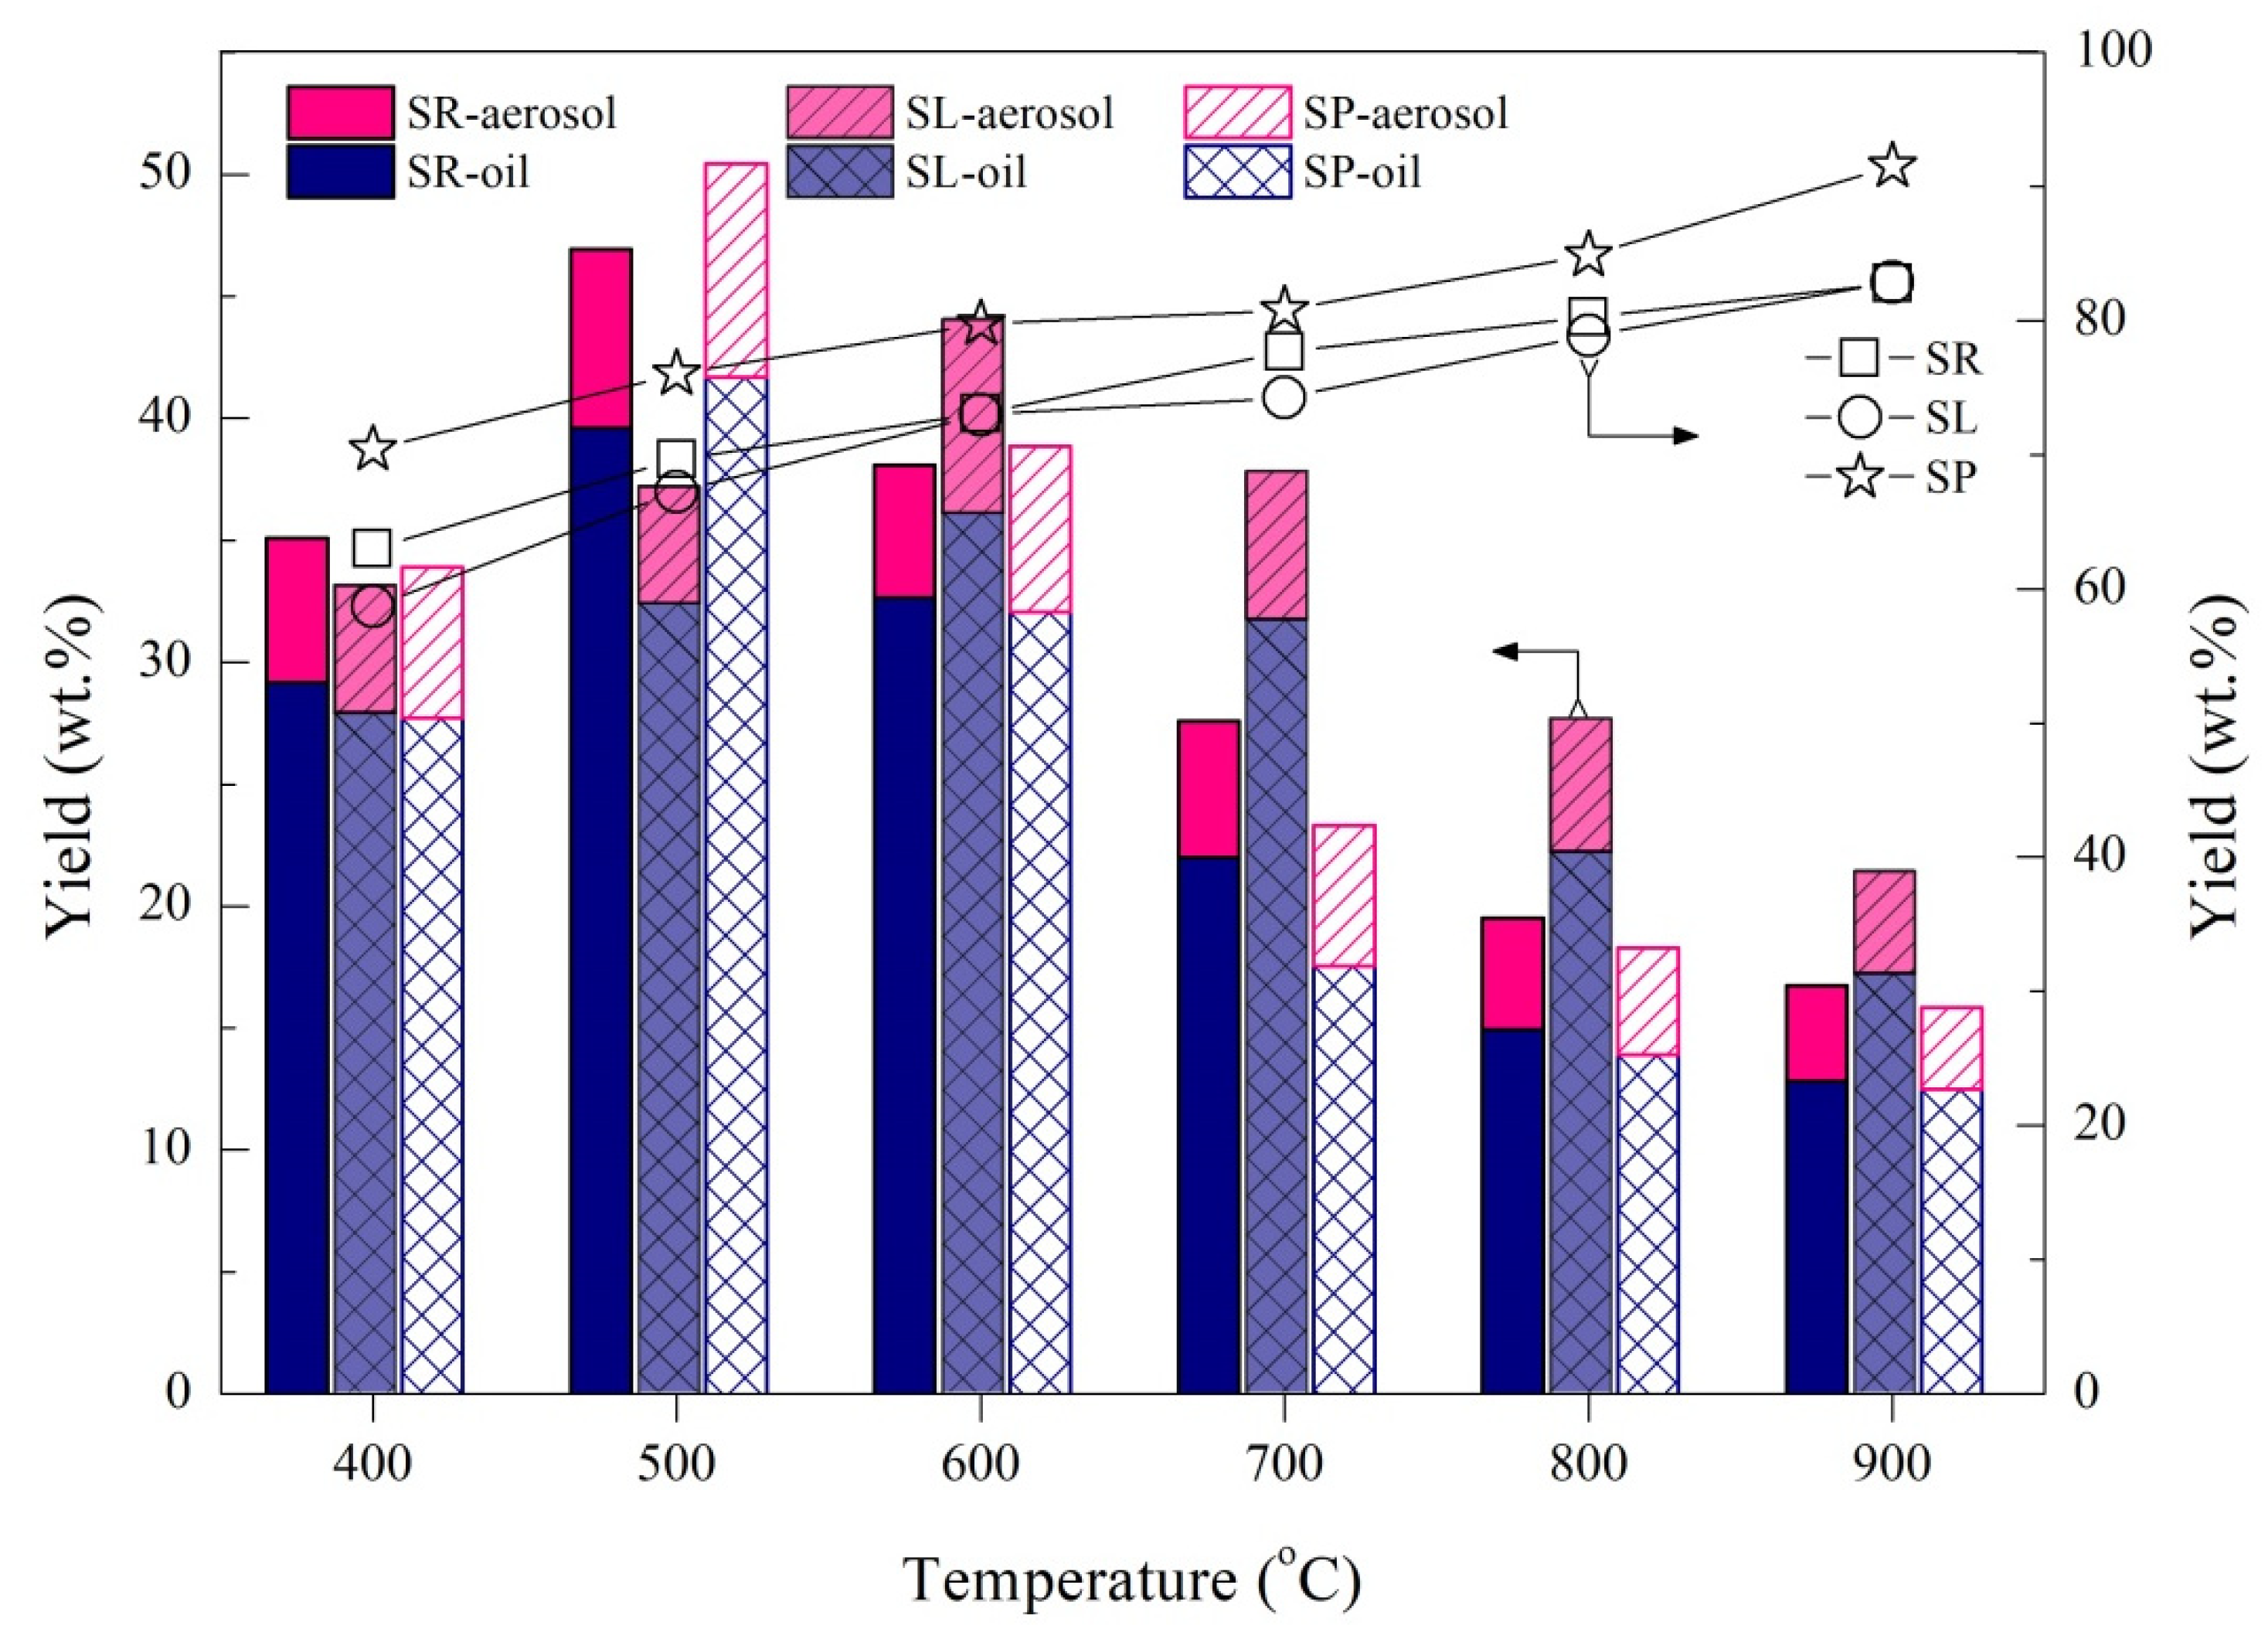
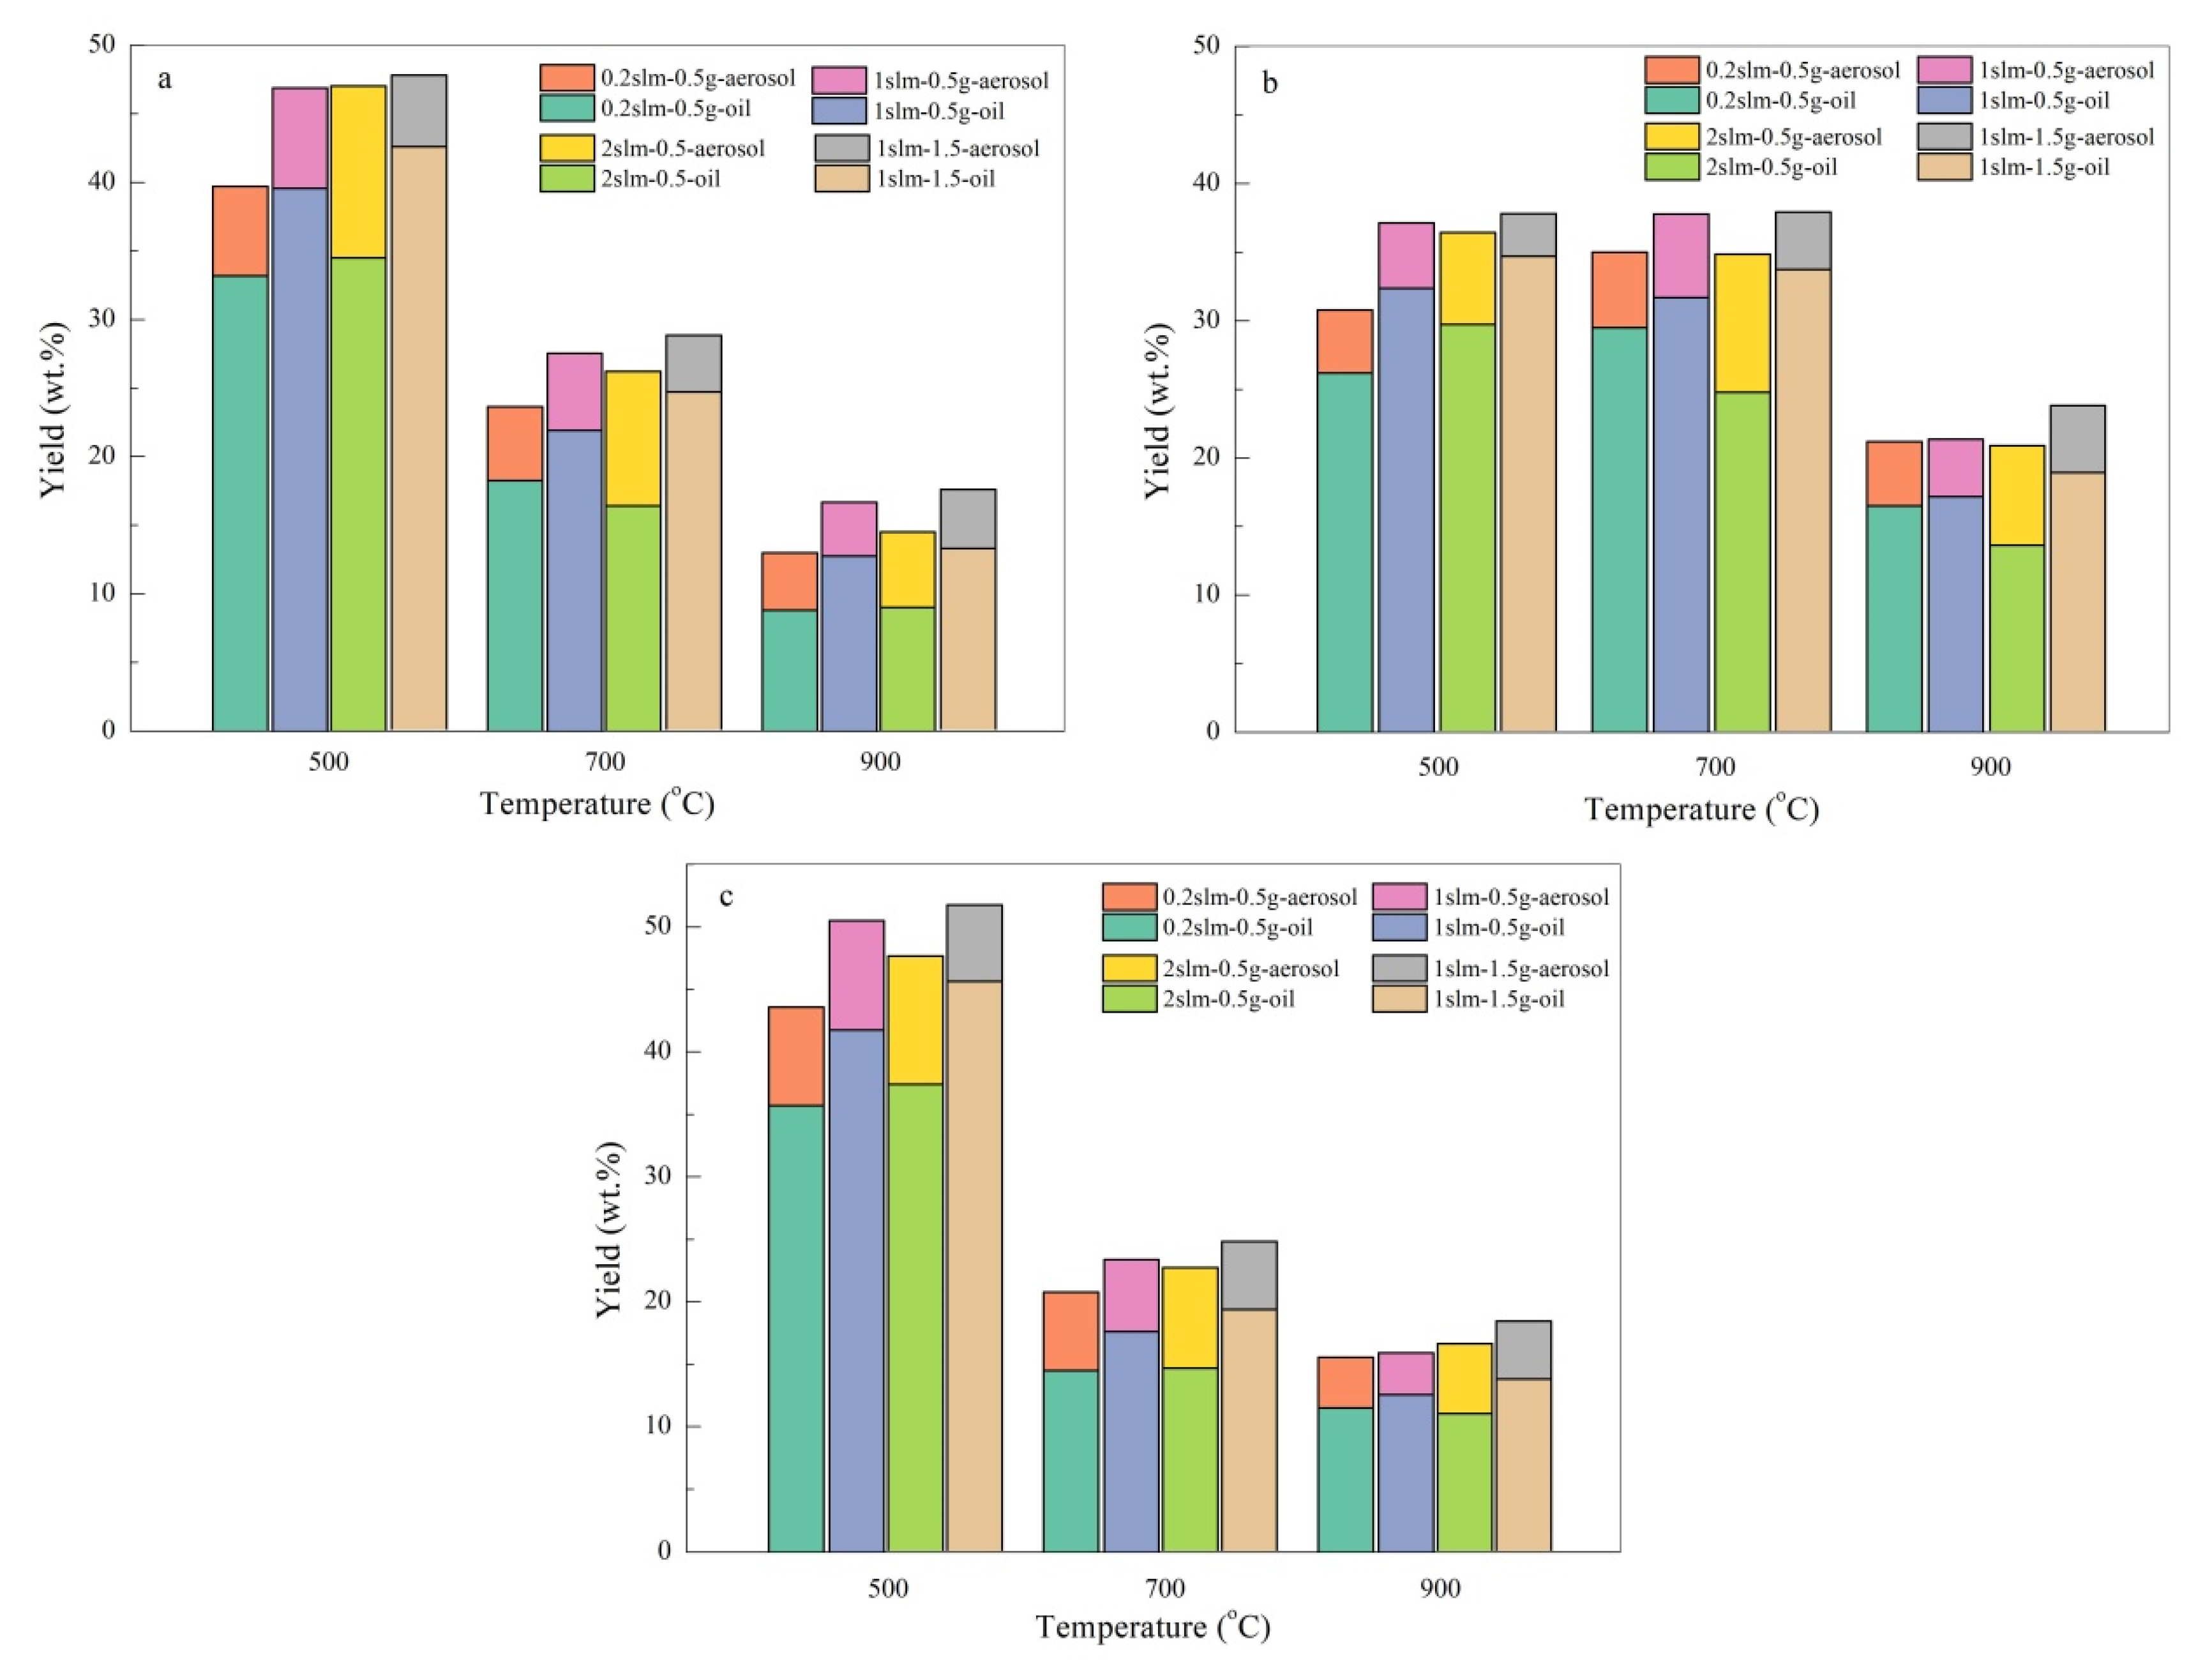
  • As the temperature increases, the aerosol yield presents a regular change pattern that increases initially and decreases afterwards in the range of 3.4–8.7 wt.% that corresponds with bio-oil, but the maximum peak varies for SR and SP as 500 °C and for SL as 600 °C owing to the heterogeneous structure of the tissues.
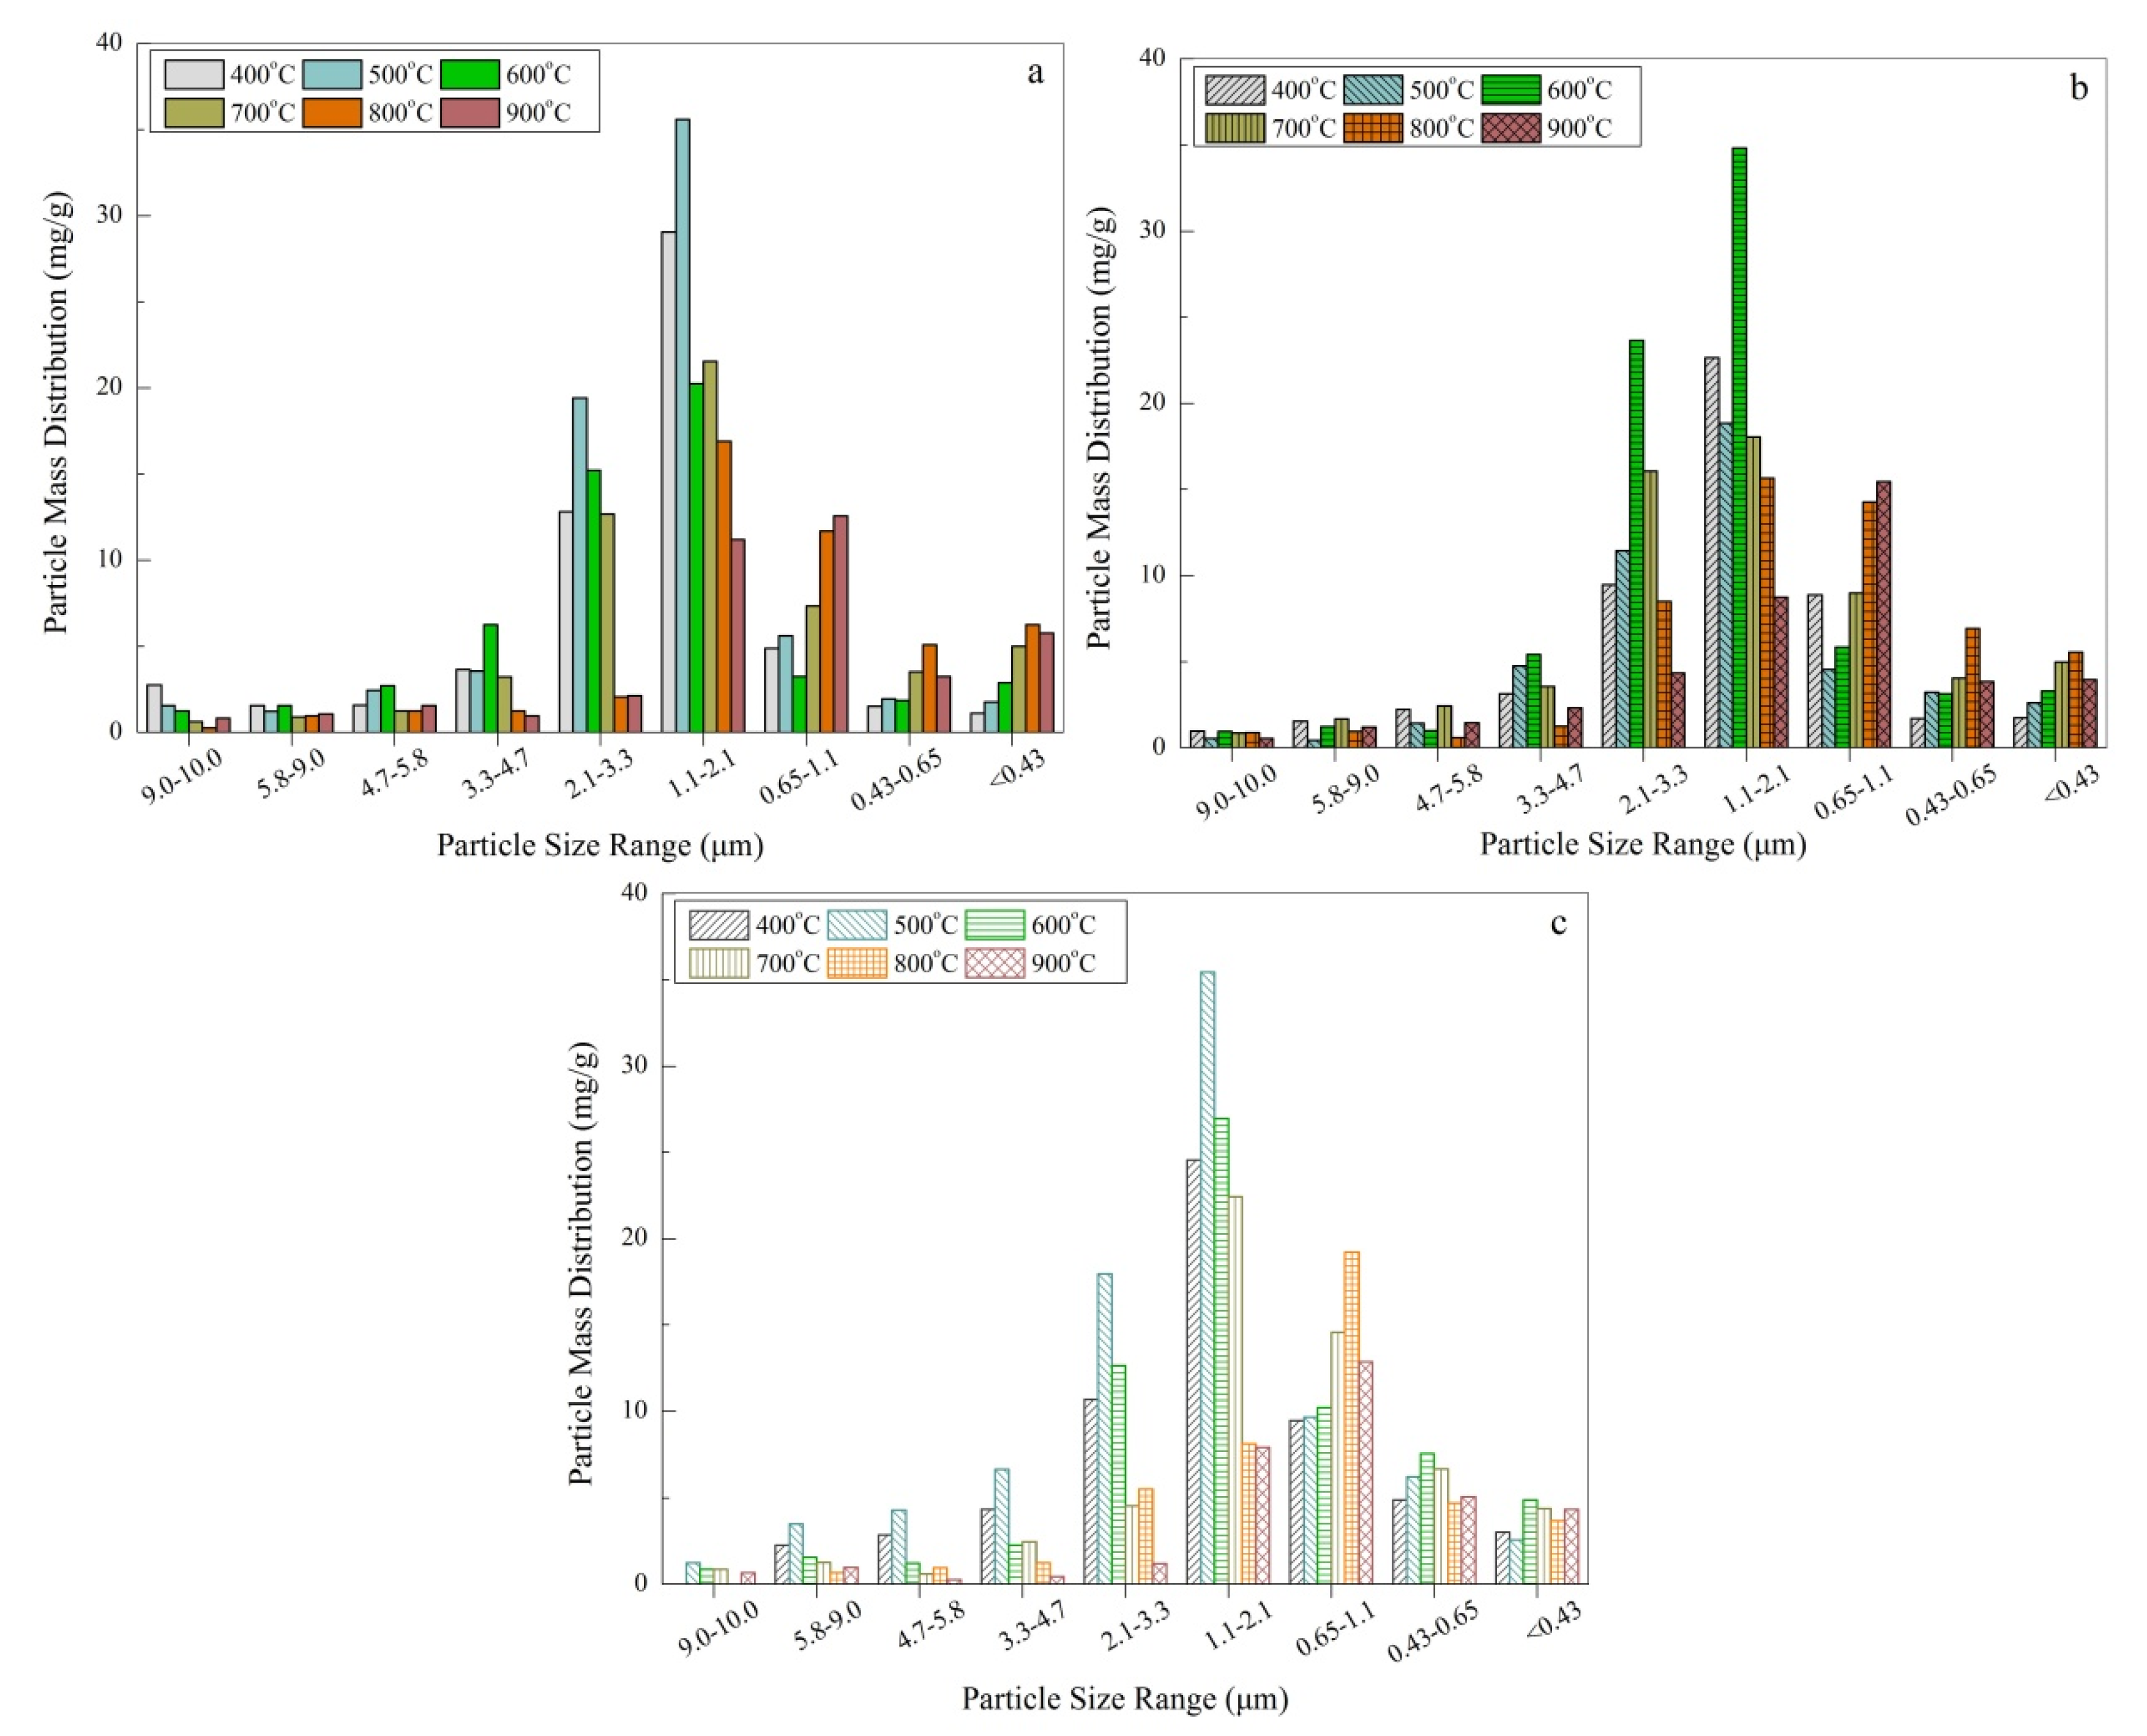
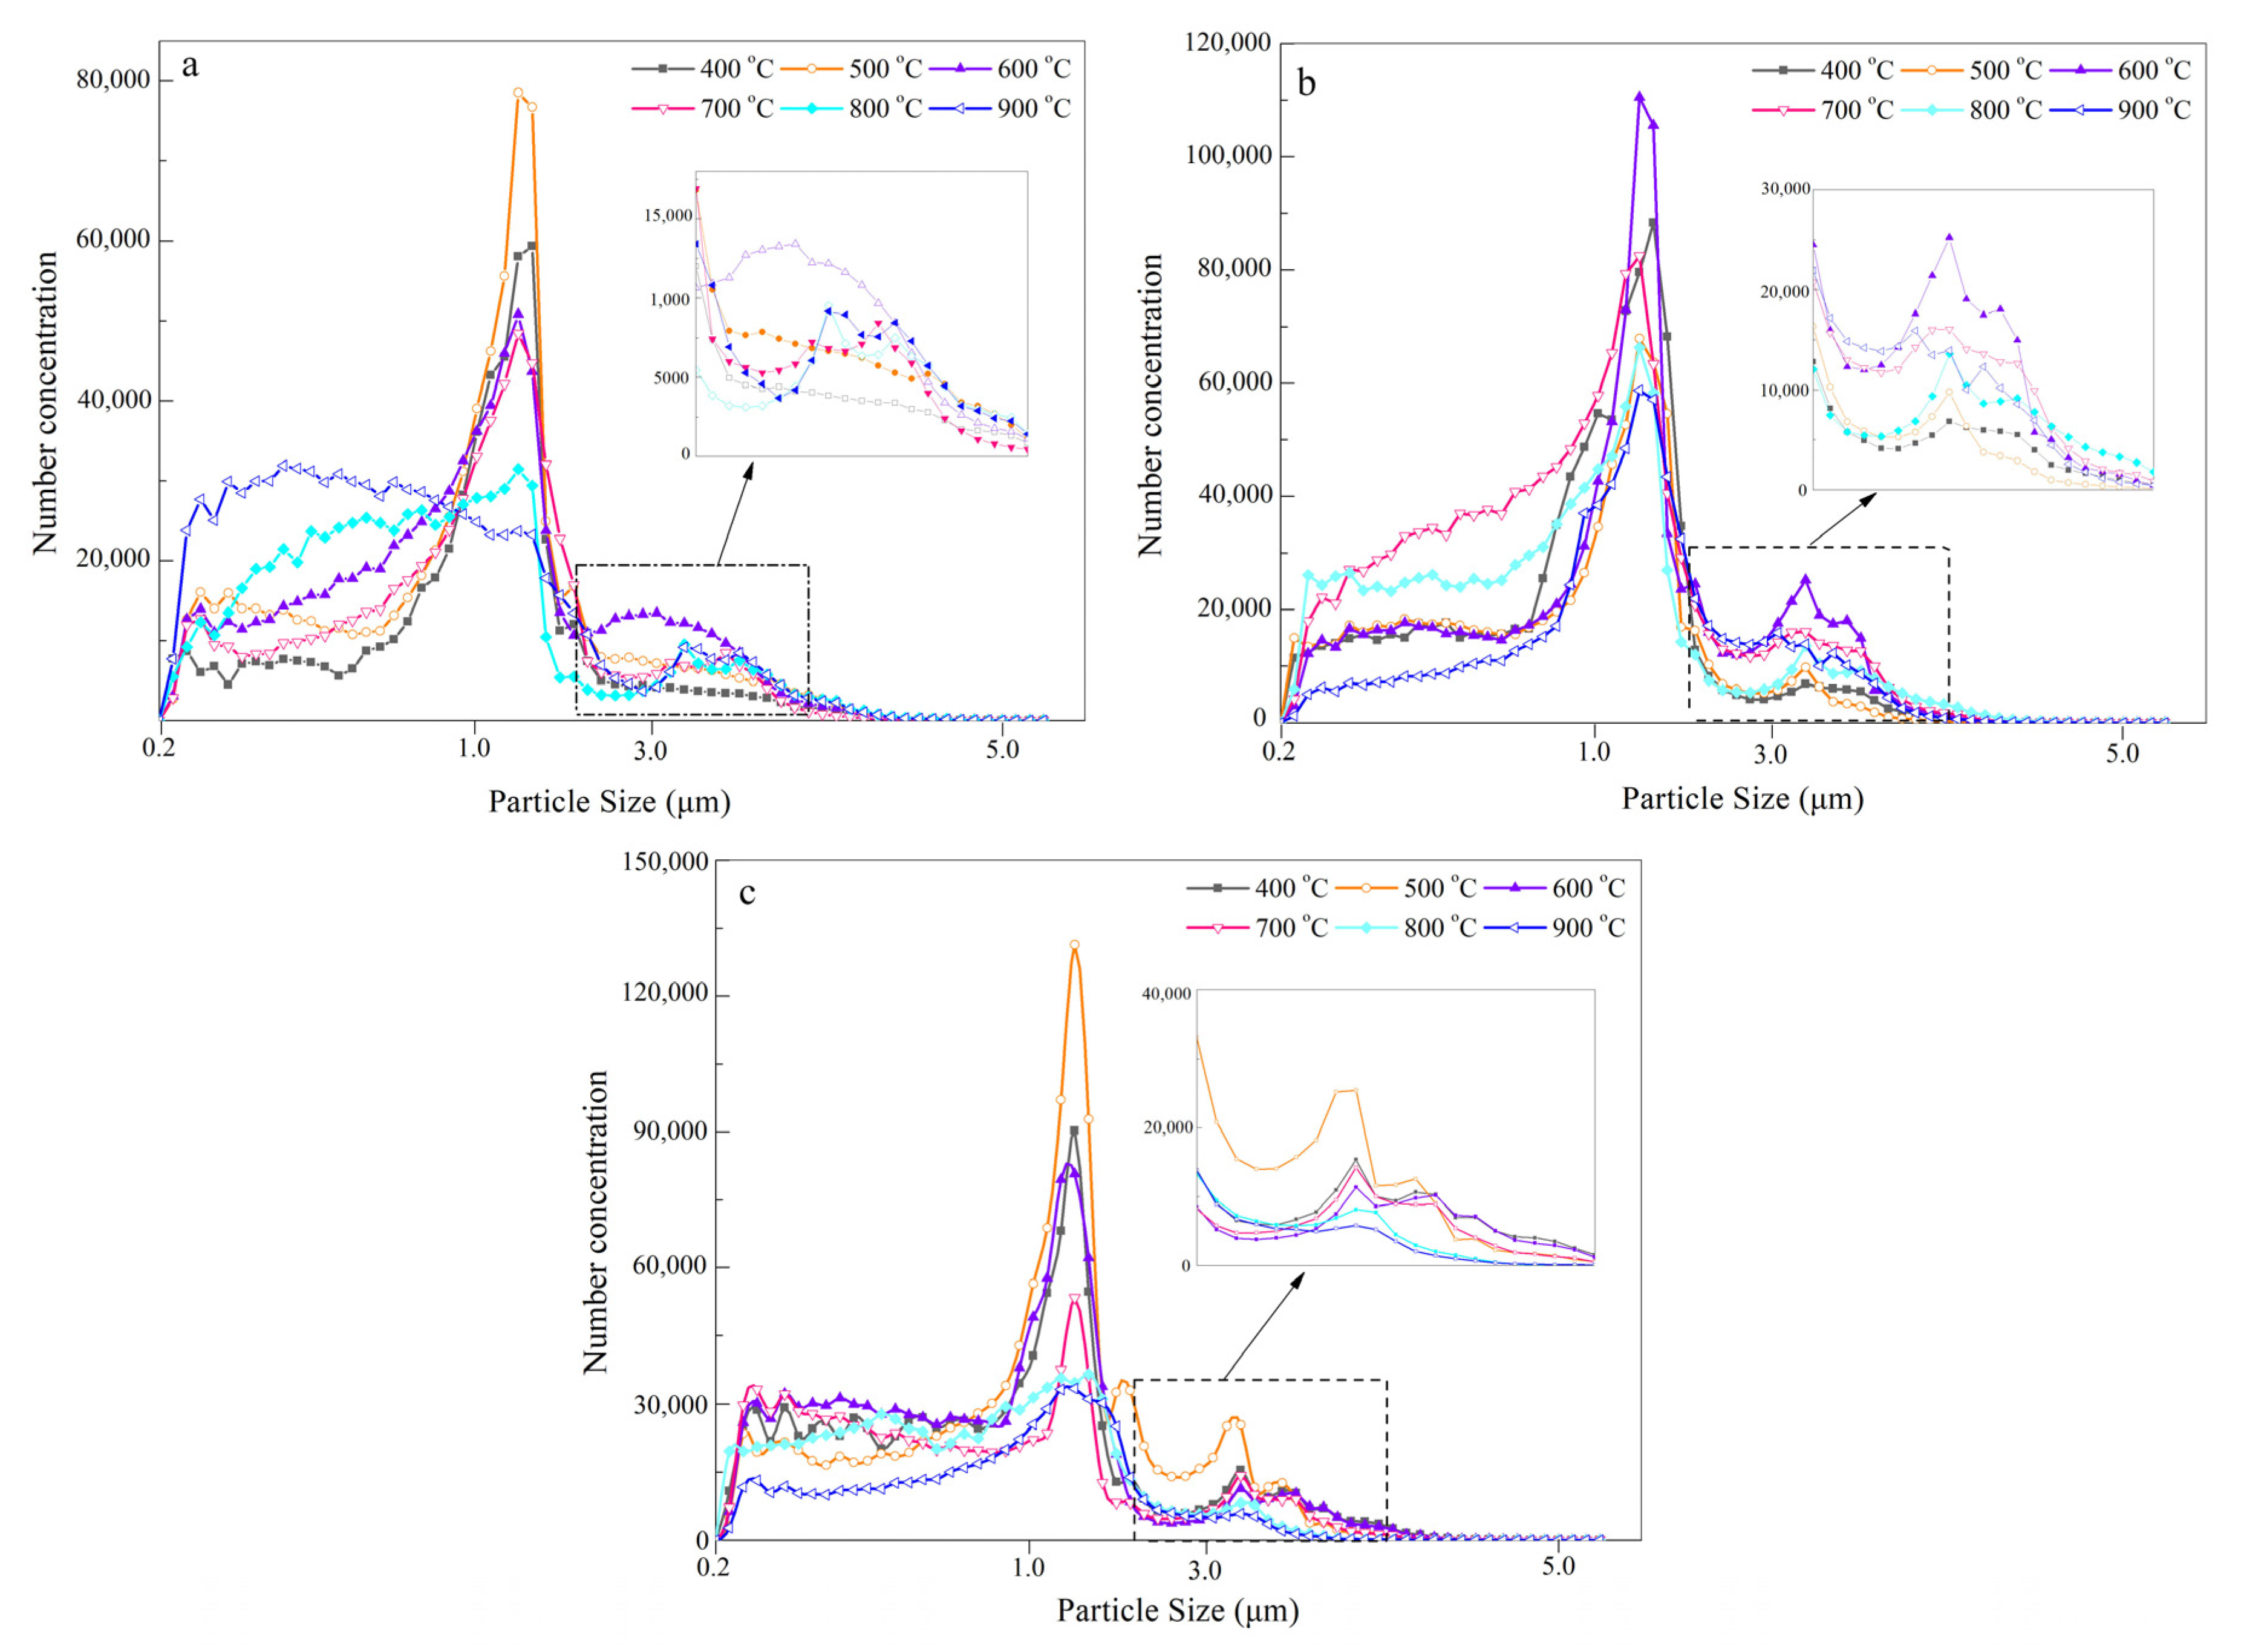
  • The mass-based size distribution reveals a unimodal mode and the peak is located in the range of 1.1–2.1 μm. The maximum of a five stage classification is 35.5 mg/g and 35.1 mg/g, respectively for SR and SP. However, for SL, a yield of 34.0 mg/g was obtained. With increasing temperature the main distribution of aerosols presents a trend from coarse mode to accumulation mode. The number-based distribution confirmed the previous inference. It also further reveals that the maximum aerosol aerodynamic diameter range is mainly concentrated at about 1.0 μm.
  • The emitted aerosols show three different appearances: bead-like droplets strung on the fibres; an elongated-like liquid laid on the intersection of fibres and solid crystals. During migration, homogenous or heterogeneous aggregation can occur. Additionally, aerosols mainly consist of a large proportion of organic matter and a little amount of inorganic matter. The former has a large amount of OC and VOCs exceed 50% compared with negligible EC. The ejection of AAEMs mainly happens at high temperatures in excess 700 °C.
  • Approximate gas flow and high vapor concentration can promote the yield of bio-oil, while the amount of aerosol collected is reduced. At 500 °C for SR pyrolysis, the increased in bio-oil yield is about 3 wt.% and the aerosol reduction is approximately 1.3 wt.%. The longer and larger surface efficiently boosts the capture of aerosols. The direct condensation with organic solvent achieves an analogous effect, but it also brings up a new aerosol problem that can perhaps cause more complex composition issues.

Supplementary Materials

The following are available online at https://www.mdpi.com/1996-1073/13/22/5924/s1, Figure S1: The microstructure of different tissues (a) SR (b) SL and (c) (d) SP, Table S1: The time of complete pyrolysis.

Author Contributions

The conceptualization of this journal article is from N.L., Z.L.; the writing—original draft was prepared by N.L., J.Z., Z.L. and J.Z. helped with the editing and supervision. N.L. performed and developed the experiment, learned Design Expert software, analyzed the data and wrote the paper; investigation and writing—review & editing were prepared by Y.L. All authors have read and agreed to the published version of the manuscript.

Funding

Authors gratefully acknowledge the support for this research from the Project supported by National Key R&D Program of China [2019YFD1100600 and 2019YFD1100602]; Shandong Provincial Natural Science Foundation of China [ZR2017MEE004].

Conflicts of Interest

The authors declare no conflict of interest.

References

  1. McKay, H. Environmental, economic, social and political drivers for increasing use of woodfuel as a renewable resource in Britain. Biomass Bioenergy 2006, 30, 308–315. [Google Scholar] [CrossRef]
  2. Kan, T.; Strezov, V.; Evans, T.J. Lignocellulosic biomass pyrolysis: A review of product properties and effects of pyrolysis parameters. Renew. Sustain. Energy Rev. 2016, 57, 1126–1140. [Google Scholar] [CrossRef]
  3. Fahmy, T.Y.; Fahmy, Y.; Mobarak, F.; El-Sakhawy, M. Biomass pyrolysis past present and future. Environ. Dev. Sustain. 2018, 22, 17–32. [Google Scholar] [CrossRef]
  4. Williams, A.; Jones, J.M.; Ma, L.; Pourkashanian, M. Pollutants from the combustion of solid biomass fuels. Prog. Energy Combust. Sci. 2012, 38, 113–137. [Google Scholar] [CrossRef]
  5. García, R.; Gil, M.V.; Rubiera, F.; Pevida, C. Pelletization of wood and alternative residual biomass blends for producingindustrial quality pellets. Fuel 2019, 251, 739–753. [Google Scholar] [CrossRef]
  6. Qureshi, K.M.; Kay Lup, A.N.; Khan, S.; Abnisa, F.; Daud, W.M.A.W. A technical review on semi-continuous and continuous pyrolysis process of biomass to bio-oil. J. Anal. Appl. Pyrolysis 2018, 131, 52–75. [Google Scholar] [CrossRef]
  7. Poshina, D.N.; Raik, S.V.; Poshin, A.N.; Skorik, Y.A. Accessibility of chitin and chitosan in enzymatic hydrolysis: A review. Polym. Degrad. Stab. 2018, 156, 269–278. [Google Scholar] [CrossRef]
  8. Bridgwater, A.V. Review of fast pyrolysis of biomass and product upgrading. Biomass Bioenergy 2012, 38, 68–94. [Google Scholar] [CrossRef]
  9. Tobias-Pröll, J. karl Steam gasification of biomass in dual fluidized bed gasifiers: A review. Renew. Sustain. Energy Rev. 2018, 98, 64–78. [Google Scholar]
  10. Iisa, K.; Johansson, A.-C.; Pettersson, E.; French, R.J.; Orton, K.A.; Wiinikka, H. Chemical and physical characterization of aerosols from fast pyrolysis of biomass. J. Anal. Appl. Pyrolysis 2019, 142, 104606. [Google Scholar] [CrossRef]
  11. Vamvuka, D.; Sfakiotakis, S.; Pantelaki, O. Evaluation of gaseous and solid products from the pyrolysis of waste biomass blends for energetic and environmental applications. Fuel 2019, 236, 574–582. [Google Scholar] [CrossRef]
  12. Ordou, N.; Agranovski, I.E. Mass distribution and elemental analysis of the resultant atmospheric aerosol particles generated in controlled biomass burning processes. Atmos. Res. 2017, 198, 108–112. [Google Scholar] [CrossRef]
  13. Zhang, G.; Ma, Z.; Shen, J.; Zhang, K.; Wang, J.; Chi, Z. Experimental study on eliminating fire smokes using acoustic agglomeration technology. J. Hazard. Mater. 2020, 382, 121089. [Google Scholar] [CrossRef] [PubMed]
  14. Lin, W.-Y.; Hsiao, T.-C.; Hong, B.-L. Improving the removal efficiency of fine particulate matters in air pollution control devices: Design and performance of an electrostatic aerosol particle agglomerator. J. Taiwan Inst. Chem. Eng. 2020, 107, 110–118. [Google Scholar] [CrossRef]
  15. Nussbaumer, T. Overview on Technologies for Biomass Combustion and Emission Levels of Particulate Matter; Swiss Federal Office for the Environment (FOEN): Zürich, Switzerland, 2010. [Google Scholar]
  16. Patiño, D.; Pérez-Orozco, R.; Porteiro, J.; Lapuerta, M. Characterization of biomass PM emissions using thermophoretic sampling: Composition and morphological description of the carbonaceous residues. J. Aerosol Sci. 2019, 127, 49–62. [Google Scholar] [CrossRef]
  17. Nussbaumer, T. Aerosols from Biomass Combustion. Technical Report on Behalf of the IEA Bioenergy Task 32; Verenum Research: Zurich, Switzerland; Lucerne University of Applied Sciences and Arts: Horw, Switzerland, 2017; p. 32. [Google Scholar]
  18. Bond, T.C.; Bergstrom, R.W. Light absorption by carbonaceous particles: An investigative review. Aerosol Sci. Technol. 2006, 40, 27–67. [Google Scholar] [CrossRef]
  19. Li, Y.; Wang, X.; Tan, H.; Bai, S.; Mikuli, H.; Yang, F. Evolution of PM2.5 from biomass high-temperature pyrolysis in an entrained flow reactor. J. Anal. Appl. Pyrolysis 2019, 92, 1548–1556. [Google Scholar] [CrossRef]
  20. Wang, X.; Bai, S.; Jin, Q.; Li, S.; Li, Y.; Li, Y.; Tan, H. Soot formation during biomass pyrolysis: Effects of temperature, waterleaching, and gas-phase residence time. J. Anal. Appl. Pyrolysis 2018, 134, 484–494. [Google Scholar] [CrossRef]
  21. Samburova, V.; Connolly, J.; Gyawali, M.; Yatavelli, R.L.N.; Watts, A.C.; Chakrabarty, R.K.; Zielinska, B.; Moosmüller, H.; Khlystov, A. Polycyclic aromatic hydrocarbons in biomass-burning emissions and their contribution to light absorption and aerosol toxicity. Sci. Total Environ. 2016, 568, 391–401. [Google Scholar] [CrossRef] [Green Version]
  22. Guillaume Schmidt, G.T.; Gontrand Leyssens, C.S.; Genevray, P.; Cazier, F.; Dewaele, D.; Coralie Vandenbilcke, E.F.; Denance, Y.; Dreff-Lorimier, C. Le Wood washing: Influence on gaseous and particulate emissions during wood combustion in a domestic pellet stove. Fuel Process. Technol. 2018, 174, 104–117. [Google Scholar] [CrossRef] [Green Version]
  23. Sun, J.; Shen, Z.; Zhang, L.; Zhang, Q.; Lei, Y.; Cao, J.; Huang, Y.; Liu, S.; Zheng, C.; Xu, H.; et al. Impact of primary and secondary air supply intensity in stove on emissions of size-segregated particulate matter and carbonaceous aerosols from apple tree wood burning. Atmos. Res. 2018, 202, 33–39. [Google Scholar] [CrossRef]
  24. Hu, Z.; Wang, X.; Adewale, A.; Ruan, R.; Tan, H. Aggravated fine particulate matter emissions from heating-upgraded biomass and biochar combustion: The effect of pretreatment temperature. Fuel Process. Technol. 2018, 171, 1–9. [Google Scholar] [CrossRef]
  25. Morgalla, M.; Lin, L.; Seemann, M.; Strand, M. Characterization of particulate matter formed during wood pellet gasification in an indirect bubbling fluidized bed gasifier using aerosol measurement techniques. Fuel Process. Technol. 2015, 138, 578–587. [Google Scholar] [CrossRef]
  26. Zhao, H.; Song, Q.; Wu, X.; Yao, Q. Study on the Transformation of Inherent Potassium during the FastPyrolysis Process of Rice Straw. Energy Fuels 2015, 29, 6404–6411. [Google Scholar] [CrossRef]
  27. Zhao, H.; Song, Q.; Wu, X.; Yao, Q. Transformation of alkali and alkaline earth metallic species during pyrolysis and CO2 gasification of rice straw char. J. Fuel Chem. Technol. 2018, 46, 27–33. [Google Scholar] [CrossRef]
  28. Yang, Y.; Lin, X.; Li, S.; Luo, M.; Yin, J.; Wang, Y. Formation factors and emission characteristics of ultrafine particulate matters during Na-rich char gasification. Fuel 2019, 253, 781–791. [Google Scholar] [CrossRef]
  29. Mugica-Álvarez, V.; Hernández-Rosas, F.; Magaña-Reyes, M.; Herrera-Murillo, J.; Rosa, N.; Gutiérrez-Arzaluz, M.; Figueroa-Lara, J.; González-Cardoso, G. Sugarcane burning emissions: Characterization and emission factors. Atmos. Environ. 2018, 193, 262–272. [Google Scholar] [CrossRef]
  30. Teixeira, A.R.; Gantt, R.; Joseph, K.E.; Maduskar, S.; Paulsen, A.D.; Krumm, C.; Zhu, C.; Dauenhauer, P.J. Spontaneous Aerosol Ejection: Origin of Inorganic Particles in Biomass Pyrolysis. ChemSusChem 2016, 9, 1322–1328. [Google Scholar] [CrossRef]
  31. Dauenhauer, P.J.; Colby, J.L.; Balonek, C.M.; Suszynskib, W.J.; Schmidt, L.D. Reactive boiling of cellulose for integrated catalysis through an intermediate liquid. Green Chem. 2009, 11, 1555–1561. [Google Scholar] [CrossRef]
  32. Jendoubi, N.; Broust, F.; Commandre, J.M.; Mauviel, G.; Lédé, J. Inorganics distribution in bio oils and char produced by biomass fast pyrolysis: The key role of aerosols. J. Anal. Appl. Pyrolysis 2011, 92, 59–67. [Google Scholar] [CrossRef]
  33. Ko, J.H.; Wang, J.; Xu, Q. Characterization of particulate matter formed during sewage sludge pyrolysis. Fuel 2018, 224, 210–218. [Google Scholar]
  34. Chen, Y.; Bond, T.C. Light absorption by organic carbon from wood combustion. Atmos. Chem. Phys. 2010, 10, 1773–1778. [Google Scholar] [CrossRef] [Green Version]
  35. Li, X.; Chen, Y.; Bond, T.C. Light absorption of organic aerosol from pyrolysis of corn stalk. Atmos. Environ. 2016, 144, 249–256. [Google Scholar] [CrossRef] [Green Version]
  36. Yao, Z.; You, S.; Dai, Y.; Wang, C.-H. Particulate emission from the gasification and pyrolysis of biomass: Concentration, size distributions, respiratory deposition-based control measure evaluation. Environ. Pollut. 2018, 242, 1108–1118. [Google Scholar] [CrossRef] [Green Version]
  37. Subramanian, R.; Roden, C.A.; Boparai, P.; Bond, T.C. Yellow Beads and Missing Particles: Trouble Ahead for Filter-Based Absorption Measurements. Aerosol Sci. Technol. 2007, 41, 630–637. [Google Scholar] [CrossRef] [Green Version]
  38. Xie, M.; Shen, G.; Holder, A.L.; Hays, M.D.; Jetter, J.J. Light absorption of organic carbon emitted from burning wood, charcoal, and kerosene in household cookstoves. Environ. Pollut. 2018, 240, 60–67. [Google Scholar] [CrossRef]
  39. Chen, H.; Chen, X.; Qiao, Z.; Liu, H. Release and transformation characteristics of K and Cl during straw torrefaction and mild pyrolysis. Fuel 2016, 167, 31–39. [Google Scholar] [CrossRef]
  40. Wang, Y.; Wu, H.; Sárossy, Z.; Dong, C.; Glarborg, P. Release and transformation of chlorine and potassium during pyrolysis of KCl doped biomass. Fuel 2017, 197, 422–432. [Google Scholar] [CrossRef] [Green Version]
  41. Zhang, Y.; Xie, X.; Zhao, J.; Wei, X. The alkali metal occurrence characteristics and its release and conversion during wheat straw pyrolysis. Renew. Energy 2020, 151, 255–262. [Google Scholar] [CrossRef]
  42. Deng, L.; Ye, J.; Jin, X.; Che, D. Transformation and release of potassium during fixed-bed pyrolysis of biomass. J. Energy Inst. 2018, 91, 630–637. [Google Scholar] [CrossRef]
  43. Papari, S.; Hawboldt, K. A review on condensing system for biomass pyrolysis process. Fuel Process. Technol. 2018, 180, 1–13. [Google Scholar] [CrossRef]
  44. Papari, S.; Hawboldt, K.; Helleur, R.J. Pyrolysis: A theoretical and experimental study on the conversion of softwood sawmill residues to biooil. Ind. Eng. Chem. Res. 2015, 54, 605–611. [Google Scholar] [CrossRef]
  45. SeokChoi, H.; Seok Choi, Y.; Chae Park, H. Fast pyrolysis characteristics of lignocellulosic biomass with varying reaction conditions. Renew. Energy 2012, 42, 131–135. [Google Scholar]
Figure 1. Schematic diagram of experimental setup the fluidized bed reactor system with aerosol measurement points. 1. Nitrogen cylinder 2. Mass flow meter 3. Fixed-bed reactor 4. Anderson impactor sampler 5. Aerosol collector 6. High efficiency particle air filter (HEPAF) 7. Particulate diluter 8. Particle size spectrometer a. direct tube indirect heat transfer b. helical tube indirect heat transfer c. direct condensation.
Energies 13 05924 g001
Figure 2. The thermal mass loss and the yields of bio-oil and aerosol and during different tissues pyrolysis.
Energies 13 05924 g002
Figure 3. Aerosol size-dependent mass distribution under different temperatures (a) SR; (b) SL; (c) SP.
Energies 13 05924 g003
Figure 4. The ratio of aerosol in different size range: (a) SR; (b) SL; (c) SP.
Energies 13 05924 g004
Figure 5. The effects of different condensation methods on the yield of aerosol: (a) SR; (b) SL; (c) SP.
Energies 13 05924 g005
Figure 6. The images of aerosol and SEM-EDS analysis in different pyrolysis temperature a. 500 °C–full-size filter, b. 900 °C–full-size filter and c. 900 °C–7 size-staged filter, (1) 500 °C and 700 °C, (2) 900 °C, (3) and (4) the corresponding magnification of partial aerosols.
Energies 13 05924 g006
Figure 7. The effect of gas flow and the mass of feedstock on the relationship between bio-oil and aerosol: (a) SR; (b) SL; (c) SP.
Energies 13 05924 g007
Figure 8. The effect of condensation on the aerosol emission: (a) SR; (b) SL; (c) SP.
Energies 13 05924 g008
Table 1. Basic properties of different tissues of corn stalk.
SpeciesUnitSRSLSPSpeciesUnitSRSLSP
Moisturewt.%6.177.928.71Cellulosewt.%45.0633.9039.26
Ashwt.%6.2910.054.23Hemicellulosewt.%23.9631.5728.87
Volatile matterwt.%77.0673.5782.34Ligninwt.%7.872.851.20
Fixed carbon awt.%10.488.464.72Extractiveswt.%16.8221.6326.44
Cwt.%43.8247.2642.53Kmg/kg26,590.013,543.731,953.3
Hwt.%5.65.935.76Namg/kg82.2153.5208.0
Nwt.%50.0446.6150.98Camg/kg2100.86339.52974.6
O awt.%0.540.20.73Mgmg/kg1696.94434.52154.4
a By difference.
Table 2. The mass distribution of organic carbon (OC) and element carbon (EC) in 1 cm−2 filter at 500 °C, 700 °C and 900 °C.
Temperature (°C)OC (μg·cm−1)EC (μg·cm−1)
VOCsNVOCs
SRSLSPSRSLSPSRSLSP
500102.17162.34134.1151.0894.97103.021.470.551.02
700146.47192.7582.3776.68167.9868.297.711.271.53
90046.5267.8335.8550.6478.1957.088.444.785.11
Table 3. The distribution of inorganic element emission concentration in bio-oil and serosol.
Temperature (°C)ProductUnitKNaCaMg
SRSLSPSRSLSPSRSLSPSRSLSP
500Bio-oilμg·g−1212.767.7479.310.427.850.5----4.3--35.510.8
Aerosolμg·g−1425.4162.5287.615.024.731.8----17.8--62.123.7
700Bio-oilμg·g−1930.7433.41437.818.425.942.637.876.025.956.0110.886.2
Aerosolμg·g−11808.1623.03035.620.344.869.367.2221.8154.7110.3239.5213.3
900Bio-oilμg·g−11196.6623.02428.513.339.928.173.5304.3103.476.4243.8140.0
Aerosolμg·g−16700.62424.310,928.023.135.677.6273.1640.3550.3307.1585.4415.8
Publisher’s Note: MDPI stays neutral with regard to jurisdictional claims in published maps and institutional affiliations.

