Article

Experimental Performance Evaluation of an Integrated Solar-Driven Adsorption System in Terms of Thermal Storage and Cooling Capacity

Laboratory of Applied Thermodynamics, School of Mechanical Engineering, Thermal Engineering Section, National Technical University of Athens, Heroon Polytechniou 9, Zografou Campus, 15780 Athens, Greece
*
Author to whom correspondence should be addressed.
Energies 2020, 13(22), 5931; https://doi.org/10.3390/en13225931
Submission received: 29 September 2020 / Revised: 2 November 2020 / Accepted: 12 November 2020 / Published: 13 November 2020

Abstract

:
Heat-driven coolers provide a reliable and environmentally benign alternative to traditional electrically powered chillers. Their main advantage is that they can be driven using low enthalpy heat sources. A solar system is installed at the school of Mechanical Engineering of National Technical University of Athens in order to examine the potential of thermal storage and solar cooling under Athens climatic conditions. The cooling effect is produced using a dual bed, single stage, zeolite/water adsorption chiller with cooling capacity of 10 kW at its nominal conditions of operation. Both vacuum tube collectors and hybrid photovoltaic thermal collectors are installed in order to supply the system with heat. The system is evaluated in terms of solar collectors’ useful energy production, heat stored in the intermediate buffer and cooling system’s performance. It is observed that the cooling system operates satisfactorily under Athens climatic conditions achieving a maximum cooling capacity of 3.7 kW and an average COP around 0.5.

1. Introduction

Conventional-technology cooling systems consume electricity to actuate their mechanical compressor. When this electrical energy comes from the power grid, the use of traditional vapor compression systems is accompanied by the following disadvantages:
  • Increase of carbon dioxide (CO2) emissions since the largest percentage of electrical energy is produced by non-renewable energy sources. Carbon dioxide emissions accentuate the greenhouse effect and by extension global warming.
  • Contribute to the depletion of fossil fuels. Estimates about the depletion of fossil fuels indicate 107 years for coal, 37 year for gas and only 35 years for oil [1].
  • Their extensive and simultaneous use during summer months causes serious problems to the power plants and electrical network, increasing the danger of power outages and black outs [2].
Thermally driven sorption chillers can provide a reliable and ecological alternative to traditional vapor compression systems especially when they powered by solar energy. This is due to the fact that the need for covering cooling loads in summer months coincides with the availability of solar radiation. Sorption cooling systems can be categorized into two groups: (1) absorption heat pumps and (2) adsorption heat pumps. Absorption systems present, in general, higher COP values compared to adsorption ones and are used more extensively in commercial cooling applications. However, adsorption heat pumps have also some advantages. The most important of them is that they can be powered using low temperature solar/waste heat [3,4]. It is mentioned in the literature [5] that temperatures as low as 50 °C can be exploited if multi-staged adsorption cycles are used. This advantage makes adsorption chillers ideal for solar cooling applications where in most cases low enthalpy heat is available.
Sorption solar cooling systems have been investigated in the past few years by numerous researchers both numerically and experimentally [6,7,8]. Alam et al. [9] investigated theoretically the possibility of applying an adsorption solar cooling system under Tokyo, Japan climatic conditions. They used 36.225 m2 of CPC collectors in order to power a silica gel/water adsorption chiller and they found that a cooling capacity around 10 kW was achieved at noon, with maximum COP and SCOP around 0.55 and 0.3, respectively. Clausse et al. [10] simulated an adsorption solar cooling system which operates in Orly, France. They used an AC/methanol adsorption chiller driven by 24.2 m2 of CPC collectors and they observed a maximum cooling capacity of 4.6 kW at 2 p.m. with average COP and SCOP values of 0.49 and 0.2, respectively. El-Sharkawy et al. [11] examined theoretically the performance of a solar cooling system under Middle East climatic conditions. The system uses a silica gel/water adsorption chiller driven by CPC collectors. The best performance is recorded for the cooling system installed in Aswan where a cooling output around 15.8 kW is achieved with maximum COP around 0.5 and SCOP around 0.3. Buonomano et al. [12] simulated a solar adsorption cooling system using TRNSYS software for four different Italian cities (Palermo, Naples, Florence, Turin). A commercially available adsorption chiller is used driven by 122 m2 of PVTs. The produced heat energy is used for solar space heating/cooling and domestic hot water while the electricity is used to cover building needs. The system achieves simple payback period SPB = 10.6–11.3 years, primary energy savings PES = 58.5–68.8% and equivalent carbon dioxide avoided emissions 76.3–90.2%. Buonomano et al. [13] also compared the performance of both absorption and adsorption cooling systems driven by PV/T and CPV/T collectors. For this purpose, they developed a dynamic simulation model which allows the investigation of energy, economic and environmental performance of solar polygeneration heating and cooling systems. Koronaki et al. [14] investigated theoretically the possibility of applying solar cooling in eastern Mediterranean areas. They used various types of solar collectors, including PV/Ts, in order to power an adsorption chiller and evaluated the system’s performance in terms of cooling capacity, COP, energy and exergy efficiency. They observed that the system operates in Nicosia presents the best overall performance. A performance assessment and economic analysis of a dual-bed silica gel-water adsorption cooling system powered by solar thermal energy was conducted by Alahmer et al. [15] through dynamic modelling under Perth, Australia typical climatic conditions. An average cooling capacity of 11 kW is observed at peak hour (13:00) in a representative summer day while the cyclic COP and the solar COP of the system are around 0.5 and 0.3, respectively. Regarding the financial analysis a payback period of 11 years is estimated with an optimal solar collector area of 38 m2 if a compound parabolic collector panel (CPC) is used. Basdanis et al. [16] computationally investigated the effect of half-cycle time in the performance of a solar driven two-bed, single-stage adsorption chiller operating in Athens, Greece, during July. They observed an improvement of 12% on the daily and monthly cooling capacities when the chiller operates under the dynamically optimized adjusted half-cycle time mode compared to the corresponding maximum constant ones.
Zhai et al. [17] experimentally investigated the behavior of a solar adsorption cooling system deployed in the green building of Shanghai Research Institute of Building Science. There are two silica gel/water adsorption chillers in the installation with rated capacities of 8.5 kW each. A total area of 150 m2 of solar collectors is used (90 m2 of ETC–CPC and 60 m2 of ETC–heat pipe). An average refrigeration output of 15.3 kW during an 8 h operation is observed while the maximum cooling output exceeds 20 kW. The values of average COP, SCOP and electric COP are 0.35, 0.15 and 8.19, respectively. Fasfous et al. [18] investigated experimentally a solar adsorption cooling system in the University of Jordan in Amman. The system comprises a zeolite/water adsorption chiller powered by flat plate thermal collectors. It is observed that solar collectors of 40 m2 area can provide sufficient heat to drive an 8 kW adsorption cooling system. Lu et al. [19] investigated the performance of two solar cooling systems operating in Dezhou and Jinan, China. The cooling system installed in Dezhou uses 79.7 m2 of CPC collectors to power a silica gel/water adsorption chiller, while the system installed in Jinan uses 105 m2 of CPC collectors to drive an absorption LiBr/water chiller. It is observed that the adsorption chiller can be powered by heat sources of 55 °C and can provide 15 °C of chilled water from 9:30 to 17:00 with an average solar COP of 0.16. The absorption chiller can provide 15 °C of chilled water from 11:00 to 15:30 with an average solar COP of 0.19. Thomas et al. [20] examined the operation of a solar cooling system installed at University of Liège, Belgium. The system contains 14 m2 of flat plate solar collectors and an adsorption chiller with nominal capacity 9 kW. In clear days the solar cooling system can save energy up to 45%. Roumpedakis et al. [21] examined the performance of a solar-powered hybrid adsorption chiller combined with an auxiliary heat pump. Regarding the combined performance of the system, evaluated on a typical summer week of Athens, the maximum obtained COP was around 0.575 and the corresponding average energy efficiency ratio (EER) reported was 5.8.
In this study, a solar cooling system installed in the Laboratory of Applied Thermodynamics of School of Mechanical Engineering of National Technical University of Athens is examined. The system uses a commercially available zeolite/water adsorption chiller in order to produce the cooling effect while the thermal storage is achieved through sensible heat in the form of temperature rise is stored in an intermediate buffer. The system’s driving force is solar energy which is transformed to heat in a series of ETC and a series of asymmetric hybrid PVT collectors already tested by the research group of the laboratory [22]. To the best of authors’ knowledge, there are not many experimental papers available in the literature investigating similar pilot installations (1) driven by two different types of solar collectors, (2) under Greece climatic conditions. The performance of the system is evaluated during summer period in terms of cooling capacity and COP and exergy efficiency.

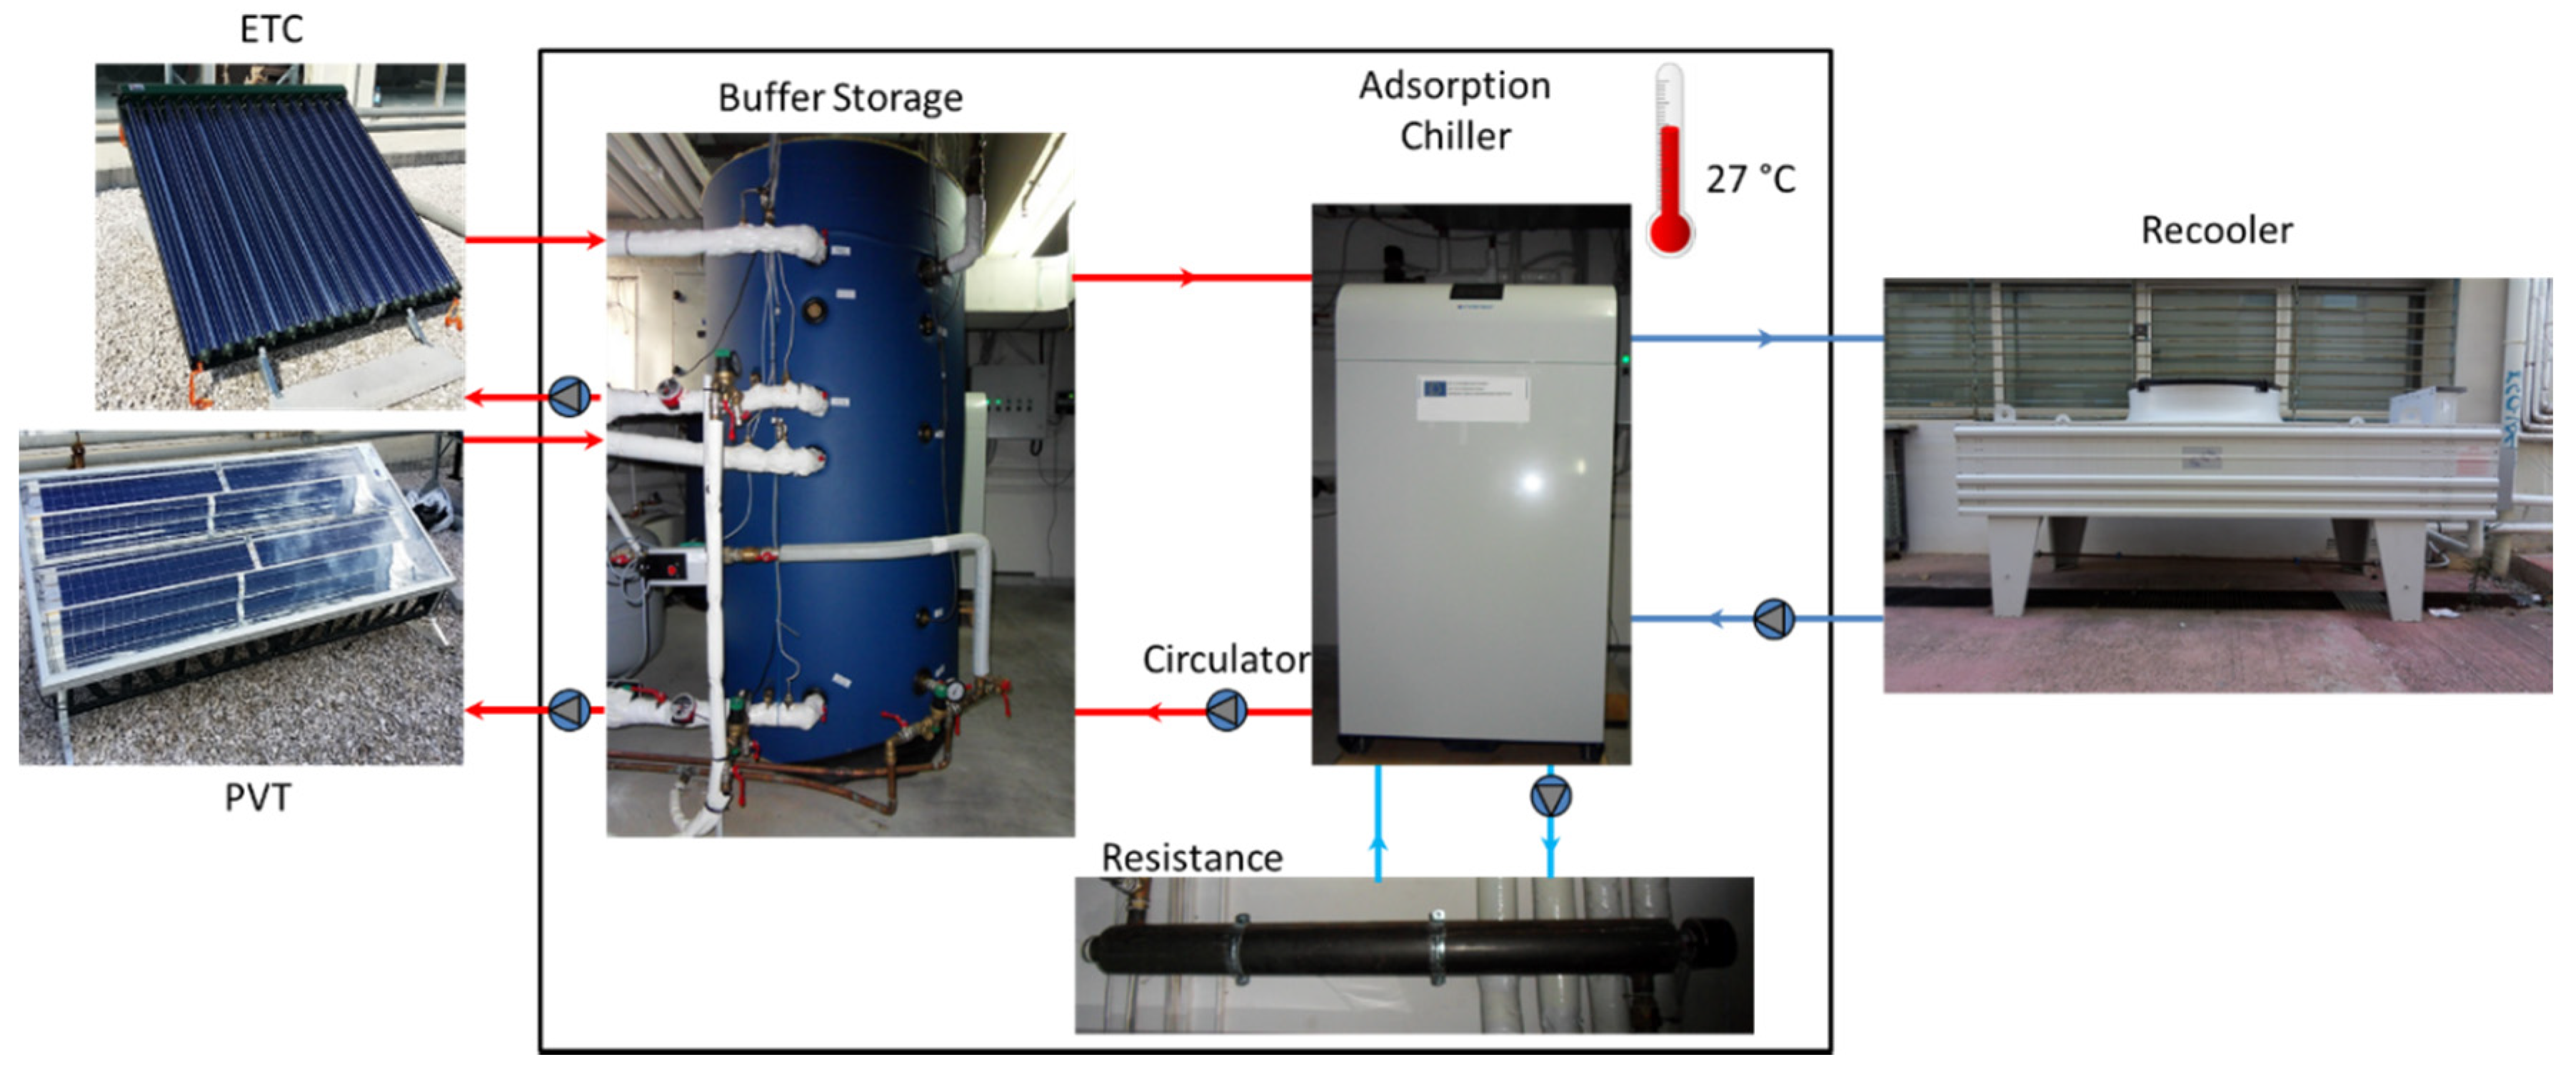
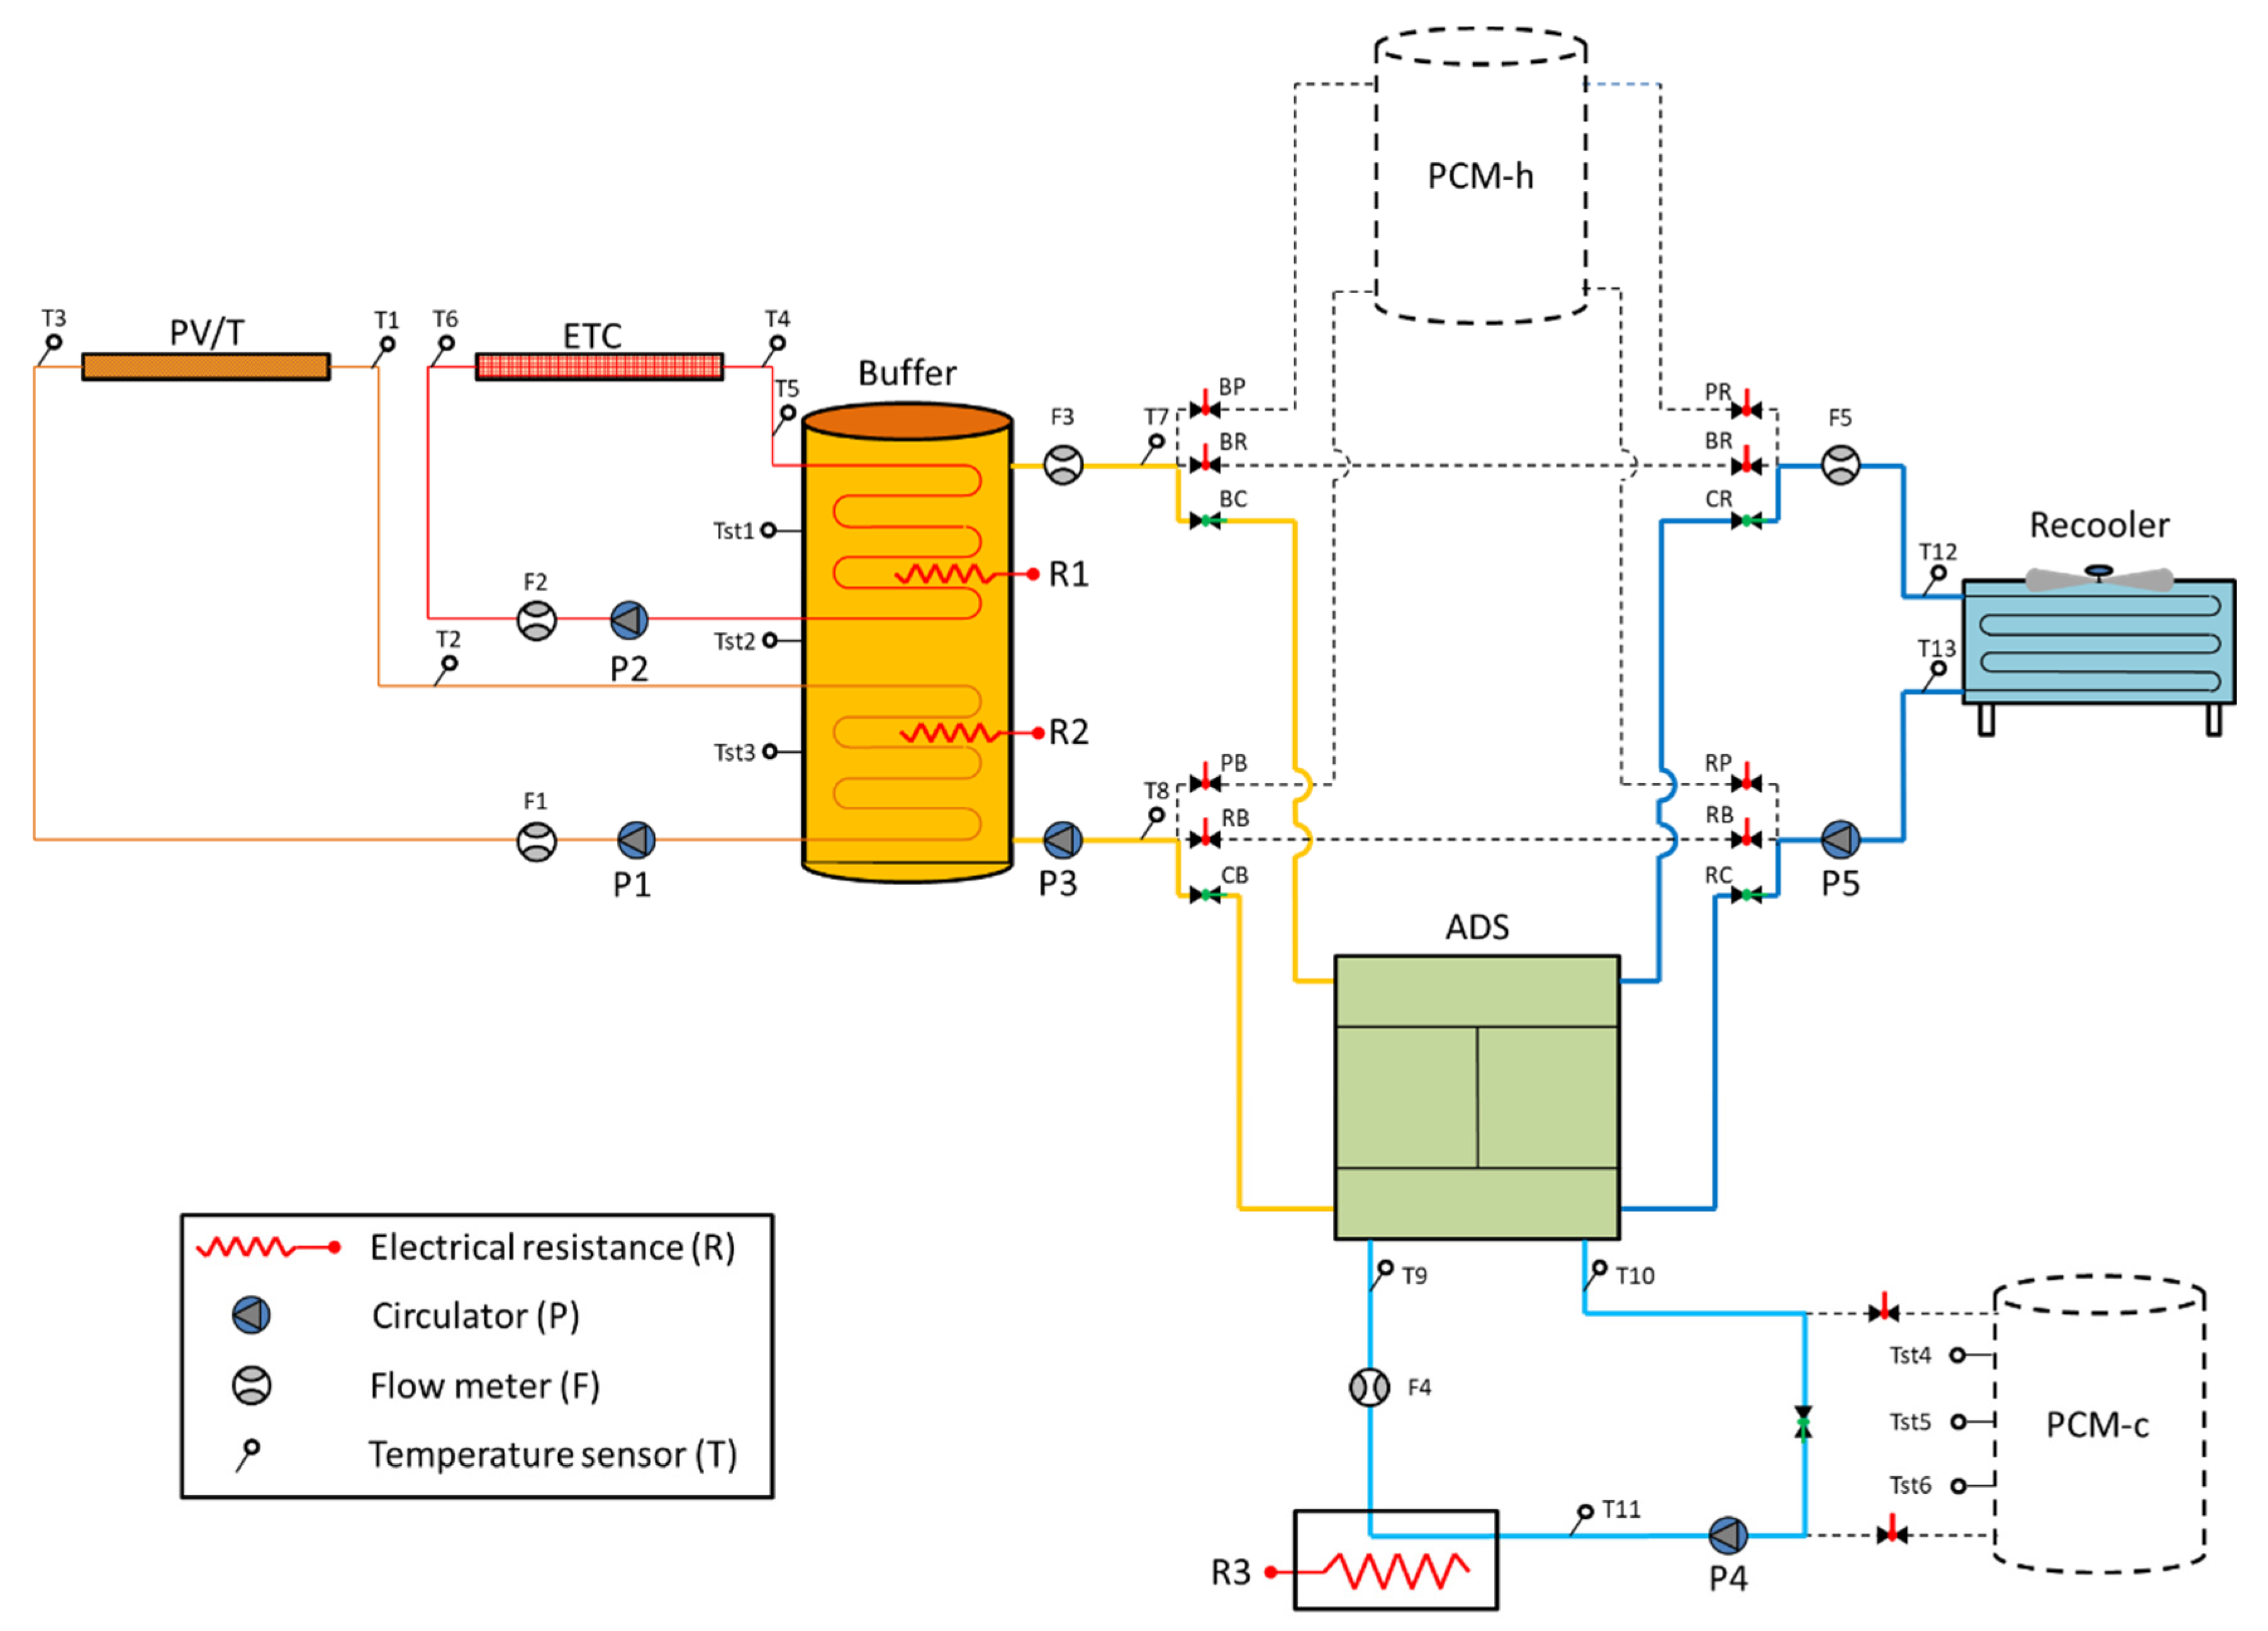
2. System Description and Experimental Process

The installed solar cooling system is illustrated in Figure 1 and its layout is depicted in Figure 2. It comprises seven main components: (1) photovoltaic-thermal collectors, (2) evacuated tube solar collectors, (3) a buffer storage tank, (4) an adsorption chiller, (5) a recooler, (6) an electrical resistance, and (7) circulators. The solar panels collect solar radiation, convert it to thermal energy and provide it to the heat transfer fluid. The heat of this fluid is used to charge the buffer storage tank. The heat stored in the tank is used to power the thermally driven adsorption chiller. The chiller produces the desirable cooling and rejects heat to the environment through the dry cooler. The output cooling capacity is consumed in the electrical resistance which serves as cooling load.
Every component of the system is presented in Table 1 and described briefly below. Five vacuum tube solar collectors are installed creating a solar field with total area of 9.76 m2. These collectors are highly efficient due to their parabolic reflector, and they can function satisfactorily under conditions of high diffuse radiation. Hybrid photovoltaic thermal collectors are also used in the system. The total area of these collectors is 11 m2, and it consists of five such PVTs. A buffer storage tank with total capacity of 865 L is installed and acts as a buffer between the heat production and heat demand. Two internal heat exchangers are integrated in the tank through which the buffer is charged using the heat collected by the solar collectors. A commercially available (Invensor) dual bed, single stage adsorption chiller is used to produce the desired cooling effect. The two beds are alternatively connected to the solar collectors in order to absorb heat (during desorption/condensation and pre-heating switching phases) and to the dry cooler in order to reject heat (during the adsorption/evaporation and pre-cooling switching phases). A thorough and comprehensible description of adsorption chiller’s working principle can be found elsewhere [23,24]. The chiller uses zeolite/water as a working pair, and at its nominal operating point produces 10 kW cooling capacity with a COP of around 0.6. The advantage of this chiller is that it can exploit heat sources of low enthalpy making it ideal for solar cooling applications. An axial dry cooler is used to reject the heat resulting from adsorption and condensation to the environment, and its nominal capacity is 56.4 kW. The electrical resistance serves as a cooling load, and its power is 12 kW. Five circulators are used in order to move the heat transfer fluid through the pipes of the different loops.
The two latent heat storage systems (PCM-h for high and PCM-c for low-temperature energy storage) are installed in the experimental setup but their influence to the solar cooling system will be investigated in a future study. The backup electrical resistances R1 and R2 are used when the solar radiation is not sufficient for driving the cooling system and are not used during the presented experimental procedure.
Temperature sensors and flow meters are installed in representative positions of the solar unit in order to determine the temperatures and the volume flow rates of the working fluid. The equipment is connected to PLC in order to be controlled and the experimental data are collected through an OPC (Object linking and embedding for Process Control) server connected to its client software.
The heat transfer fluid (water) flow rates and temperatures at the inlet and outlet of the collectors’ series as well as at the inlets and outlets of the adsorption chiller are the basic measured quantities. The ambient temperature, the tilted and diffuse solar irradiance and the wind velocity are also measured. The measuring instruments accuracies are provided in Table 2. The measured values are collected through the OPC server and stored every 1 s for the chiller and every 30 s for the other components of the integrated system. The above-mentioned data are sufficient for the evaluation of the system’s performance, and they are used in the following Equations to calculate the thermal and exergy efficiency of the collectors. In this study, the results of the 22nd of June are reported as that day is near to the summer solstice during which the available irradiance is maximum. The performance of the solar system presents similar behavior during July and August.

3. Mathematical Background

The basic mathematical equations used to evaluate the performance of the examined system are presented in this section.
One of the main objectives of a thermal analysis is the calculation of the useful energy produced by solar collectors. This useful energy is calculated using Equation (1) by considering an energy balance between the inlet and the outlet of the collector.
Q u = m f · c f · ( T f o T f i )
The hot water from the outlet of the ETC series enters in the higher part of the buffer tank while the outlet of the PVT the medium part of the tank. The buffer tank is insulated, and it is modeled using three mix-zones (uniform temperature is considered within each zone, Tst1 upper part, Tst2 middle part and Tst3 lower part of the tank) and it loses heat to the environment due to the temperature difference between the temperature of each zone and the temperature at the laboratory, which was kept constant at 27 °C during the whole procedure (Equation (2)). The tank heat loss coefficient receives rather low values (near 0.5 W/m2 K) due to the insulation. Therefore, the thermal energy that is stored in the tank can be expressed as the difference between the total useful energy produced by the collectors and the tank’s losses to the ambient (Equation (3)).
Q L = U L · A i · ( T s t i T L A B )
Q s t o r e d = Q u , t o t a l Q L
For the evaluation of the chiller performance, the heat input (Equation (4)), the cooling capacity (Equation (5)) and the rejected heat (Equation (6)) are calculated.
Q h w = m ˙ h w c p w ( T h w , i n T h w , o u t )
Q c h i l l = m ˙ c h w c p w ( T c h w , i n T c h w , o u t )
Q c w = m ˙ c w c p w ( T c w , o u t T c w , i n )
From the First Law of Thermodynamics, the energy balance yields:
Q c h i l l + Q h w Q c w = 0
Finally, the overall performance of the chiller is determined through the Coefficient of Performance (Equation (8)), the refrigeration efficiency (Equation (9)), and the exergy efficiency of the adsorption cycle (Equation (10)):
C O P = Q c h i l l Q h w
η = C O P C O P C a r n o t = C O P ( 1 T C T g ) · ( T e T C T e )
η e x = C O P · ( 1 T o T e ) ( 1 T o T g )

4. Results and Discussion

The experimental results are presented in this section. The investigated day was the 22nd of June, a clear-sky day near to the summer solstice, and the experimental data regarding the ambient conditions and the collectors operation were collected from 08:00 to 17:00. Although the data acquisition time was set to 30 s (except for the chiller), in this study, the per-10 min averaged results are presented in order to remove possible errors. The working conditions during the experimental process are presented in Table 3.

4.1. Ambient Conditions and Collector Performance

In Figure 3, the variation of ambient temperature and of the total irradiance on the solar collectors’ surface is depicted for the examined day. The maximum irradiance (964 W/m2) can be observed at 13:30 local time, while the maximum ambient temperature, which is 31.9 °C, can be observed at 16:20. The irradiance curve is skewed due to the fact that the solar collectors are not perfectly aligned to the south. It is obvious that the examined day is a typical one with respect to the climatic conditions during summer in Greece.
Figure 4 and Figure 5 illustrate the temperature difference between the series inlet and outlet and the produced useful heat, respectively. The curve of the heat transfer fluid’s temperature increase for each collector type can be partitioned into three sections. The first one refers to the transient performance of the collectors in which the absorber is not adequately heated. When a thermal equilibrium is achieved, the temperature rise is almost steady (second part), and after that, the temperature increase, and thus their efficiency, drops due to high temperatures at their inlet. As can be concluded from Figure 5, the ETC series reaches its steady state sooner than the PVT collector, while this period of nearly constant temperature increase lasts much longer than that of the PVT series. The temperature increase and the produced thermal energy have similar behavior, as can be seen in Figure 4. The investigated parameters increase almost linearly until 11:00 for the ETC and 11:30 for the PVT collectors. After that time, and until 13:10 for the PVT and 14:20 for the ETC, the temperature increase of the heat transfer fluid is constant at about 7.8 °C and 12.8 °C, respectively. During the period above, the corresponding produced thermal energy is nearly 2.3 kW (PVT) and 5.6 kW (ETC). Because of this, it can be assumed that during the aforementioned periods, the collectors have reached their steady-state condition. After this steady state, the performance of the system declines due to high inlet temperatures and lower irradiance levels.

4.2. Thermal Energy Storage

The temperature distribution within the buffer tank, as well as the rate of the thermal energy stored in the buffer, are presented in Figure 6 and Figure 7, respectively. Each of the temperatures represent the whole corresponding tank zone, following the hypothesis of uniform temperature distribution. It can be seen that after 10:00, the temperatures increase almost linearly at rates of 7.14 °C/h, 5.13 °C/h and 4.49 °C/h, respectively. Through the variation of the tank temperatures, the overall losses from the tank to the laboratory ambient are calculated on the basis of Equation (2), and thus the stored thermal energy can obtained by implementing Equation (3), and the results are depicted in Figure 7. It can be observed that the total thermal losses follow the curve of the storage temperatures, as they correlate linearly. It should be mentioned that the overall losses are negligible as the tank is adequately insulated with soft polyurethane of 0.1 m thickness. The storage profile follows the curve of the irradiance, since it can be considered to be the final product of the energy conversion in the absorber of each collector. The maximum storage rate is nearly 7.7 kW, observed during the collectors’ steady-state phase, while the integration of the storage rate over a period of 9 h yields the total thermal energy stored in the tank which is calculated equal to 24.70 kWh or 88.94 MJ.

4.3. Adsorption Chiller Performance

As mentioned earlier, the data required for the evaluation of the chiller’s performance were collected from the OPC every second, since the operation of the chiller is dynamic and the conditions (heat transfer fluid temperatures at the inlet and outlet of the chiller) change rapidly. The operation test lasted for an hour and was initiated after the charging phase of the buffer tank (at 17:00). The results for the heat source temperatures are shown in Figure 8. Regarding the regeneration, heat rejection and load curves, for almost 20 min, the energy provided to the chiller from the buffer tank was used to preheat the components (metal, zeolite beds, etc.), and thus no substantial cooling capacity was provided from the evaporator. This period can be characterized as the transient phase of the chiller’s operation. After those 20 min, the operation had reached its nearly steady state, and three distinct cycles were formatted. The duration of each cycle was 11 min. The sudden variations of hot water outlet temperature at the beginning of each cycle were due to the fact that adsorption chiller’s beds change roles during the switching period. Specifically, the bed that was previously acting as the adsorber was preheated in order to act as the desorber during the upcoming stage. After the three cycles under study, the chiller continued to operate by repeating the same patterns with respect to the cycle curves. However, as the operation continued, the chiller achieved lower temperatures at the evaporation outlet, as can be seen in Figure 8, reaching 12 °C after the end of the third cycle.
In Figure 9, the variation of the produced cooling output during the 11 min that each cycle lasts is presented. It can be observed that the maximum cooling capacity drops as the number of cycles increases. By integrating the variation of each curve with time, the average cooling production can be calculated for each cycle. The average cooling capacity for each cycle was 1.99 kW, 1.62 kW, 1.43 kW, respectively. The relatively low values of the produced cooling load can be justified by the mass flow rates chosen for the experiments, which were lower than the nominal mass flow rates of the adsorption chiller ( m ˙ h w , n o m 0.81   kg / m , m ˙ c w , n o m 1.42   kg / m , m ˙ c h w , n o m 0.69   kg / m ). The variation in the chiller’s COP, shown in Figure 10, follows the curves of cooling capacity, with its peak being observed one minute after the maximum cooling capacity production. The average values of COP per cycle were 0.491, 0.496 and 0.465, respectively. These values are close to the nominal one (COPnom = 0.6), which means that the adsorption chiller, although working at lower loads, exhibits sufficient performance. The obtained COP values are consistent with the available literature, both in theoretical and experimental studies. Indicatively, an average COP of 0.41 was estimated for June for an adsorption solar cooling system simulated under the climatic conditions of Athens, Greece [14]. With respect to experimental studies, a maximum COP of 0.535 was observed in a similar solar cooling system investigated under the climatic conditions of Athens, Greece [21]. Furthermore, an average COP of 0.43 was obtained in a solar driven adsorption cooling system installed at the Institute for Solar Energy (ISE) in Freiburg, Germany [25], while average COP values around 0.41 and 0.47 were obtained from a small-scale adsorption chiller tested at the University of Liège [20].
The comparison, on the basis of the refrigeration efficiency defined in Equation (9), of the real adsorption cycle with the Carnot refrigeration cycle that works within the same temperature levels yields rather low values (42.7% for the 1st cycle, 40.9% for the 2nd and 36.5% for the 3rd cycle), which means that thermodynamically, the experimental set-up does not qualify as ideal.
An important parameter, when examining refrigeration systems, is the exergy efficiency of the refrigeration cycle. In Figure 11, the variation of the system’s exergy efficiency is depicted on the basis of Equation (10). All three cycles exhibit similar variation of their exergy efficiency with a dropping tendency regarding their maximum efficiency. The average exergetic efficiency of each cycle is found through integration with time, a process that yields the following results: 0.234, 0.236 and 0.221.
Finally, and for the overall evaluation of the experimental procedure the energy balance is applied for each cycle. Figure 12 shows the variation of the energy balance. It can be observed that during most of the cycle period, the energy balance is satisfactorily fulfilled. The same conclusion cannot be reached for the beginning and end of each cycle in which the switching process affects the energy balance substantially. This is because the heat exchangers of the adsorption chiller change their operation between adsorption and desorption mode during this phase interrupting the steady operation of the chiller.

5. Conclusions

An integrated hybrid solar system installed at the Laboratory of Applied Thermodynamics was examined and evaluated experimentally in terms of thermal energy production and storage and cooling performance. The system consisted of two types of collectors connected in series, namely evacuated tube collectors and photovoltaic/thermal collectors, the total surface areas of which were 9.76 m2 and 11 m2, respectively, a zeolite adsorption chiller, and a storage tank functioning as an intermediate buffer. Through the experimental procedure and the data reduction, the produced useful energy, the stored thermal energy, the cooling capacity and the coefficient of performance and the chiller exergy efficiency were determined. The experiment took place on June the 22nd, a day representative of the climatic conditions in Athens, Greece. The main findings of the analysis are summarized below:
  • The combination of the examined solar collectors was efficient for driving the investigated solar cooling system during the whole year, serving both high and low cooling loads.
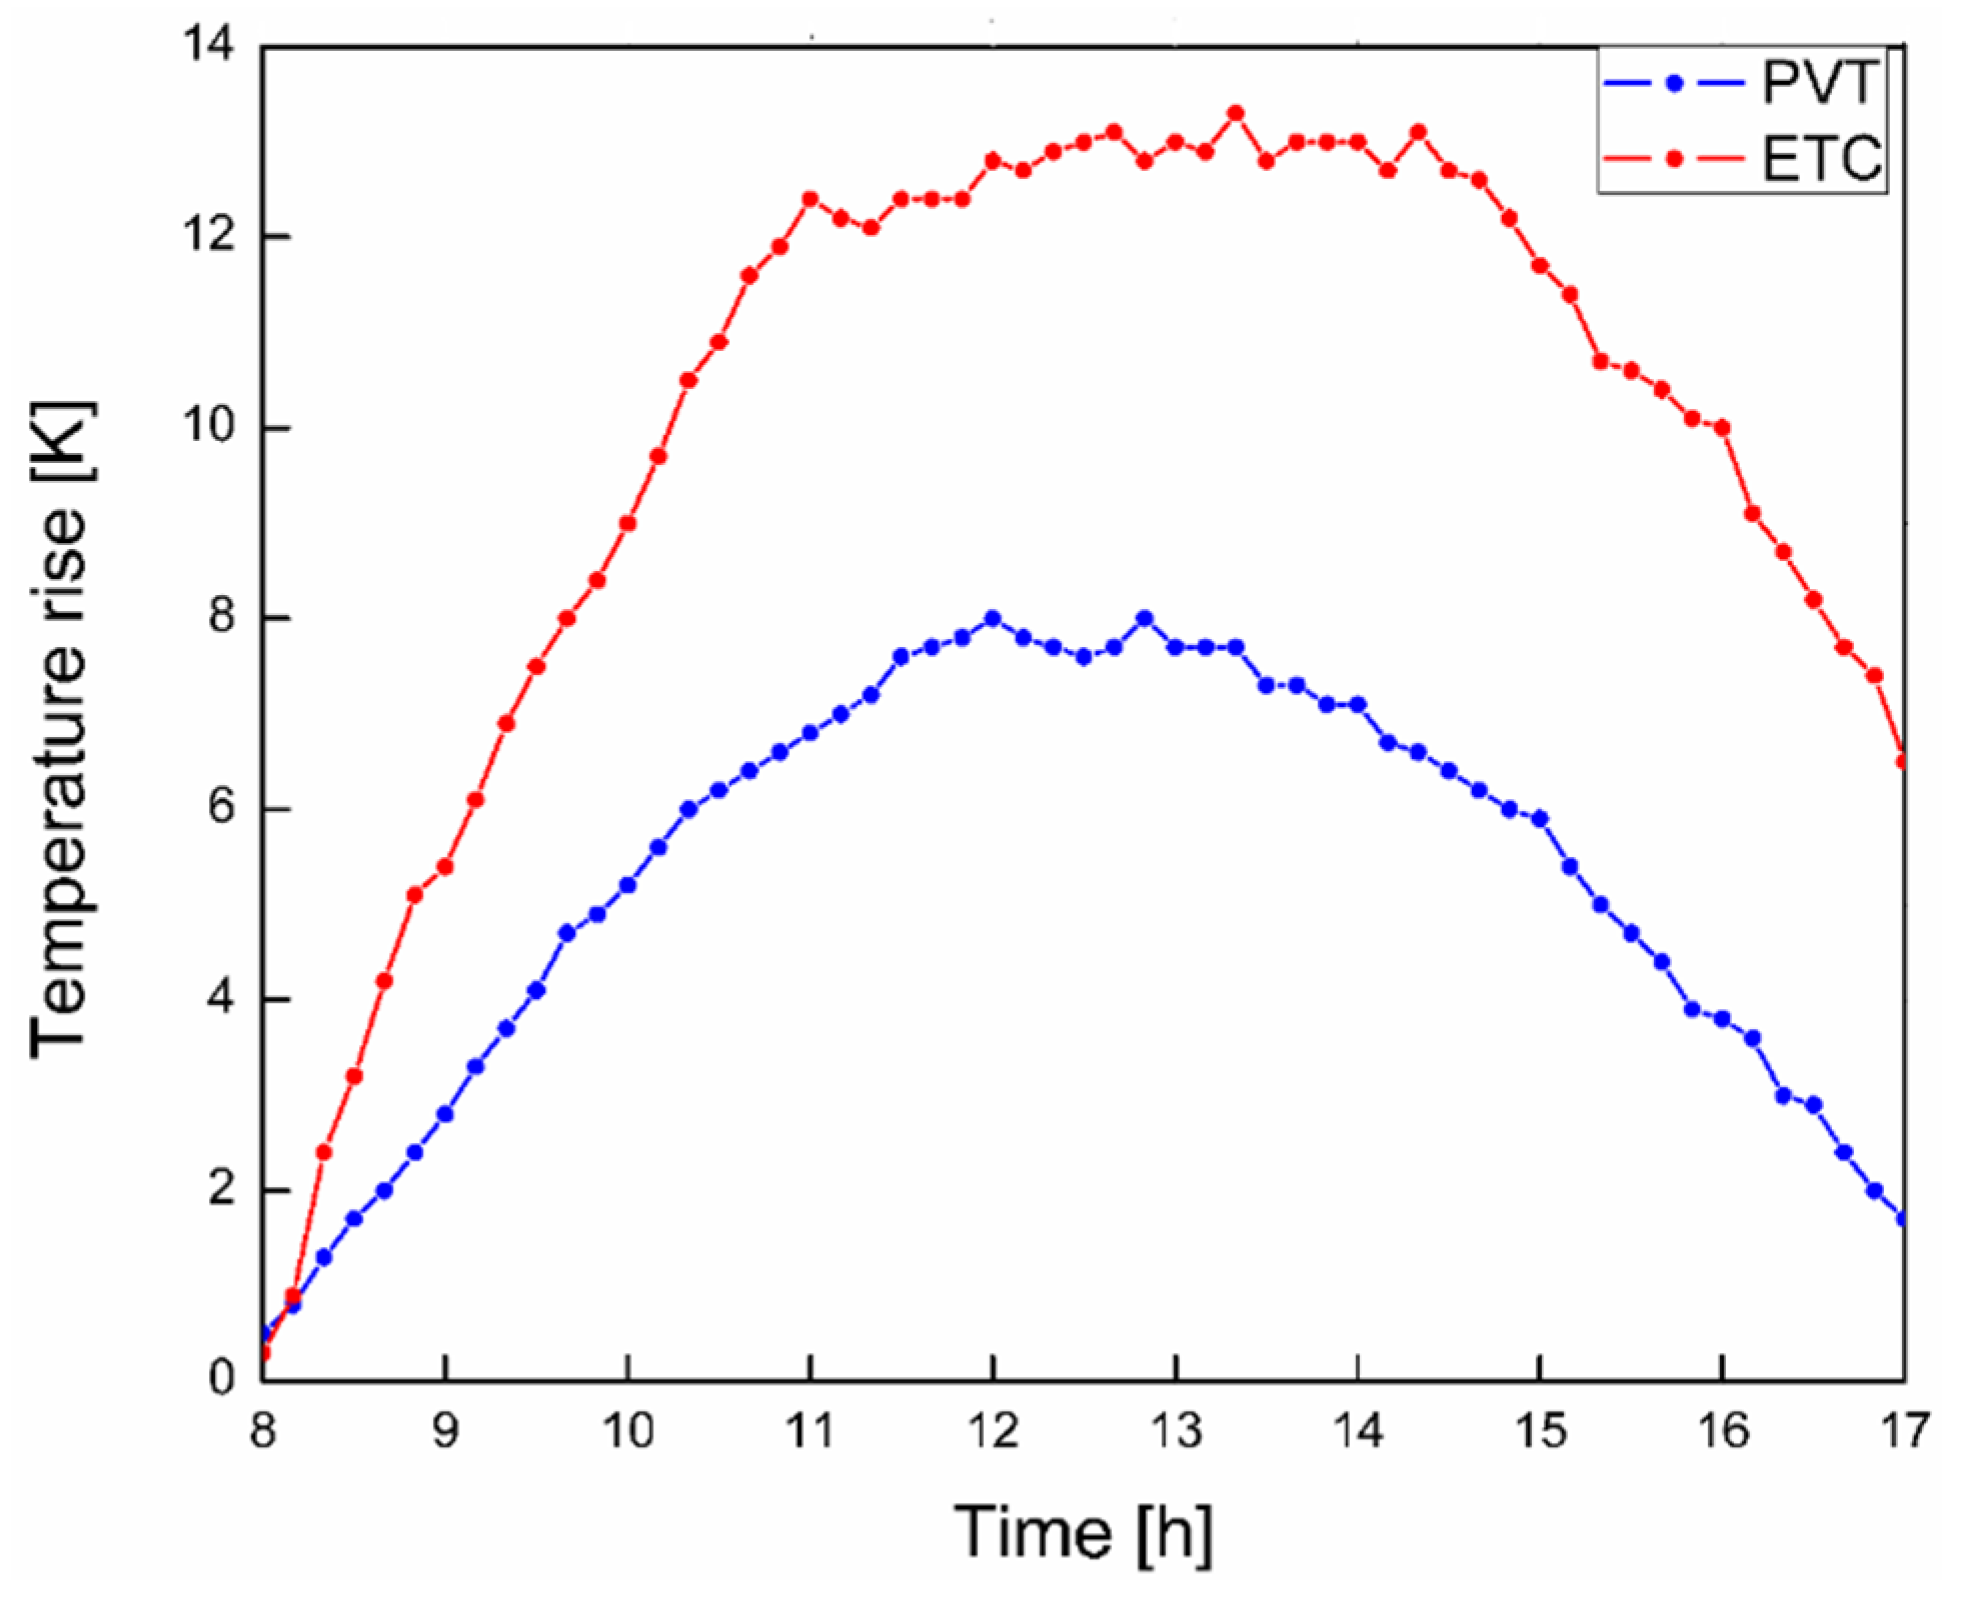
  • The steady-state period of the ETC series lasted longer than that of the PVT series.
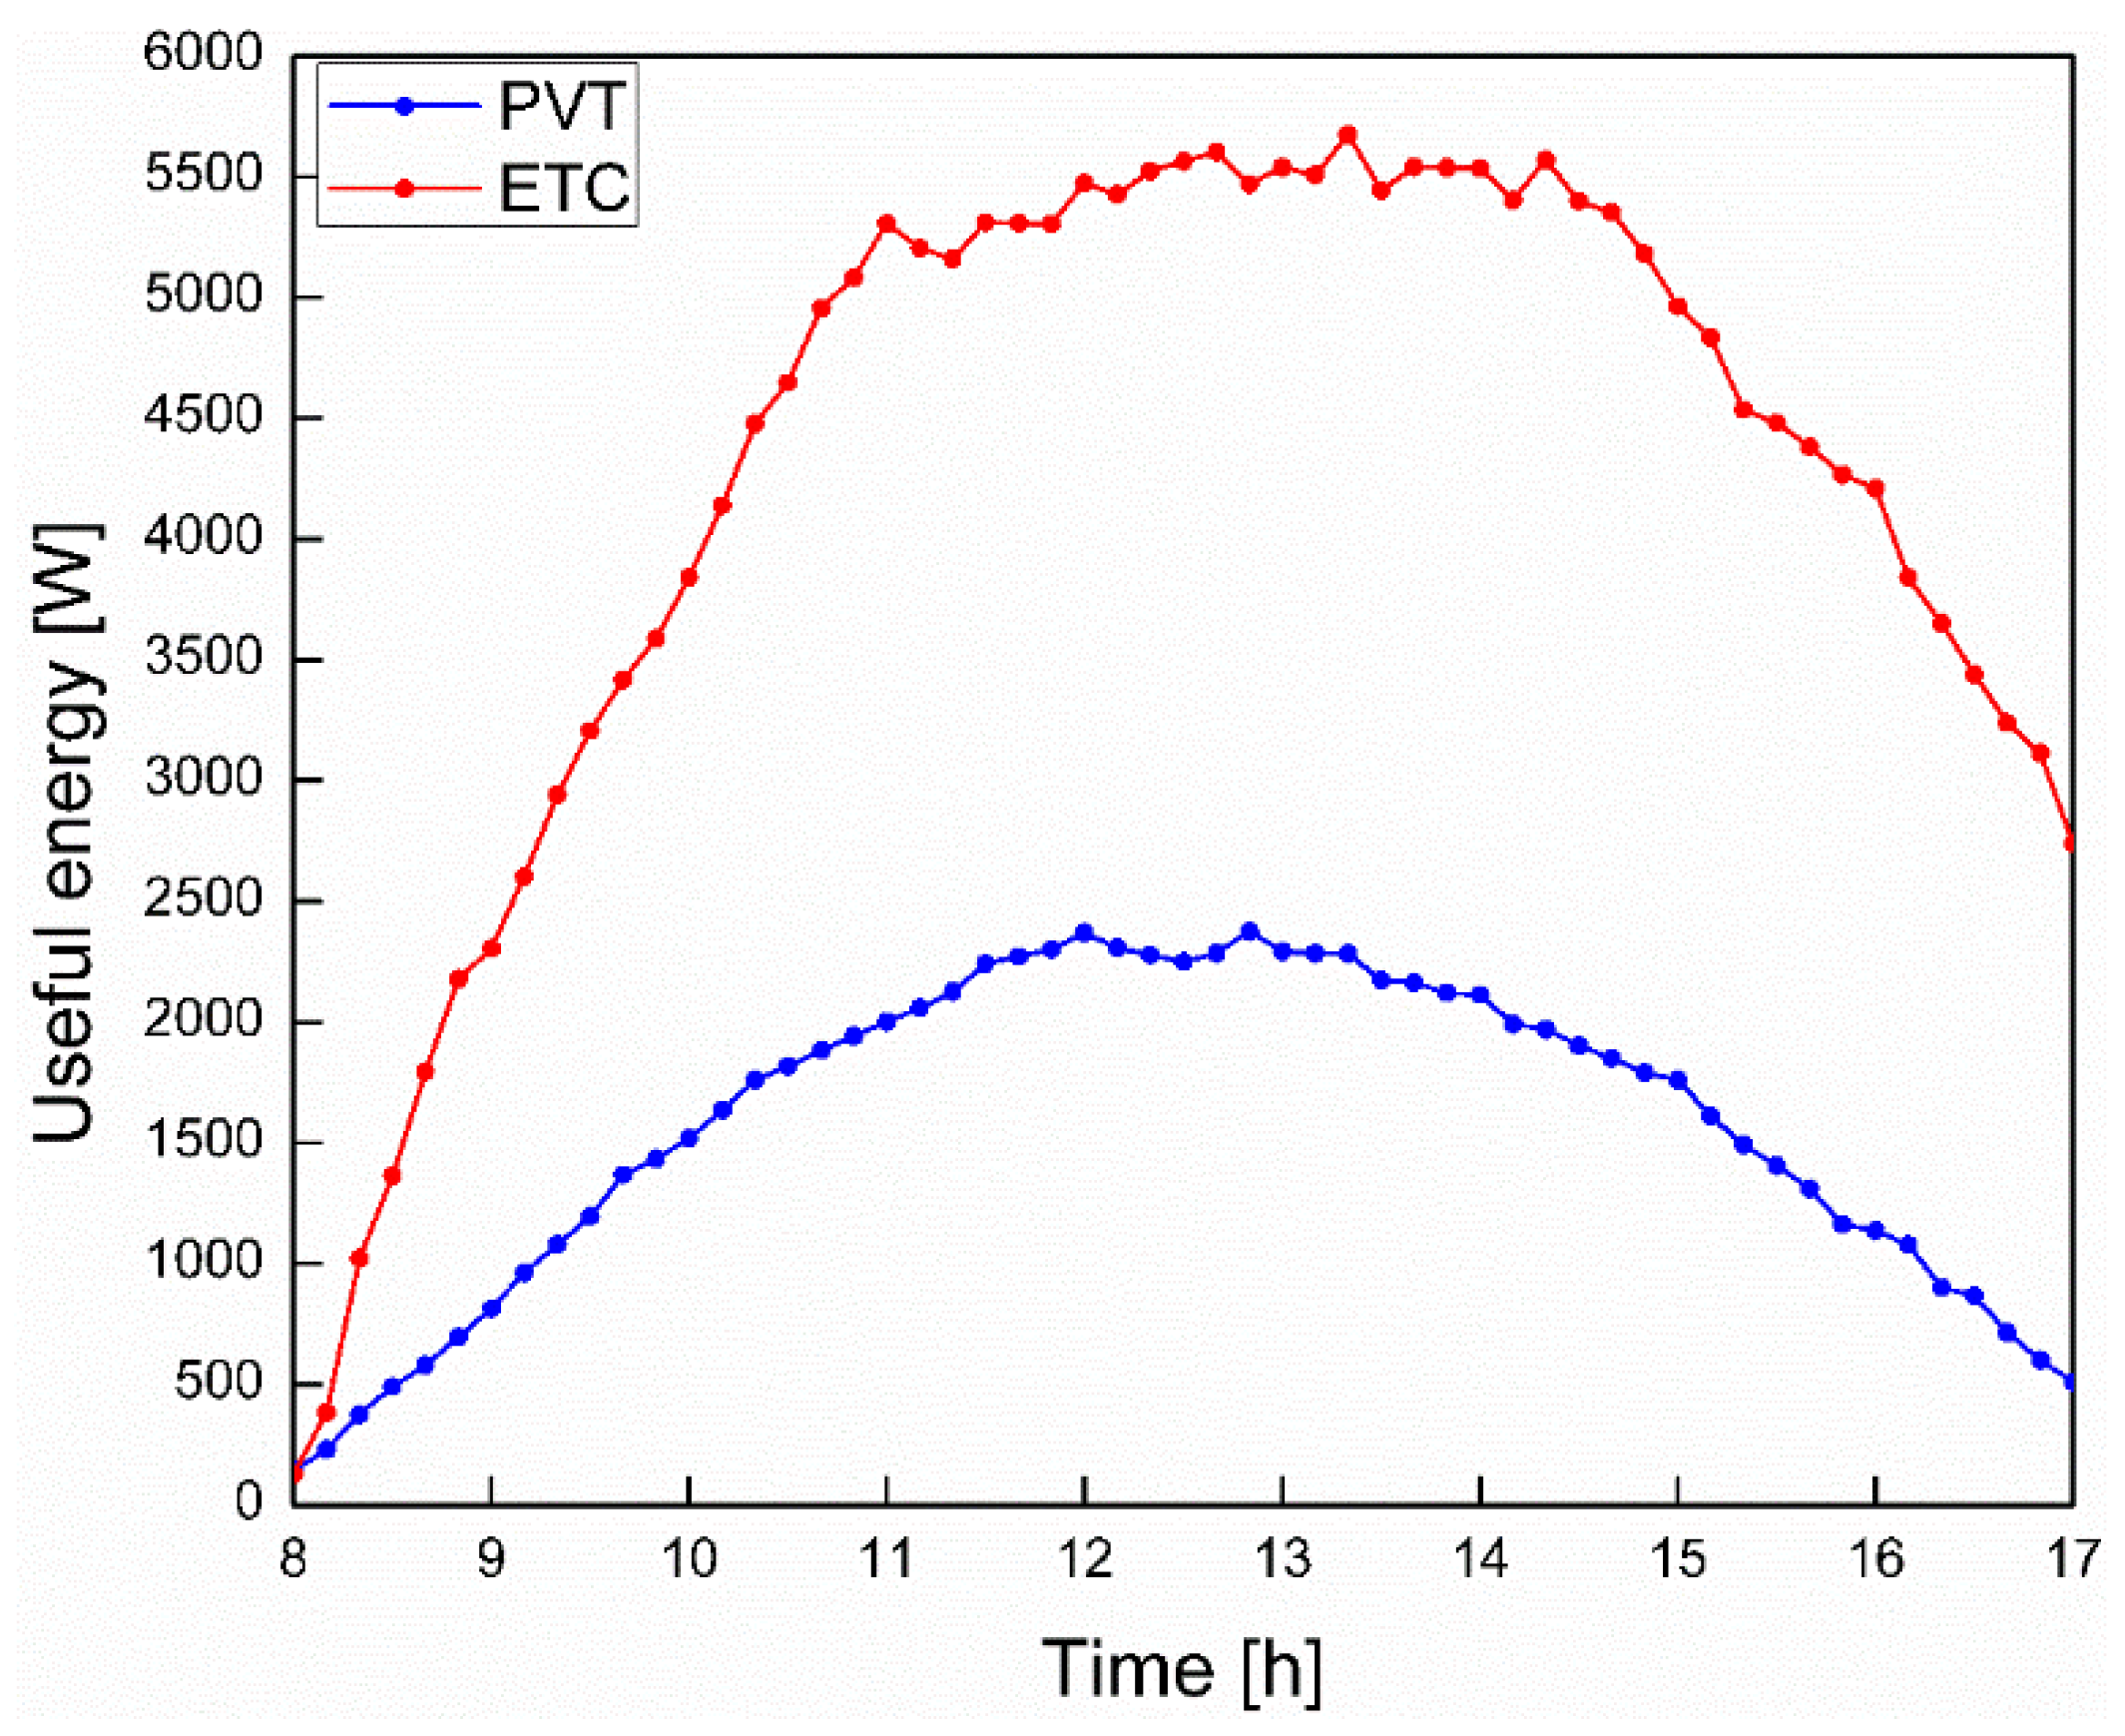
  • During this period, the working fluid in PVT collectors exhibited a 7.8 K rise in temperature, thus producing 2.3 kW of useful thermal power, while in ETC series the temperature rise was 12.8 K, with a production of useful power equal to 5.6 K.
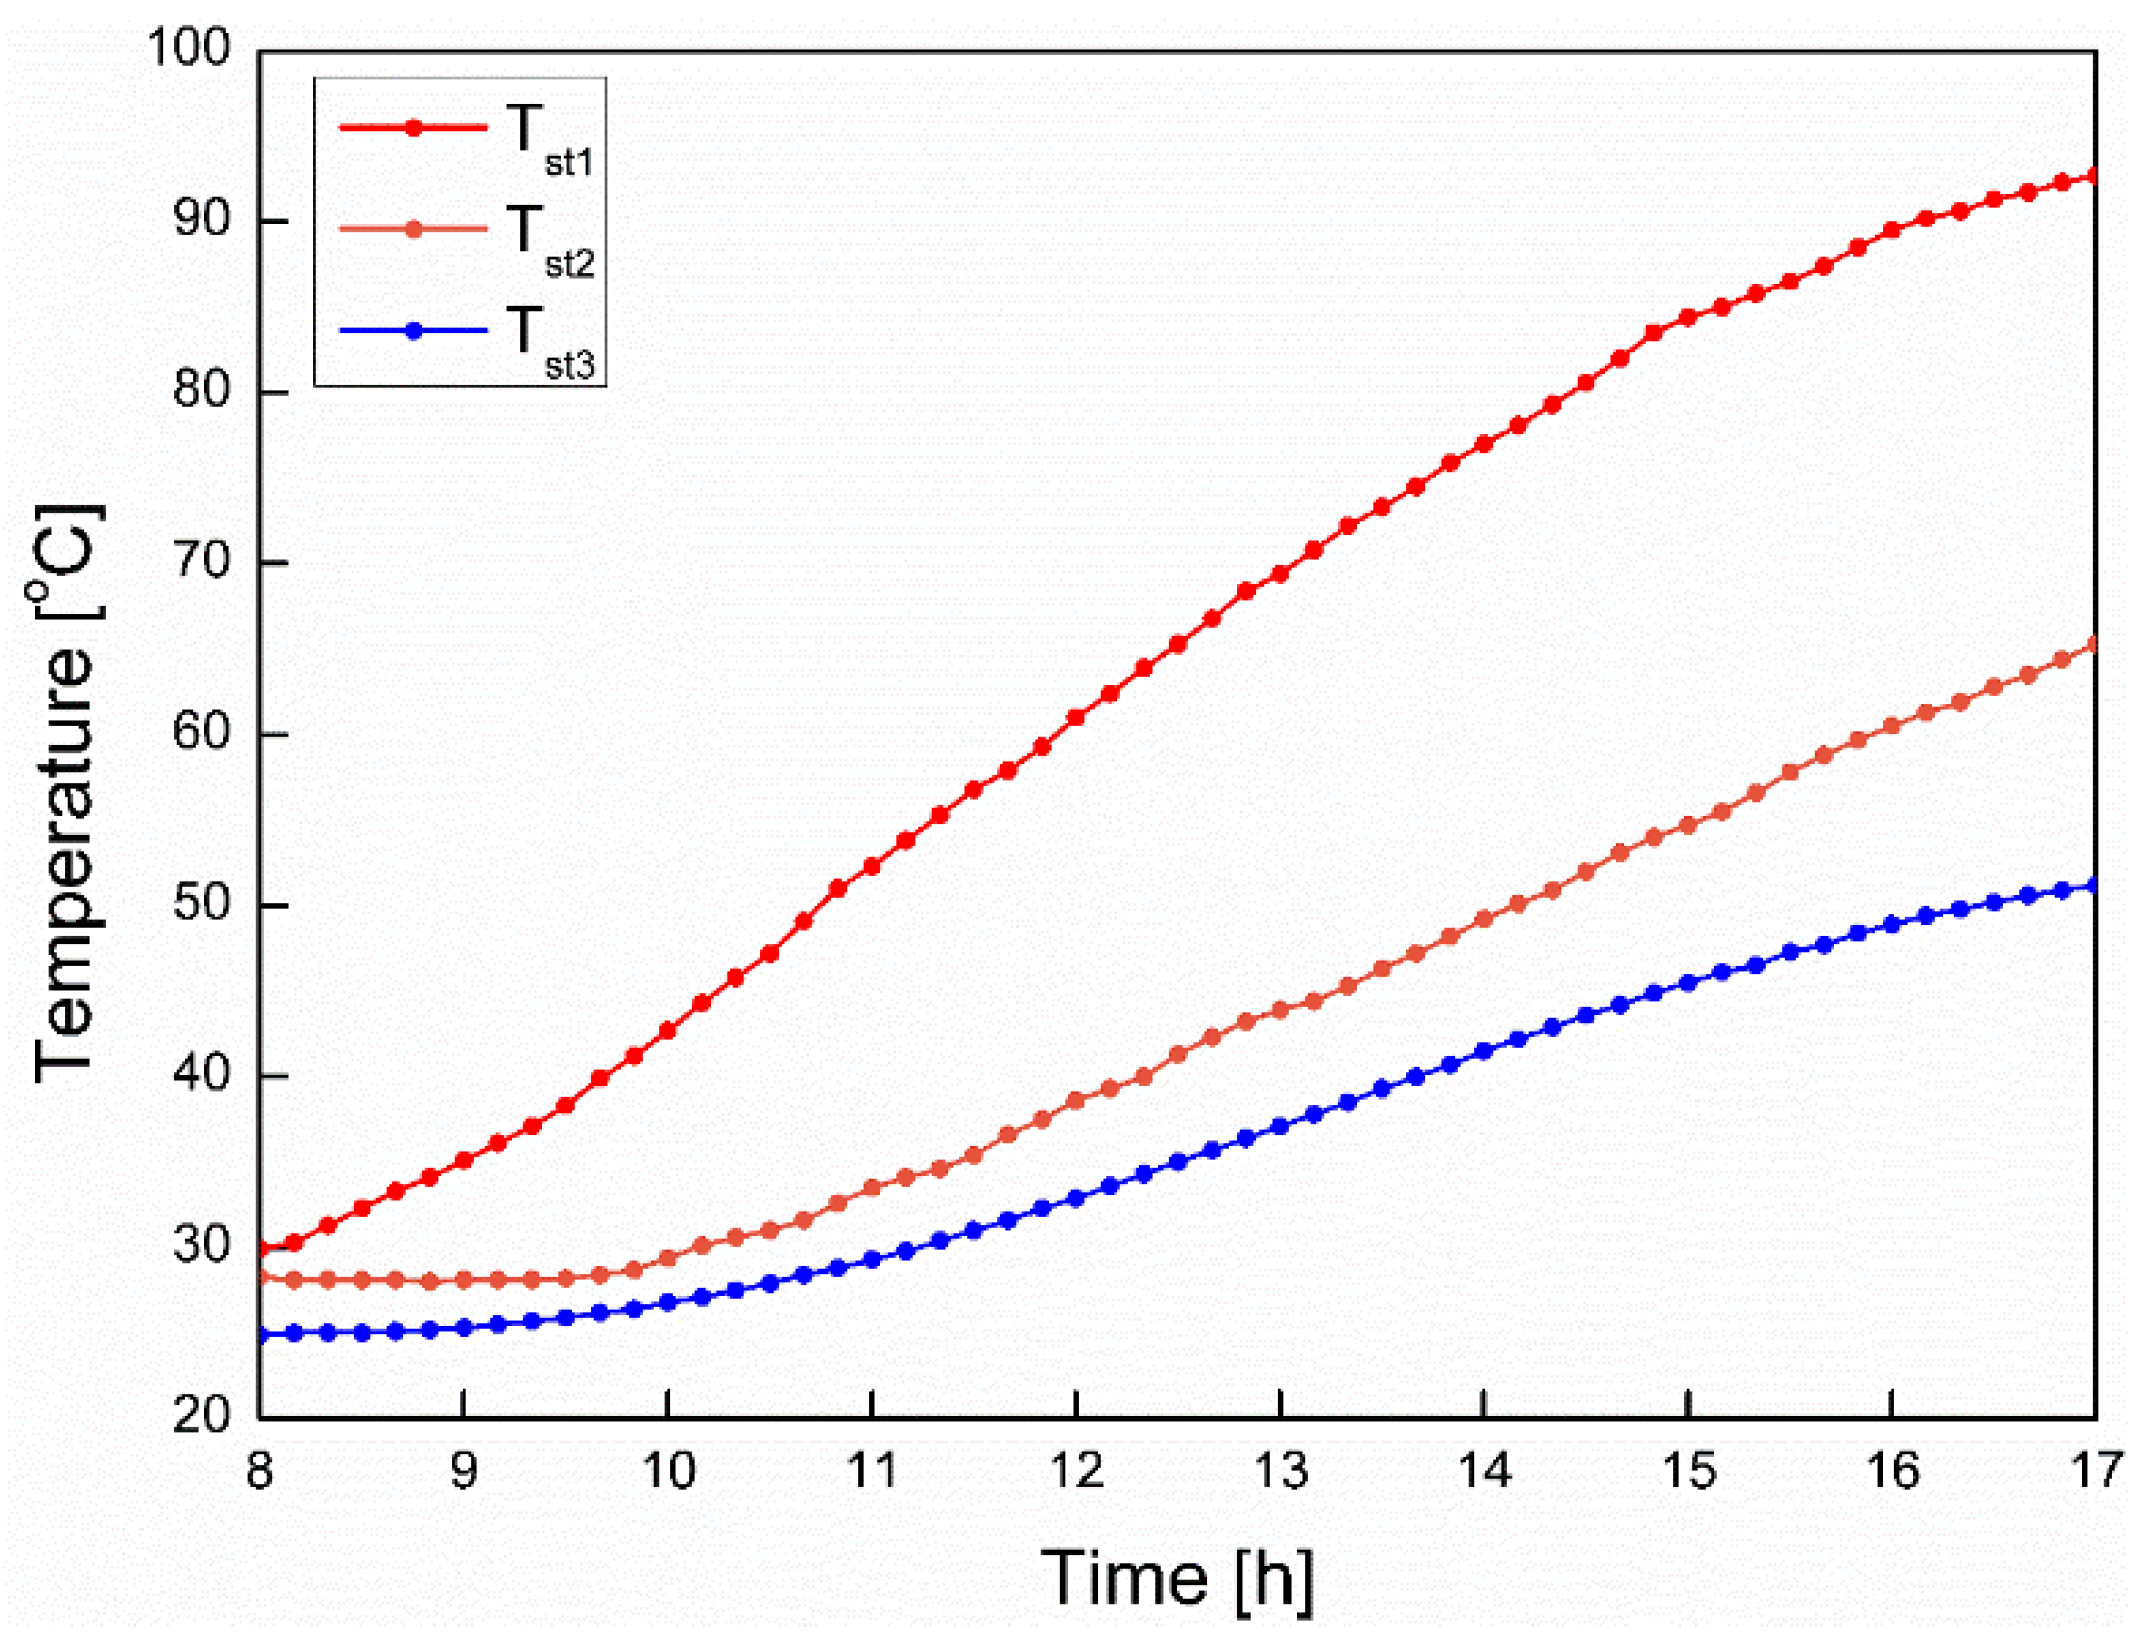
  • The storage tank can be divided into three zones. The temperature of each zone increased almost linearly (constant rate).
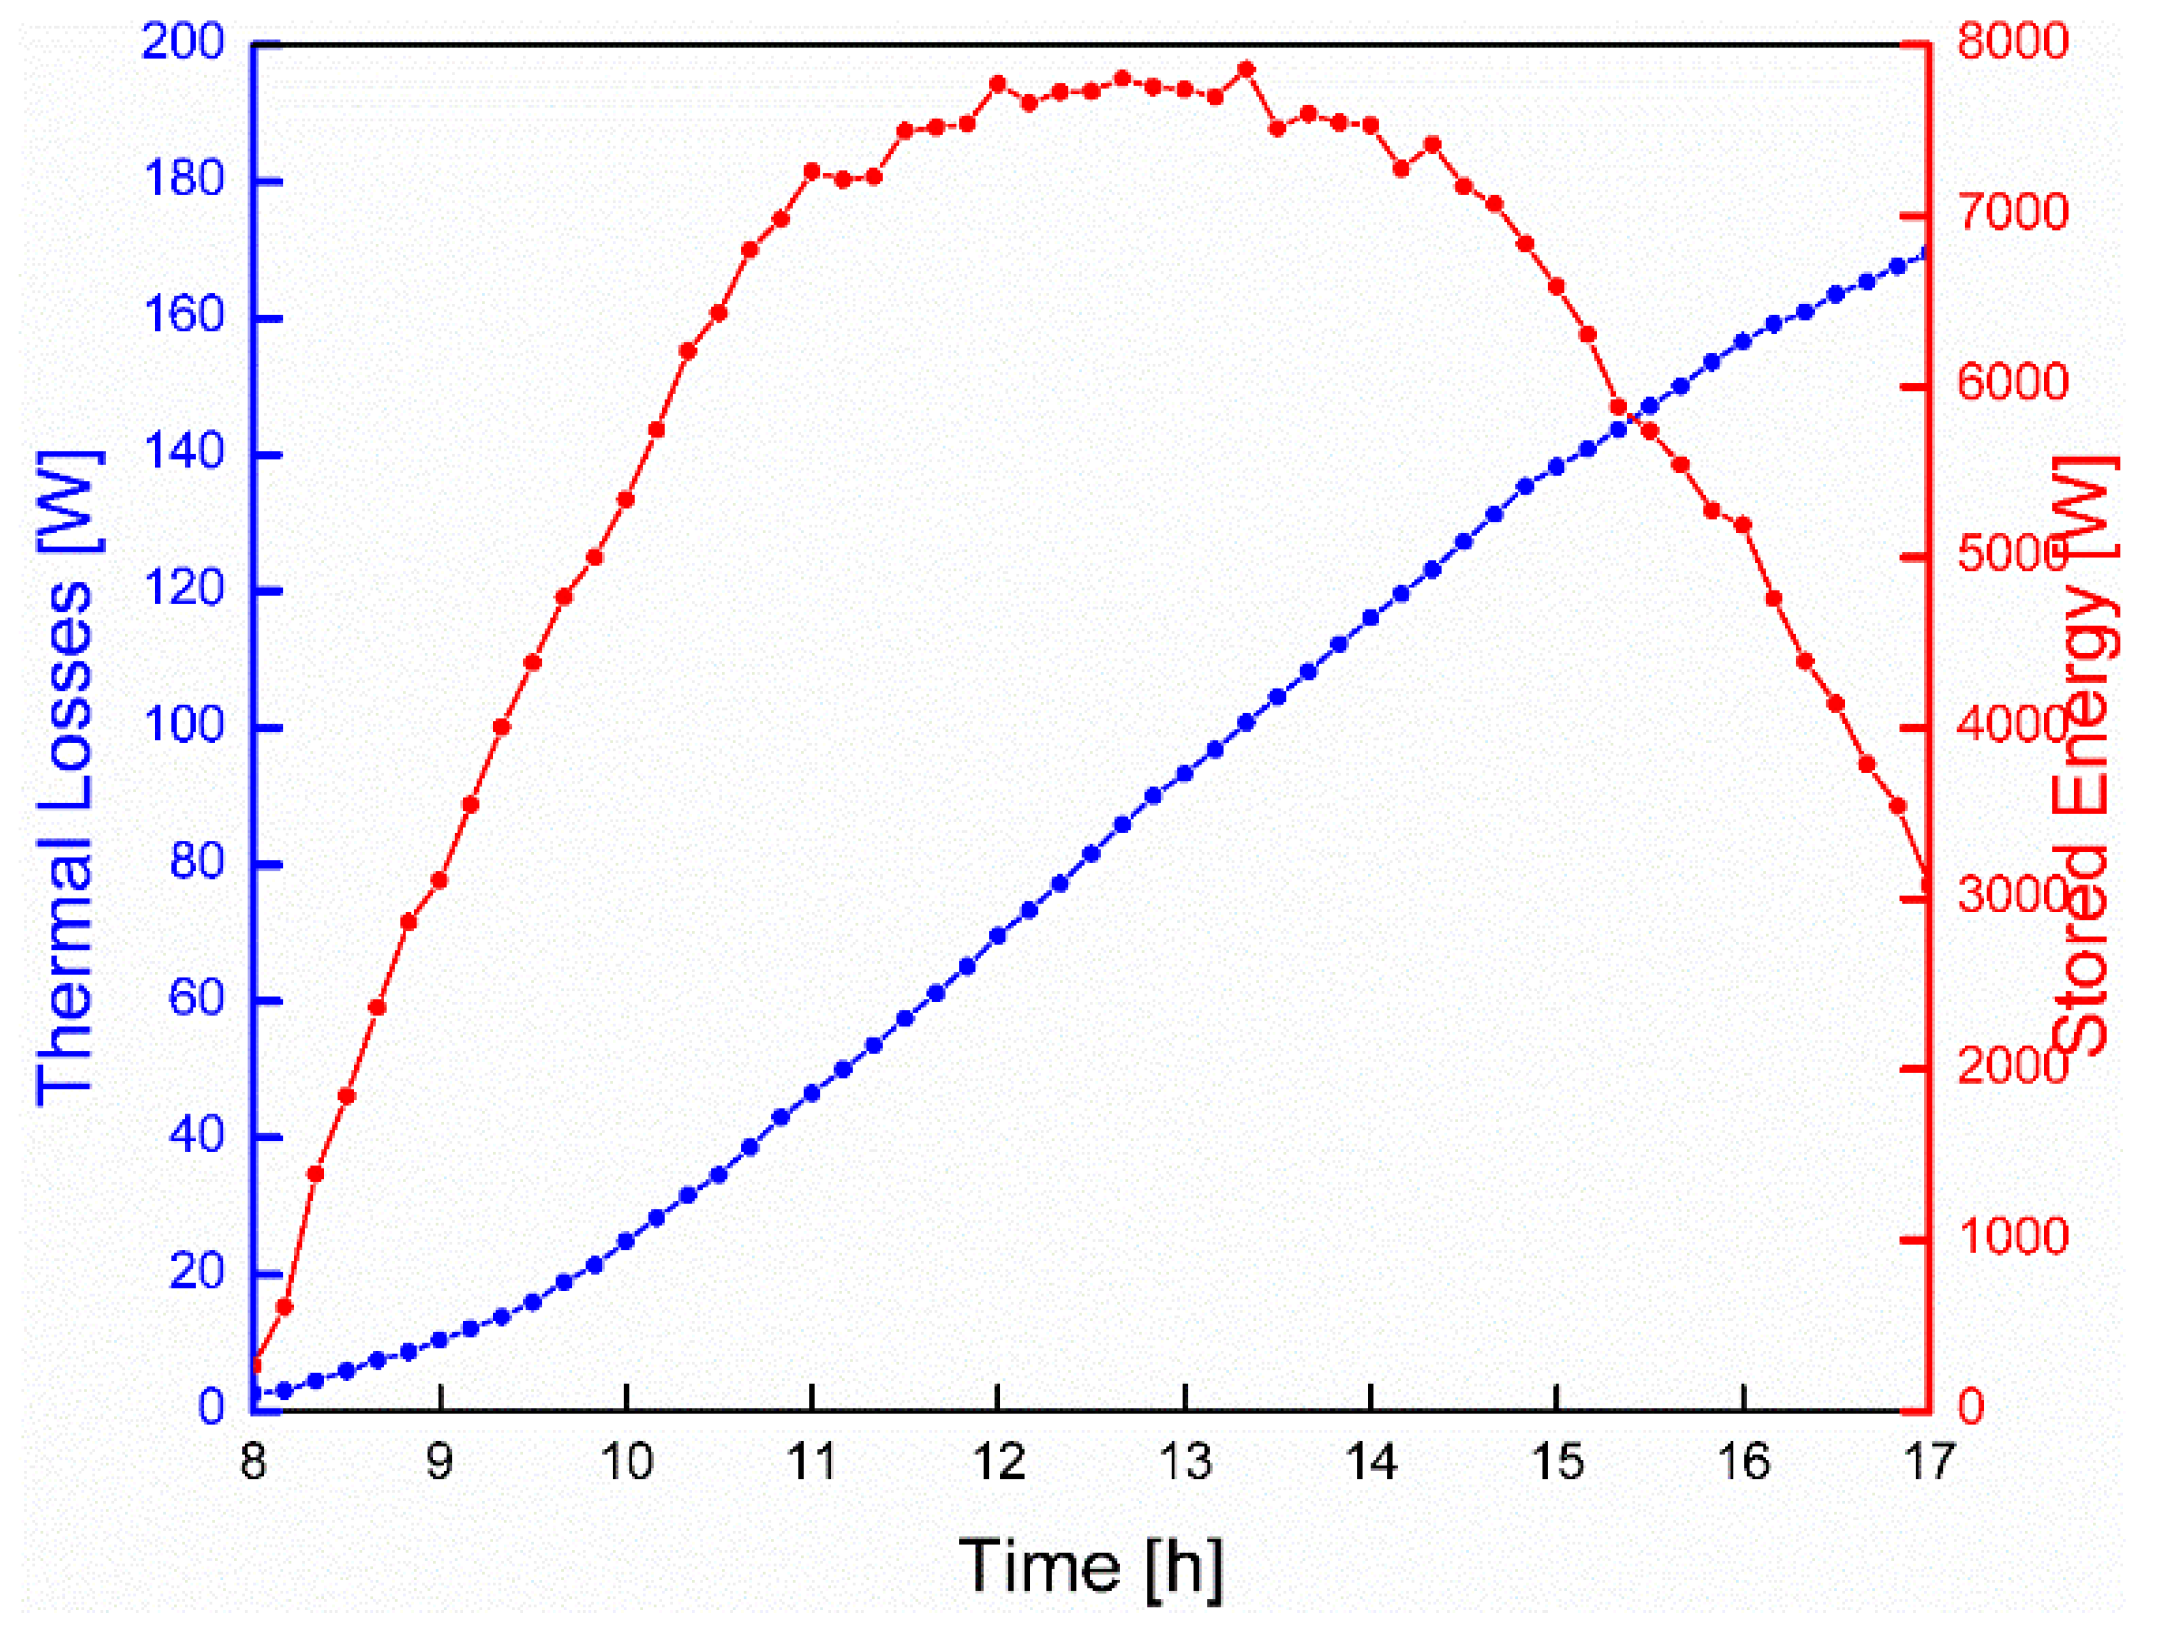
  • The heat losses of the storage tank exhibited a linear variation, as they followed the behavior of the storage tank temperatures.
  • The maximum storage rate was nearly 7.7 kW, observed during the collectors’ steady-state phase.
  • The total thermal energy stored in the tank during the 9 h experiment was equal to 24.70 kWh or 88.94 MJ.
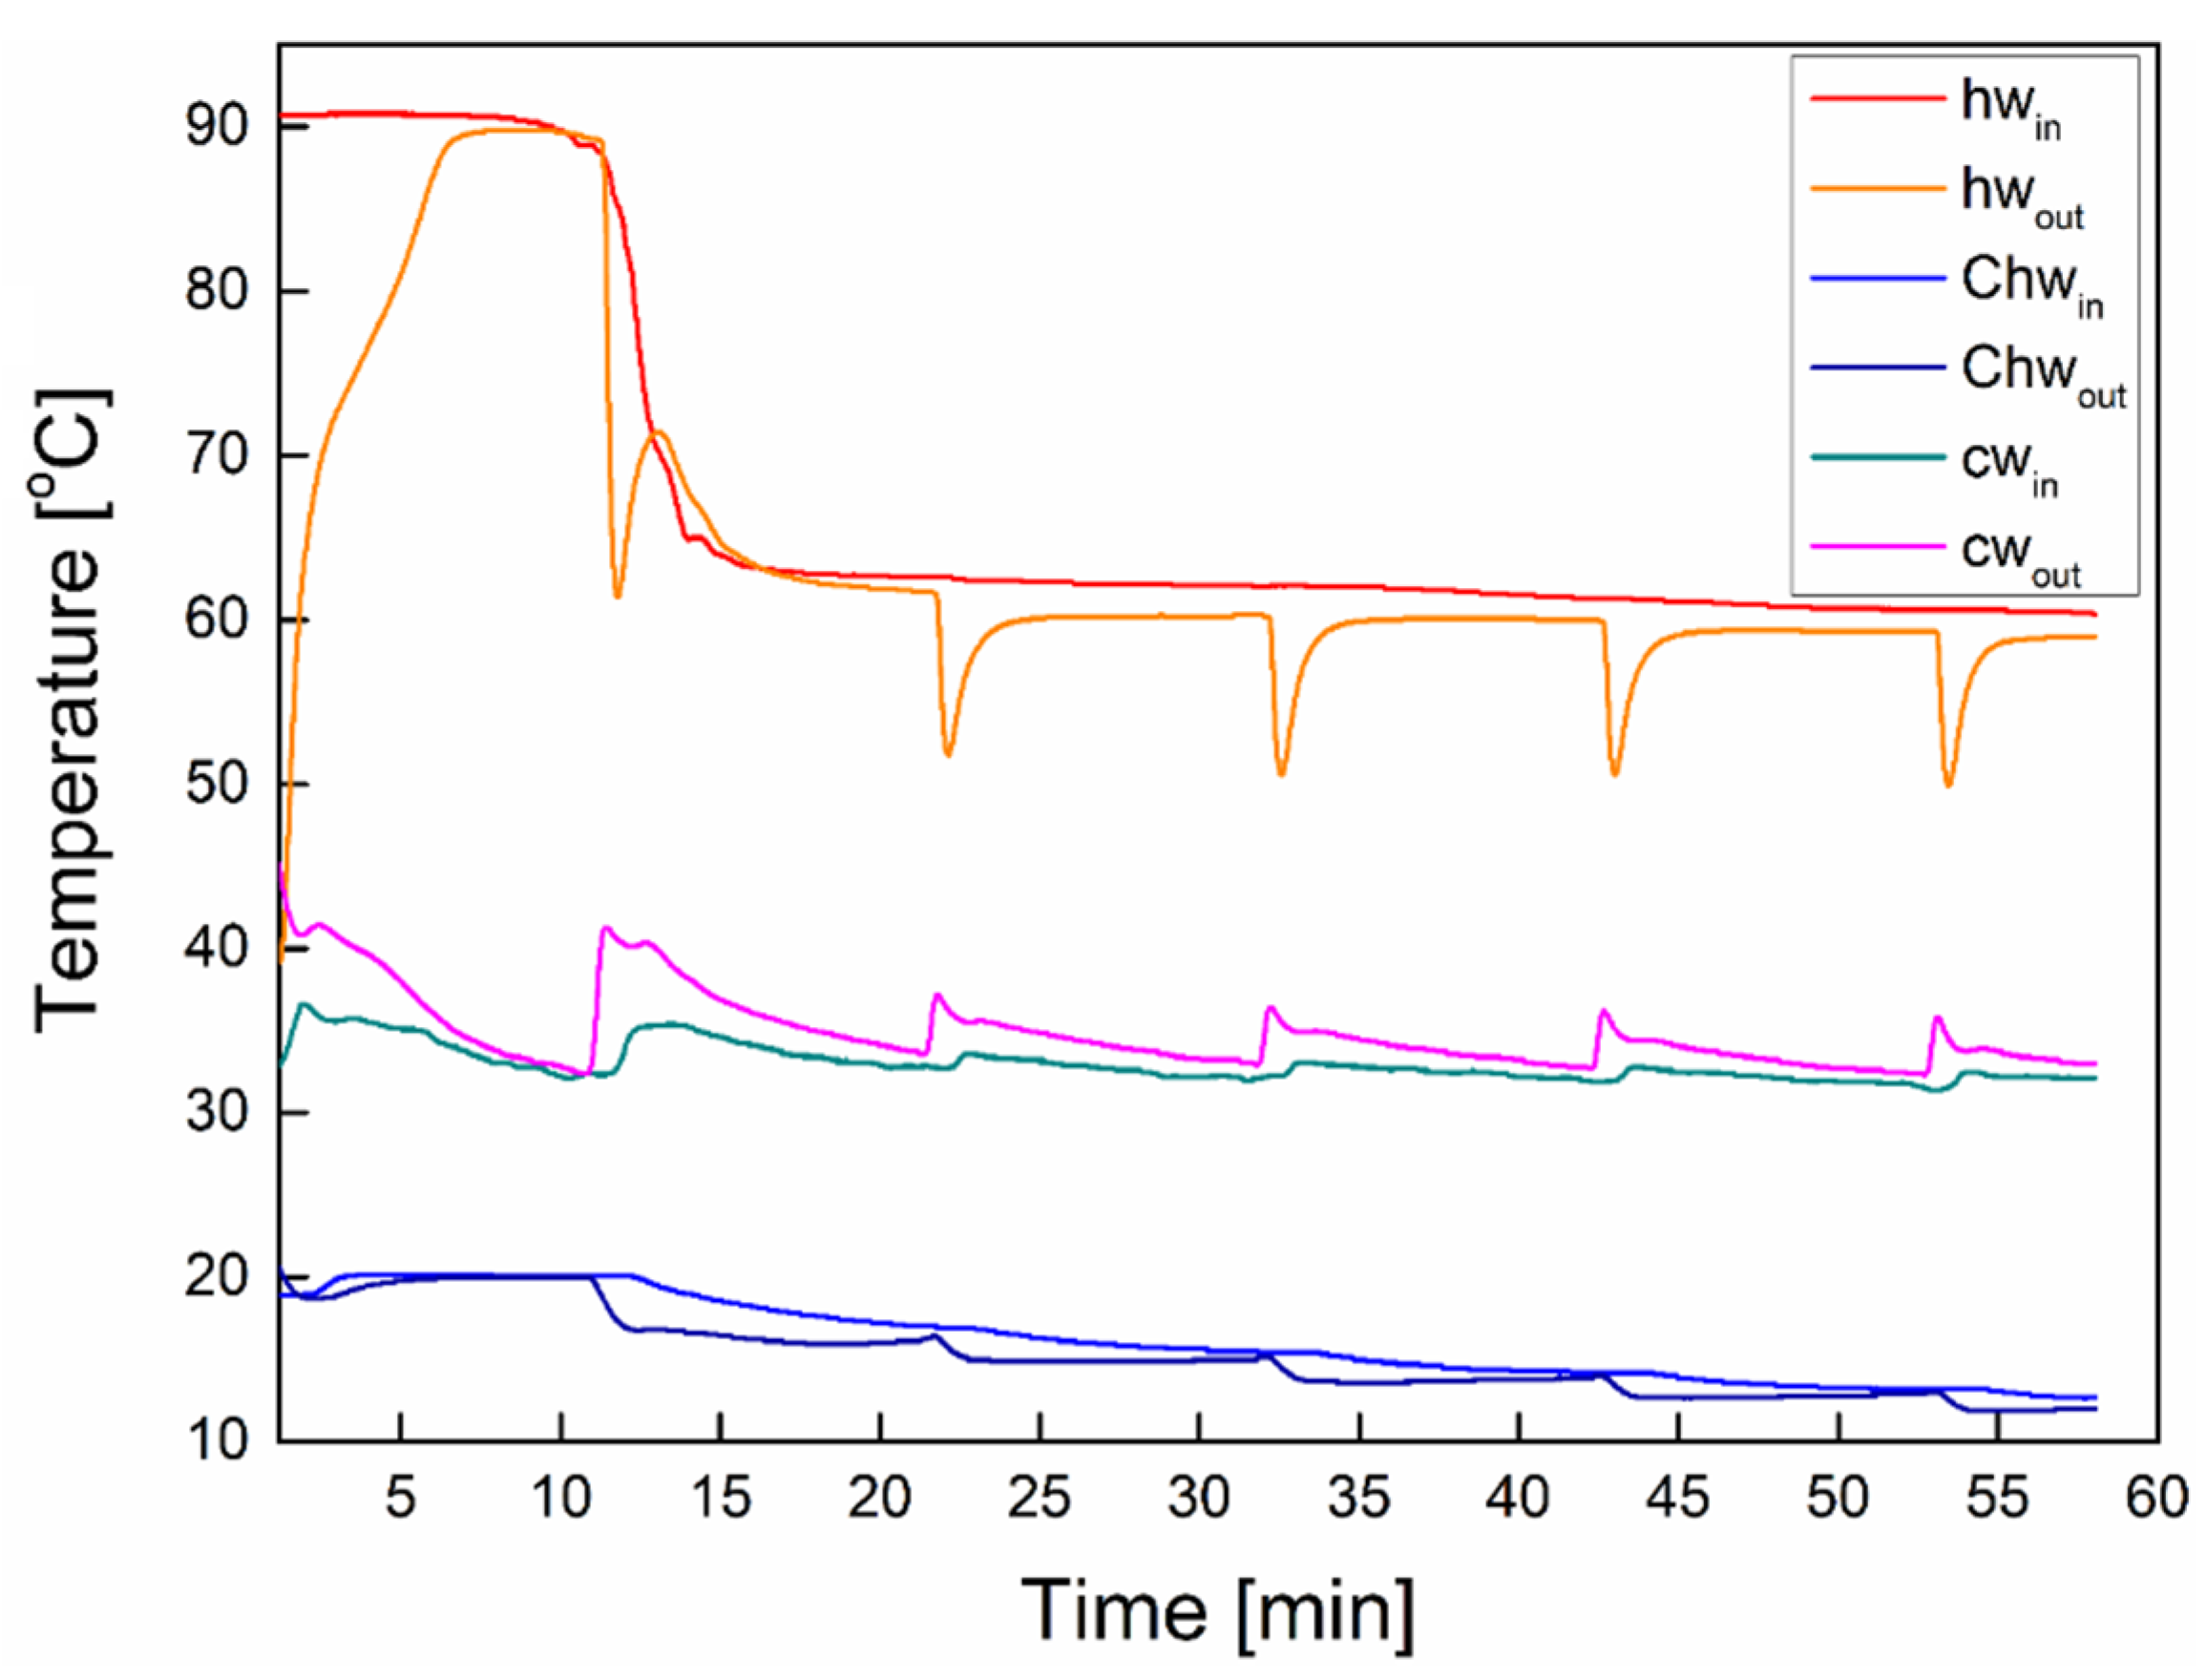
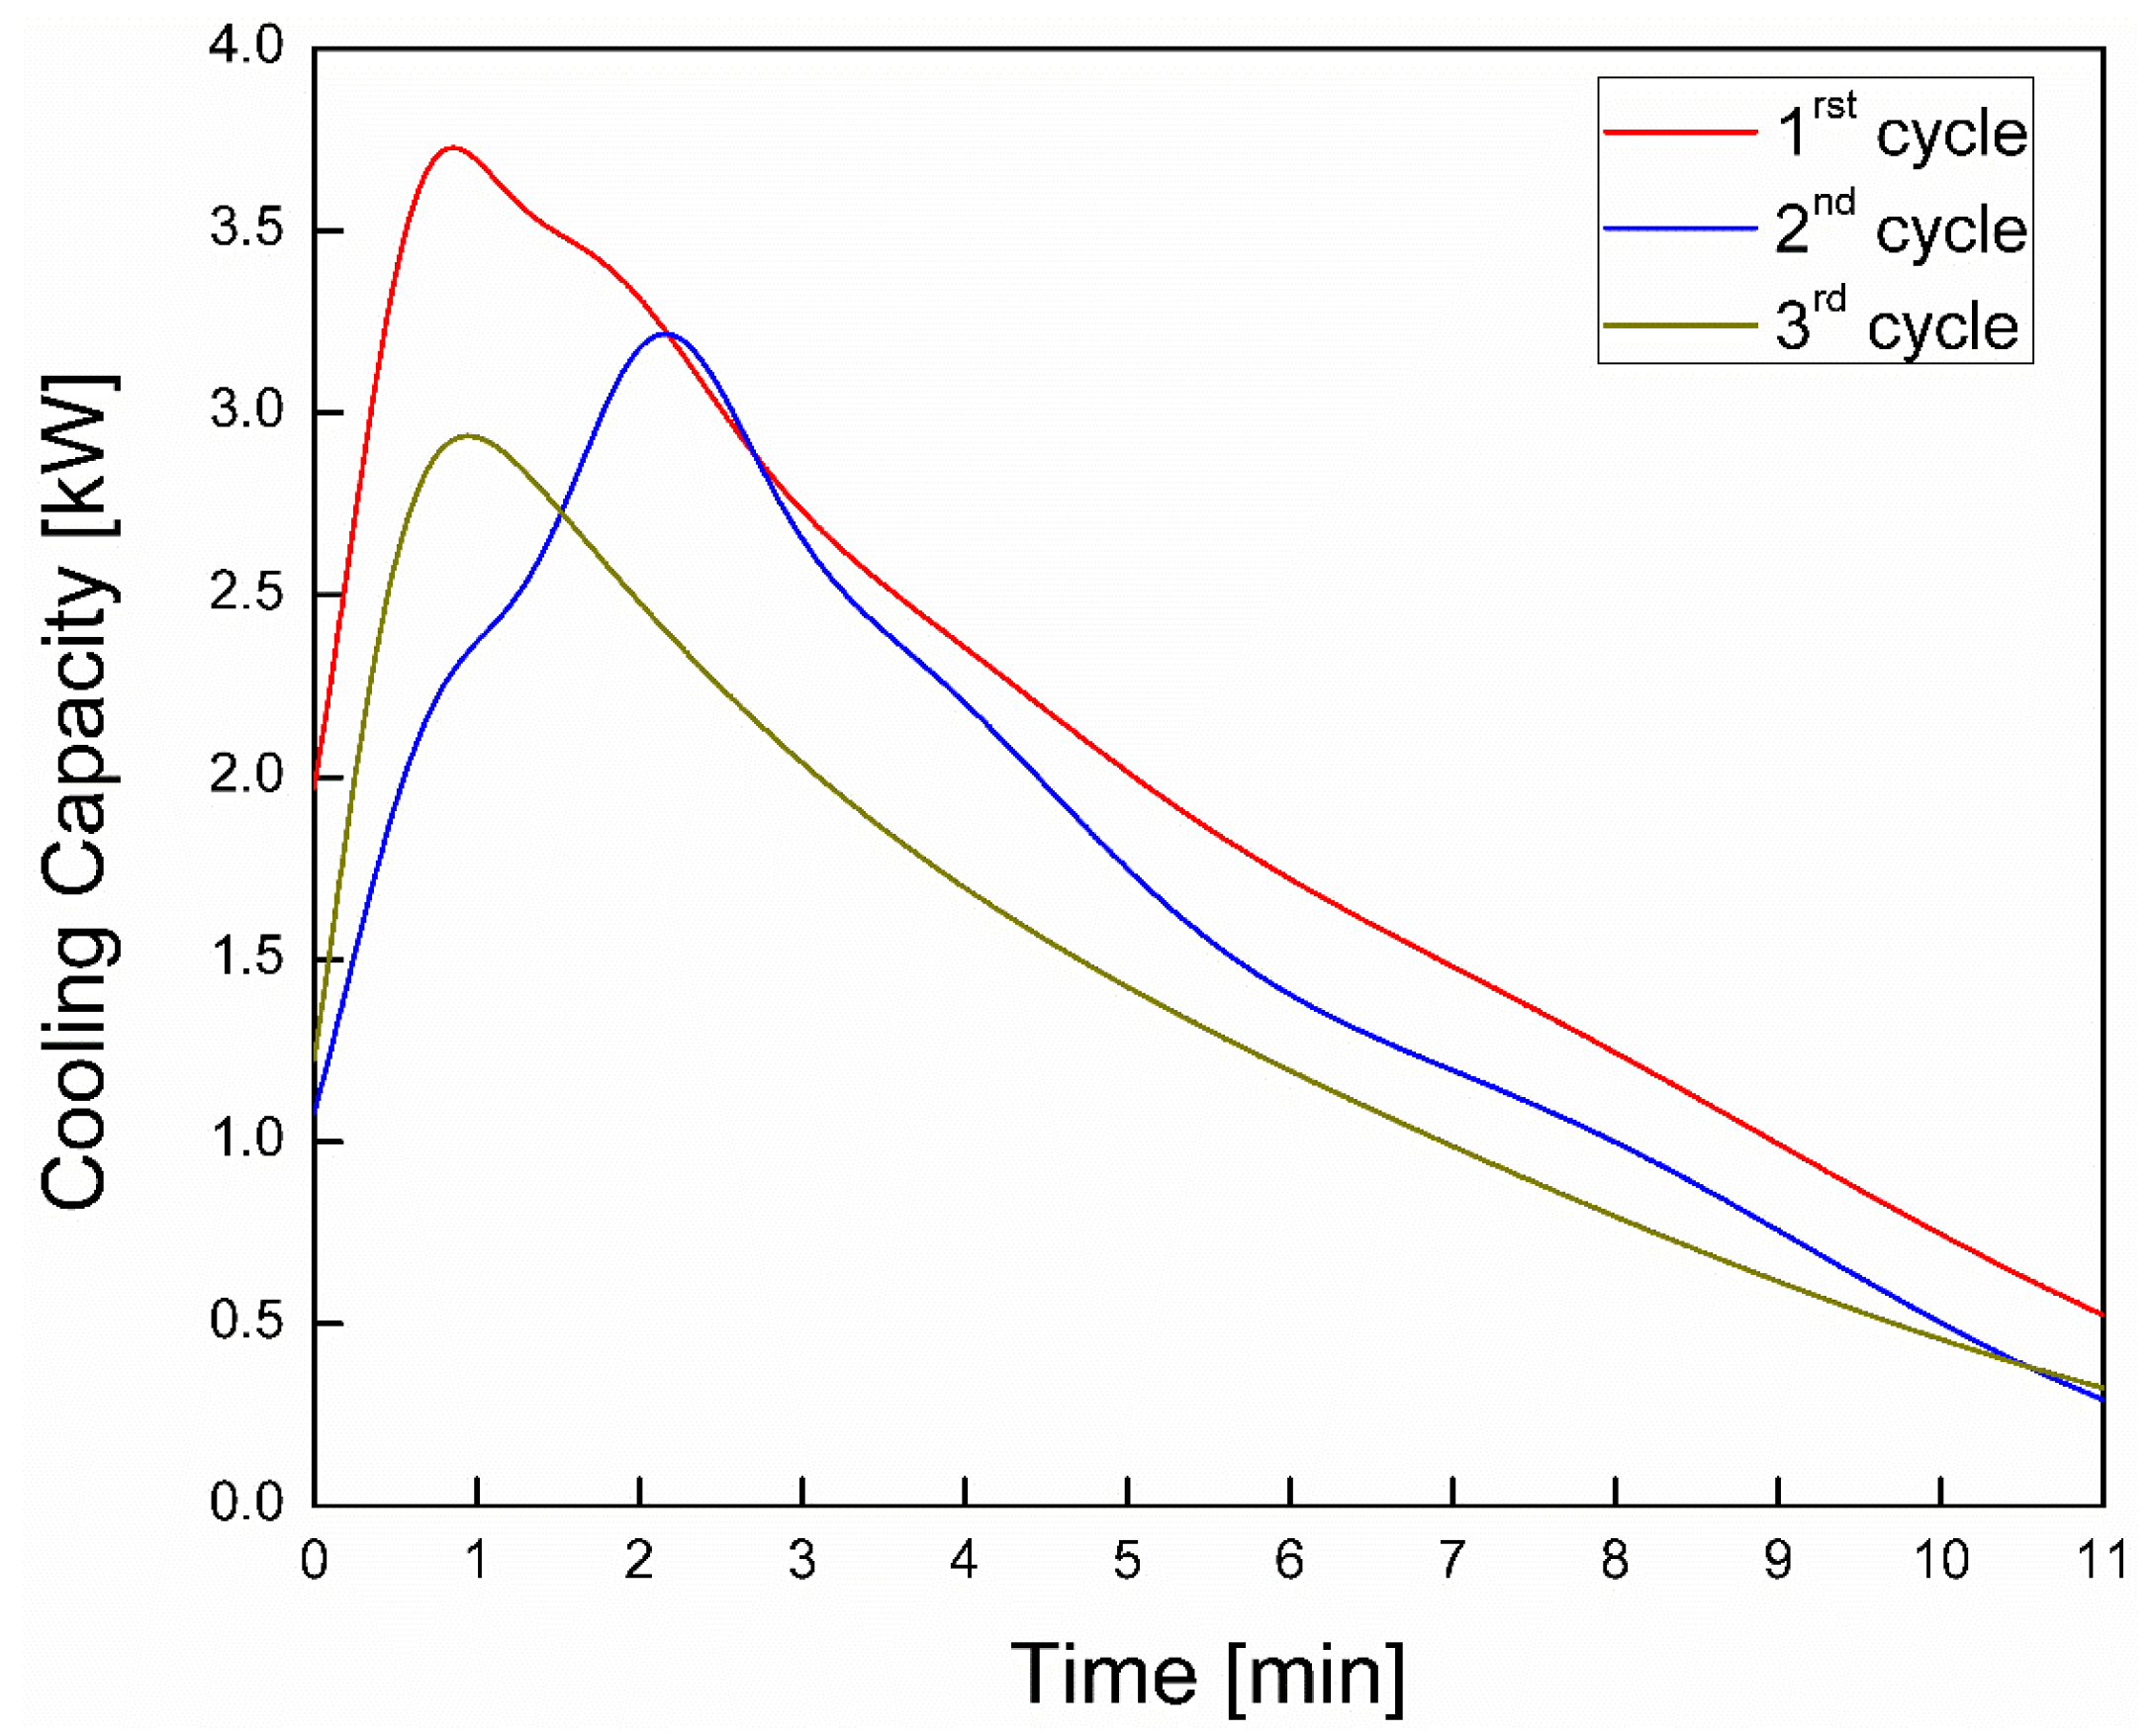
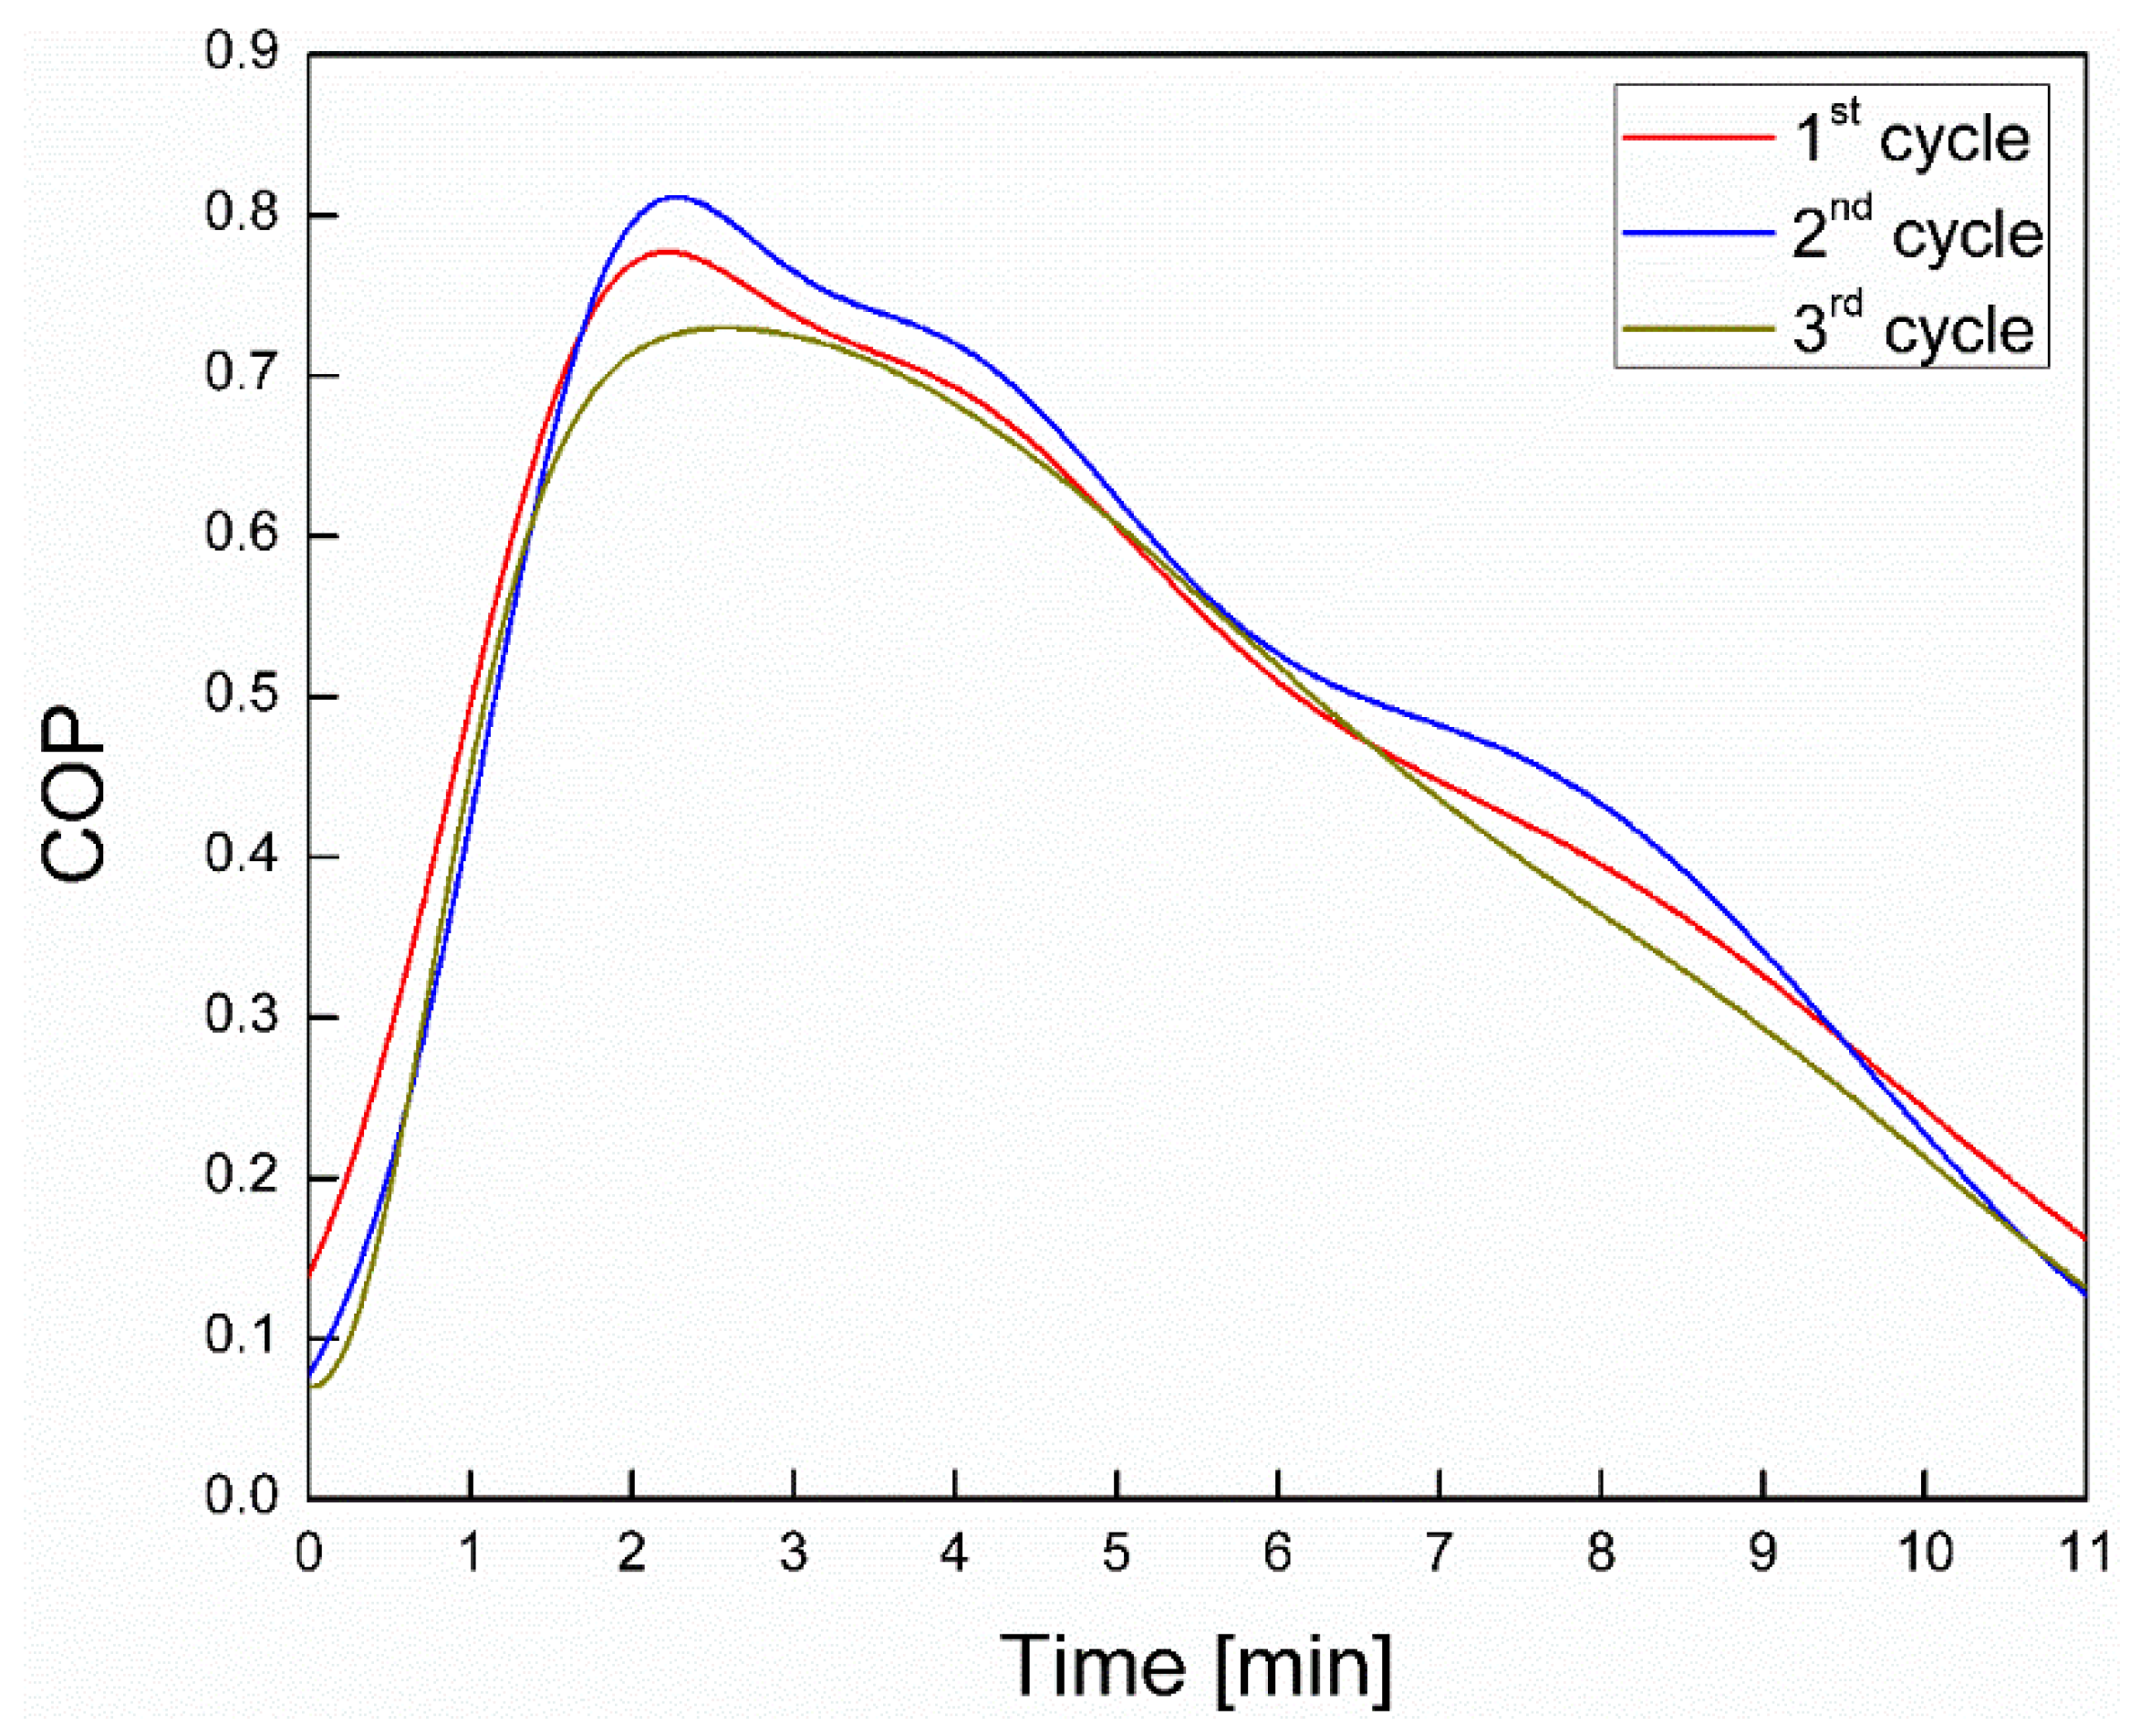
  • A transient phase of nearly 20 min was observed, after which three cycles of 11 min each were formatted and used for the present analysis.
  • After the end of third cycle, a minimum temperature of 12 °C was observed at the outlet of the evaporator.
  • The average cooling capacity of each cycle varied between 1.4–2.0 kW, while the average COP was almost constant at around 0.49.
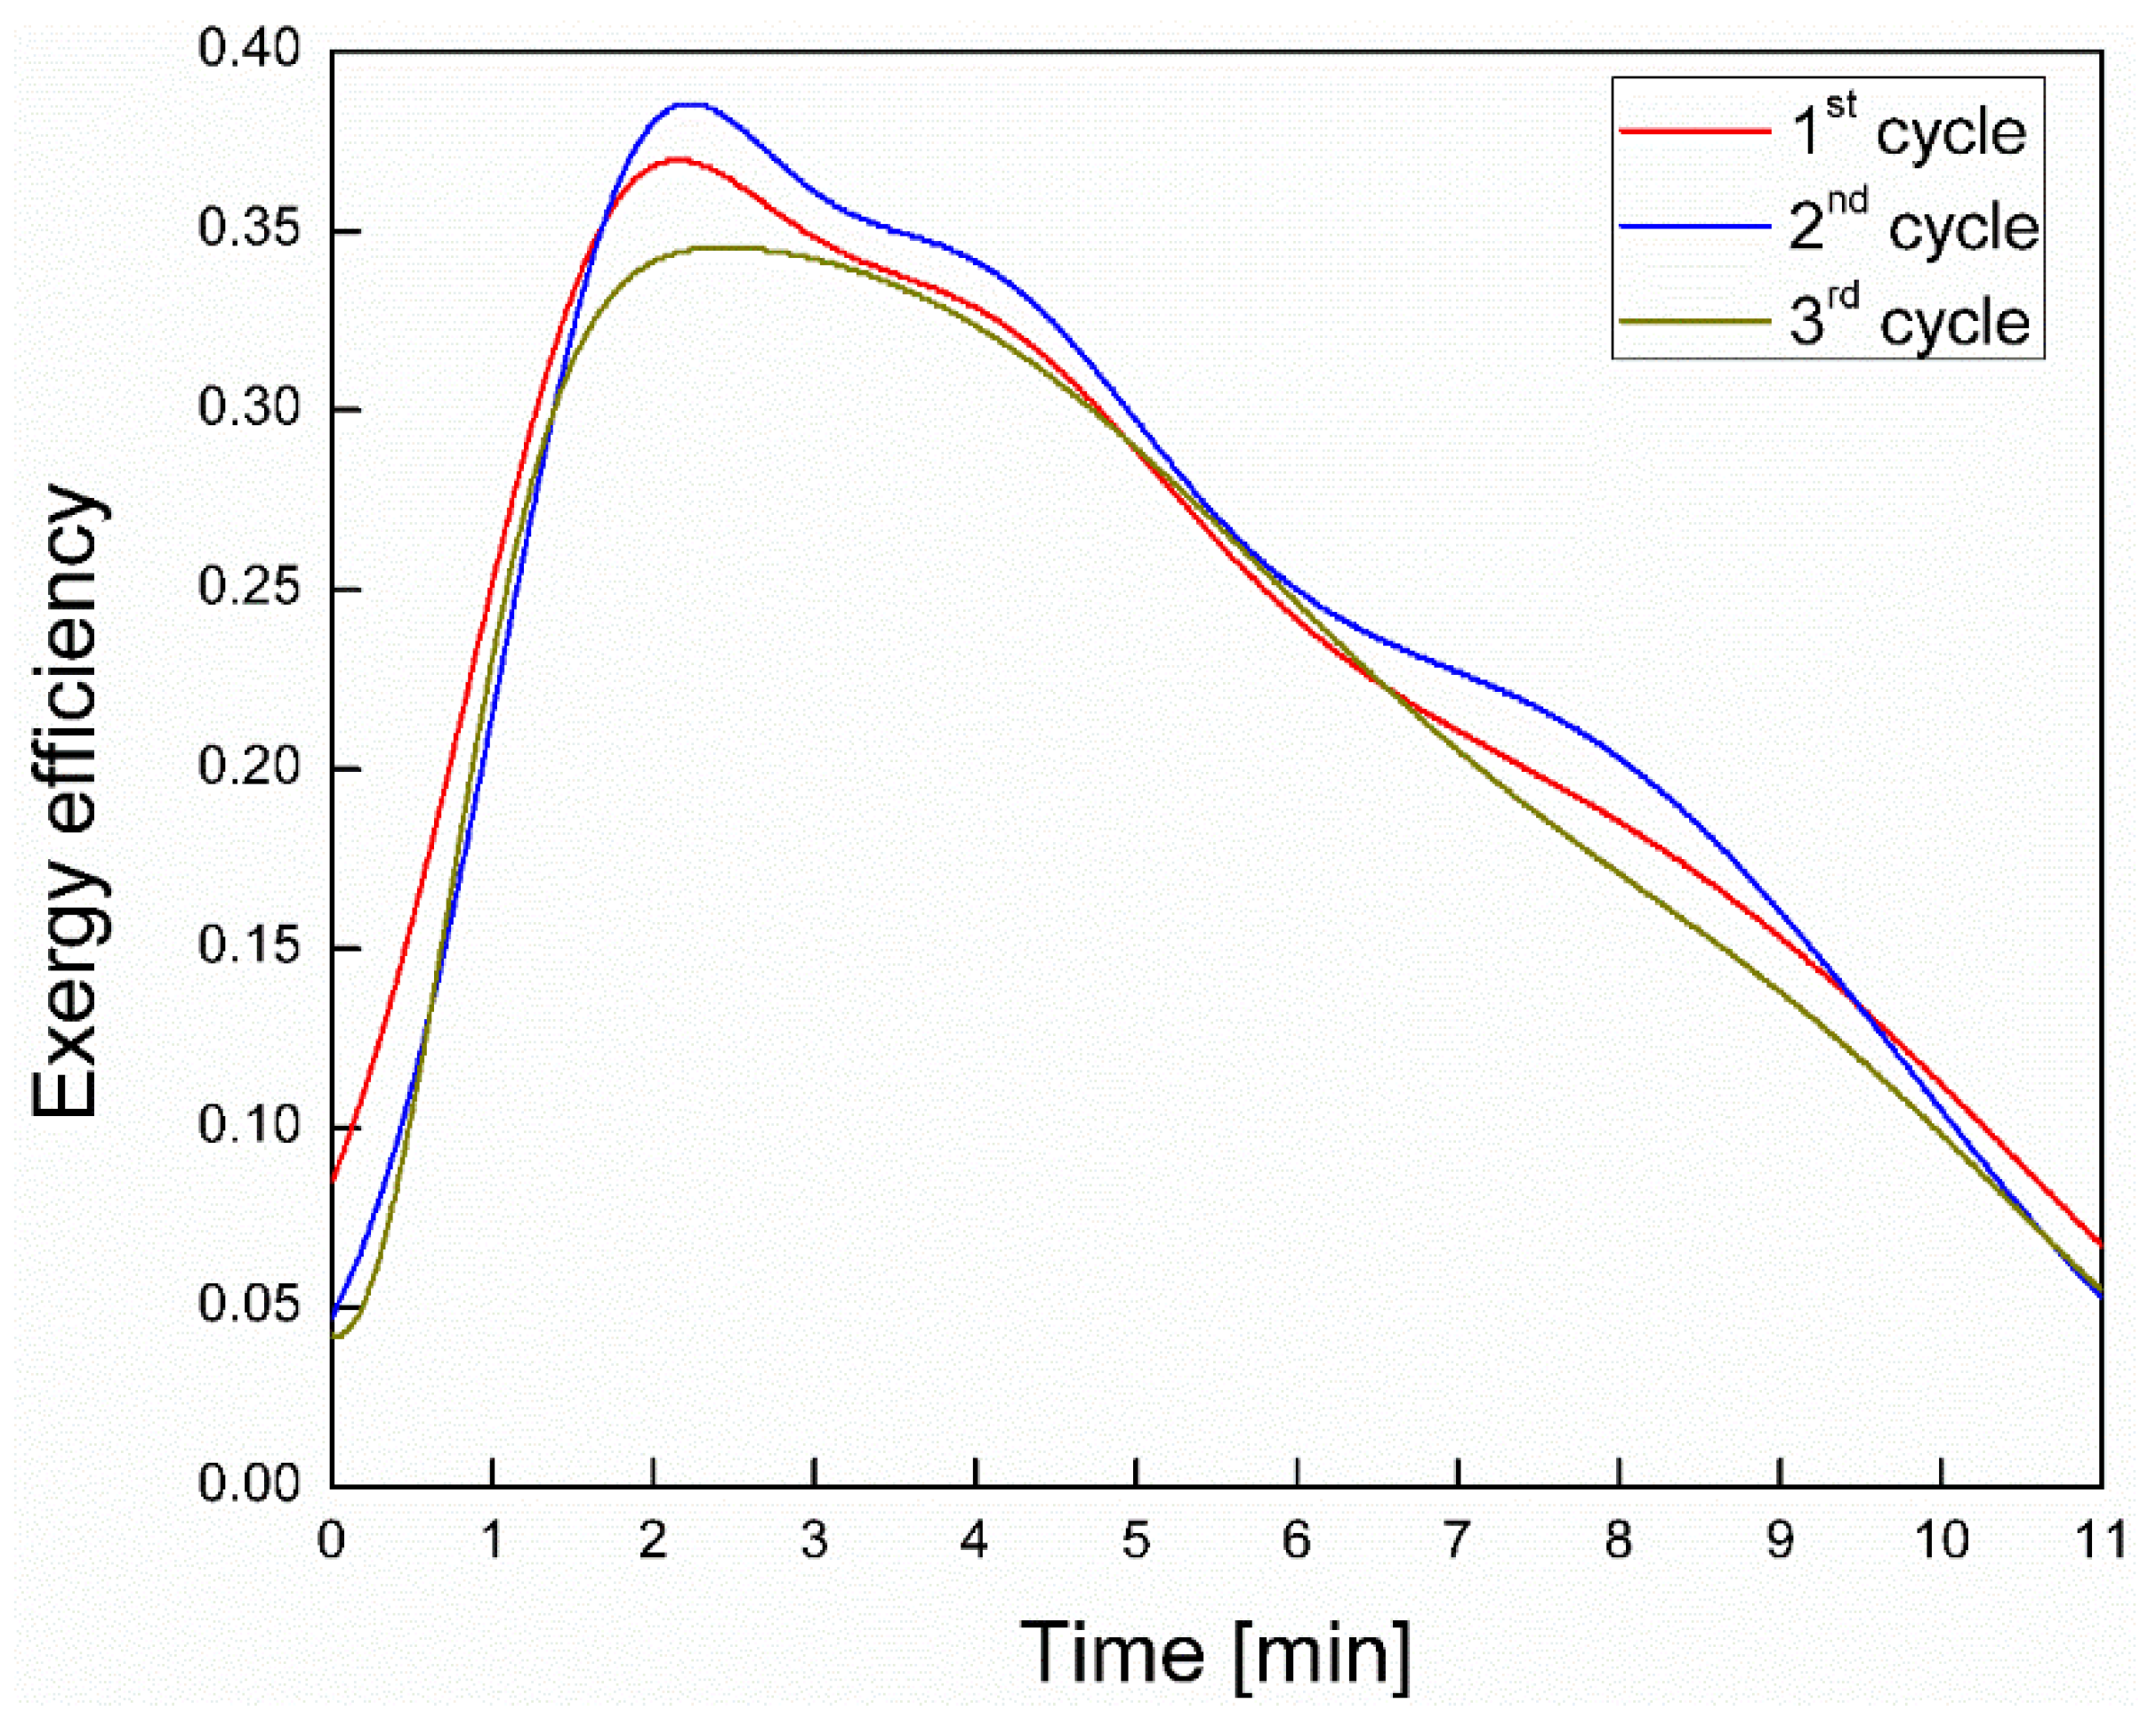
  • The adsorption chiller approached the ideal Carnot cycle at a level varying between 36–43%. The average exergetic efficiency was about 23% for all cycles.
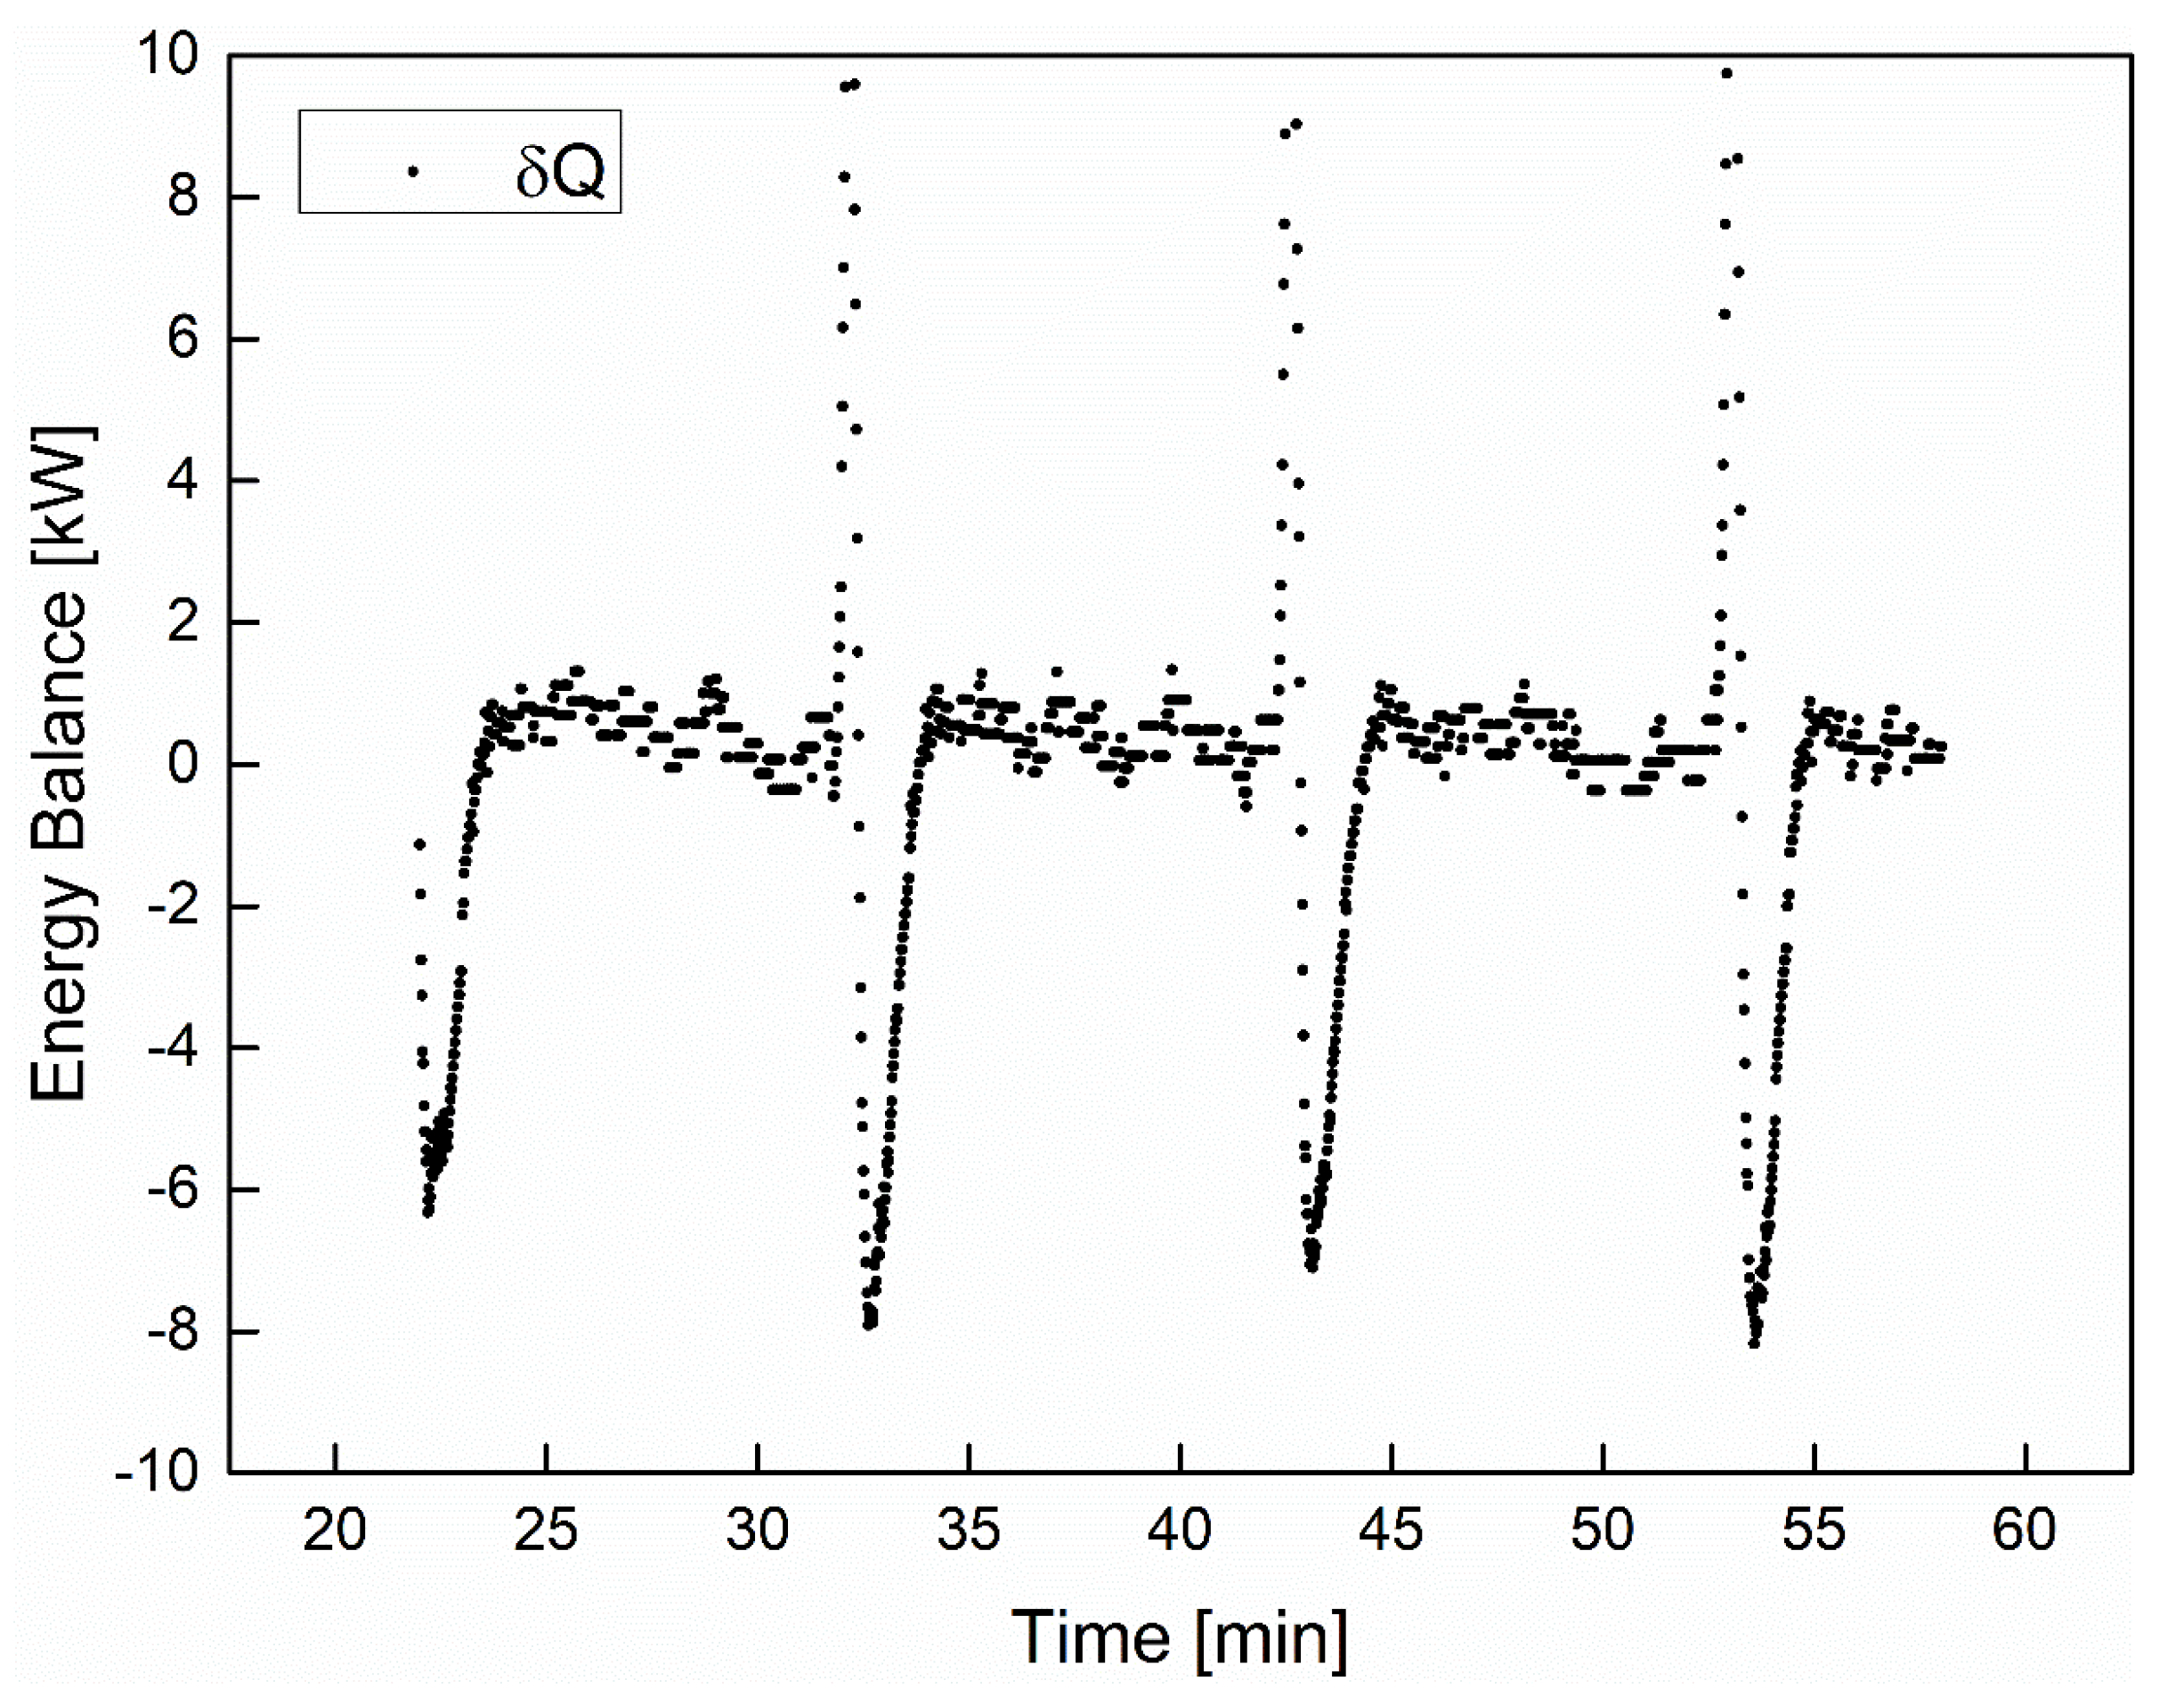
  • The switching process substantially affected the energy balance. However, during most of the cycle period, the energy balance was satisfactorily fulfilled.
Finally, it is worth mentioning that two latent heat storage systems (one for high and one for low temperature energy storage) were installed in the presented experimental setup in order for their influence to the examined solar cooling system to be investigated in a future study.

Author Contributions

I.P.K.: conceived the presented idea, encouraged, supervised the findings of this work. All authors discussed the results and contributed to the final manuscript. M.T.N.: Started writing the manuscript, planned the experiments, carried out the experiment, carried out the implementation, designed the model and the computational framework and analysed the data, aided in interpreting the results and worked on the manuscript. E.G.P.: Finalized the writing of manuscript, planned the experiments, carried out the experiment, carried out the implementation, designed the model and the computational framework and analysed the data, aided in interpreting the results and worked on the manuscript. All authors have read and agreed to the published version of the manuscript.

Funding

This research was co-financed by Greece and the European Union (European Social Fund-ESF) through the Operational Programme “Human Resources Development, Education and Lifelong Learning” in the context of the project “Reinforcement of Postdoctoral Researchers—2nd Cycle” (MIS-5033021), implemented by the State Scholarships Foundation (ΙΚΥ).
Energies 13 05931 i001

Acknowledgments

Michael Nitsas would like to thank the State Scholarships Foundation (IKY) for the financial support (MIS-5033021). All authors acknowledge with appreciation the Laboratory of Applied Thermodynamics, Thermal Engineering Section, School of Mechanical Engineering, National Technical University of Athens, for the support of the work on which this paper is-based.

Conflicts of Interest

The authors declare no conflict of interest.

Nomenclature

A Area (m2)
c p Specific heat capacity (J kg−1 K−1)
G T Solar irradiance (W m−2)
m ˙ Mass flow rate (kg s−1)
Q Energy rate (W)
T Temperature (K)
U L Heat loss coefficient (W m−2 K−1)
η Efficiency (-)
C Condenser
chw Chilled water
cw Cooling water
e Evaporator
ex Exergy
f Heat transfer fluid
g Generator
hw Hot water
i Mix-zone number
in Inlet
L Losses
LAB Laboratory
o Ambient temperature
out Outlet
st Storage tank
u Useful
w water
COPCoefficient of performance
CPCCompound parabolic collector
ETCEvacuated tube collectors
PCMPhase change material
PVTPhotovoltaic thermal collectors

References

  1. Shafiee, S.; Topal, E. When will fossil fuel reserves be diminished? Energy Policy 2009, 37, 181–189. [Google Scholar] [CrossRef]
  2. Huang, L.; Zheng, R. Energy and Economic Performance of Solar Cooling Systems in the Hot-Summer and Cold-Winter Zone. Buildings 2018, 8, 37. [Google Scholar] [CrossRef] [Green Version]
  3. Akahira, A.; Alam, K.C.A.; Hamamoto, Y.; Akisawa, A.; Kashiwagi, T. Mass recovery adsorption refrigeration cycle—Improving cooling capacity. Int. J. Refrig. 2004, 27, 225–234. [Google Scholar] [CrossRef]
  4. Chorowski, M.; Pyrka, P. Modelling and experimental investigation of an adsorption chiller using low-temperature heat from cogeneration. Energy 2015, 92, 221–229. [Google Scholar] [CrossRef]
  5. Farid, S.K.; Billah, M.M.; Khan, M.Z.I.; Rahman, M.M.; Sharif, U.M. A numerical analysis of cooling water temperature of two-stage adsorption chiller along with different mass ratios. Int. Commun. Heat Mass Transf. 2011, 38, 1086–1092. [Google Scholar] [CrossRef]
  6. Bataineh, K.; Taamneh, Y. Review and recent improvements of solar sorption cooling systems. Energy Build. 2016, 128, 22–37. [Google Scholar] [CrossRef]
  7. Alobaid, M.; Hughes, B.; Calautit, J.K.; O’Connor, D.; Heyes, A. A review of solar driven absorption cooling with photovoltaic thermal systems. Renew. Sustain. Energy Rev. 2017, 76, 728–742. [Google Scholar] [CrossRef] [Green Version]
  8. Hassan, H.Z.; Mohamad, A.A. A review on solar-powered closed physisorption cooling systems. Renew. Sustain. Energy Rev. 2012, 16, 2516–2538. [Google Scholar] [CrossRef]
  9. Alam, K.C.A.; Saha, B.B.; Akisawa, A. Adsorption cooling driven by solar collector: A case study for Tokyo solar data. Appl. Therm. Eng. 2013, 50, 1603–1609. [Google Scholar] [CrossRef]
  10. Clausse, M.; Alam, K.C.A.; Meunier, F. Residential air conditioning and heating by means of enhanced solar collectors coupled to an adsorption system. Sol. Energy 2008, 82, 885–892. [Google Scholar] [CrossRef] [Green Version]
  11. El-Sharkawy, I.I.; Abdelmeguid, H.; Saha, B.B. Potential application of solar powered adsorption cooling systems in the Middle East. Appl. Energy 2014, 126, 235–245. [Google Scholar] [CrossRef]
  12. Buonomano, A.; Calise, F.; Palombo, A.; Vicidomini, M. Adsorption chiller operation by recovering low-temperature heat from building integrated photovoltaic thermal collectors: Modelling and simulation. Energy Convers. Manag. 2017, 149, 1019–1036. [Google Scholar] [CrossRef]
  13. Buonomano, A.; Calise, F.; Palombo, A. Solar heating and cooling systems by absorption and adsorption chillers driven by stationary and concentrating photovoltaic/thermal solar. Renew. Sustain. Energy Rev. 2018, 82, 1874–1908. [Google Scholar] [CrossRef]
  14. Koronaki, I.P.; Papoutsis, E.G.; Papaefthimiou, V.D. Thermodynamic modeling and exergy analysis of a solar adsorption cooling system with cooling tower in Mediterranean conditions. Appl. Therm. Eng. 2016, 99, 1027–1038. [Google Scholar] [CrossRef]
  15. Alahmer, A.; Wang, X.; Alam, K.C.A. Dynamic and Economic Investigation of a Solar Thermal-Driven Two-Bed Adsorption Chiller under Perth Climatic Conditions. Energies 2020, 13, 1005. [Google Scholar] [CrossRef] [Green Version]
  16. Basdanis, T.; Tsimpoukis, A.; Valougeorgis, D. Performance optimization of a solar adsorption chiller by dynamically adjusting the half-cycle time. Renew. Energy 2021, 164, 362–374. [Google Scholar] [CrossRef]
  17. Zhai, X.Q.; Wang, R.Z.; Wu, J.Y.; Dai, Y.J.; Ma, Q. Design and performance of a solar-powered air-conditioning system in a green building. Appl. Energy 2008, 85, 297–311. [Google Scholar] [CrossRef]
  18. Fasfous, A.; Asfar, J.; Al-Salaymeh, A.; Sakhrieh, A.; Al-Hamamre, Z.; Al-Bawwab, A.; Hamdan, M. Potential of utilizing solar cooling in The University of Jordan. Energy Convers. Manag. 2013, 65, 729–735. [Google Scholar] [CrossRef]
  19. Lu, Z.S.; Wang, R.Z.; Xia, Z.Z.; Lu, X.R.; Yang, C.B.; Ma, Y.C.; Ma, G.B. Study of a novel solar adsorption cooling system and a solar absorption cooling system with new CPC collectors. Renew. Energy 2013, 50, 299–306. [Google Scholar] [CrossRef]
  20. Thomas, S.; Hennaut, S.; Maas, S.; Andre, P. Experimentation and Simulation of a Small-Scale Adsorption Cooling System in Temperate Climate. Energy Procedia 2012, 30, 704–714. [Google Scholar] [CrossRef] [Green Version]
  21. Roumpedakis, T.C.; Vasta, S.; Sapienza, A.; Kallis, G.; Karellas, S.; Wittstadt, U.; Tanne, M.; Harborth, N.; Sonnenfeld, U. Performance Results of a Solar Adsorption Cooling and Heating Unit. Energies 2020, 13, 1630. [Google Scholar] [CrossRef] [Green Version]
  22. Koronaki, I.P.; Nitsas, M.T. Experimental and theoretical performance investigation of asymmetric photovoltaic/thermal hybrid solar collectors connected in series. Renew. Energy 2018, 118, 654–672. [Google Scholar] [CrossRef]
  23. Saha, B.B.; Boelman, E.C.; Kashiwagi, T. Computer simulation of a silica gel-water adsorption refrigeration cycle-the influence of operating conditions on cooling output and COP. ASHRAE Trans. 1995, 101, 348–357. [Google Scholar]
  24. Boelman, E.C.; Saha, B.B.; Kashiwagi, T. Experimental investigation of a silica gel-water adsorption refrigeration cycle-the influence of operating conditions on cooling output and COP. ASHRAE Trans. 1995, 101, 358–366. [Google Scholar]
  25. Kalkan, N.; Young, E.A.; Celiktas, A. Solar thermal air conditioning technology reducing the footprint of solar thermal air conditioning. Renew. Sustain. Energy Rev. 2012, 16, 6352–6383. [Google Scholar] [CrossRef]
Figure 1. The experimental set up of the solar system.
Energies 13 05931 g001
Figure 2. Layout of the experimental solar system.
Energies 13 05931 g002
Figure 3. Variation of irradiance and ambient temperature with time during the experimental procedure.
Energies 13 05931 g003
Figure 4. Variation of working fluid temperature rise in each collector type.
Energies 13 05931 g004
Figure 5. Useful thermal energy produced by the collectors.
Energies 13 05931 g005
Figure 6. Temperature variation in each storage tank zone.
Energies 13 05931 g006
Figure 7. Variation of thermal losses and stored energy in the intermediate buffer.
Energies 13 05931 g007
Figure 8. Variation of the chiller’s inlet and outlet temperatures.
Energies 13 05931 g008
Figure 9. Variation of the cooling capacity during the cycle period.
Energies 13 05931 g009
Figure 10. Variation of coefficient of performance during the cycle period.
Energies 13 05931 g010
Figure 11. Variation of the exergy efficiency of the adsorption chiller.
Energies 13 05931 g011
Figure 12. Energy balance variation during the three cycles’ operation.
Energies 13 05931 g012
Table 1. Main components of the examined solar system.
PVTTotal area 11 m2
ETCTotal area 9.76 m2
Adsorption chillerNominal cooling capacity 10 kW
Buffer storage tankTotal volume 865 lt
Dry coolerNominal capacity 56.4 kW
Electrical resistanceResistance electrical power 12 kW
Table 2. Accuracies of the measuring equipment.
EquipmentAccuracyRelative Error
pyranometer±(4% |Gtot|)2.7%
HTF temperature sensors±(0.15 + 0.002 × |Temp|)0.8%
Ambient temperature sensor±(0.15 + 0.002 × |Temp|)1.1%
Flowmeter±1%0.7%
Wind meter1% ± 0.1 m/s1%
Table 3. Working conditions during experiments.
Heat Transfer Fluid (In Every Section of the Unit)Water
PVT mass flow rate0.07 kg/s
ETC mass flow rate0.10 kg/s
Regenerator mass flow rate0.40 kg/s
Evaporator mass flow rate0.48 kg/s
Condenser mass flow rate1.02 kg/s
Laboratory temperature27 °C
Publisher’s Note: MDPI stays neutral with regard to jurisdictional claims in published maps and institutional affiliations.

