Article

Study on the Relationship between BO–LID and LeTID in Czochralski-Grown Monocrystalline Silicon

1
The Key Laboratory of Solar Thermal Energy and Photovoltaic System, Institute of Electrical Engineering, Chinese Academy of Science, Beijing 100190, China
2
State Key Laboratory of Alternate Electrical Power System with Renewable Energy Sources, School of New Energy, North China Electric Power University, Beijing 102206, China
*
Author to whom correspondence should be addressed.
Energies 2020, 13(22), 5961; https://doi.org/10.3390/en13225961
Submission received: 18 September 2020 / Revised: 5 November 2020 / Accepted: 11 November 2020 / Published: 15 November 2020

Abstract

:
Most research about Light and elevated Temperature Induced Degradation (LeTID) is focused on multicrystalline silicon (mc-Si). In this work, the degradation kinetics of Czochralski-grown monocrystalline silicon (Cz-Si) induced by light at an elevated temperature were studied in detail. The lifetime evolutions over time during (1) light soaking (LS), (2) dark annealing–light soaking (DA–LS), and (3) DA–LS cycling experiments were analyzed. Ratios of the capture coefficients for the electrons and holes (k-values) were used to characterize the possible defects responsible for degradation. We found that the behavior of degradation and recovery under light soaking with or without a dark annealing treatment was mostly like boron–oxygen (BO)-related degradation but gave k-values from 19 to 25. In the DA–LS cycling experiment, the max degradation amplitudes hardly changed from the second cycle, and the k-values decreased with an increase in the cycling number. We then analyzed the possible reactions in Cz-Si and discuss the relationship between BO defects and LeTID.

Graphical Abstract

1. Introduction

For the light induced degradation (LID) of photovoltaic crystalline silicon solar cells, early studies mainly focused on boron–oxygen (BO) defects [1,2,3,4], which led to a decrease in power during operation. Because of its higher concentration of oxygen, BO–LID resulted in a more serious degradation of Czochralski-grown monocrystalline silicon (Cz-Si). However, with the industrialization of Passivated Emitter and Rear Contact (PERC) solar cells, scientists have observed new degradation and recovery behaviors induced by light that have nothing to do with BO defects and are triggered by high temperatures. This phenomenon is called Light and elevated Temperature Induced Degradation (LeTID) [5,6,7,8,9]. Unlike BO–LID, multicrystalline silicon (mc-Si) solar cells experience more serious degradation [5,10]. To date, related research has mainly focused on mc-Si [6,7,9,10,11,12,13,14].
The hydrogen in bulk silicon is now recognized to be responsible for the LeTID defects in mc-Si [11,15], but the degradation mechanism is still not clear. Fung et al. carried out a dark annealing–light soaking (DA–LS) cycling experiment for mc-Si. Based on this research, a four-state kinetic model of LeTID for mc-Si was proposed [16]. Compared with the three-state kinetic model of BO–LID [17,18], a reservoir state called the R [17] state was introduced. Within the four-state model [16], a boron–hydrogen (BH) pair was used to explain State A, and molecular hydrogen (H2) was used to explain State R. In this phenomenon, the defect precursors (interstitial H) are slowly depleted by DA, and the BH concentration can be modulated by a dark annealing treatment. However, there is still no direct evidence to prove the four-state model, and the root defects are still unknown. The four-state model exhibits good agreement with the experimental data, so it is used in this paper.
Researched work in the literature indicated that LeTID-related defects may also exist in Cz-Si [19,20]. Using dark annealing without light soaking, Chen et al. found that the k-value of Cz-Si was 39.4 ± 4.9, similar to the reported values in mc-Si [21]. The results indicated that LeTID defects may also be formed in Cz-Si. Other studies, however, reported no indications of mc-Si-typical LeTID in Cz-Si materials [22].
In this work, we performed a series of experiments to study the degradation behaviors of Cz-Si with a PERC structure under irradiance at an elevated temperature and discuss the relationship between BO–LID and LeTID.

2. Experimental Procedure

Using 0.5–1 Ω·cm boron-doped Cz-Si wafers from neighboring locations in the ingot, the symmetrical structure was fabricated for a lifetime test. After texturing, the final thickness was about 170 ± 10 µm. All wafers were diffused by phosphorus in a POCl3 tubular furnace to form emitters on both sides; then, dielectric layers of silicon hydride (SiNx:H) were deposited on both sides. Next, wafers were fired with a peak firing temperature exceeding 700 °C without metal electrodes. Lastly, the wafers were laser-cleaved into tokens (50 mm × 50 mm) for the experiments.
Using Jingsheng light soaking equipment, the formation and regeneration of the defects were accelerated through high light intensity and a high temperature. The illumination intensity during light soaking was adjustable, and the maximum intensity was 20 suns. The spectrum distribution was monochromatic LED light with a peak wavelength of 850 nm. During light soaking, the temperature of the silicon wafer was controlled between 50 and 200 °C. Some wafers were dark-annealed by hotplate prior to light soaking. The dark annealing temperatures were 200 °C or 300 °C, and the duration was 30 min. The degradation and regeneration kinetics were characterized by a minority carrier lifetime. The lifetime test was carried out using the quasi-steady-state photoconductance (QSSPC) method with wct-120 equipment from Sinton Instruments. If not specified, the lifetime was the value of the excess carrier concentration Δ n = 5 × 1015 cm−3. The normalized defect density (NDD) was calculated by the following formula:
NDD ( t ) = 1 τ ( t )   1 τ ( t 0 )
where τ(t0) is the initial lifetime after firing, t is the duration of light soaking, and τ(t) is the lifetime after light soaking for time t. By calculating the NDD, the differences caused by different wafers were eliminated as much as possible:
In this work, 3 series of experiments were carried out: (1) light soaking only, (2) dark annealing pre-treatment and light soaking, and (3) dark annealing and light soaking cycling, as shown in Figure 1.

3. Degradation and Regeneration Kinetics of Monocrystalline Silicon

3.1. LS and DA–LS Experiments at Different LS Temperatures

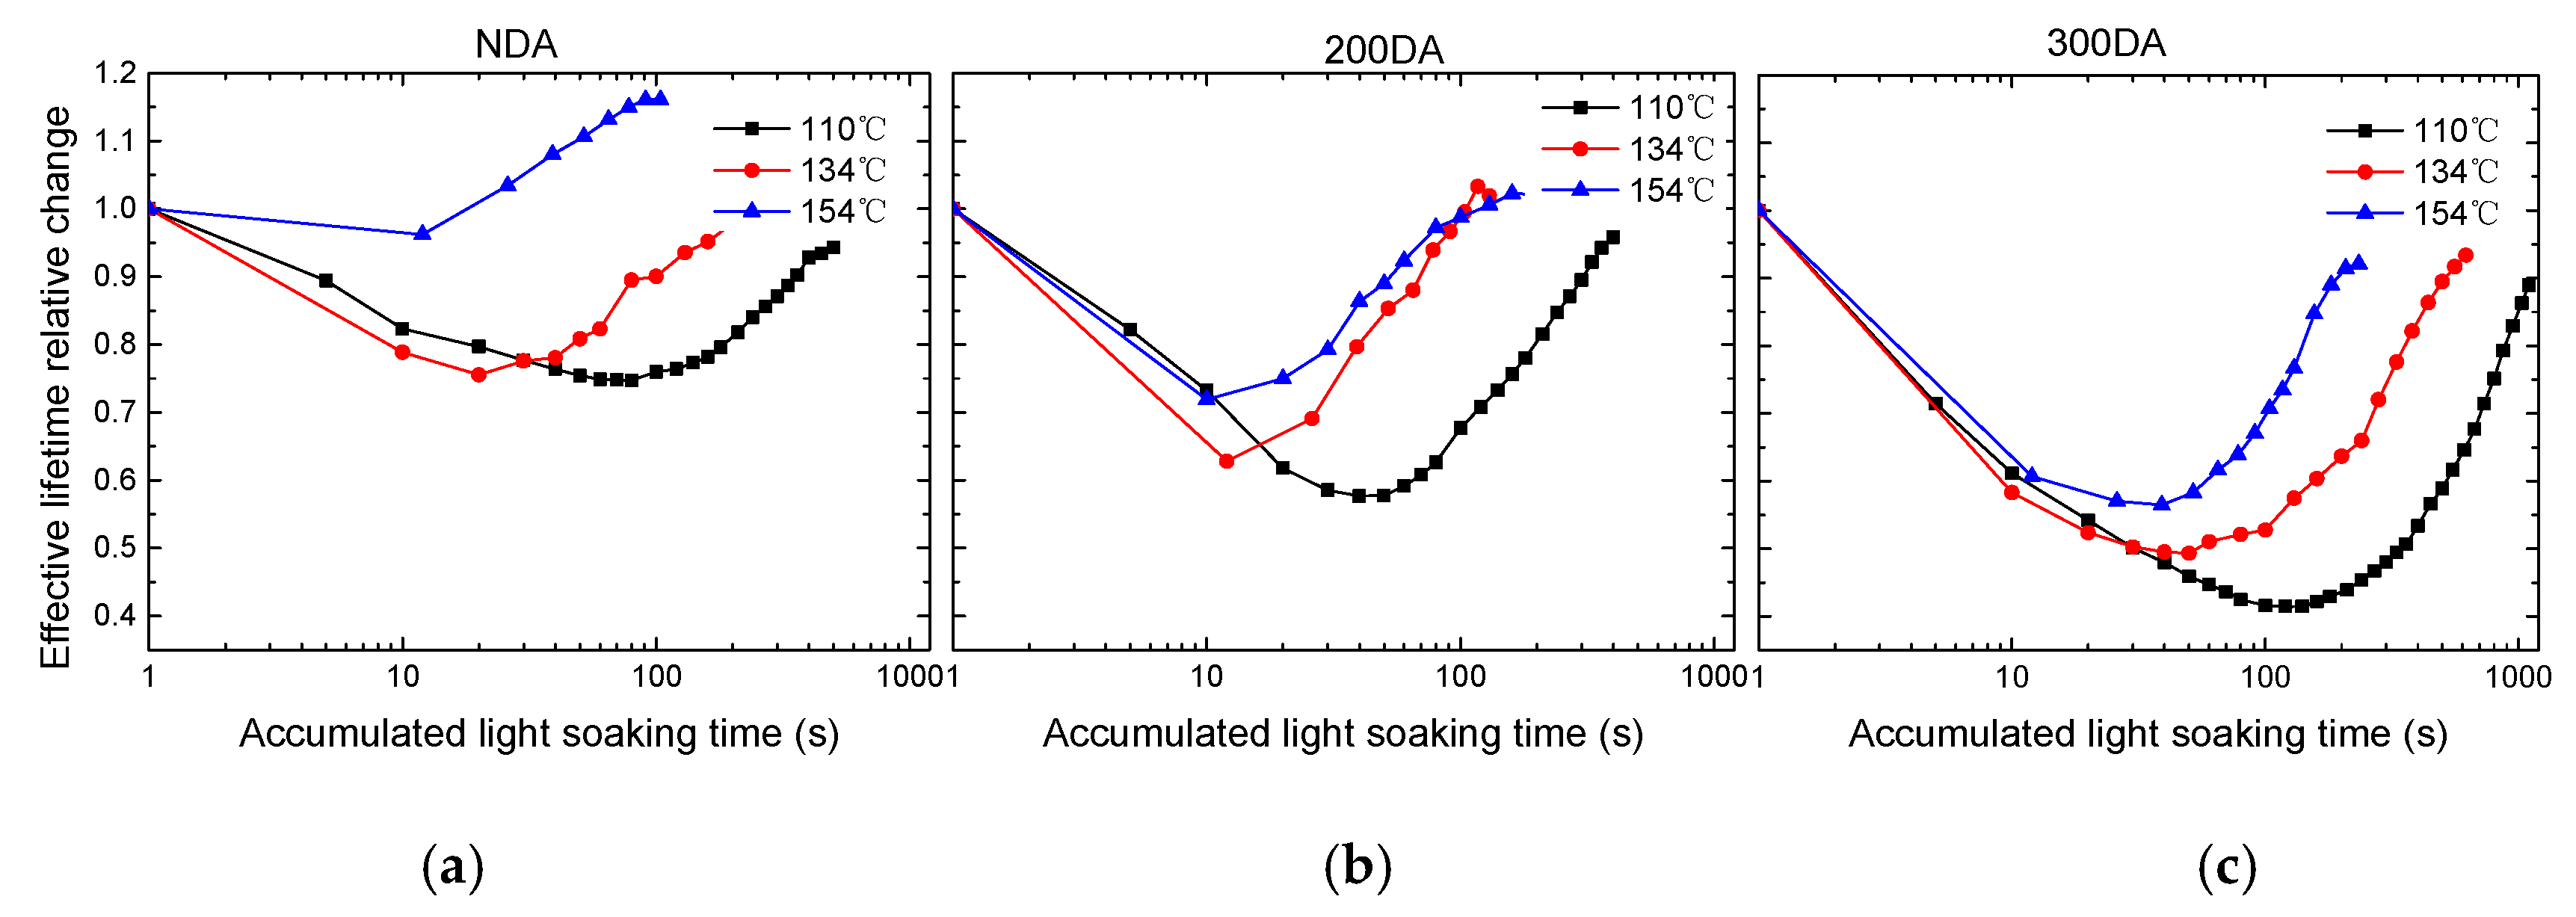
Figure 2 shows the lifetime evolution over time during LS under 10 suns at temperatures of 110 °C, 134 °C, and 154 °C. DA treatment prior to LS can affect the reservoir state [16], therefore the lifetime evolution of the samples treated by DA prior to LS were also studied.
As shown in Figure 2, for samples without DA treatment, the higher the temperature was, the smaller the maximum degradation amplitude and the shorter the time needed from degradation to regeneration. Samples with a 200 °C DA treatment (200DA) and 300 °C DA treatment (300DA) showed the same trend. At the same temperature, the maximum amplitude of degradation conformed to NDA < 200NA < 300DA, and the time required from degradation to regeneration conformed to 200NA < NDA < 300DA. To analyze the effect of dark annealing temperature on the degradation kinetics in detail, dark annealing temperatures of 100 °C, 225 °C, 250 °C, and 275 °C were applied, and light soaking was fixed to 10 suns of illumination and 134 °C. The effect of the dark annealing temperature is shown in Figure 3.
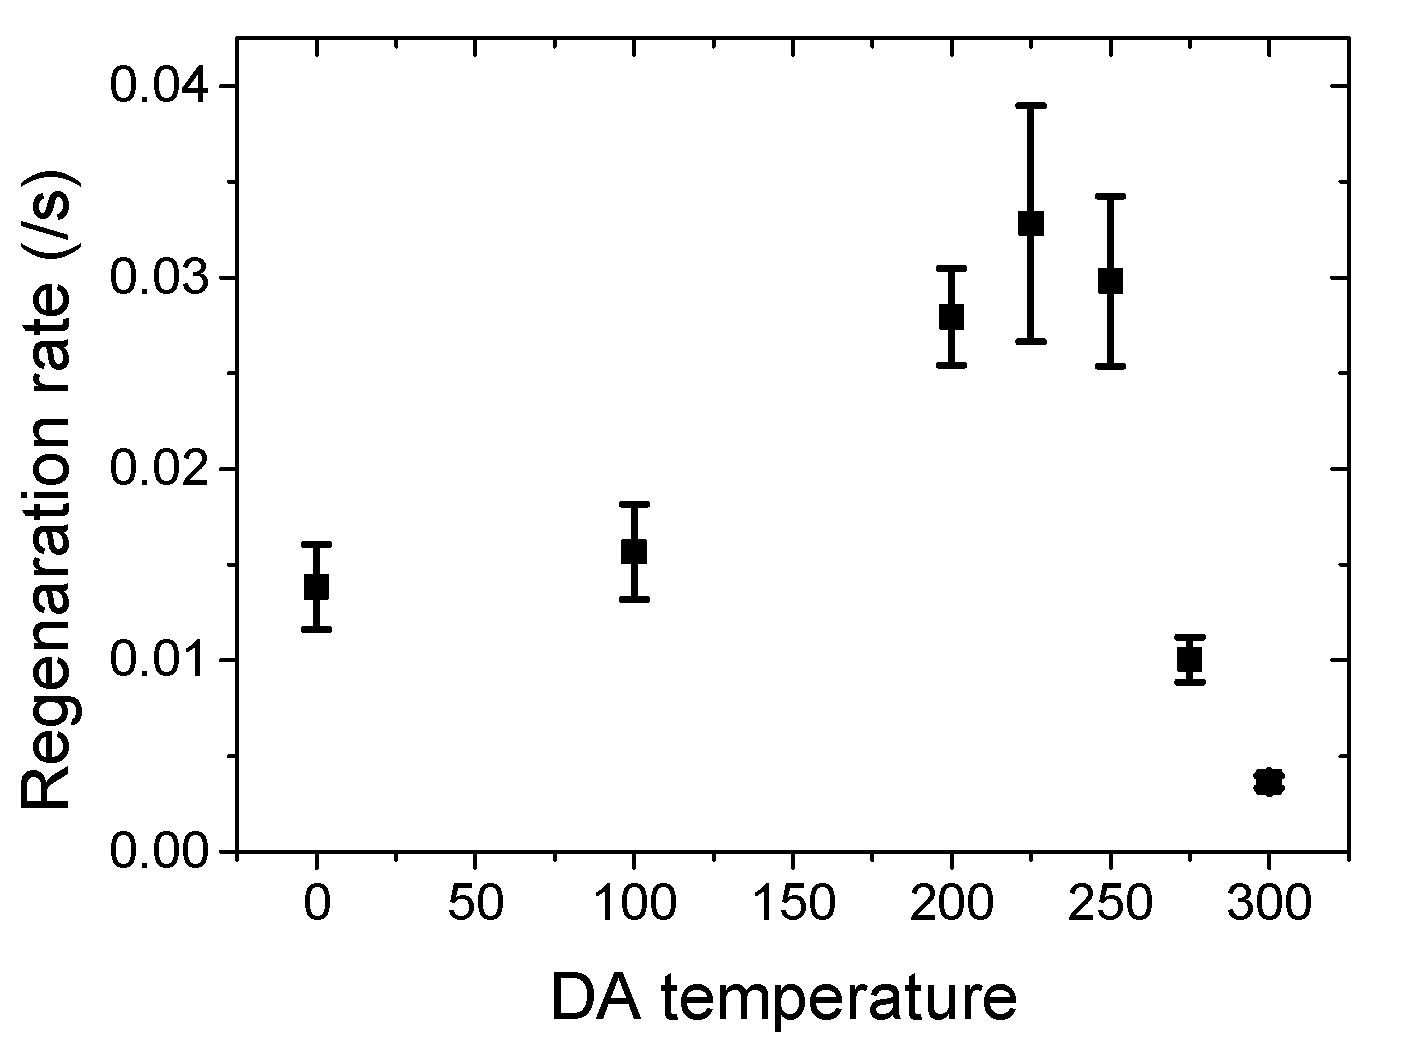
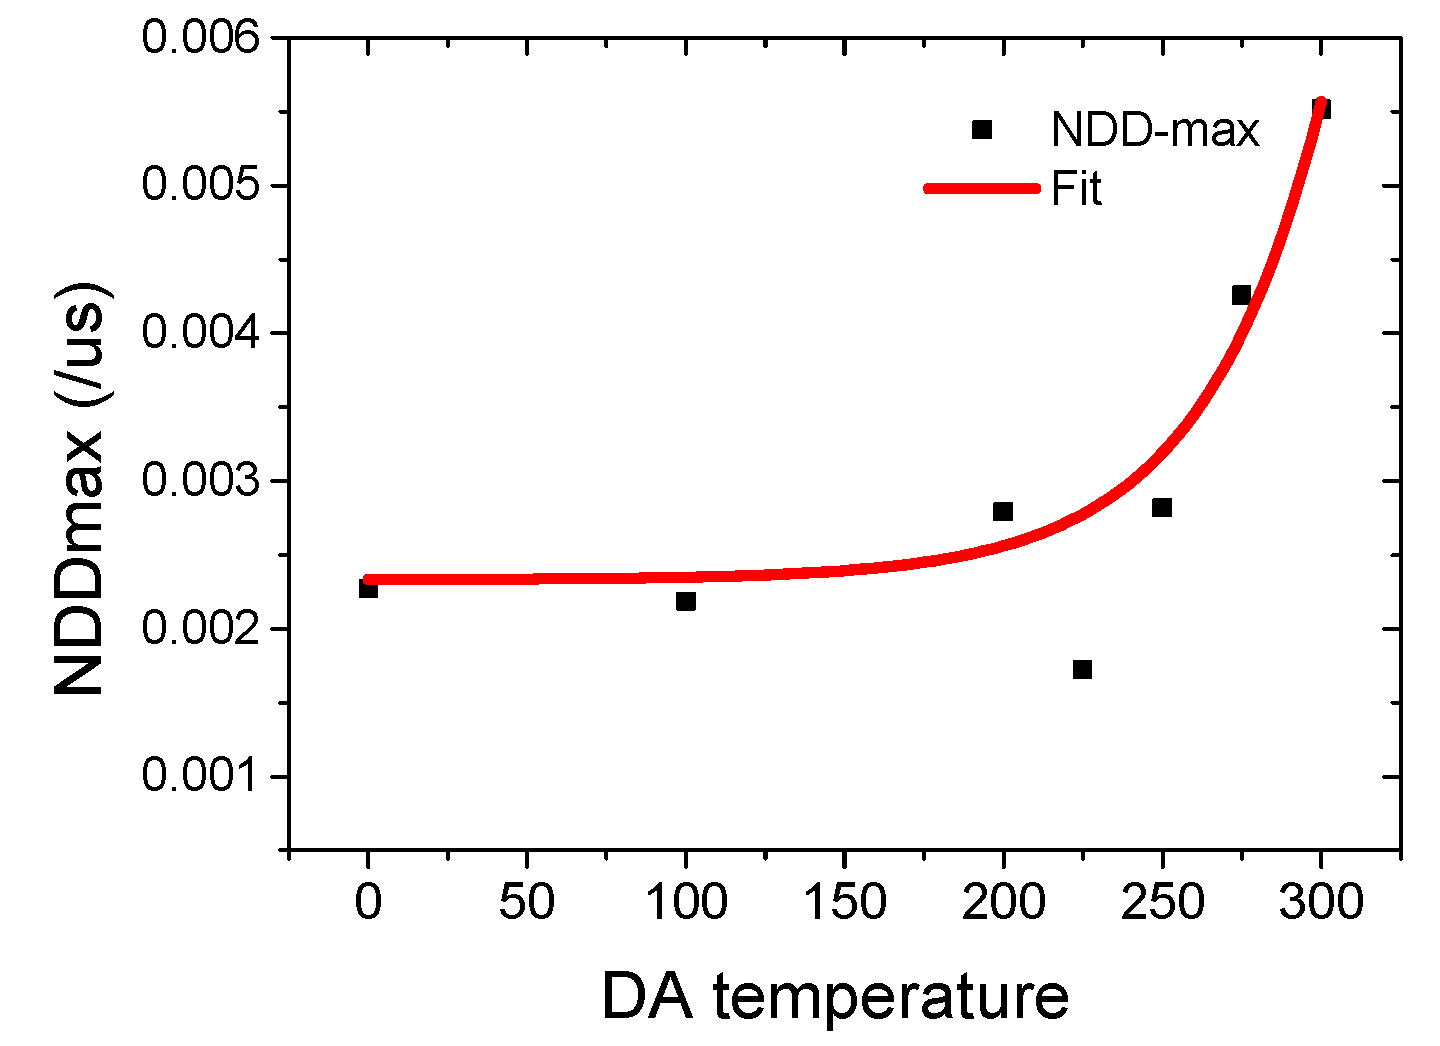
To better characterize the effect of the dark annealing process, fitting calculations were performed on the regeneration rates. The degradation processes were too fast to accurately capture the maximum degradation amplitude and corresponding time, so only the regeneration rates were calculated here. The relationship between the regeneration rates and the dark annealing temperature is shown in Figure 4. It can be seen from the figure that the reaction rate gradually increased as the dark annealing temperature rose above 100 °C, reaching its highest value at 225 °C, and decreased gradually at temperatures higher than 225 °C. This trend is similar to the regeneration of BO defects in monocrystalline silicon and the regeneration of LeTID defects in mc-Si, as reported in [13]. This likely also indicates a dependence on the BH concentration modulated by the dark annealing temperature. The relationship between the DA temperature and maximum degradation amplitude (here using NDDmax) is shown in Figure 5. For NDDmax, the highest value appears at 300 °C, not at 225 °C, which is more like the behavior of BO–LID, rather than LeTID [13].

3.2. LS and DA–LS Experiments at Different LS Irradiation Intensities

Figure 6 shows the lifetime evolution over time under 6 suns, 10 suns, and 18 suns of intensity at a fixed temperature of 134 °C. DA treatments at 200 °C and 300 °C were also studied. It can be seen from the figures that under different irradiation intensities, there were basically no changes in the maximum degradation amplitudes for the NDA samples and for the 200DA and 300DA samples. DA treatment did not change this trend but did change the maximum degradation amplitudes. Here, BO–LID seems to have dominated the degradation kinetics process [23]; the reaction rate depended on light intensity, although the maximum degradation amplitude did not change with different light intensity levels.

3.3. DA–LS Cycling Experiments

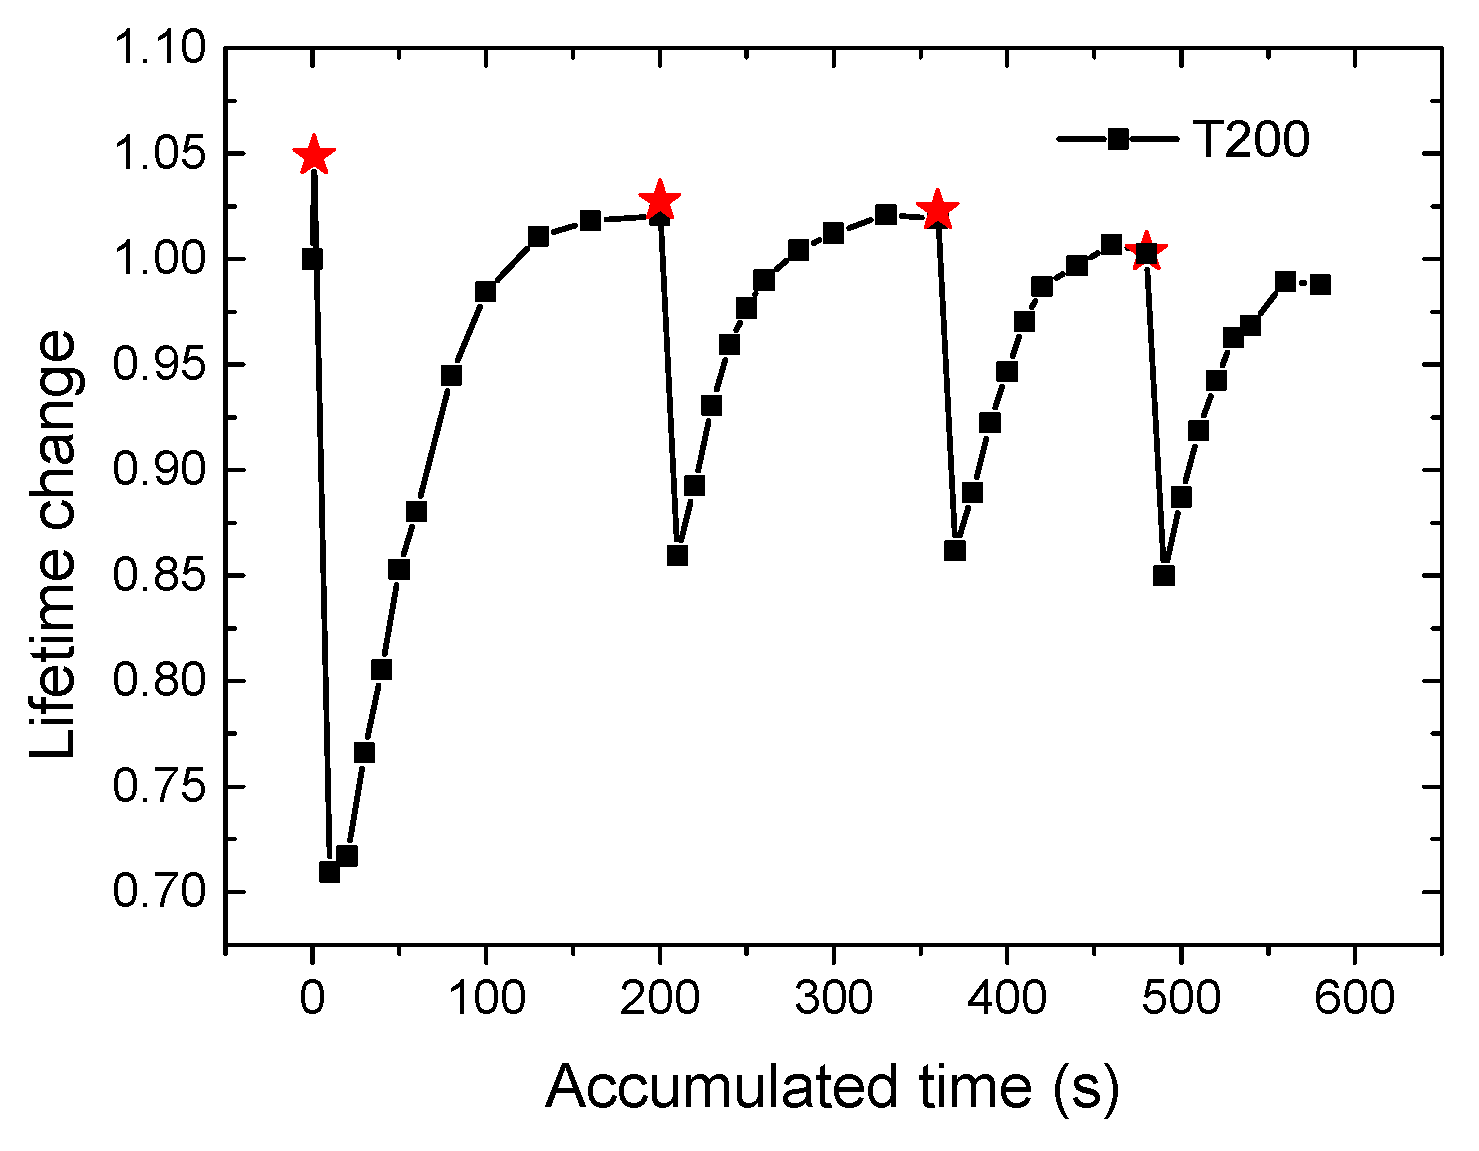
Cz-Si wafers were subjected to a DA–LS cycling experiment for four cycles under the same DA and LS conditions. The DA was set to 200 °C or 300 °C for 30 min, and the LS was set to 134 °C with an illumination intensity of 10 suns to form defects and recover.
Figure 7 shows the experimental results of DA–LS cycles under DA at 200 °C. It can be seen from the figure that the maximum degradation amplitude of the first cycle was the largest, and the second to fourth cycles had similar maximum amplitudes. Figure 8 shows the experimental results of the DA–LS cycles under DA at 300 °C, showing a similar trend to the results of the 200DA cycle. However, for the DA–LS cycle experiment, the maximum degradation amplitude of mc-Si decreased continuously as the number of cycles increased [16]. The maximum degradation amplitude of Cz-Si did not change [24].

4. Analysis

4.1. k-Values of Shockley-Read-Hall (SRH) Defects in Monocrystalline Silicon

To provide some insights into the kinetics of Cz-Si, the ratios of the capture coefficients for the electrons and holes (k-values) of the defects responsible for degradation and recovery were extracted from the injection-level dependent lifetimes under degraded states [25].
The k-value is a particularly valuable parameter for studying the deep-energy defects in semiconductors. Indeed, many k-values have been previously reported in the literature for BO defects and LeTID defects. The typical value of a BO defect is about 10 [26]. For LeTID-related defects in mc-Si, Morishige et al. found k-values between 26 and 36 [27]; Sperber et al. reported a k-value of ~20 in B-doped FZ-Si [28]; and k-values of 39.4 ± 4.9 and 33.4 ± 1.5 have been reported for Cz-Si and mc-Si, respectively [21].
The sample after 200DA treatment for 30 min was subjected to 1 sun intensity at room temperature (RT) for 12 h. The k-value of the degradation (11.16) was extracted as shown in Figure 9, indicating a BO defect. The sample cut from same wafer after 200DA treatment for 30 min was subjected to 10 suns of intensity at 134 °C. The extracted k-value was 19.25. We also extracted the k-values of the NDA samples under other temperatures, which were in the range from 19 to 25. The k-values extracted in this experiment are different from the reported values in the literature for BO defects and LeTID defects.
The k-values of the degraded state were calculated in each cycle of the DA–LS cycling experiment. The results are shown in Table 1. It can be seen that the values of k were continuously reduced in both the 200DA and 300DA samples. Especially for the 300DA samples, from the third cycle, the k-value was about 10, which agrees with the value of the BO defect. For mc-Si, a slightly increasing trend in both the optimal k-values was observed with an increase in the cycling number [16]. A possible explanation for this is the increasing impact of the background lifetime on curve fitting as the total influence of the mc-CID was reduced.

4.2. The Relationship between BO–LID and LeTID in Cz-Si

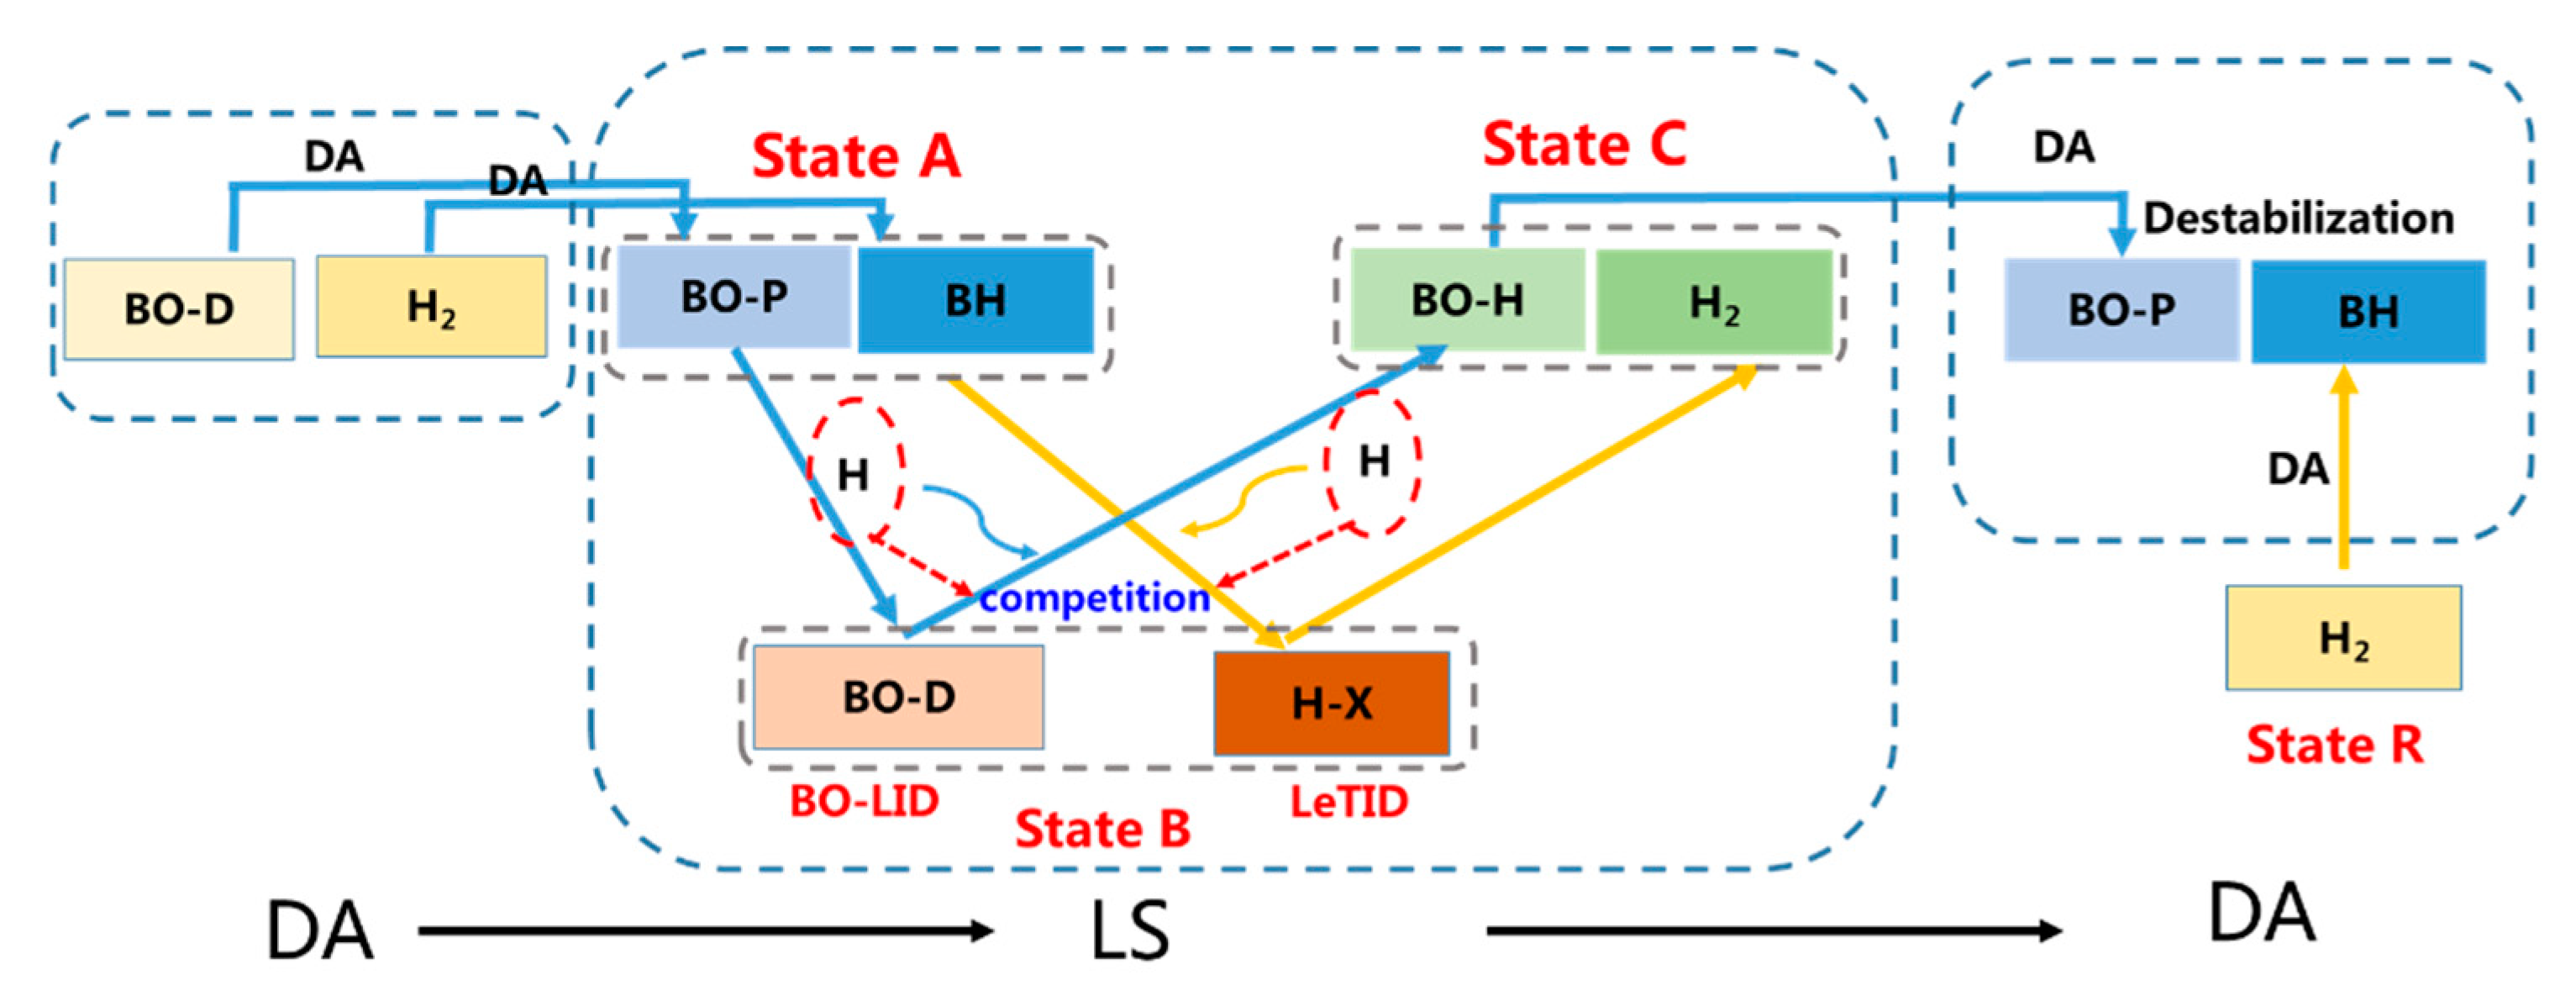
In the temperature and irradiance dependence experiments with or without DA treatment, although most of the behavior could be explained by BO–LID, some results implied the existence of an LeTID defect. For example, the k-values of the degradation state were higher than 10, which indicates the absence of, or an incomplete, BO defect in the degradation state, while in the DA–LS cycling experiment, it was found that the maximum degradation amplitude almost did not change from the second cycle, but the k-values decreased with an increase in the cycling number. Considering the possibility of the coexistence between BO–LID defects and LeTID defects, we tried to analyze the results of the DA–LS cycling experiment with a four-state model and a three-state model. Figure 10 shows the possible reactions and interactions in Cz-Si in the DA–LS cycling experiment.
For Cz-Si, after firing, there should be BO defects along with hydrogen and other species in the bulk silicon [29]. Most of the hydrogen exists in the form of hydrogen molecules [29]. After the dark annealing treatment, the BO defects changed into BO defect precursors (BO-P) with inactive recombination [17,18]. Meanwhile, in the dark annealing treatment, H2 was partially transformed into BH pairs with the assistance of holes of H+.
In the subsequent LS treatment, with the injection of a carrier, the BO-P in the bulk silicon was transformed into a BO defect (BO-D) with recombination inactivated through pairing or configurational changes of the boron–oxygen-related complex [30,31]. At the same time, during illumination, carrier injection reduced the activation energy for the dissociation of BH (State A of LeTID), which is stable in DA from 1.76 ± 0.05 eV to 1.1 ± 0.1 eV [32]. One possible mechanism suggested for this is a change in the charge state of hydrogen from H+ to H°, thus allowing the hydrogen to more easily escape from B after dissociation [33]. H0 is assumed to be the precursor of LeTID defects because the H0 that escapes can then diffuse and reach another species to produce recombination-active defects under illumination (State B of LeTID) [16].
Then, in the regeneration progress, through passivation by hydrogen, the BO defect complexes became recombination-inactive again (BO-H). The charged states of H involved in passivation are uncertain but are likely also H0 [17]. Thus, H (perhaps H0 from the BH pair) plays an important role and participates in two reactions: passivating the BO defect and forming the LeTID defect.
After lifetime recovery, the samples were subjected to DA treatment again, and DA treatment still played two roles. One was to again destabilize the BO-H complex to BO-P. The released hydrogen could then participate in the next cycle of passivation of the BO-D complex according to the three-state model [17]. Another was to transform the LeTID-related reservoir state H2 into the BH pair [16]. Therefore, after dark annealing, BO-P and BH pairs appeared again, and the concentration of BO defects almost did not change in each DA process. However, the BH pair concentration decreased with an increase in the dark annealing number [16]. Thus, H may be preferentially used for the passivation of BO defects, rather than the formation of LeTID defects, resulting in increasingly fewer LeTID defects in the bulk silicon. Consequently, the degradation extent is dominated by BO defects. We also observed a decrease in the k-value as the number of cycles increased. This seems to agree with the possible conclusion of increasingly fewer LeTID defects and was especially obvious at 300DA because the higher concentration of the BO precursor (Figure 4) introduced by 300DA also lead to a faster decrease in the k-value. From the third cycle, the k-value basically remained at the same value as the BO defect (10), and no change was found.
The above hypothesis adequately explains the observed experimental results. There seems to be a competitive relationship between BO defects and LeTID defects in Cz-Si, and, to some extent, the k-value is related to the proportion of BO and LeTID defects.

5. Conclusions

In this work, the degradation mechanism of Cz-Si was studied, and the lifetime evolution under different temperatures, irradiances, and dark annealing processes was analyzed. The following conclusions can be drawn from our experiments.
(1)
It was found in our experiments that the kinetics of Cz-Si can be summarized as follows: The maximum degradation amplitudes depended little on the irradiation intensity, regardless of whether there was a dark annealing treatment. Moreover, the maximum amplitudes were modulated by the DA temperature and were highest at a DA temperature of 300 °C. The regeneration rate was also modulated by the DA temperature and showed a dependence on the BH pair concentration. Most of these behaviors can be explained by BO–LID.
(2)
In the DA–LS experiments, it was found that as the number of DA–LS cycles increased, the maximum degradation amplitude changed little from the second cycle for Cz-Si.
(3)
By extracting the k-values, it was found that those from the monocrystalline silicon in the degradation state were in the range from 19 to 25. In the DA–LS experiments, the k-values decreased with an increase in the cycling number up to ~10.
(4)
Possible reactions and interactions in Cz-Si during DA–LS cycling were analyzed. During LS, interstitial H participated in the passivation of BO defects and the formation of LeTID defects at the same time, resulting in competition between the two reactions. H seemed to prefer to passivate BO defects, and the formation of LeTID seemed to be modulated by the BO concentration.
(5)
Moreover, the firing temperature, LS temperature and light intensity, DA temperature, and duration can all affect the behaviors of degradation and regeneration. The diffusion of H in bulk silicon is especially complex [34]. More experiments are needed to further clarify the relationship between BO–LID and LeTID.

Author Contributions

Conceptualization, H.L., C.Z. and W.W.; methodology, S.C., X.W., and C.Z.; validation, W.W.; formal analysis, H.L., X.W. and C.Z.; investigation, H.L., X.W. and C.Z.; resources, Y.W., and F.L.; data curation, X.W.; writing—original draft preparation, H.L.; writing—review and editing, H.L.; visualization, H.L. and X.W.; supervision, Y.W.; project administration, Y.W.; funding acquisition, Y.W. All authors have read and agreed to the published version of the manuscript.

Funding

This research was funded by the National Key R&D Program of China (2018YFB1500901), National Natural Science Foundation of China (61874120), and the K.C.Wong Education Foundation (GJTD-2018-05).

Conflicts of Interest

The authors declare no conflict of interest.

References

  1. Brett, H.; Moonyong, K.; Malcolm, A.; Nitin, N.; Bruno, S.; Stuart, W. Recent insights into boron-oxygen related degradation: Evidence of a single defect. Sol. Energy Mater. Sol. Cells 2017, 173, 25–32. [Google Scholar]
  2. GlaSer, M.; Lausch, D. Towards a Quantitative Model for BO Regeneration by Means of Charge State Control of Hydrogen. Energy Procedia 2015, 77, 592–598. [Google Scholar] [CrossRef]
  3. Hahn, G.; Wilking, S.; Herguth, A. BO-Related Defects: Overcoming Bulk Lifetime Degradation in Crystalline Si by Regeneration. Solid State Phenom. 2016, 242, 80–89. [Google Scholar] [CrossRef] [Green Version]
  4. Voronkov, V.; Falster, R. The nature of boron-oxygen lifetime-degrading centres in silicon. Phys. Status Solidi 2016, 13, 712–717. [Google Scholar] [CrossRef]
  5. Klaus, R.; Sebastian, Z.; Henning, N.; Axel, M.; Yvonne, G.; Bernhard, B.; Albrecht, S. Light induced degradation of rear passivated mc-si solar cells. In Proceedings of the 27th European Photovoltaic Solar Energy Conference and Exhibition, Frankfurt, Germany, 24–28 September 2012; pp. 861–865. [Google Scholar]
  6. Nakayashiki, K.; Hofstetter, J.; Morishige, A.E.; Li, T.T.A.; Needleman, D.B.; Jensen, M.A.; Buonassisi, T. Engineering Solutions and Root-Cause Analysis for Light-Induced Degradation in p-Type Multicrystalline Silicon PERC Modules. IEEE J. Photovolt. 2016, 6, 860–868. [Google Scholar] [CrossRef]
  7. Jensen, M.A.; Morishige, A.E.; Hofstetter, J.; Needleman, D.B.; Buonassisi, T. Evolution of LeTID Defects in p-Type Multicrystalline Silicon During Degradation and Regeneration. IEEE J. Photovolt. 2017, 7, 980–987. [Google Scholar] [CrossRef]
  8. Zuschlag, A.; Skorka, D.; Hahn, G. Degradation and regeneration analysis in mc-Si. In Proceedings of the Photovoltaic Specialists Conference, Portland, OR, USA, 5–10 June 2016. [Google Scholar]
  9. Kersten, F.; Engelhart, P.; Ploigt, H.C.; Stekolnikov, A.; Lindner, T.; Stenzel, F.; Bartzsch, M.; Szpeth, A.; Kai, P.; Heitmann, J. Degradation of multicrystalline silicon solar cells and modules after illumination at elevated temperature. Sol. Energy Mater. Sol. Cells 2015, 142, 83–86. [Google Scholar] [CrossRef]
  10. Chan, C.; Fung, T.H.; Abbott, M.; Payne, D.; Wenham, A.; Hallam, B.; Chen, R.; Wenham, S. Modulation of Carrier-Induced Defect Kinetics in Multi-Crystalline Silicon PERC Cells Through Dark Annealing. Sol. Rrl 2017, 1, 1600028. [Google Scholar] [CrossRef]
  11. Vargas, C.; Kim, K.; Coletti, G.; Payne, D.; Chan, C.; Wenham, S.; Hameiri, Z. Carrier-Induced Degradation in Multicrystalline Silicon: Dependence on the Silicon Nitride Passivation Layer and Hydrogen Released During Firing. IEEE J. Photovolt. 2018, 8, 413–420. [Google Scholar] [CrossRef]
  12. Eberle, R.; Kwapil, W.; Schindler, F.; Schubert, M.C.; Glunz, S.W. Impact of the firing temperature profile on light induced degradation of multicrystalline silicon. Phys. Status Solidi Rapid Res. Lett. 2016, 10, 861–865. [Google Scholar] [CrossRef]
  13. Fung, T.H.; Kim, M.; Chen, D.; Samadi, A.; Chan, C.E.; Hallam, B.J.; Wenham, S.; Abbott, M. Influence of Bound Hydrogen States on Carrier-induced Degradation in Multi-crystalline Silicon. In Proceedings of the 8th International Conference on Crystalline Silicon Photovoltaics, Lausanne, Switzerland, 19–21 March 2018. [Google Scholar]
  14. Kwapil, W.; Niewelt, T.; Schuberta, M.C. Kinetics of carrier-induced degradation at elevated temperature in multicrystalline silicon solar cells. Energy Procedia 2016, 92, 773–778. [Google Scholar] [CrossRef]
  15. Schmidt, J.; Bredemeier, D.; Walter, D.C. On the Defect Physics Behind Light and Elevated Temperature-Induced Degradation (LeTID) of Multicrystalline Silicon Solar Cells. IEEE J. Photovolt. 2019, 9, 1497–1503. [Google Scholar] [CrossRef]
  16. Fung, T.H.; Kim, M.; Chen, D.; Chan, C.E.; Hallam, B.J.; Chen, R.; Payne, D.N.R.; Ciesla, A.; Wenham, S.R.; Abbott, M.D. A four-state kinetic model for the carrier-induced degradation in multicrystalline silicon: Introducing the reservoir state. Sol. Energy Mater. Sol. Cells 2018, 184, 48–56. [Google Scholar] [CrossRef]
  17. Herguth, A.; Hallam, B. A Generalized Model for Boron-Oxygen Related Light-Induced Degradation in Crystalline Silicon. In Proceedings of the 8th International Conference on Crystalline Silicon Photovoltaics, Lausanne, Switzerland, 19–21 March 2018. [Google Scholar]
  18. Herguth, A.; Schubert, G.; Kaes, M.; Hahn, G. A New Approach to Prevent the Negative Impact of the Metastable Defect in Boron Doped CZ Silicon Solar Cells. In Proceedings of the IEEE World Conference on Photovoltaic Energy Conversion, Waikoloa, HI, USA, 7–12 May 2006. [Google Scholar]
  19. Fertig, F.; Lantzsch, R.; Mohr, A.; Schaper, M.; Bartzsch, M.; Wissen, D.; Kersten, F.; Mette, A.; Peters, S.; Eidner, A.; et al. Mass production of p-type Cz silicon solar cells approaching average stable conversion efficiencies of 22%. Energy Procedia 2017, 124, 338–345. [Google Scholar] [CrossRef]
  20. Nampalli, N.; Li, H.; Kim, M.; Stefani, B.; Wenham, S.; Hallam, B.; Abbott, M. Multiple pathways for permanent deactivation of boron-oxygen defects in p-type silicon. Sol. Energy Mater. Sol. Cells 2017, 173, 12–17. [Google Scholar] [CrossRef]
  21. Chen, D.; Kim, M.; Stefani, B.V.; Hallam, B.J.; Abbott, M.D.; Chan, C.E.; Chen, R.; Payne, D.N.R.; Nampalli, N.; Ciesla, A. Evidence of an identical firing-activated carrier-induced defect in monocrystalline and multicrystalline silicon. Sol. Energy Mater. Sol. Cells 2017, 172, 293–300. [Google Scholar] [CrossRef]
  22. Winter, M.; Walter, D.; Bredemeier, D.; Schmidt, J. Light-induced lifetime degradation effects at elevated temperature in Czochralski-grown silicon beyond boron-oxygen-related degradation. Sol. Energy Mater. Sol. Cells 2019, 201, 110060. [Google Scholar] [CrossRef]
  23. Knobloch, J.; Glunz, S.W.; Biro, D.; Warta, W.; Schaffer, E.; Wettling, W. Solar cells with efficiencies above 21% processed from Czochralski grown silicon. In Proceedings of the IEEE Photovoltaic Specialists Conference, Washington, DC, USA, 13–17 May 1996. [Google Scholar]
  24. Wenham, A.C.N.; Wenham, S.; Chen, R.; Chan, C.; Chen, D.; Hallam, B.; Payne, D.; Fung, T.; Kim, M. Hydrogen-Induced Degradation. In Proceedings of the 7th World Conference on Photovoltaic Energy Conversion, Waikoloa Village, HI, USA, 10–15 June 2018; pp. 1–8. [Google Scholar]
  25. Murphy, J.D.; Bothe, K.; Krain, R.; Voronkov, V.V.; Falster, R.J. Parameterisation of injection-dependent lifetime measurements in semiconductors in terms of Shockley-Read-Hall statistics: An application to oxide precipitates in silicon. J. Appl. Phys. 2012, 111, 113709. [Google Scholar] [CrossRef] [Green Version]
  26. Voronkov, V.V.; Falster, R.; Bothe, K.; Lim, B.; Schmidt, J. Lifetime-degrading boron-oxygen centres in p-type and n-type compensated silicon. J. Appl. Phys. 2011, 110, 404. [Google Scholar] [CrossRef]
  27. Morishige, A.E.; Jensen, M.A.; Needleman, D.B.; Nakayashiki, K.; Buonassisi, T. Lifetime spectroscopy investigation of light-induced degradation in p-type multicrystalline silicon PERC. IEEE J. Photovolt. 2016, 6, 1466–1472. [Google Scholar] [CrossRef]
  28. Sperber, D.; Herguth, A.; Hahn, G. A 3-state defect model for light-induced degradation in boron-doped float-zone silicon. Phys. Status Solidi RRL Rapid Res. Lett. 2017, 11, 1600408. [Google Scholar] [CrossRef] [Green Version]
  29. Voronkov, V.V.; Falster, R. Formation, dissociation, and diffusion of various hydrogen dimers in silicon. Phys. Status Solidi 2017, 254, 1600779. [Google Scholar] [CrossRef]
  30. Bothe, K.; Schmidt, J. Fast-forming boron-oxygen-related recombination center in crystalline silicon. Appl. Phys. Lett. 2005, 87, 262108. [Google Scholar] [CrossRef]
  31. Niewelt, T.; Schön, J.; Warta, W.; Glunz, S.W.; Schubert, M.C. Degradation of Crystalline Silicon Due to Boron–Oxygen Defects. IEEE J. Photovolt. 2016, 7, 383–398. [Google Scholar] [CrossRef]
  32. Zundel, T.; Weber, J. Boron reactivation kinetics in hydrogenated silicon after annealing in the dark or under illumination. Phys. Rev. B Condens. Matter 1991, 43, 4361–4372. [Google Scholar] [CrossRef] [PubMed]
  33. Seager, C.H.; Anderson, R.A. Two-step debonding of hydrogen from boron acceptors in silicon. Appl. Phys. Lett. 1991, 59, 585–587. [Google Scholar] [CrossRef]
  34. Sheoran, M.; Kim, D.S.; Rohatgi, A.; Dekkers, H.F.W. Hydrogen diffusion in silicon from plasma-enhanced chemical vapor deposited silicon nitride film at high temperature. Appl. Phys. Lett. 2008, 92, 931. [Google Scholar] [CrossRef]
Figure 1. According to the four-state model, 3 series of experiment were carried out.
Energies 13 05961 g001
Figure 2. The lifetime degradation and recovery at different temperatures with NDA (a), 200DA (b), and 300DA (c) treatments (the irradiation intensity was fixed at 10 suns. DA treatment prior to light soaking (LS) was performed at 200 °C and 300 °C for 30 min). NDA refers to treatment without dark annealing, 200DA is dark annealing at 200 °C prior to light soaking, and so on. The initial lifetimes are similar at about 140–160 μs.
Energies 13 05961 g002
Figure 3. Effect of the dark annealing temperature. NDA means a treatment without dark annealing, 100DA means dark annealing at 100 °C prior to light soaking, and so on (10 suns at 134 °C. The duration of the DA treatment prior to LS was 30 min). The initial lifetimes were similar at about 130–150 μs.
Energies 13 05961 g003
Figure 4. The effect of dark annealing temperature on the regeneration rate (LS fixed at 10 suns and 134 °C. The duration of the DA treatment prior to LS was 30 min).
Energies 13 05961 g004
Figure 5. The relationship between NDDmax and the dark annealing temperature (LS fixed at 10 suns and 134 °C. The duration of the DA treatment prior to LS was 30 min).
Energies 13 05961 g005
Figure 6. The degradation and lifetime recovery at different irradiation intensities with NDA (a), 200DA (b), and 300DA (c) treatments. NDA means treatment without dark annealing, 200DA means 200 °C dark annealing prior to light soaking, and so on (temperature fixed at 134 °C; the DA duration was 30 min). The initial lifetimes were similar at about 130–150 μs.
Energies 13 05961 g006
Figure 7. Dark annealing–light soaking (DA–LS) cycles with 200 °C DA. The red star means the lifetime after DA. (LS was fixed at 10 suns and 134 °C; DA, 30 min). The initial lifetime was 132.4 μs.
Energies 13 05961 g007
Figure 8. DA–LS cycles with 300 °C DA. The red star indicates the lifetime after DA (LS fixed at 10 suns and 134 °C; DA, 30 min). The initial lifetime was 132.3 μs.
Energies 13 05961 g008
Figure 9. The SRH lifetime of the sample in a degradation state during an LS of one sun at room temperature (RT) for 12 h and 10 suns at 134 °C for 30 s as a function of x (n/p).
Energies 13 05961 g009
Figure 10. Possible reactions and interactions in Czochralski-grown monocrystalline silicon (Cz-Si) during DA–LS cycling.
Energies 13 05961 g010
Table 1. The extracted k-values in each cycle during the DA–LS cycling experiment.
Number of Cycles200DA300DA
First cycle19.5420.52
Second cycle17.5214.48
Third cycle16.5410.87
Forth cycle15.9810.78
Publisher’s Note: MDPI stays neutral with regard to jurisdictional claims in published maps and institutional affiliations.