GoWInD: Wind Energy Spatiotemporal Assessment and Characterization of End-of-Life Activities


College of Business Administration, Texas A&M University Kingsville, Kingsville, TX 78363, USA
Energies 2020, 13(22), 6015; https://doi.org/10.3390/en13226015
Submission received: 6 November 2020
/
Revised: 14 November 2020
/
Accepted: 16 November 2020
/
Published: 18 November 2020
(This article belongs to the Section A3: Wind, Wave and Tidal Energy)
Abstract
:Concerns on the lack sustainable end-of-life options for wind turbines have significantly increased in recent years. To ensure wind energy continuous growth, this research develops a novel spatiotemporal methodology that sustainably handles end-of-life activities for wind equipment. This research introduces the Global Wind Inventory for Future Decommissioning (GoWInD), which assesses and characterizes wind turbines according to individual spatiotemporal decommissioning and sustainability attributes. Applying data from GoWInD, the research developments networks of end-of-life (EoL) centers for wind turbines. The placement and operational levels of EoL centers optimize sustainable decommissioning according to changing spatiotemporal features of wind turbines. The methodology was evaluated for the United States, developing the United States Global Wind Inventory for Future Decommissioning (US—GoWInD), implementing the network of United States end-of-life (US—EoL) centers. Significant imbalances on the temporal and spatial distribution of US wind decommissioning inventory were revealed by the system. Diverse options to effectively handle these imbalances were highlighted by the methodology, including US—EoL center optimization according to placement, operational levels and potential complementarities. Particular attention was paid to components with challenging disposal options. The system can be implemented for diverse geographical locations and alternative spatial and temporal resolutions.

1. Introduction
Public concern on the lack of sustainable end-of-life options to dispose of renewable energy equipment is increasing in the United States [1] and all over the world [2]. This is generating negative public perceptions [1], slowing down the deployment of new wind farms [3]. The situation is concerning considering that wind energy is one of the main components of the global strategy to overcome climate change [4]. Therefore, obstacles to wind energy continuous growth are worrisome, potentially hindering the goals of the Paris Climate Change Agreement [5]. This could endanger the world’s ecological balance, human health and sustainable economic growth [6].
There are no clear economic or technological plans to sustainably reuse, recycle or dispose wind turbines after the end of their useful life [7,8]. As the first wind turbines installed in the U.S., more than twenty years ago [9], start to need replacement, stakeholders are struggling to find acceptable disposal solutions [10]. For instance, in July 2020 the Legislature of the state of Wyoming approved the burial of decommissioned wind turbine blades and towers [11]. The plan is to use abandoned coal mine pits to bury fiberglass or composite material. However, this may be a short-term solution as space is limited and potential environmental impacts are yet to be ascertained [12].
Costs for wind farm removal, disposal and area restoration are uncertain, ranging from $200,000 [13] to $445,000 per wind turbine [14]. Most of the sections of the wind turbine should have a salvage value, such as reusing steel towers or recycling electronic components [15,16]. However, the prevailing assumption that this salvage value will cover decommissioning and end-of-life cost, has not materialized [17], generating public concern [18]. These challenges have caused a number of older wind farms to continue operations past their useful life [19]. For instance, California has almost 2000 wind turbines older than 30 years that are still installed, many of them nonfunctional or generating negligible power output [20]. A significant number of these deprecated wind turbines, however, occupy prime wind power generation locations [9]. This older equipment blocks the installation of new more advanced equipment, which would be able to extract much more energy from those optimal wind locations [17]. Additionally, obsolete equipment still in operation pushes new wind farms closer to residential areas, increasing social opposition and slowing down the growth of this industry [21], as observed in several mature markets in recent years [22].
Many US States now require wind farm developers to incorporate provisions for end-of-life activities in their permitting and origination contracts, including in many cases bonds to ensure compliance [23]. Unfortunately, this has proven insufficient to ensure sustainable end-of-life for wind turbines [24]. Materials used in several components have challenging reuse or recycle options [25], requiring the development of technological and logistic systems capable of providing sustainable end-of-life alternatives [26]. Otherwise, operators are left with undesirable alternatives, such as landfilling [27], burial or incineration, which have potential detrimental health, environmental and community impacts, increasing social opposition [28].
Wind turbine composite materials are difficult to dispose due to their size and material structure [29]. Three main processes are currently recognized to handle end-of-life of the composite materials, contained in the blades: (1) incineration, (2) landfill and (3) recycling or reprocess [28,30]. Although, blades have been incinerated in Germany for cement kilns, with each blade replacing approximately 600 kg of coal as fuel, this generates ashes equivalent to 60% of the mass of the blade [31]. These ashes need to be landfilled or used as construction material, with legislation in many jurisdictions limiting the use of these waste materials [8]. Concern for landfill disposal of composite materials, contained in the blades, nacelles and towers, is growing [26,32]. Germany, one of the world’s oldest wind turbine markets, disposed of 54,000 tons of blades in 2014 alone, mostly in landfills [33]. Now landfilling blades has been banned in several jurisdictions, including Germany [8,30] and Wyoming [34]. It is an estimated that by the year 2050 the blade waste will grow globally to 43 million metric tons [25]. Therefore, it is becoming clear that reprocessing or recycling are currently the only sustainable options for blade decommissioning [35]. Furthermore, there are growing opportunities to develop technologies and supply chain management systems capable of profiting from disposed wind turbine components, including composite materials [19]. The development of sustainable lifecycles which reprocess wind turbine components would contribute to the healthy growth of the global wind industry [36], supporting its continuing technological development and the maximization of wind energy extraction from optimal wind areas [37].
One important challenge for the continuous growth of the wind energy sector is the successful development of wind turbines end-of-life sustainable systems [24]. Wind turbine waste has to be sustainably managed to maintain a reduced carbon footprint [35]. This will prevent social opposition and the risk of future regulations [36] that may affect this sector future growth [38,39]. If developers do not have a suitable alternative for the removal and disposal of older equipment, the decision to slow the deployment of new, more advanced, wind turbines may become widespread [40], while larger numbers of older wind farms continue operating in a run to fail mode [41]. This would limit the placement of newer wind turbines, capable of extracting much more wind power from optimal locations, currently blocked by older equipment [42]. This situation has pushed new wind farms very close to residential areas in mature markets such as Germany and Denmark, increasing social opposition [21,22]. Germany, for instance, enacted new regulations on minimum distance from wind turbines to residential areas [6]. These factors were identified as contributing to the 55% reduction in new onshore wind farms development experienced in Germany in 2019, the lowest annual increase in two decades [43].
As previously indicated, the research problem for this study is the lack of sustainable economic, technological or environmental plans to dispose of decommissioned wind turbines, creating a situation that may hinder wind energy development. This research explores the development of a global spatiotemporal inventory of wind turbines, to forecast decommissioning performance. Additionally, this research addresses the development of sustainable end-of-life centers capable of recycling or reusing wind equipment. Therefore, the developed methodology aims to create of a sustainable system capable of handling end-of-life activities for decommissioned wind turbines. The volume and characteristics of decommissioning components will be assessed, providing stakeholders with a spatiotemporal panorama of critical factors required to operate the proposed end-of-life system. Furthermore, the methodology will evaluate the development of regional and national networks of end-of-life reception centers, determining their number, placement and operational schedule. These reception centers will coordinate the logistics of wind turbine decommissioning, determine transportation mode and minimization of distances, while ensuring sustainable disposal of diverse components. Due to the large spatiotemporal variability on decommissioning components, the system performs advanced scheduling on the aperture and operating constrains for each center.
2. Materials and Methods
The proposed methodology to sustainably handle end-of-life activities for wind turbines was implemented through geospatial analysis as illustrated in Figure 1, developing the Global Wind Inventory for Future Decommissioning (GoWInD). Quantum GIS (QGIS) and RStudio, both open source software, were applied to develop the components for this methodology. A Geospatial database for wind turbines of the area under consideration is integrated with Material databases for the wind turbines. The combined analysis creates a framework to model each wind turbine as composed by four elements: (1) towers, (2) hubs, (3) nacelles and (4) blades (element segmentation in Figure 1). The resulting GoWInD contains relevant infrastructure and geographical data to evaluate individual wind turbine spatiotemporal decommissioning and sustainability attributes. The origination model contains descriptive elements for wind turbine components and as the system is developed into specific inventories, Life Cycle Assessment (LCA) characterizations will be integrated, as required. Spatiotemporal analyses have the advantage of assessing and characterizing wind equipment that is distributed in a large geographic area and has diverse decommissioning dates. The system allows for the integration of diverse databases that evaluate the composition of each wind turbine and provide results that optimize this highly variable inventory, over time and space.
Data from the GoWInD are applied to identify the optimal location of end-of-life (EoL) centers. Objective functions and constrains were incorporated in the analysis to minimize distance from decommissioning wind farms to EoL centers and ensure access to transport and operational resources. Considering the importance of transportation during decommissioning processes [37], with different requirements for each component [47], distance minimization was evaluated according to changing spatiotemporal mass disposal requirements. EoL centers are developed to initiate operations according to variable schedules and changing operational levels according to decommissioning needs. K-means clustering was applied in the GIS methodology to select optimal placements. This algorithm segments all the wind turbines on the contiguous United States in a number of groups based on their location. The load-distance method is applied to evaluate the weighted center of gravity of each cluster considering both mass and dimensions of wind turbine components. All EoL centers placement are appraised for highway and railway availability, while in commuting distance to population centers able to provide workforce and material supplies. Therefore, all the centers of gravity for clusters performed concentric incremental searches to identify nearby locations that comply with the constraints. Applied constrains for locations required distances smaller than one kilometer to transportation networks and distances smaller than thirty kilometers to population centers with at least a population of twenty thousand. The system identifies multiple options for each center of gravity creating a decision support system for stakeholders. For this research the location closest to the center of gravity was chosen. However, stakeholders will have discretion to decide based on other additional considerations.
The methodology was evaluated for the United States, developing the United States Global Wind Inventory for Future Decommissioning (US—GoWInD), applying the databases indicated in Figure 1. The Geospatial database considered in this evaluation was the United States Wind Turbine Database (USWTDB) developed by the U.S. Geological Survey, American Wind Energy Association and Lawrence Berkeley National Laboratory [20]. The characteristics of each element were evaluated according to Materials databases containing models provided by National Renewable Energy Laboratory (NREL). Towers were characterized as tapered steel tubes, hubs were evaluated as a ductile iron spheres and blades were assessed as laminate composite materials based in NREL models by Griffin [44] and Malcolm et al. [45]. Nacelle models were considered as containers with three subcomponents according to the NREL WindPACT baseline models [46]. The mass and dimensions of each individual wind turbine were modeled in accordance to its individual characteristics as provided by the USWTDB [20]. Name Plate Capacity (NPC), rotor diameter and turbine height from the USWTDB was applied to model the components mass, dimensions and characteristics. The framework provided by NREL [46] considers diverse wind turbine NPC and dimensions to characterize components, as indicated in Figure 2. The methodology assigned mass and dimension characteristics to each wind turbine according to its description in USWTDB, considering in order of relevance rotor diameter, hub height and NPC. As the dimensions and the NPC of the wind turbine increases the total mass, as well as per component mass, changes. The dimensions of the equipment were modeled, as indicated in Figure 2c, to ascertain transportation and processing feasibility. Equivalencies between NPC, component’s dimensions, height and rotor diameter are provided by NREL’s Rinker et al. model [46].
The United States end-of-life (US—EoL) centers implementation is based on the US—GoWInD. Data for road transportation were incorporated to US GoWInD from the Federal Highway Administration [48] and from the Texas Department of Transportation [49] repositories. Rail transportation was analyzed applying data retrieved from the Homeland Infrastructure Foundation-Level Data [50]. Cities in the US, its population and configuration were integrated in the system from the US Census Bureau data [51] and recent evaluated data [52]. Figure 3 showcases layered infrastructure data in the US—GoWInD. The aim of the system is to provide a clear spatiotemporal panorama of the requirements and constrains to achieve sustainable end-of-life for wind turbines in the US.
3. Results
Results from the US—GoWInD, categorized by states, are shown in Figure 4a. Texas holds almost 29% of potential disposal mass, with the next six highest ranked states accommodating more than 60% of the wind turbine inventory. Furthermore, 80% of the mass is located in twelve states, while 17 states, as ranked in the chart, contain 90% of all the disposal mass, highlighting its spatial concentration. The large inventory for decommission makes temporal analysis crucial for develop of optimal end-of-life systems schedules. Figure 4b indicates the periods on which the diverse wind turbine mass was originally installed. Considering that the estimated lifespan of a wind turbine is 20 years, this figure indicates that the early part of 2020′s will experience a relatively low disposal volume (2% of current US—GoWInD). By the end of the 2020s, the first large demands on the end-of-life system will become evident, with 32% of current US—GoWInD having reached the end of its lifespan, with more than 25% corresponding to Texas.
Evaluating US—GoWInD considering wind turbine components provides additional decision criteria. Figure 5a showcases the more than 17 million metric tons (MT) of wind turbine components currently deployed in the US, with more than 65% corresponding to towers and hubs, which could have a relatively straightforward salvage value [15]. The almost four million MT of Nacelle components will require an in-depth LCA characterization, with electric, electronic, mechanical and enclosure components being evaluated to ascertain individual fitness for reuse, recycle or reprocessing [26]. Landfilling or incineration of Nacelle components, especially electronics, which may contain toxic or dangerous elements, should be minimized or completely eliminated. On the other hand, the more than 2 million MT corresponding to wind turbine blades’ composite material have the most challenging end-of-life paths. Figure 5b indicates disposal mass generation over time. As wind turbines grow in size, the proportion of mass corresponding to each component changes. During the two decades under consideration the composition for towers and nacelle decreases by 6% and 2.5%, respectively. The mass composition of the blades increases by 7.5% during this time, with the highest increase (more than 3%) in 2025–2029. By the last period of the study, 2035–2040, it is expected that all currently US—GoWInDs will reach its end of life, with a total of almost 8 million MT for that five-year period. More than 1 million tons will correspond to blades and almost 40% of the mass will be located in Texas.
GIS representation of the US—GoWInD allows for broader understanding of the challenges facing the end-of-life systems in terms of spatial and temporal deployment. Figure 6 displays a map of the US with the total mass of currently installed wind turbines per state. Texas has almost 5 million MT, with the second state in the rank, Iowa, having just one-third (1/3) of that mass. The four remaining states in the top bracket, Oklahoma, Illinois, Kansas and California, have each approximately one million MT. In the third bracket for Figure 6, all five states in the category have a mass close to half a million MT. It is clear that special attention should be paid to Texas, as the state that will require the highest operational levels for the proposed end-of-life system.
A number of states are presently experiencing challenges for the disposal of older wind turbines. Figure 7 indicates the installed wind turbine mass that is reaching its retirement age before 2021. California has the largest disposal mass, with 251,000 metric tons (MT), followed by Iowa with 46,000 MT and Minnesota with only 30,000 MT. In the following category, Wyoming and Texas are tied both with 14,000 MT of potential wind turbine mass to dispose. It is important to highlight that even at currently relatively low disposal volumes, anxiety on the challenges presented by this topic are emerging in the government [53], press and communities [54].
In the next twenty years, the US is projected to experience an accelerated growth on wind turbine mass disposal, as shown in Figure 8. GIS representation of US—Go Wind highlights the spatial and temporal complexities presented by the issue. Although, California currently has the largest mass disposal challenge, as indicated by Figure 7, moving forward other states will experience even larger requirements. After 2021 Texas becomes the state with the highest mass to dispose, experiencing exponential growth that will reach a mass of 2.34 Million MT in 2036–2040. For the period of 2021–2025 Iowa, California, Minnesota and New Mexico take the second spot in mass disposal, with New Mexico having almost 75,000 MT during this five year period. In the following period, 2026–2030, disposal mass for Texas quadruples, with Iowa and Minnesota positioned in the second bin, joined by Illinois, Oregon, Washington, Indiana and North Dakota. Texas will maintain similar mass removal volumes from 2026–2035 period. However, in the period 2031–2035, the second bin increases its range values, as highlighted by Figure 8c, including Oklahoma, California, Illinois and Kansas. The last two five-year bins, which end in 2040 experience a significant increment in the value of its three top bins, with 10 states in 2031–2035 with disposal mass higher than 174,000 MT and for the bin 2036–2040, eight states with disposal mass higher than 210,000 MT. In the last time period, as indicated in Figure 8d, Texas contains 36% off all US disposable mass for this period, while the following six ranked states accumulate more than 41% for that mass. In this period Iowa will dispose of almost 850 thousand MT, Oklahoma more than 540 thousand MT and Kansas almost half million MT. The panorama presented by Figure 7 highlights the complexity in developing a supply chain and logistic system for the disposal of decommissioned wind turbines. This will involve scaling up and down decommissioning capacity over time and space, while planning for a sustainable removal and transportation scheme over a long time interval. As the wind energy sector continues to growth in the US it is consequential that the system providing end-of-life services for wind turbine components will need to adapt to the changing needs of the market by 2040 and beyond.
Blade disposal is particularly important in the analysis, considering its challenging end-of-life alternatives. These components are manufactured with laminated composite materials, attached by strong adhesives and coatings, increasing durability and reducing potential damages from particulate collisions. However, these characteristics make the blades challenging to recycle or reprocess. Figure 9 forecasts blade mass disposal over (a) time and (b) per state. Figure 9a showcases that until 2026 blade mass disposal in the US will remain below 50,000 MT, increasing to almost 260,000 by 2032, with variable yearly volumes thereafter until 2034. After 2035, the mass for disposal will reach yearly levels of almost 200,000 MT, with 2039 reaching 315,000 MT yearly. When considering spatial distribution by state, Figure 9b indicates Texas as the most concerning location, with almost 700,000 MT of blade disposal mass over the next twenty years. More than 50% of the blade mass in Texas was installed between 2015 and 2020, which means it will be scheduled for removal between 2036 and 2040. Blade capable end-of-life centers, fitted to serve each location, will be needed according to the decommissioning forecast. As indicated in the introduction recycling and reusing are the sustainable options to operate the end-of-life centers. Several promising technologies are in the R&D or in early commercialization stages [30,55,56]. Pellets suitable for extrusion and injection molding are being manufactured from decommissioned blades [57], while technology is being developed to use the blades in co-pyrolysis processes of sewage sludge to improve wastewater treatment [58]. The development of the national network of end-of-life (US—EoL) centers will incentivize the development of additional options for composite material sustainable disposal able to generate financial benefits for the operators.
The US—GoWInD was integrated with K-means clustering analyses to identify optimal location for the end-of-life (EoL) centers in the continental United States. Fourteen (14) locations were identified by the system to integrate the US end-of-life centers network (US—EoL centers) as shown in Figure 10. The incorporated objective function and constrains minimized distance from US—EoL centers to decommissioning wind turbine mass, considering adequate transportation and operational resources. Unsurprisingly, the system selected three of the US—EoL centers to be placed in Texas (I, J and K), considering the large volume of installed wind turbine mass in the state. Two centers were identified in the West Coast, one in California (B), close to the city of Merced and a second one in northeast Oregon State (A). One center to serve the North Atlantic seaboard (N), was placed in Scranton, Pa, with access to roads, railway and industrial facilities in that congested region. Two facilities were selected to serve the Great Lakes region, the first close to Peoria, Illinois (L) and the second one (M) between Lansing and Grand Rapids in Michigan. The six remaining US—EoL centers were placed in the Great Plains area (excluding Texas) to serve the large wind turbine inventory volume sited in the region. All the centers have full access to major highways, railroads, industrial facilities and urban centers, able to supply required operational resources.
4. Discussion
Results from US—GoWInD indicate that the spatiotemporal performance of decommissioned wind turbines is highly variable, both in space and in time. This creates significant challenges for the development and implementation of end-of-life (EoL) centers in the US. Texas, for instance, will experience significant decommissioning volume in relatively short time periods, while other states experience high temporal variability at lower volumes. Operators of EoL centers require adequate forecast, and relative operational stability over time to justify their investment. The development of this system incorporates this variability to provide stakeholders with the analysis tools required to plan for the development and operation of EoL centers.
Therefore, evaluating the spatiotemporal performance of the US—EoL centers is critical to determine the required scheduled operational levels to match decommissioning needs. Performance levels for each center will be diverse, with potential to delay openings in initially low volume centers, diverting operations to nearby US—EoL center. For instance, Figure 11a indicates that before 2021 centers B and E will handle the highest volume levels for that period, 67% and 19%, respectively. On the other hand, centers C and J will handle a combined volume of 9%, which could lead to center J absorbing operations for center C in that period. In this option center J could open first, considering that by 2021–2025 it will handle 26% of total volume for that period. For the period before 2021 center E can handle operations of center F (2%) making it feasible to have only centers B, E and J open at this time. For the 2021–2025 interval, Figure 11a highlights that seven EoL centers are able to handle 83% of all continental US volume for decommissioned wind turbines. These seven centers J, A, F, I, E, B and H could be able to absorb the volume levels for the other centers while volume increases in their areas. In the period 2026–2030 eight centers are able to handle 82% of the volume, while in for 2030–2035 81% of the volume is handled by 10 centers, with all 14 centers having become active at this time. For the last interval under study, 2036–2040, several centers show significant ramping up of activities, reflective of increasing number of larger turbines being decommissioned. However, a number of centers (A, B, C and N) indicate reduction of activity, which may lead to concerns on the continuing economic viability of these centers. It is important to highlight that demand for those EoL centers will potentially increase as the proposed methodology becomes operational and developers have incentives to continue installing newer bigger wind farms in all regions. Therefore, it is expected to have higher levels of demand for all reception centers after 2036, forecasting continued viability for all operating facilities. Figure 11b explores the adequacy of the placement of each US—EoL center based on its distance to wind turbines it serves. Almost 27% of the US—GoWInD is at less than 100 km (62 miles) from their corresponding US—EoL center, while 70% is at less than 200 km (124 miles) away. On the other hand, less than 5% is at distances larger than 500 km (310 miles). The potential creation of additional centers to serve wind turbines installed at distances longer than 400 km was considered infeasible due to their scattered spatial distribution. The system will continue monitoring future developments to evaluate placement of additional US—EoL centers.
Figure 12 supplements previous analysis, showcasing the variability on disposal volume for each US—EoL center, requirements for staggered opening dates and variable operational levels. Results provide developers with data to evaluate each installation on a yearly temporal resolution, forecasting US—GoWInD needs. These data aid in the development of complementary US—EoL center groups to absorb excess demand through the performance of spatiotemporal analysis. For instance, the reception centers G, H and I could operate as a joint operational group, taking over excess volume from each other when required or creating specialization among centers. These centers are located 280–370 km (170 mi–230 mi) from each other. The increase in transportation cost could be offset by savings generated from avoiding required excess capacity. In this case, during the 2035–2040 interval, center H experiences a yearly volume increase of up to 90,000 MT over previous baseline, while in the same period center G and I experience a yearly decrease in volume of up to 50,000 MT and 40,000 MT, respectively. This spatiotemporal analysis would be evaluated in cost-benefit terms, assessing transportation costs versus excess capacity availability costs.
The mix distribution of diverse wind turbine components in the operation of each US—EoL center is a relevant factor to consider in the proposed methodology. As wind turbines increase their name plate capacity (NPC) and size the total mass grows and the mass proportion per component varies, as indicated in Figure 2. Towers and blades significantly increase their mass in more advanced models, creating the requirement for US—EoL centers to have adequate processing capacity for each component according to the forecasted mass. Figure 13 provides the expected mass for each US—EoL center per wind turbine component for the time periods indicated. Data indicate that in the period before 2021, the mass of the blades and hub in less than 7% while the mass for towers accrued to more than 66% of total disposal mass. In the following period (2021–2025) blade mass grows to more than 9% and hubs to almost 8% of total mass, while towers diminish to 60%. In the following periods the proportion of blade continues to increase while the proportion of all other components has small increments or decreases. By 2036–2040, the mass of blades exceeds 14% while tower mass decreases to less than 60% of total wind turbine mass. This information is relevant considering that at this time, as previously indicated, blades are the most challenging element to adequately process in a sustainable manner. It is important for stakeholders to develop in the near future processes capable of processing these composite materials in a sustainable manner, which additionally generate financial benefits from these processes.
To validate optimal transportation of US—GoWInD to corresponding US—EoL centers, a spatiotemporal analysis was evaluated. The system integrated constraints for mass, size and sustainability characterization on individual components to avoid straining transportation networks. Special attention was paid to particularly challenging components, with detail planning well in advance of its forecasted decommissioning. Figure 14 indicates the distance that each blade will be transported to arrive to its corresponding US—EoL center using roads or railways. Railroads will be an effective solution for larger or bulkier equipment, relieving roads from high traffic volume, which may impact commuters and local communities. Figure 14a presents blade transportation distance classified by blade length, considering that longer blades pose the higher transportation complexity. The placement of the US—EoL centers is validated as optimal by these results. A total of 80% of blades larger than 60 m, the most complex to transport, are closer than 200 km to the US—EoL center, while 97% are closer than 300 km with no blades at distances longer than 400 km. A total of 69% and 72% of the blades in categories 20–40 m and 40–60 m, respectively, are located at less than 200 km while 91% and 95%, respectively, are located closer than 400 km for its corresponding US—EoL centers. On the other hand, smaller blades, shorter than 20 m, are more dispersed with respect to US—EoL centers, with only 46% at distances closer than 500 km. Figure 14b provides a distance analysis for US—EoL centers, assessing the transportation requirements for each installation. Only four centers have significant blade numbers at distances longer than 400 km. Center A has 16% of blades in that range, while B has 32%, C with 6% and N has 20%. Two centers have marginal blade numbers at distances longer than 400 km, I and J, with less than 1% each. A high proportion of these blades in disperse locations have a shorter length, with lower transportation costs and complexity. From the remaining US—EoL centers, only H has significant blade numbers at longer distances than 300 km (12%) with all the remaining centers having transportation distances smaller than 300 km. Since transportation of shorter blades represents lower costs and complexity, roads or railways could be both evaluated by cost analysis criteria. On the other hand, for larger equipment, railroads will be applied as transportation method to relieve road congestion. The analysis highlights minimization of transportation distances optimized by the application of the proposed methodology.
Towers are challenging components for transportation during decommissioning. Therefore, it is relevant to validate optimal placement of US—EoL centers for these elements. Figure 15 highlights towers as significantly larger that blades, increasing transportation logistic complexities. Slightly more than 70% of all wind turbines have towers in height ranges of 60–80 m. Highway transportation would present a challenge, unless towers are cut or disassembled in-situ. However, this in-situ preprocessing would increase cost and would require relocation of bulky and expensive equipment to the decommissioned wind farm location. Cost benefit analysis between highway and railroad transportation should be evaluated to assess optimal alternatives. Figure 15a displays the distance for wind towers transportation to its corresponding US—EoL center, classified by tower height (in meters). The system indicates that 92% of towers taller than 100 m are less than 400 km from the EoL center, 72% at distances shorter than 300 km, while 56% are at distances less than 200 km. For the intermediate height ranges of 40–60, 60–80 and 80–100 m, the turbines are at less than 200 km in 76%, 70% and 74%, respectively, while more than 90% are at less than 400 km. For the smaller towers, on the 20–40 m range, the dispersion is significant, with only 45% of turbines at distances shorter than 500 km. However, due to the lower transportation cost, the optimality of the solution presented by the system was validated, with placement of US—EoL centers minimizing transportation of larger components. Figure 15b indicates the type of towers that each center is forecasted to receive. From these results, only three centers will process towers taller than 100 m, H, K and N, which account during this period for less than 0.4% of all towers in the US—GoWInD. On the other hand, 21% of all towers are in the category 80–100 m with six US—EoL centers (F, H, J, K, L and M) accounting for almost 70% of this category. On the other hand, 72% of towers will be in the of 60–80 m range, with six centers (A, E, F, H, I and J) corresponding to almost 62% of this range. Finally, 90% of the towers in the range 40–60 m are handled by four centers (A, B, E, J) while only one center (B) will receive towers smaller than 40 m. Older wind turbines utilize smaller towers, which will cause some US—EoL centers to start handling larger towers after 2030, when larger wind turbines will be decommissioned.
5. Conclusions
This research developed a spatiotemporal methodology to sustainably handle end-of-life activities for wind turbines. The ultimate goal was to support wind energy continuous growth by overcoming concerns related to unsustainable disposal wind energy equipment at the end of their life. The Global Wind Turbine Mass Inventory (GoWInD) methodology was introduced in this research, characterizing wind turbines according to individual spatiotemporal decommissioning and sustainability attributes. Applying data from the GoWInD the methodology proposes the development of end-of-life (EoL) centers to sustainably process decommissioned wind turbines, which are optimally placed according spatiotemporal variable wind turbine inventory.
The proposed methodology was evaluated with data from the United States. Results indicated that there is an imbalance both in the spatial and temporal distribution of forecasted disposal material in the US. One state, Texas, holds more than one quarter of all wind turbine mass in the US while only seventeen states contain more than 90% of this mass. The temporal analysis indicated an even greater imbalance. Before 2025, less than one million MT of disposal material will be generated, while between 2026 and 2030, it will grow to almost four million MT. In the last period under analysis, 2036–2040, almost eight million MT of material will be generated. The research also highlighted the significant variability on the composition of the disposal mass, with recent wind turbines increasing the mass and dimensions of the blades and towers. The systems integrate this variability in the analysis to evaluate operational requirement for US—EoL centers and transportation logistics.
The spatiotemporal variability is incorporated in the operational schedules of the proposed US—EoL centers, with staggered opening schedules and changing operational volume. The system evaluated the complementarity of reception centers, with some of them accepting material designated for a nearby center, to avoid drastic fluctuations in operational volumes in some centers or delay the aperture of low volume centers in early time periods. US—EoL center complementarity is based in potential savings on operational costs, which will be able to overcome additional transportation expenditures. The analysis incorporates special attention to materials that have challenging end-of-life options, such as composite materials and electronic equipment. The creation of EoL centers will incentivize the development of sustainable end-of-life options for these materials, which simultaneously generate financial benefit for the operators. Ultimately, it will allow wind energy to grow at the required pace to curve climate change.
Future research will evaluate the implementation of this framework for other geographical locations. Spatiotemporal databases of local wind turbines will be evaluated according to mass, dimensions and materials of each devise. Local infrastructure and transportation databases will be incorporated to the system to provide local baselines for the installation of EoL centers. Additionally, the forecast window for US—GoWInd is currently limited to the data provided by USWTDB according to the installation year for each wind turbine and its expected decommissioning, twenty years afterwards. The project will incorporate forecast data for future installation of wind farms to evaluate longer operational windows, providing stakeholders with a decision support system for the decommissioning of wind equipment. Future research will additionally incorporate LCA for individual wind turbine models to analyze with much greater resolution the characteristics, composition and individual materials of each wind turbine to be decommissioned. Complementary clusters of EoL centers in future research will ascertain with greater spatial and temporal resolution their operational parameters. These analyses will allow automation of a number of decision criteria parameters in GoWInD and provide stakeholders with a detailed plan to operate the EoL centers. The methodology will serve as a general framework, applicable to multiple spatial and temporal resolutions.
Funding
This research was funded by the College of Business Administration 2020–2021 Summer Research Grant at Texas A&M University Kingsville.
Acknowledgments
I would like to gratefully acknowledge the support of the College of Business Administration at Texas A&M University Kingsville.
Conflicts of Interest
The author declares no conflict of interest.
Abbreviations
| EoL centers | End-of-life centers |
| GoWInD | Global Wind Inventory for Future Decommissioning |
| K | Thousands |
| LCA | Life Cycle Assessment |
| MT | Metric tons |
| NPC | Name Plate Capacity |
| US—EoL centers | United States end-of-life centers |
| US—GoWInD | United States Global Wind Inventory for Future Decommissioning |
| USWTDB | United States Wind Turbine Database |
References
- Eller, D. Iowa’s Betting Big on Wind Energy, but it’s Creating a Problem: What Happens to the Blades Once They’re No Longer Useful? Des Moines Register. 6 November 2019. Available online: https://www.desmoinesregister.com/story/money/agriculture/2019/11/06/few-recycling-options-wind-turbine-blades-head-iowa-landfills/3942480002/ (accessed on 17 November 2020).
- Tao, M.; Fthenakis, V.; Ebin, B.; Steenari, B.M.; Butler, E.; Sinha, P.; Simon, E.S. Major challenges and opportunities in silicon solar module recycling. Prog. Photovolt. Res. Appl. 2020, 28, 1077–1088. [Google Scholar] [CrossRef]
- Buck, T. Germans Fall Out of Love With Wind Power. Financial Times. 17 November 2019. Available online: https://www.ft.com/content/d8b9b0bc-04a6-11ea-a984-fbbacad9e7dd (accessed on 18 August 2020).
- You, C.; Kim, J. Optimal design and global sensitivity analysis of a 100% renewable energy sources based smart energy network for electrified and hydrogen cities. Energy Convers. Manag. 2020, 223, 113252. [Google Scholar] [CrossRef]
- Jung, C.; Schindler, D. Integration of small-scale surface properties in a new high resolution global wind speed model. Energy Convers. Manag. 2020, 210, 112733. [Google Scholar] [CrossRef]
- Ziegler, L.; Gonzalez, E.; Rubert, T.; Smolka, U.; Melero, J.J. Lifetime extension of onshore wind turbines: A review covering Germany, Spain, Denmark, and the UK. Renew. Sustain. Energy Rev. 2018, 82, 1261–1271. [Google Scholar] [CrossRef] [Green Version]
- Oebels, K.B.; Pacca, S. Life cycle assessment of an onshore wind farm located at the northeastern coast of Brazil. Renew. Energy 2013, 53, 60–70. [Google Scholar] [CrossRef]
- Jensen, J.P.; Skelton, K. Wind turbine blade recycling: Experiences, challenges and possibilities in a circular economy. Renew. Sustain. Energy Rev. 2018, 97, 165–176. [Google Scholar] [CrossRef]
- Staffell, I.; Green, R. How does wind farm performance decline with age? Renew. Energy 2014, 66, 775–786. [Google Scholar] [CrossRef] [Green Version]
- Martin, C. Wind Turbine Blades Can’t Be Recycled, So They’re Piling Up in Landfills. Bloomberg News. 5 February 2020. Available online: https://www.bloomberg.com/news/features/2020-02-05/wind-turbine-blades-can-t-be-recycled-so-they-re-piling-up-in-landfills (accessed on 22 June 2020).
- State of Wyoming Legislature—SWL. HB0129—Reclamation of Surface coal Mines-Turbine Blades. 2020. Available online: https://wyoleg.gov/Legislation/2020/HB0129 (accessed on 11 August 2020).
- Erickson, C. . Wind Turbine Blades in Coal Mine Pits? There’s a New Law in Wyoming to Allow It. Casper Star Tribune. 10 August 2020. Available online: https://trib.com/business/energy/wind-turbine-blades-in-coal-mine-pits-theres-a-new-law-in-wyoming-to-allow/article_df17dbc9-f6db-5eb6-8164-32b25275aa9b.html (accessed on 11 August 2020).
- Kelley, R. Retiring Worn-Out Wind Turbines Could Cost Billions That Nobody Has. Valley Morning Star. 18 February 2017. Available online: https://www.valleymorningstar.com/2017/02/18/retiring-worn-out-wind-turbines-could-cost-billions-that-nobody-has/ (accessed on 14 February 2020).
- Xcel Energy. Nobles Wind Energy Project; Decommissioning/Restoration/Abandonment. 2011. Available online: https://www.edockets.state.mn.us/EFiling/edockets/searchDocuments.do?method=showPoup&documentId=%7b70B7CE89-9575-4971-80B2-B240078960F7%7d&documentTitle=20112-59334-01 (accessed on 14 February 2020).
- Guezuraga, B.; Zauner, R.; Pölz, W. Life cycle assessment of two different 2 MW class wind turbines. Renew. Energy 2012, 37, 37–44. [Google Scholar] [CrossRef]
- Blade Recycling: A Top Priority for the Wind Industry. News. 12 February 2020. Available online: https://windeurope.org/newsroom/news/blade-recycling-a-top-priority-for-the-wind-industry/ (accessed on 14 February 2020).
- Madlener, R.; Glensk, B.; Gläsel, L. Optimal Timing of Onshore Wind Repowering in Germany under Policy Regime Changes: A Real Options Analysis. Energies 2019, 12, 4703. [Google Scholar] [CrossRef] [Green Version]
- Gipe, P. Removal and Restoration Costs in California: Who Will Pay? WindStats Newsletter. 1 April 1997. Available online: http://www.wind-works.org/cms/index.php?id=340&tx_ttnews%5Btt_news%5D=538&cHash=e36d73ebc7d460e5de9cfccf219cb73a (accessed on 20 August 2020).
- Lantz, E.; Leventhal, M.; Baring-Gould, I. Wind Power Project Repowering: Financial Feasibility, Decision Drivers, and Supply Chain Effects (No. NREL/TP-6A20-60535); National Renewable Energy Lab (NREL): Golden, CO, USA, 2013.
- Hoen, B.D.; Diffendorfer, J.E.; Rand, J.T.; Kramer, L.A.; Garrity, C.P.; Hunt, H.E. United States Wind Turbine Database. U.S. Geological Survey, American Wind Energy Association, and Lawrence Berkeley National Laboratory Data Release: USWTDB V2.3 (January, 2020). Available online: https://eerscmap.usgs.gov/uswtdb/data/ (accessed on 22 June 2020).
- Christidis, T.; Lewis, G.; Bigelow, P. Understanding support and opposition to wind turbine development in Ontario, Canada and assessing possible steps for future development. Renew. Energy 2017, 112, 93–103. [Google Scholar] [CrossRef]
- Reuters. German Onshore Wind Turbine Growth Slowed Sharply in 2019: Industry. 28 January 2020. Available online: https://www.reuters.com/article/us-germany-wind-onshore/german-onshore-wind-turbine-growth-slowed-sharply-in-2019-industry-idUSKBN1ZR1GL (accessed on 18 February 2020).
- Legislature of the State of Texas. An Act Relating to the Removal of Wind Power Facilities; Texas Register. 2019. Available online: https://capitol.texas.gov/tlodocs/86R/billtext/html/HB02845F.htm (accessed on 20 August 2020).
- Andersen, N.; Eriksson, O.; Hillman, K.; Wallhagen, M. Wind Turbines’ End-of-Life: Quantification and Characterization of Future Waste Materials on a National Level. Energies 2016, 9, 999. [Google Scholar] [CrossRef] [Green Version]
- Liu, P.; Barlow, C.Y. Wind turbine blade waste in 2050. Waste Manag. 2017, 62, 229–240. [Google Scholar] [CrossRef] [PubMed]
- Topham, E.; McMillan, D. Sustainable decommissioning of an offshore wind farm. Renew. Energy 2017, 102, 470–480. [Google Scholar] [CrossRef] [Green Version]
- Sacchi, R.; Besseau, R.; Perez-Lopez, P.; Blanc, I. Exploring technologically, temporally and geographically-sensitive life cycle inventories for wind turbines: A parameterized model for Denmark. Renew. Energy 2019, 132, 1238–1250. [Google Scholar] [CrossRef]
- Pickering, S.J. Recycling technologies for thermoset composite materials-current status. Compos. Part A: Appl. Sci. Manuf. 2006, 37, 1206–1215. [Google Scholar] [CrossRef]
- Nagle, A.J.; Delaney, E.; Bank, L.C.; Leahy, P.G. A Comparative Life Cycle Assessment between landfilling and Co-Processing of waste from decommissioned Irish wind turbine blades. J. Clean. Prod. 2020, 277, 123321. [Google Scholar] [CrossRef]
- Murray, R.E.; Jenne, S.; Snowberg, D.; Berry, D.; Cousins, D. Techno-economic analysis of a megawatt-scale thermoplastic resin wind turbine blade. Renew. Energy 2019, 131, 111–119. [Google Scholar] [CrossRef]
- Liu, P.; Meng, F.; Barlow, C.Y. Wind turbine blade end-of-life options: An eco-audit comparison. J. Clean. Prod. 2019, 212, 1268–1281. [Google Scholar] [CrossRef] [Green Version]
- Martínez, E.; Sanz, F.; Pellegrini, S.; Jiménez, E.; Blanco, J. Life cycle assessment of a multi-megawatt wind turbine. Renew. Energy 2009, 34, 667–673. [Google Scholar] [CrossRef]
- Oroschakoff, K. Small Old Wind Towers Make for Big New Problems. EU Politico. 23 December 2018. Available online: https://www.politico.eu/article/small-old-wind-towers-make-for-big-new-problems/ (accessed on 14 February 2020).
- State of Wyoming Legislature—SWL. HB0127—Prohibiting Disposal of Wind Turbine Blades in Landfills. 2020. Available online: https://wyoleg.gov/Legislation/2020/HB0217 (accessed on 11 August 2020).
- Kaldellis, J.K.; Apostolou, D. Life cycle energy and carbon footprint of offshore wind energy. Comparison with onshore counterpart. Renew. Energy 2017, 108, 72–84. [Google Scholar] [CrossRef]
- Willis, D.J.; Niezrecki, C.; Kuchma, D.; Hines, E.; Arwade, S.R.; Barthelmie, R.J.; Mack, J.H. Wind energy research: State-of-the-art and future research directions. Renew. Energy 2018, 125, 133–154. [Google Scholar] [CrossRef]
- Mativenga, P.T.; Lou, E. Managing Supply Chain Complexity: Foresight for Wind Turbine Composite Waste. Procedia Cirp 2018, 69, 938–943. [Google Scholar]
- Hessler, U. German wind energy stalls amid public resistance and regulatory hurdles. Deutsche Welle. 9 April 2019. Available online: https://www.dw.com/en/german-wind-energy-stalls-amid-public-resistance-and-regulatory-hurdles/a-50280676 (accessed on 26 August 2020).
- The Oxford Institute for Energy Studies. COVID-19 and the Energy Transition. Forum 2020, 123, 1–75. [Google Scholar]
- Morris, C. Tear Down or Leave Up All the Old Wind Turbines? 16 November 2017. Available online: https://energytransition.org/2017/11/tear-down-or-leave-up-all-the-old-wind-turbines/ (accessed on 14 February 2020).
- Lacal-Arántegui, R.; Uihlein, A.; Yusta, J.M. Technology effects in repowering wind turbines. Wind Energy 2020, 23, 660–675. [Google Scholar] [CrossRef]
- Serri, L.; Lembo, E.; Airoldi, D.; Gelli, C.; Beccarello, M. Wind energy plants repowering potential in Italy: Technical-economic assessment. Renew. Energy 2018, 115, 382–390. [Google Scholar] [CrossRef]
- Harper, J. German wind power blown off course. Deutsche Welle. 21 November 2019. Available online: https://www.dw.com/en/german-wind-power-blown-off-course/a-51341340 (accessed on 18 February 2020).
- Griffin, D.A. Windpact Turbine Design Scaling Studies Technical Area 1—Composite Blades for 80- to 120-Meter Rotor (No. NREL/SR-500-29492); National Renewable Energy Laboratory: Golden, CO, USA, 2001.
- Malcolm, D.J.; Hansen, A.C. WindPACT Turbine Rotor Design Study: June 2000–June 2002 (Revised) (No. NREL/SR-500-32495); National Renewable Energy Laboratory (NREL): Golden, CO, USA, 2006.
- Rinker, J.; Dykes, K.L. Windpact Reference Wind Turbines (No. NREL/TP-5000-67667); National Renewable Energy Laboratory (NREL): Golden, CO, USA, 2018.
- Lombardi, L.; Mendecka, B.; Carnevale, E.; Stanek, W. Environmental impacts of electricity production of micro wind turbines with vertical axis. Renew. Energy 2018, 128, 553–564. [Google Scholar] [CrossRef]
- Federal Highway Administration—US Department of Transportation. National Highway System Geospatial Data. 2018. Available online: https://www.fhwa.dot.gov/policyinformation/hpms/shapefiles.cfm (accessed on 20 July 2020).
- Texas Department of Transportation. TxDOT Roadways. 2020. Available online: https://gis-txdot.opendata.arcgis.com/datasets/txdot-roadways (accessed on 20 July 2020).
- Homeland Infrastructure Foundation—Level Data. Railroads. 2018. Available online: https://hifld-geoplatform.opendata.arcgis.com/datasets/2a9677db741d4a78bd221586fe9a61f5_0 (accessed on 20 July 2020).
- US Census Bureau Centers of Population. 2010. Available online: https://www.census.gov/geographies/reference-files/time-series/geo/centers-population.html (accessed on 6 January 2020).
- US Census Bureau Mapping Files. TIGER/Line Shapefiles; U.S. Department of Commerce Geography Division, U.S. Census Bureau. 2019. Available online: https://www.census.gov/geographies/mapping-files/time-series/geo/tiger-line-file.html (accessed on 6 January 2020).
- Jones, R.; Bonney, L. Texas Legislature Passes Decommissioning Statutory Requirements on Wind Energy Land Leases; Foley & Lardner, LLP: Milwaukee, WI, USA, 2019. [Google Scholar]
- Stella, C. Unfurling the Waste Problem Caused by Wind Energy. National Public Radio. 10 September 2019. Available online: https://www.npr.org/2019/09/10/759376113/unfurling-the-waste-problem-caused-by-wind-energy#:~:text=Wind%20Energy%20Has%20A%20Waste%20Problem%3A%20Disposing%20Of%20The%20Turbines%20%3A%20NPR&text=Live%20Sessions-,Wind%20Energy%20Has%20A%20Waste%20Problem%3A%20Disposing%20Of%20The%20Turbines,is%20both%20complicated%20and%20costly (accessed on 11 May 2020).
- Murray, R.E.; Roadman, J.; Beach, R. Fusion joining of thermoplastic composite wind turbine blades: Lap-shear bond characterization. Renew. Energy 2019, 140, 501–512. [Google Scholar] [CrossRef]
- Belton, P. What happens to all the old wind turbines? BBC News. 7 February 2020. Available online: https://www.bbc.com/news/business-51325101 (accessed on 26 August 2020).
- Global Fiberglass Solutions. Industrial Fiberglass Recycling. 2020. Available online: https://www.globalfiberglassinc.com/ (accessed on 11 September 2020).
- Hu, J.; Danish, M.; Lou, Z.; Zhou, P.; Zhu, N.; Yuan, H.; Qian, P. Effectiveness of wind turbine blades waste combined with the sewage sludge for enriched carbon preparation through the co-pyrolysis processes. J. Clean. Prod. 2018, 174, 780–787. [Google Scholar] [CrossRef]
Figure 1.
Methodology to integrate Global Wind Inventory for Future Decommissioning (GoWInD) and its validation implementation applying databases from the US, materials database considers NREL models [44,45,46].

Figure 2.
Wind turbines’ (a,b) mass and (c) dimensions according to its Name Plate Capacity (NPC) as modeled by National Renewable Energy Laboratory’s (NREL) Griffin [44], Malcolm et al. [45] and Rinker et al. [46].

Figure 3.
US—GoWInD displaying some of its integrated databases. USWTDB [20] and roads [48,49] are updated to 2020 and railways to 2018 [50].

Figure 4.
US—GoWInD (a) per state in decreasing order clockwise direction starting in Texas (TX), (b) over time considering installation year from before the year 2000 to 2020, with state classification.
Figure 4.
US—GoWInD (a) per state in decreasing order clockwise direction starting in Texas (TX), (b) over time considering installation year from before the year 2000 to 2020, with state classification.


Figure 5.
US—GoWInD over time (a) per component, (b) per time period, considering installation year from before the year 2000 to 2020.
Figure 5.
US—GoWInD over time (a) per component, (b) per time period, considering installation year from before the year 2000 to 2020.


Figure 6.
US map showcasing global wind turbine mass inventory per state up to 2020.

Figure 7.
US map showcasing wind turbine mass inventory per state up to 2021.

Figure 8.
US map showcasing wind turbine mass inventory per state over time considering the following decommissioning periods: (a) 2021–2025, (b) 2026–2030, (c) 2031–2035, (d) 2036–2040.
Figure 8.
US map showcasing wind turbine mass inventory per state over time considering the following decommissioning periods: (a) 2021–2025, (b) 2026–2030, (c) 2031–2035, (d) 2036–2040.

Figure 9.
Wind turbine blade mass disposal (a) considering disposal year and (b) per state with year of installation.
Figure 9.
Wind turbine blade mass disposal (a) considering disposal year and (b) per state with year of installation.

Figure 10.
Proposed wind turbines end-of-life (EoL) centers in the continental US.
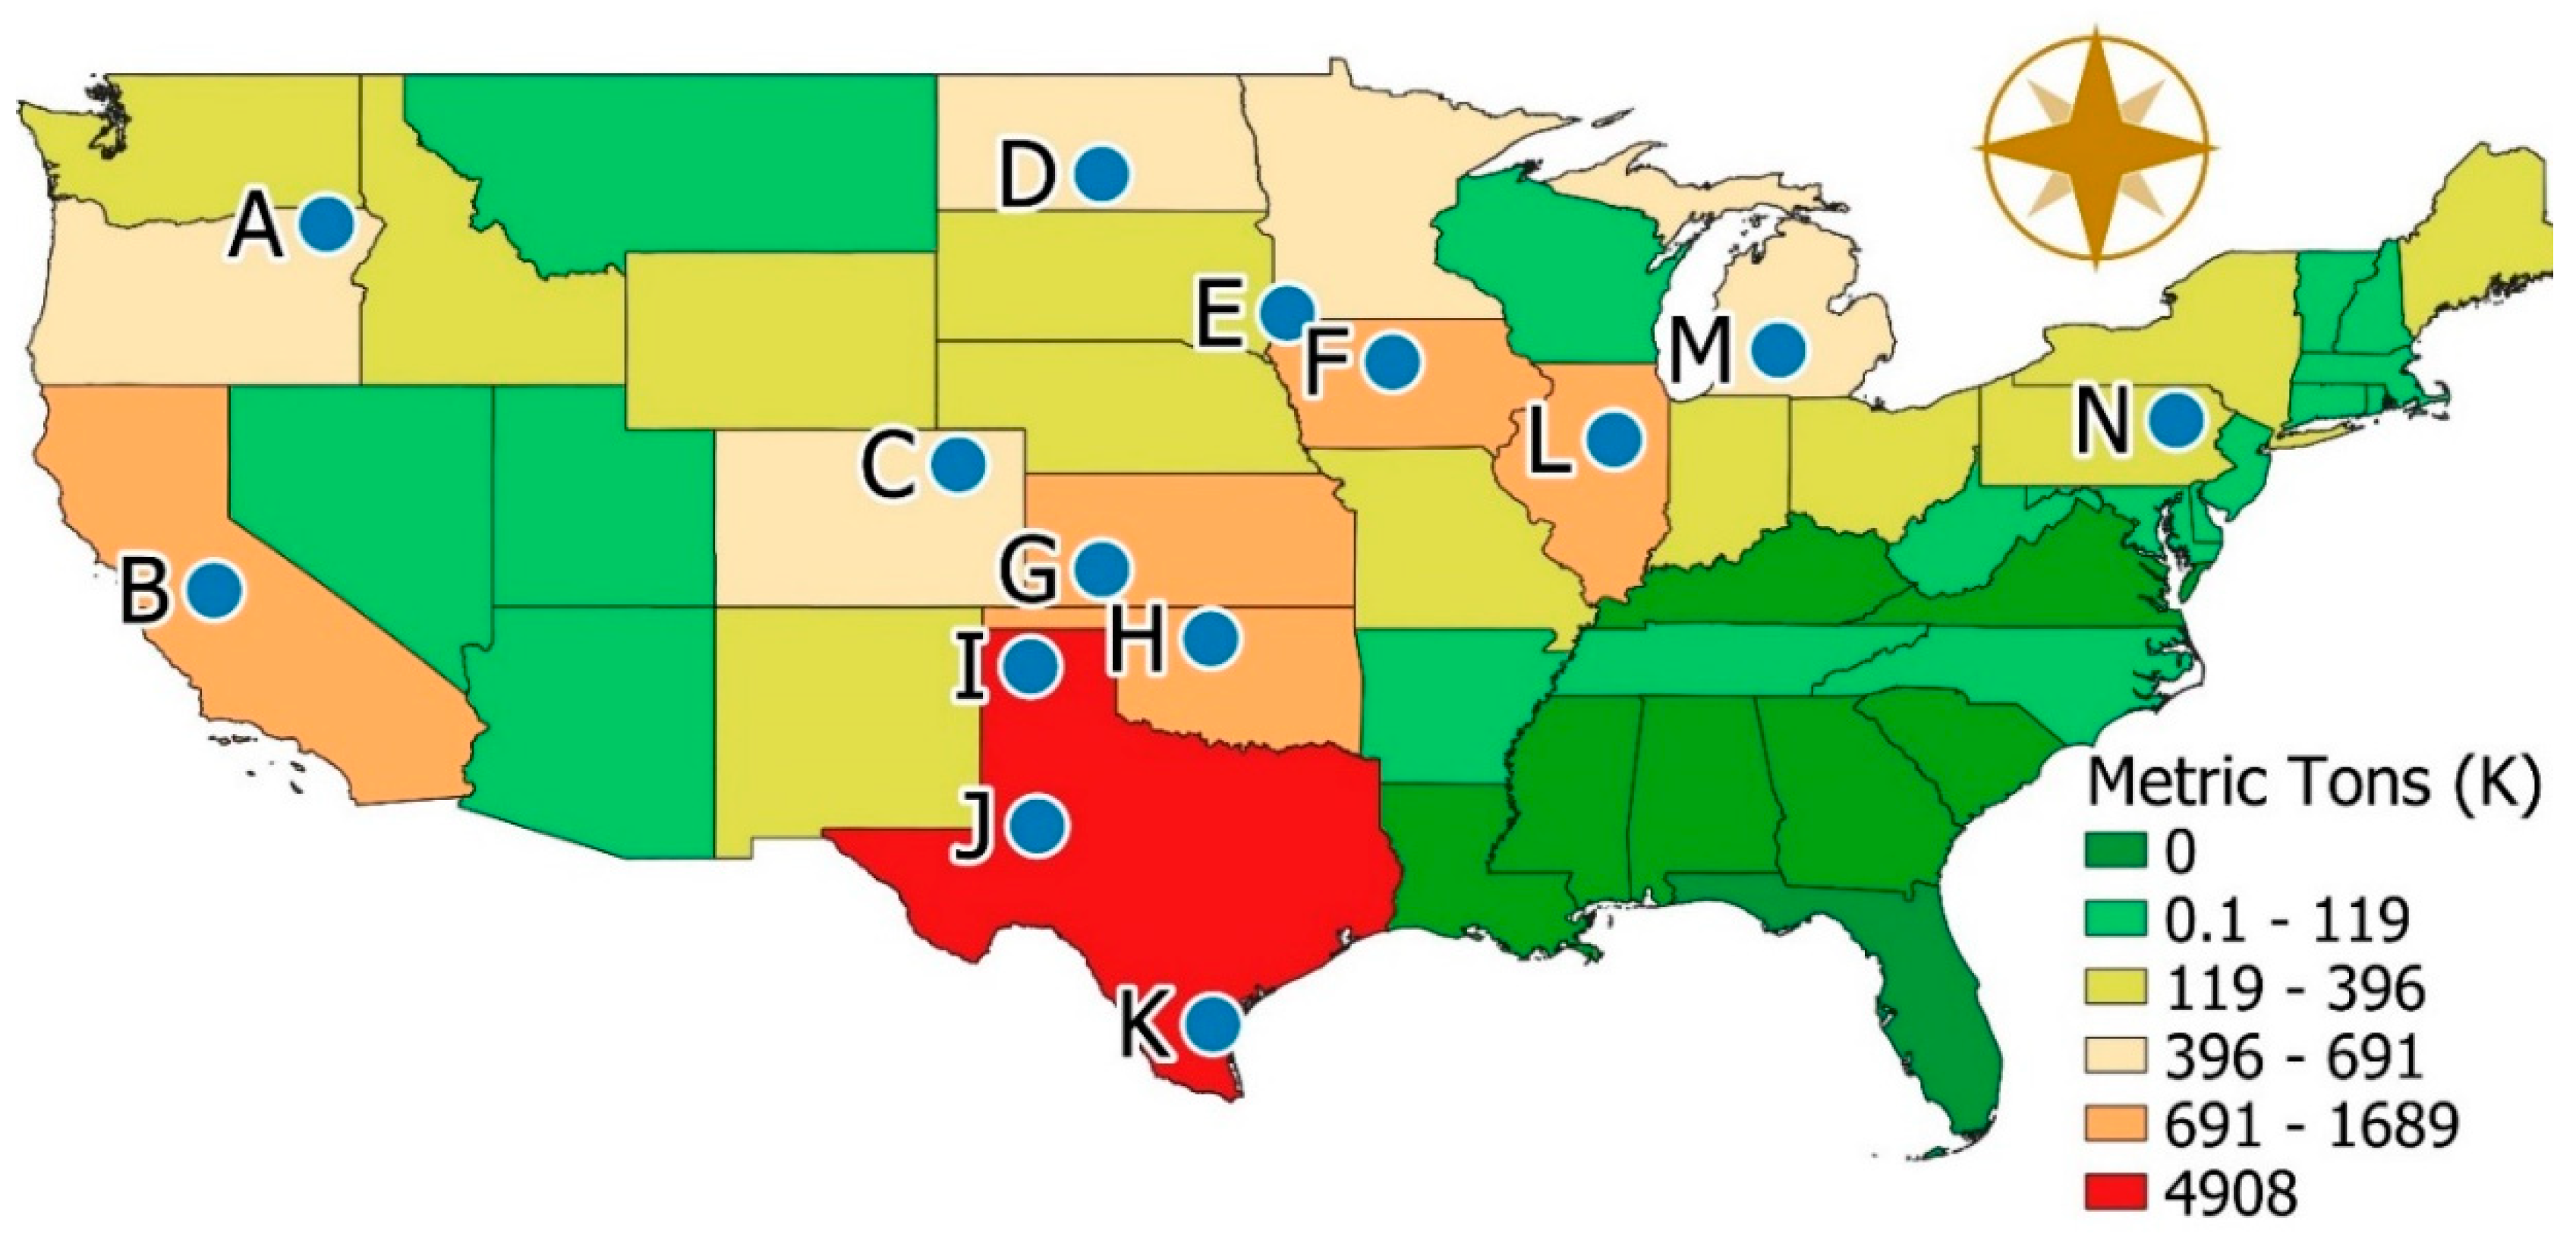
Figure 11.
Spatiotemporal performance of US—EoL centers for decommissioned wind turbines (a) over time, considering decommissioning year from <2021 to 2040 and (b) distance.
Figure 11.
Spatiotemporal performance of US—EoL centers for decommissioned wind turbines (a) over time, considering decommissioning year from <2021 to 2040 and (b) distance.

Figure 12.
Performance of US—EoL centers over time considering decommissioning year from <2021 to 2040: (a) front view, (b) reverse view.
Figure 12.
Performance of US—EoL centers over time considering decommissioning year from <2021 to 2040: (a) front view, (b) reverse view.

Figure 13.
Expected volume per component for US—EoL centers over time considering decommissioning year: (a) before 2021, (b) 2021–2025, (c) 2026–2030, (d) 2031–2035, (e) 2036–2040.
Figure 13.
Expected volume per component for US—EoL centers over time considering decommissioning year: (a) before 2021, (b) 2021–2025, (c) 2026–2030, (d) 2031–2035, (e) 2036–2040.


Figure 14.
Blade transport distance to corresponding US—EoL center classified by (a) blade length (m) and (b) EoL reception centers.
Figure 14.
Blade transport distance to corresponding US—EoL center classified by (a) blade length (m) and (b) EoL reception centers.


Figure 15.
Analysis of turbine towers with corresponding US—EoL center: (a) transportation distance (km), (b) required capacity according to tower height.
Figure 15.
Analysis of turbine towers with corresponding US—EoL center: (a) transportation distance (km), (b) required capacity according to tower height.

Publisher’s Note: MDPI stays neutral with regard to jurisdictional claims in published maps and institutional affiliations. |
© 2020 by the author. Licensee MDPI, Basel, Switzerland. This article is an open access article distributed under the terms and conditions of the Creative Commons Attribution (CC BY) license (http://creativecommons.org/licenses/by/4.0/).
Share and Cite
MDPI and ACS Style
Haces-Fernandez, F. GoWInD: Wind Energy Spatiotemporal Assessment and Characterization of End-of-Life Activities. Energies 2020, 13, 6015. https://doi.org/10.3390/en13226015
AMA Style
Haces-Fernandez F. GoWInD: Wind Energy Spatiotemporal Assessment and Characterization of End-of-Life Activities. Energies. 2020; 13(22):6015. https://doi.org/10.3390/en13226015
Chicago/Turabian StyleHaces-Fernandez, Francisco. 2020. "GoWInD: Wind Energy Spatiotemporal Assessment and Characterization of End-of-Life Activities" Energies 13, no. 22: 6015. https://doi.org/10.3390/en13226015
Note that from the first issue of 2016, this journal uses article numbers instead of page numbers. See further details here.