Abstract
Measuring the probability of flood risk is a key issue in the economics of natural disasters. This discipline studies actual and potential effects of natural disasters on the functioning of economic systems. In traditional economic understanding, it is assumed that both the decision making processes and market processes operate within a certain level of access to information. It is also assumed that the effects of certain phenomena are predictable. However, a natural disaster is difficult to predict. It is hard to predict the time of its occurrence, its impact, direct exposure to its effects and finally, its social and economic results. Exposure to a random hazard, combined with the amount of damage resulting from its potential materialization, is called risk. In this study, the authors focus on presenting a method for quantification of the random element of flood risk. We are using measurement data for cross-border areas between Poland and Germany who witnessed a flood of the century in the 1990s. The empirical data illustrate the usefulness and universality of probabilistic quantification methods for flood risk analysis. The analysis of water level is interesting in a much broader context than the hydrological-economic one. In Central Europe, river water level is immediately connected with two other disaster-like phenomena: drought and heavy rainfall. Also, the course of the Oder river is typical for North European Plain. Therefore, the conclusions presented by the authors are universal by nature and describe certain broader phenomena. Employment of methods of probabilistic quantification using extreme values yields very interesting results: flood risk changes dynamically. Five-year period measurements themselves indicate that there are periods of relatively low exposure of the areas to the disaster (with negligible probability 0.02) and periods of disproportionately high risk increase. The risk of exceeding alarm levels and warning levels changes rapidly, reaching as much as 30% in some locations.
1. Introduction
What is a natural disaster in terms of economy? It is a natural phenomenon that results in significant dysfunction of the economic system or human economic behavior. The effects of such events are observed in the amount of assets, production factors, employment, and consumption. A natural disaster is usually associated with negative results but there are also positive effects that should not be ignored. The relation between a natural event and its effects is studied by the economy of extreme phenomena. Three key questions are asked in this field: where the event shall occur, what its intensity will be, and what will its effect be on the economic system. The effect can be assessed in non-material categories: personal injury, civilizational regress, environmental damage, as well as in a strictly financial sense, expressed in funding necessary to rebuild lost elements of infrastructure, development, belongings [1,2,3,4]. With some phenomena, such as flood, it is relatively easy to pinpoint the affected area and estimate the damage [5]. For this reason, specifying the amount of potential damage in such areas is essential. Heavy rainfall or tsunami occur in locations that are difficult to predict, therefore such prediction becomes essential. Hurricanes or drought are large-scale phenomena, therefore it is more important to predict their intensity rather than the affected area. Apart from the geographical and financial aspect, there is also assessment of frequency, probability, and hazard. What we are referring to here, is the frequency of phenomena that exceed a certain safety threshold. Magnitude, location, and duration, along with damage incurred, create a relation in the economic aspect of social life. The need to study economic mechanisms in terms of extreme phenomena is not a new problem, however it was formally categorized only in the result of events that took place in the 1960s [6]. Certain observations allowed to develop the concept of disaster economy [7]. The main trend of development was to assess how the laws of ‘traditional’ economy change as a result of certain events. The trend adopted a rather practical approach fairly quickly: for instance, in the form of guidelines for policies of supporting areas affected by disaster [8] or specific support programs [9]. Disaster economy took its formal shape in the 1970s and 1980s [10], by adopting its concept to particular cases [11]. Such approach can be called ex post, the assessment of effects after the event has occurred. Naturally, observation of disaster effects requires asking a question: how to counteract? Therefore, another trend emerged-ex ante: the development of certain economic mechanisms that would protect against possible future events. Thus, certain tools, such as estimation theory, prediction, or modeling tools, have found their application in the development of disaster economy. It was a response to the need employ certain solutions in fields of insurance, finance or non-material damage assessment [12,13,14,15]. This study is part of the ex ante trend, since it describes methods of predicting the risk of extreme phenomena. Disaster economy applies to wide range of effects that influence human existence and well-being. Extreme events that take place outside the areas of human existence are categorized as natural phenomena. Usually, the economy of extreme phenomena refers to urbanized areas where the effects of the phenomena are clearly observable. There are three types of related and potentially disastrous phenomena occurring in Central and Eastern Europe: flood, heavy rainfall, and drought. Their short-term and long-term effects affect urbanized areas the most [16,17,18], with large-scale floods having the biggest damaging potential. Human impact on the environment affects both long-term climate change, that include change in nature and frequency of rainfall, [19,20] and increase in exposure to potential hazards. An indispensable component of disaster economy is the idea of risk management [21,22]. It is a concept of risk minimization by assessing the hazard of events and estimating their potential effects. Basically, two risk management tools can be distinguished. The first one is limiting the vulnerability of urbanized areas by implementing proper development policies, legal regulations, infrastructure, creating social awareness, monitoring goods and resources. It is associated with the development of awareness of disasters and the wealth of societies. Low income and minority residents are more likely to move into high risk flood zones [23]. The other type of management is the assessment of extreme event hazard itself for a particular area. This component includes building instruments that allow to estimate the potential materialization of the hazard [24,25]. The interaction between the two components in terms of flood enable to define the term flood risk [26]. Obviously, risk (including flood risk) is directly related to understanding what a hazard is and what properties it has. It is impossible to estimate the risk without knowing the potential effects of its materialization. Studies on levels of vulnerability of regions to flooding focus on assessing ex-post damage, using a certain damage function. Whether or not these assessment methods are useful for predicting future damage is still being discussed. The latest studies indicate the usefulness of ex-post methods for predicting the size of material damage in various scenarios [27,28,29,30]. It is also impossible to estimate the risk without the knowledge of the possibility of its materialization. Therefore, risk can be regarded as a vector of related perceptible, quantifiable, measurable uncertainties (probability) and results of exposure to an event in material and non-material aspects. Thus, risk is composed of two closely related quantities: measure of damage and measure of probability [31]. Wherever it is possible to influence the probability, it is possible to limit the risk in its deterministic aspect: for instance through appropriate urbanizing policy [32]. Wherever the deterministic aspect is difficult to manipulate, the risk may be limited by influencing its random component [33]. However, in every case, a measurement and assessment of both risk components is necessary. Therefore, accurate assessment of probability and size of damage are basic tools in the economy of extreme phenomena. A natural disaster is rare and difficult to predict by nature, however it also seems to be inevitable. That is why risk management should not be a temporary solution but a long-term activity connected with exposure dynamics and vulnerability of areas to the risk.
The authors place their study in the ex ante trend of disaster economy. They focus on the aspect of predicting extreme phenomena. The study presents methods of measuring the probability of flood. A cross-border area between Poland and Germany has been analyzed, located in the middle section of the Oder River. In the 1990s this area witnessed flooding with catastrophic results. The area of central Oder River is interesting for two reasons:
- The course of the river is typical for this part of Europe, it is a flat area, highly urbanized in some parts, with high urbanizing pressure, the area is considered highly vulnerable and exposed to flood risk;
- There is a clear climatic trend observable in the area: occurrence of periodical drought with an increase in the intensity and frequency of heavy rainfall.
It is obvious that the mentioned phenomena directly translate into water levels, nature of high water, and time of water flow. Therefore, the authors agree that observing the water levels is a good touchstone for certain broader climate change. Therefore the main aim of the study is to present the method of quantification of uncertain events, such as high water. Following the probabilistic theory of extreme values, the authors will verify the following hypotheses:
Hypothesis 1 (H1).
The probability of extreme rainfall is described with a mathematical model with high data compatibility parameters.
Hypothesis 2 (H2).
Both the scale and nature of flood risk significantly change in the studied period.
Hypothesis 3 (H3).
Over the past 15 years, a decrease in the flood risk in the middle section of the Oder has been observed.
2. Materials and Methods
2.1. Theoretical Background
In this study the authors focus on presenting tools to assess the probability of extreme water levels of the Oder River on three measurement points in its middle cross-border course. In the mathematical aspect, levels exceeding certain critical values correspond to a description of the highest mean between n points distributed randomly on an interval of a straight line with a set length of l, proposed by Nicolas Bernoulli [34]. In terms of the analysis of water levels, it is the highest (averaged at a certain time interval) deviation from the reference value. Such observations will be called extreme values. Accepting certain assumptions about the statistical distribution of the analyzed phenomenon it is possible to specify the values of parameters of extreme statistical distribution [35,36]. Rapid development of science, economics, medicine, insurance, banking, and engineering has quickly utilized the advantages of using probabilistic models in describing the frequency of extreme phenomena [34,37]. Using the distribution of extrema to analyze water levels in rivers was advocated by [38,39]. Rapid development of this branch of probability theory coincides with growing interest in climate change and the assessment of its possible effects: in the form of floods [17,40,41,42,43,44,45,46,47], and their connection with heavy rainfall [48,49]. The role of extreme values in disaster economy, in the ex ante trend, has hardened in the context of assessing probabilities in financial and insurance businesses: [50,51,52,53,54,55,56,57,58].
2.2. Method
The concept of theory of extreme values studies the distances of certain groups of elements in a number set from the set threshold values. This structure us not too complicated, yet it perfectly works in the observation of of random events in the environment. The events are measurable (for example water level) and it occurs with a regularity, a frequency. In stochastic processes such structure is called random variable. According to Bernoulli’s concept, the number set is an n-element expression of the variable, a set of observed water levels. In Bernoulli’s concept there are certain number sub-sets and among them there is a value representing the sub-set, it is its maximum. There are many ways to create sub-sets, however in the analyses of water levels they are observations grouped in equal time intervals. We are therefore dealing with a reduction of the entire set to its maximum values in sub-sets:
Definition 1.
Extreme values are values that occur with relatively low probability and have high influence on the behavior of other values in the series [59].
Assume that water level X1,…,Xn is a series of independent random events (i.i.d.) with a distribution described with a distribution function F(x), the set of observations will be the expression of these random variables. The measurements of water levels in the studied river are noted in certain time horizon, systematically and regularly. The maximum on this time horizon will be marked with a new variable:
Since the measurements are taken in three different locations, we shall mark j with an auxiliary symbol yj—for the observation of water level m in possible locations:
The basic issue addressed in the study is to determine the statistical distribution of maxima of water levels and estimate their parameters. Only such information is a useful tool for modeling flood risk in terms of disaster economy. Since studying water levels and relating them to a set level (threshold and warning in this case) corresponds to Bernoulli’s problem, we can use the Fisher and Tippett [35] theorem. If random variable Mn has a certain probability distribution, it is described with one of the three distribution functions given with a formula:
The proof of Fisher and Tippett theorem can be found in works by Embrechts et al. [50] and Mikosch [60]. The distribution functions are called boundary distribution functions for the distribution of extreme values. The family of these three distribution functions was presented by von Misess [61] in the form of a single family of distributions referred to as the generalized extreme value distribution (GEV), described by the following formula [50]:
For the purpose of application, a version of the generalized extreme value distribution is extended by a parameter of location μ and scale σ. For practical applications, parameterization of distribution function is made, based on Theorem 1. This operation allows for comparative analysis and interpretation of the observed extreme events.
Theorem 1.
If random variable X has distribution function F, then random variable (μ + σX) has distribution function [62].
According to the above theorem, after parameterization, the distribution function is transformed into distribution function , described with the following formula [35,50]:
In terms of statistics, parameter γ is called shape parameter (extreme value index: EVI). It specifies the asymptotic behavior of the distribution function of distribution. The higher its value, the thicker the right tail of distribution is. This characteristics immediately determines the characteristics of distribution of extreme phenomena. The other parameters may be translated into standard characteristics of distribution of probability:
- corresponds to mean value of distribution,
- corresponds to distribution median,
- is variance.
The subject literature proposes several methods for estimating GEV distribution parameters. This study uses a commonly applied maximum likelihood method [53,63,64]. The maximum likelihood method, along with the probability weighted moments [65] is one of the best and most commonly used methods of estimating GEV distribution parameters. The estimation of parameters requires defining the way to assign sub-sets of a given set of water level observations. A great deal of research based on the analysis of natural phenomena indicates that there are clear climate changes observed. From the stochastic point of view, it means that there are premises that the assumption of distributions being identical might not follow through. Such a situation opens up an interesting perspective of study: assessment of how distribution parameters change and, consequently, how probabilities change in individual time horizons. For the sake of this study, the authors have initially reviewed the data, analyzing various lengths of time series (meaning various sizes of sub-sets in Bernoulli’s concept). The analysis included positional statistics of distributions and frequency of occurrence of maxima. Two events have been assigned in each location and each sub-set: exceeding the warning level in a given location and exceeding the alarm level. The alarm level is an accepted water level depicting flood threat even with a minuscule increase of water levels. It depicts highly probable risk of flooding the infrastructure, land development and actual danger to human health and life. When the alarm level is exceeded, it leads to taking specific action in order to increase the protection or counteract the impact. On many occasions it is a reason to evacuate the population of the affected areas. Observing the alarm level is the basis for sounding the flood alarm. The warning level is a locally defined water level which usually results in careful monitoring of water levels, preparing possible preventive action and an information campaign for the possibly affected area. It can also be the grounds for declaring a state of hydrological threat. Every hydrometeorological agency in Europe sets two or three warning levels in measurement points. Remember that due to the varied shape of the river bed in each location, the threshold values are different. Sub-sets from which maximum values have been determined are called blocks, since they were determined in the study using Gumbel’s block maxima method. It is a method of selecting extreme values widely used in the extreme value theory. The method can be presented with the following steps:
- (1)
- An observation sample of random variable X with set size N is selected from the studied population. With study conducted by authors, the random variables were daily water levels on the Oder River in three measurement points located at the border between Poland and Germany.
- (2)
- In next step, the selected sample is divided into m blocks (series), with n observations each, i.e., nm = N. The division must be done in such way, so that j block contains consecutive observations for j = 1, …, m. For each of the three locations, the authors of the study selected three five-year periods. The values of maximum daily water levels were selected from 30-day periods. Therefore, each five-year period was composed of m = 60 blocks with n = 30 observations in each block (with 31-day months, one non-maximum observation was rejected).
- (3)
- Maximum observation was determined from each block, as expression of random variable Mn;j, which, according to Formula (2)has the following form:
Using the block maxima method, three series of observations of maximum water levels were obtained for three five-year periods being the expression of random variable series . The obtained data was used for estimating parameters of nine distribution functions for distributions of maximum water levels, depicting distributions of maximum values in three five-year periods for each studied location. Estimation yielded the estimator vector [18]. The economy of extreme phenomena is based on an ex ante assessment of flood risk. A random component of the flood risk is the possibility of certain hazard to materialize. Mathematically, it is expressed with a probability to exceed a certain level set a priori by the random variable.
Definition 2.
Flood risk is the potential damage resulting from exceeding the set critical water level un;p by random variable Mn
In theoretical considerations, the conventional level un;p is formally called p-quantile of the generalized extreme value distribution. The value of the quantile is obviously a function of parameters of the distribution function for the distribution of maximum values [66]. After all, it depends on the value of theoretical distribution function:
Therefore, the random component of flood risk depends on three components:
- distribution of GEV variable,
- length of n block,
- critical water level hcr.
Thus, the measure of probability is a certain function which can be expressed in the following way:
Definition 3.
where n is the number of days from which expressions of random variable Mn, are selected, andis the distribution function of the distribution of random variable Mn.
The probabilistic measure of flood risk levelis defined as a probability of exceeding the critical level hcrby random value Mn.
The measure may also be described with the formula:
Considering Equations (6) and (7), critical level hcr may be regarded as 1 − pcr quantile of distribution describing maximum daily water levels of n-days, and expressed as: . It is also possible to define the measure which allows to calculate the value of critical level hcr for critical probability level pcr. set a priori. Since is a quantile measure of risk level, it is defined as:
Definition 4.
The quantile measure of flood risk level is defined by 1 − pcr quantile of distribution of maximum daily water levels from n-day periods, being a critical level which will be exceeded with flood risk at pcr level, and it is calculated from the formula:
whereis the reverse distribution function of the generalized extreme value distribution of water levels, pcr is the probabilistic measure of flood risk, described by Equation (9), andis determined in Equation (7).
This way, an original probabilistic model of flood risk is obtained, which in authors’ intention is to be used to measure and assess the risk of flood-related damage hazard.
Definition 5.

The probabilistic model of flood risk based on distribution functionof the generalized maxima distribution of random variable depicting daily water levels, is expressed with the formulas:
and
RF is the measure of risk of maximum water level above level hcr (with set block length n and at a set critical level hkr), whereas RFQ is the measure of maximum water levels to be exceeded with set critical probability pcr. The aforementioned method can be presented in a form of the following steps describing the flood risk assessment algorithm (Table 1):
Table 1.
Methodological path of probabilistic quantification in analysis of flood risk.
3. Results
In this study, the authors use the problems of estimating maxima distribution parameters to analyze flood risk. Hydrological data from three measurement stations have been analyzed, the stations located in the middle part of the Oder river: Slubice/Frankfurt (Oder), Gozdowice, and Widuchowa. All three locations lie at the border between Poland and Germany so the analysis applies to flood risk in cross-border areas. The data used in the study comes from daily water levels in the listed locations from a period between 01 January 2004 and 31 December 2018. For the sake of a detailed analysis of flood risk and observation of certain trends, the data has been divided into three five-year periods. For each of the five-year periods, the block size in Gumbel’s block maxima method was 30 days. Therefore, 60-element sets of expression of random variable M30;j were acquired for each location. In the next step of the analysis, the data was presented in the form of an empirical distribution function and parameters for theoretical distribution functions of maxima were determined. In order to verify the compatibility of theoretical and empirical distribution functions, two compatibility tests were used: the Anderson-Darling test and the Kolmogorov-Smirnov test. The first test stands out from the rest in the sens that is exhibits higher sensitivity to compatibility of distributions in their tails. Its application for assessing the compatibility of models in the study is essential, since it is the distribution tails that define extreme phenomena. The other test was used as standard, reference method in this type of analyses, it is a non-parametric test and it is used in the study as an additional method which allows to compare the results with results of other analyses in other studies. The p-value of the Anderson-Darling compatibility tests was accepted as a measure of matching theoretical distributions to empirical data.
Using the probabilistic model of flood risk (11) based on critical water level hcr specific for each location, and a set length of n block, probabilities of damage were estimated. Two reference levels hcr were assumed: Alarm levels (SA) and warning levels (SO), applicable in three hydrological stations. Thus, for measurement point in Słubice SA = hcr = 410 cm, SO = hcr = 360 cm, in Gozdowice SA = hcr = 500 cm, SO = hcr = 440 cm, and in Widuchowa SA = hcr = 650 cm i SO = hcr = 630 cm. The graphs of the empirical distribution function for the distribution of maxima of random variable M30 were drawn according to procedure proposed by [67].
Table 2 presents estimation results of parameters of distribution function Gγμ,σ for distribution of maximum water level values in the studied locations for three periods (Period I: 2004–2008, Period II: 2009–2013 and Period III 2014–2018). The last two columns of the table p-values are presented for two compatibility tests (Anderson-Darling and Kolmogorov-Smirnov). The foundation for the probabilistic model of rainfall risk proposed by the authors is the theoretical distribution function for the distribution of maximum values Gγμ,σ. The p-value is the measure of matching the theoretical distribution function to the empirical distribution.
Table 2.
Estimator values for parameters of distribution functions Gγμ,σ along with compatibility test results.
When analyzing the p-value of the Anderson-Darling test for all distributions, it is clear that, for each location and period, the estimated theoretical distribution corresponds to the empirical distribution at any significance level α < 0.73. Such matching can be considered good and very good. In the case of Kolmogorov-Smirnov test, the value pv = 0.492 does not foredoom the usefulness of the model. Very high (close to 1) values of p-value in most cases prove that there is very good matching of the theoretical distribution proposed by authors to the empirical distribution of maxima, which successfully verifies study hypothesis H1. Figure 1, Figure 2 and Figure 3 present the course of the empirical distribution function against the theoretical distribution for three locations in period III: (2014–2018).
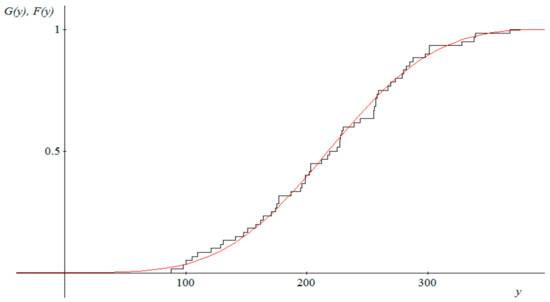
Figure 1.
Graph of empirical distribution function (black) for random variable M30 for period 2014–2018 in Słubice and graph of matched theoretical distribution function Gγμ,σ(y) (red). Source: Own study.
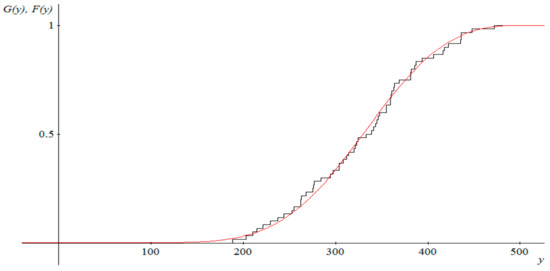
Figure 2.
Graph of empirical distribution function (black) for random variable M30 for period 2014–2018 in Gozdowice and graph of matched theoretical distribution function Gγμ,σ(y) (red). Source: Own study.
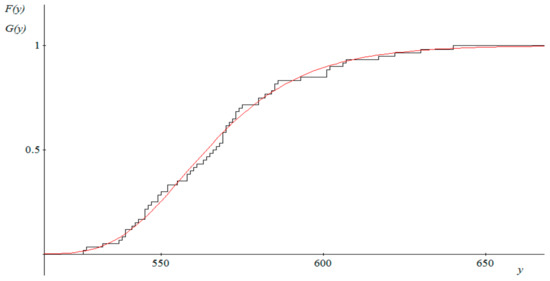
Figure 3.
Graph of empirical distribution function (black) for random variable M30 for period 2014–2018 in Widuchowa and graph of matched theoretical distribution function Gγμ,σ(y) (red). Source: Own study.
Table 2 presents the estimators of distribution functions for maximum distributions and calculated statistic values for maxima distributions. Similar trends occur for each location, concerning both water levels and the nature of observed phenomena. In terms of analysis of extremes, key parameter is the gamma parameter. In the statistical aspect [62] its values describe the properties of tails of initial variable distributions. Values above zero yield thick tails of reference variable distributions. Therefore, the share of extreme phenomena in the maxima group is relatively high, zero value yields thin tail, and values below zero yield cut distributions where certain extreme values are not observed while the lowest value have a high share (left tail). In most cases (excluding the point in Widuchowa) the gamma parameter is negative, which means the right tail is cut off. No extreme observations have been observed in empirical data. In fact, there was no flooding or high water throughout the entire period. It is also observable that the parameter increases against absolute value in subsequent periods, therefore the weight of the left tail grows in the distribution. It may mean that risk level has decreased (when positional statistics are the same) or that the center of distribution (µ) is moving towards higher extremes. This significantly increases the flood risk. The measurement point located in Słubice recorded clear changes in expected values over a course of 15 years. The highest value was reached between 2009 and 2014, along with additional increase in share of the right tail. This may unambiguously indicate a drop in flood risk and its lowest value in the entire studied period. Very similar phenomena are observed in the other two locations. Period II is characterized by high risk, and during period III risk reduction occurs along with certain stronger representation of the lowest values in the distribution of maxima. Therefore, the situation concerns the entire section of central Oder River.
Values of estimated parameters allow to draw a certain specific picture of flooding situation for each of the three locations:
- Słubice and Gozdowice: frequency of flood-related socio-economic damage is decreasing over the studied period of 15 years. There are however periods of increased risk. The probability of extreme phenomena is getting lower.
- Widuchowa: measurements and calculations obtained from the measurement point in the location indicate a clear increase in extreme value index in period two and decrease in period three to the level recorded in period one. This means that, based on the value of extreme value index, it is concluded that the frequency of adverse flooding phenomena in this location decreased over a period of fifteen years compared to the beginning of the study period.
The above estimates of frequency, scale and variability of events allow to observe certain regularities and unique characteristics of the analyzed phenomena. The resultant of the three factors generates specific values of probability of extreme phenomena. Therefore, there is a possibility to measure the probability of flood-related damage. The probability has been described with the formula (11). Again, two critical values have been accepted: alarm level (SAhcr) and warning level (SOhcr). Calculations of risk level are presented in Table 3. The color scale of levels allow to assess the risk level visually [68].
Table 3.
Risk measurements for each individual areas in periods I-III estimated based on the probabilistic model of flood risk.
The estimated values of probabilities formally confirm the description of model parameters. The probabilities of exceeding alarm levels are decreasing, however between 2009 and 2014 the risk of exceeding was high. The values of risk measure in three locations indicate that Slubice/Frankfurt (Oder) was the most exposed location to flooding. Note that in recent years the flood risk is insignificant in two locations. The warning levels are lower so probabilities are higher and correlated respectively (97%). In all three locations, period II was characterized by high probability of exceeding warning levels, while the years 2014–2018 witnessed moderate risk level. Figure 4 presents a graph with estimate results.
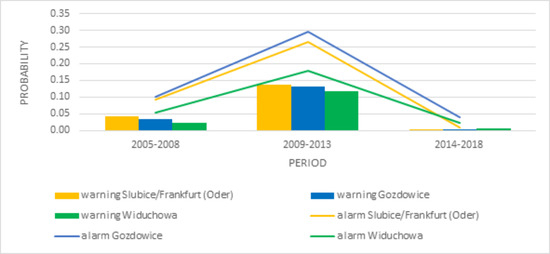
Figure 4.
Graph of probabilistic measures of rainfall risk in the studied locations between 2004 and 2018. Source: Own study.
4. Discussion
In this paper, the authors have proposed a universal mathematical tool for measuring flood risk. The presented measures are based on simulating the risk using a model developed with empirical data. The method described above is the statistical instrumentation that supports action taken to prevent future flooding incidents. Due to their predictive functionality, authorial methods of measuring and assessing flood risk become part of ex-ante sub-area of disaster economy. The authors present the application functions of the models using examples of three selected areas of the Oder river basin, located at the border between to central European countries. Nonetheless, it must be pointed out that the developed tools are universal by nature. The method can be successfully used to assess and measure risks in other regions of Europe and the world. The universal nature of the methods presented in the study results from having a multitude of parameters as well as from typical similarities in instances of water level rising, regardless of its location. The ability to set three parameters in the model makes it highly flexible and broadens its application spectrum. The authors also point out the utilitarian nature of the risk models. They can be used by flood protection agencies or urban policy planners. From the perspective of economic applicability, the presented probabilistic tools can be used to support the profit and loss analysis often used to assess the economic efficiency and usefulness of protective investments or flood-related protective projects. The models proposed by the authors also provide complement and support for the methodology of estimating potential flood-related damage. This feature of the models may be used by insurance companies and other financial institutions which are part of environmental risk transfer system. The authors also see some limitations in the presented models. The basic one is the limitation of constant access to hydrometrical and meteometrical data from areas where risk measurement is to be taken. Additionally, raw data only describe the behavior of water in the riverbed, yielding no knowledge of the scale of threat. Without additional quality information it is difficult to relate the estimated risk to time-related or space-related threat. The models only provide information of the possibility of disaster, giving no data of its scale or duration. Consequently, it is difficult to relate them to the financial aspect of the expected damage at this stage of study. Another limitation, immediately connected with the previous one, is the limited or inconsistent measurement network in some areas. It specifically relates to poorly developed areas or areas under-equipped with protective and measuring infrastructure. As the authors claim, another limitation may also result from the statistically advanced calculating algorithm and certain high-handedness in selecting models and data blocks for analysis. To some extent it excludes the automation of the measurement process, although at this stage of development of computer algorithms such factor seems less significant.
5. Conclusions
Theoretical study and discussion over disaster economy allowed to extend the knowledge of both the hazards and their results. The development of the discipline has also provided analytical tools to measure phenomena and assess their potential effect. What is unique about a natural disaster is that its occurrence is relatively rare but is accompanied by large-scale damage. Additionally, it is difficult to assess the risk of disaster, which includes a random and a deterministic component. Areas with significant exposure to risk (for instance, valleys with flooding rivers) increase their vulnerability and exposure to potential damage due to economic and urban development. This changes the deterministic component of the risk. On the other hand, we are witnessing climate changes that increase the probability of disasters or make them unpredictable. This changes the random component of the risk.
While it is difficult to expect that the development of regions stops, it can take place with consideration of disaster potentially happening. Therefore, preventive action can be taken in this field. The action will be based on experience taken from natural disasters that have already happened (ex post approach) or on an attempt to predict its occurrence in the future and its influence on the economic system (ex-ante). Such need makes empirical methods of quantification of extreme phenomena very useful. Mathematical tools allow one to estimate the possibility of occurrence of certain events, allowing the creation of a certain degree of protection against the effects of disasters and optimizing the economic growth of regions in terms of vulnerability and exposure to hazards. The main role in measuring the risk of disaster is played by the theory of distribution of extreme values. It describes a mathematical model of phenomena which deviate from the norm, phenomena which are extreme in nature and unique in scale. As the results in this article indicate, the models are doing a very good job at describing phenomena connected with flood hazard. The models also allow to observe the variability of risk over time. The analysis was spread over a cross-border area between Poland and Germany, in central Oder river valley. It may be assumed that this is a model example of phenomena in this part of Europe. The area was struck by a disastrous flood in the 1990s. Therefore, an interesting question occurs whether there are premises to think that such phenomenon may occur again in the foreseeable future. The application of GEV models allowed to draw interesting conclusions: flood risk within the last 5 years has been minimal, close to zero. The observed trend also shows that within the last 15 years there has been clear change in the distribution of water levels: the share of extreme phenomena is decreasing and there is also a certain decreasing trend for average water levels in general. Additionally, there is also decrease in uncertainty of measurement expressed with standard deviation. Does this mean that the flood risk in the Oder valley is declining? No, it is not. There are also periods of high probability. Therefore, new perspectives for study emerge: the assessment of water levels in a long time horizon and the assessment of long-term trends. Meteorological study in those areas indicate a relation between water levels and ever more frequent drought periods with a change in rainfall nature, which is also regarded as a disaster. it would therefore be possible to search for a model that connects all these phenomena into one concept of disaster risk. The third perspective of study, noted by the authors, is the assessment of flood risk in its deterministic component: potential damage. The study would allow to describe the risk model in these areas, based on events of 1997.
Author Contributions
Conceptualization, Ł.K. and M.N.; methodology, Ł.K. and M.N.; software, Ł.K.; validation, Ł.K. and M.N.; formal analysis, Ł.K. and M.N.; investigation, Ł.K. and M.N.; resources, M.N.; data curation, Ł.K. and M.N.; writing—original draft preparation, Ł.K. and M.N.; writing—review and editing, Ł.K., M.N. and H.W.; visualization, H.W.; supervision, Ł.K. and M.N.; project administration, Ł.K.; funding acquisition, Ł.K., M.N. and H.W. All authors have read and agreed to the published version of the manuscript.
Funding
This research received no external funding.
Conflicts of Interest
The authors declare no conflict of interest.
References
- Özerdem, A.; Barakat, S.; Pelling, M. The Macro-economic Impact of Disasters. Prog. Dev. Stud. 2002, 2, 283–305. [Google Scholar]
- Lindell, M.; Prater, C. Assessing Community Impacts of Natural Disasters. Nat. Hazards Rev. 2003, 4, 176–185. [Google Scholar] [CrossRef]
- Cochrane, H. Economic Loss: Myth and Measurement. Disaster Prev. Manag. 2004, 13, 290–296. [Google Scholar] [CrossRef]
- Raddatz, C. The Wrath of God: Macroeconomic Costs of Natural Disasters; World Bank Policy Research Working Paper; The World Bank: Washington, DC, USA, 2009. [Google Scholar]
- Jonkman, S.N.; Bočkarjova, M.; Kok, M.; Bernardini, P. Integrated hydrodynamic and economic modelling of flood damage in the Netherlands. Ecol. Econ. 2008, 66, 77–90. [Google Scholar] [CrossRef]
- Kunreuther, H.; Fiore, E.S. The Alaskan Earthquake: A Case Study in the Economics of Disaster; Report; Institute for Defense Analyses Alexandria VA Economic and Political Studies Division: Alexandria, VA, USA, 1966; Available online: https://apps.dtic.mil/sti/citations/AD0645536 (accessed on 15 July 2020).
- William, B. The Economics of Natural and Unnatural Disasters; WE Upjohn Institute: Kalamazoo, MI, USA, 2010. [Google Scholar]
- Goshay, R.C.; Dacy, D.C.; Kunreuther, H. The Economics of Natural Disasters: Implications for Federal Policy. J. Risk Insur. 1970, 37, 664. [Google Scholar] [CrossRef]
- U.S. Task Force on Federal Flood Control Policy. A Unified National Program for Managing Flood Losses; House Document 465; U.S. Government Printing Office: Washington, DC, USA, 1966.
- Solkin, A.L. Economic Aspects of Natural Hazards; Lexington Books: Lexington, KY, USA, 1982. [Google Scholar]
- Albala-Bertrand, J.M. Political Economy of Large Natural Disasters: With Special Reference to Developing Countries; Oxford University Press: Oxford, UK, 1993. [Google Scholar]
- National Research Council. The Impacts of Natural Disasters a Framework for Loss Estimation; National Academy of Sciences Press: Washington, DC, USA, 1999. [Google Scholar]
- United Nations Handbook for Estimating the Socio-Economic and Environmental Effects of Disasters; United Nations Publications: New York, NY, USA, 2003.
- Kniesner, T.J.; Viscusi, W.K. The Value of a Statistical Life. SSRN Electron. J. 2019. [Google Scholar] [CrossRef]
- Benson, C.; Clay, E. Understanding the Economic and Financial Impacts of Natural Disasters; World Bank Publications: Washington, DC, USA, 2004. [Google Scholar]
- Utsumi, N.; Seto, S.; Kanae, S.; Maeda, E.E.; Oki, T. Does higher surface temperature intensify extreme precipitation? Geophys. Res. Lett. 2011, 38, L16708. [Google Scholar] [CrossRef]
- Shen, H.; Bryson, M.; Ochoa, I. Effect of tail behavior assumptions on flood. Water Resour. Res. 1980, 16, 361–364. [Google Scholar] [CrossRef]
- Prescoot, P.; Walden, A. Maximum likelihood estimation of the parameters of the generalized extreme—Value distribution. Biometrika 1980, 67, 723–724. [Google Scholar] [CrossRef]
- Gregersen, I.B.; Sørup, H.J.D.; Madsen, H.; Rosbjerg, D.; Mikkelsen, P.S.; Arnbjerg-Nielsen, K. Assessing future climatic changes of rainfall extremes at small spatio-temporal scales. Clim. Chang. 2013, 118, 783–797. [Google Scholar] [CrossRef]
- Mogollón, B.; Frimpong, E.A.; Hoegh, A.B.; Angermeier, P.L. Recent changes in stream flashiness and flooding, and effects of flood management in North Carolina and Virginia. J. Am. Water Resour. Assoc. 2016, 52, 561–577. [Google Scholar] [CrossRef]
- Vaughan, E.J. Risk Management; John Willey and Sons: Hoboken, NJ, USA, 1997; ISBN-13: 978-0471107590. [Google Scholar]
- Grossi, P.; Kunreuther, H. Catastrophe Modeling: A New Approach to Managing Risk; Huebner International Series on Risk, Insurance and Economic Security; Springer: New York, NY, USA, 2005. [Google Scholar]
- Bakkensen, L.A.; Ma, L. Sorting over flood risk and implications for policy reform. J. Environ. Econ. Manag. 2020, 104, 102362. [Google Scholar] [CrossRef]
- Diakakis, M.; Damigos, D.; Kallioras, A. Identification of Patterns and Influential Factors on Civil Protection Personnel Opinions and Views on Different Aspects of Flood Risk Management: The Case of Greece. Sustainability 2020, 12, 5585. [Google Scholar] [CrossRef]
- Boudou, M.; Lang, M.; Vinet, F.; Cœur, D. Comparative hazard analysis of processes leading to remarkable flash floods (France, 1930–1999). J. Hydrol. 2016, 541, 533–552. [Google Scholar] [CrossRef]
- Dráb, A.; Riha, J. An approach to the implementation of European Directive 2007/60/EC on flood risk management in the Czech Republic. Nat. Hazards Earth Syst. Sci. 2010, 10, 1977. [Google Scholar] [CrossRef]
- Fuchs, S.; Heiser, M.; Schlögl, M.; Zischg, A.P.; Papathoma-Köhle, M.; Keiler, M. Short communication: A model to predict flood loss in mountain areas. Environ. Model. Softw. 2019, 117, 176–180. [Google Scholar] [CrossRef]
- Di Baldassarre, G.; Nohrstedt, D.; Mård, J.; Burchardt, S.; Albin, C.; Bondesson, S.; Breinl, K.; Deegan, F.M.; Fuentes, D.; Lopez, M.G.; et al. An Integrative Research Framework to Unravel the Interplay of Natural Hazards and Vulnerabilities. Earth’s Future 2018, 6, 305–310. [Google Scholar] [CrossRef]
- Chow, C.; Andrášik, R.; Fischer, B.; Keiler, M. Application of statistical techniques to proportional loss data: Evaluating the predictive accuracy of physical vulnerability to hazardous hydro-meteorological events. J. Environ. Manag. 2019, 246, 85–100. [Google Scholar] [CrossRef]
- Carisi, F.; Schröter, K.; Domeneghetti, A.; Kreibich, H.; Castellarin, A. Development and assessment of uni- and multivariable flood loss models for Emilia-Romagna (Italy). Nat. Hazards Earth Syst. Sci. 2018, 18, 2057–2079. [Google Scholar] [CrossRef]
- Wisner, B.; Blaikie, P.; Cannon, T.; Davis, I. At Risk: Natural Hazards, People’s Vulnerability and Disasters; Routledge Taylor & Francis Group: New York, NY, USA, 2003; Volume 2. [Google Scholar]
- Stéphane, H. Strategies to adapt to an uncertain climate change. Glob. Environ. Change 2009, 19, 240–247. [Google Scholar]
- Mabey, N.; Gulledge, J.; Finel, B.; Silverthorne, K. Degrees of Risk: Defining a Risk Management Framework for Climate Security; Third Generation Environmentalism Ltd.: London, UK, 2011; pp. 50–68. Available online: http://lib.riskreductionafrica.org/bitstream/handle/123456789/961/degrees%20of%20risk.pdf?sequence=1 (accessed on 15 July 2020).
- Gumbel, J. Statistics of Extremes; Columbia University Press: New York, NY, USA, 1958. [Google Scholar]
- Tippett, L.H.C.; Fisher, R.A. Limiting forms of the frequency distribution of the largest or smallest member of a sample. Proc. Camb. Phil. Soc. 1928, 24, 180–190. [Google Scholar]
- Frechet, M. Sur la loi de probabilite de lecart maximum. Ann. Soc. Math. Polon. 1927, 6, 93–116. [Google Scholar]
- Rantz, S.; Riggs, H. Magnitude and Frequency of Floods in the Columbia River Basin; Water Supply Paper; United States Government Printing Office: Washington, DC, USA, 1949; Volume 1080, pp. 317–476.
- Potter, W. Normalcy Tests of Precipitation and Frequency Studies of Runoff on Small Watersheds; Technical Bulletin; U.S. Department of Agriculture: Washington, DC, USA, 1949; pp. 2–35.
- Gumbel, E. The return period of flood flaws. Ann. Math. Stat. 1941, 12, 163–190. [Google Scholar] [CrossRef]
- Greis, N.; Wood, E. Regional flood frequency estimation and network design. Water Resour. Res. 1981, 17, 1167–1177. [Google Scholar] [CrossRef]
- Pericchi, L.; Rodriguez-Iturbe, I. On statistical analysis of floods. In A Celebration of Statistics; Atkinson, A.C., Fienberg, S.E., Eds.; The ISI Centenary Volume; Springer: New York, NY, USA, 1985; pp. 511–541. [Google Scholar]
- Beran, M.; Hoskin, J.; Arnell, N. Comment on Two–component extreme value distribution for flood frequency analysis by Fabio Rossi, Mauro Fiorentino, Pasquale Versace. Water Resour. Res. 1986, 22, 263–266. [Google Scholar] [CrossRef]
- Rossi, F.; Fiorentino, M.; Versace, P. Two–component extreme value distribuition for flood frequency analysis. Water Resour. Res. 1986, 22, 1551–1564. [Google Scholar] [CrossRef]
- Smith, K.; Ward, R. Flood-Physical Processes and Human Impacts; John Wiley & Sons: Chichester, UK, 1998. [Google Scholar]
- Jain, D.; Singh, V. Estimating parameters of EV1 distribution for flood frequency analysis. Water Resour. Res. 1987, 23, 59–71. [Google Scholar]
- Wallis, J. Risk and uncertainties in the evaluation of flood events for the design of hydraulic structures. In Piene e Siccita; Fondazione Politecnica del Mediterraneo: Catania, Italy, 1980; pp. 3–36. [Google Scholar]
- Hipel, K. Extreme Values: Floods and Droughts; Kluwer: Dordrecht, The Netherlands, 1994. [Google Scholar]
- Rasheed, H.; Aldabagh, A.; Ramamoorthy, M. Rainfall analysis by power transformation. J. Climate Appl. Meteorol. 1983, 22, 1411–1415. [Google Scholar] [CrossRef]
- Lettenmaier, D.; Wallis, J.; Wood, E. Effect of regional heterogenity on flood frequency estimation. Water Resour. Res. 1987, 23, 313–323. [Google Scholar] [CrossRef]
- Embrechts, P.; Kluppelberg, C.; Mikosch, T. Modelling Extremal Events for Insurance and Finance; Springer: Berlin, Germany, 1997. [Google Scholar]
- Beltrán, A.; Maddison, D.; Elliott, R. The impact of flooding on property prices: A repeat-sales approach. J. Environ. Econ. Manag. 2019, 95, 62–86. [Google Scholar] [CrossRef]
- Kousky, C.; Michel-Kerjan, E.O.; Raschky, P.A. Does federal disaster assistance crowd out flood insurance? J. Environ. Econ. Manag. 2018, 87, 150–164. [Google Scholar] [CrossRef]
- Hisdal, H.; Frigessi, A. Practical Extreme Value Modelling of Hydrological Floods and Droughts: A Case Study. Extremes 2004, 7, 5–30. [Google Scholar] [CrossRef]
- Wang, Y. Numerical Improvements for Large-Scale Flood Simulation. Ph.D. Thesis, Newcastle University, Newcastele, UK, 2011. [Google Scholar]
- Aerts, J.C.J.H.; Lin, N.; Botzen, W.; Emanuel, K.; de Moel, H. Low-Probability Flood Risk Modeling for New York City. Risk Anal. 2013, 33, 772–788. [Google Scholar] [CrossRef] [PubMed]
- Apel, H.; Aronica, G.T.; Kreibich, H.; Thieken, A.H. Flood risk analysis-how detailed do we need to be? Nat. Hazards 2009, 49, 79–98. [Google Scholar] [CrossRef]
- Beirlant, J.; Teugels, J.; Vynckier, P. Practical Analysis of Extreme Values; Leuven University Press: Leuven, Belgium, 1999. [Google Scholar]
- Gencay, R.; Selcuk, F.; Ulugulyagci, A. High volatility, thick tails and estreme value theory in value-at-risk estimation. Insur. Math. Econ. 2003, 33, 337–356. [Google Scholar] [CrossRef]
- Fałdziński, M. Teoria Wartości Ekstremlanych w Ekonometrii Finansowej; Wydawnictwo Naukowe Uniwersytetu Mikołaja Kopernika: Toruń, Poland, 2014. [Google Scholar]
- Mikosch, T. Regular Variation, Subexponentiality and Their Applications in Probability Theory; EURANDOM Reports; Eindhoven University of Technology: Eindhoven, The Netherlands, 1999. [Google Scholar]
- Von Mises, R. La distribution de la plus grande de n valeures. Rev. Math. Union Interbalcanique 1936, 1, 141–160. [Google Scholar]
- Thomas, M.; Reiss, R. Statistical Analysis of Extreme Value with Applications to Insurance, Finance, Hydrology and Other Fields; Birkhauser: Berlin, Germany, 2007. [Google Scholar]
- Kotz, S.; Nadarajah, S. Extreme Value Distributions. Theory and Applications; Imperial College Press: London, UK, 2005. [Google Scholar]
- Hosking, J. Maximum-Likelihood Estimation of the Parameter of the Generalized Extreme-Value Distribution. Appl. Stat. 1985, 34, 301–310. [Google Scholar] [CrossRef]
- Smith, R. Maximum Likelihood Estimation in a Class of Nonregular Cases. Biometrika 1985, 72, 67–90. [Google Scholar] [CrossRef]
- Beirlant, J.; Matthys, G. Extreme Quantile Estimation for Heavy-Tailed Distributions. ID=453055854. 2001. Available online: http://www.gloriamundi.org/detailpopup.asp? (accessed on 12 September 2020).
- McNeil, A. Calculating Quantile Risk Measures for Financial Time Series Using Extreme Value Theory; ETH: Zurich, Switzerland, 1998. [Google Scholar]
- Kuźmiński, Ł. Modele Probabilistycznego Pomiaru i Oceny Ryzyka Powodziowego na Przykładzie Dorzecza Śrokowej Odry; Wydawnictwo Uniwersytetu Ekonomicznego we Wrocławiu: Wrocław, Poland, 2018. [Google Scholar]


Publisher’s Note: MDPI stays neutral with regard to jurisdictional claims in published maps and institutional affiliations. |
© 2020 by the authors. Licensee MDPI, Basel, Switzerland. This article is an open access article distributed under the terms and conditions of the Creative Commons Attribution (CC BY) license (http://creativecommons.org/licenses/by/4.0/).