Building and Urban Cooling Performance Indexes of Wetted and Green Roofs—A Case Study under Current and Future Climates


Abstract
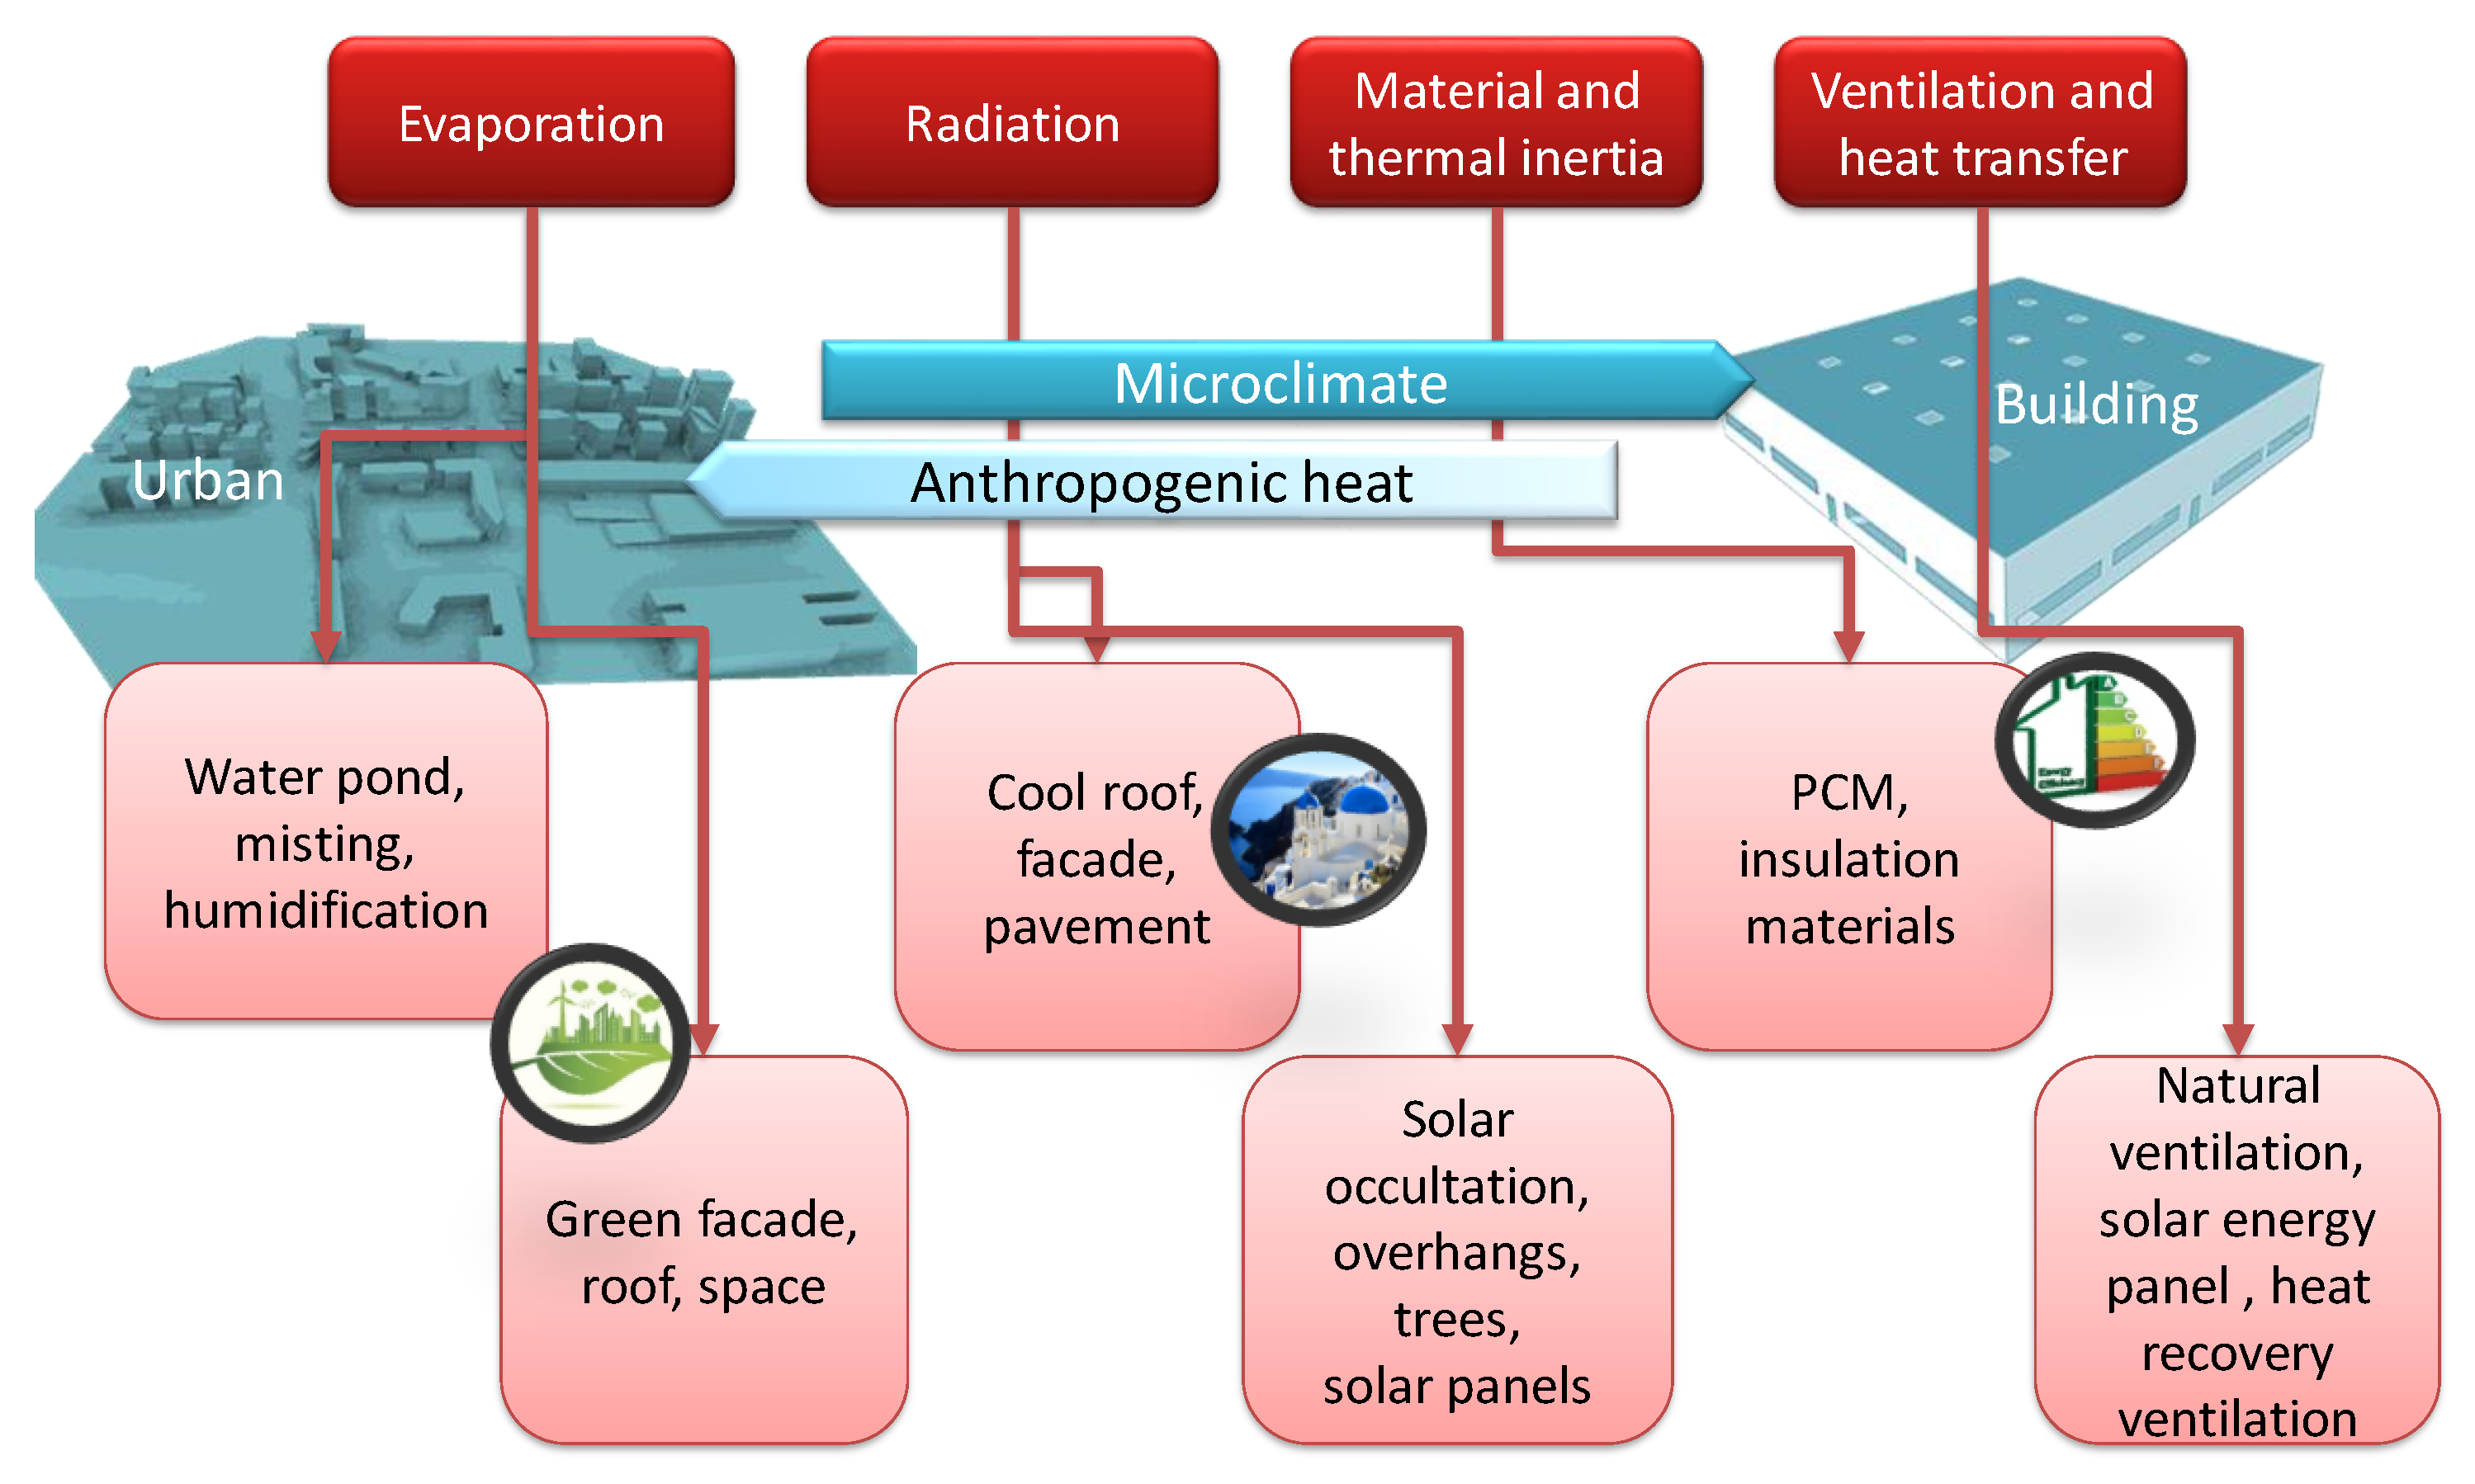
:1. Introduction
2. Methodology
2.1. Description of the Building Model
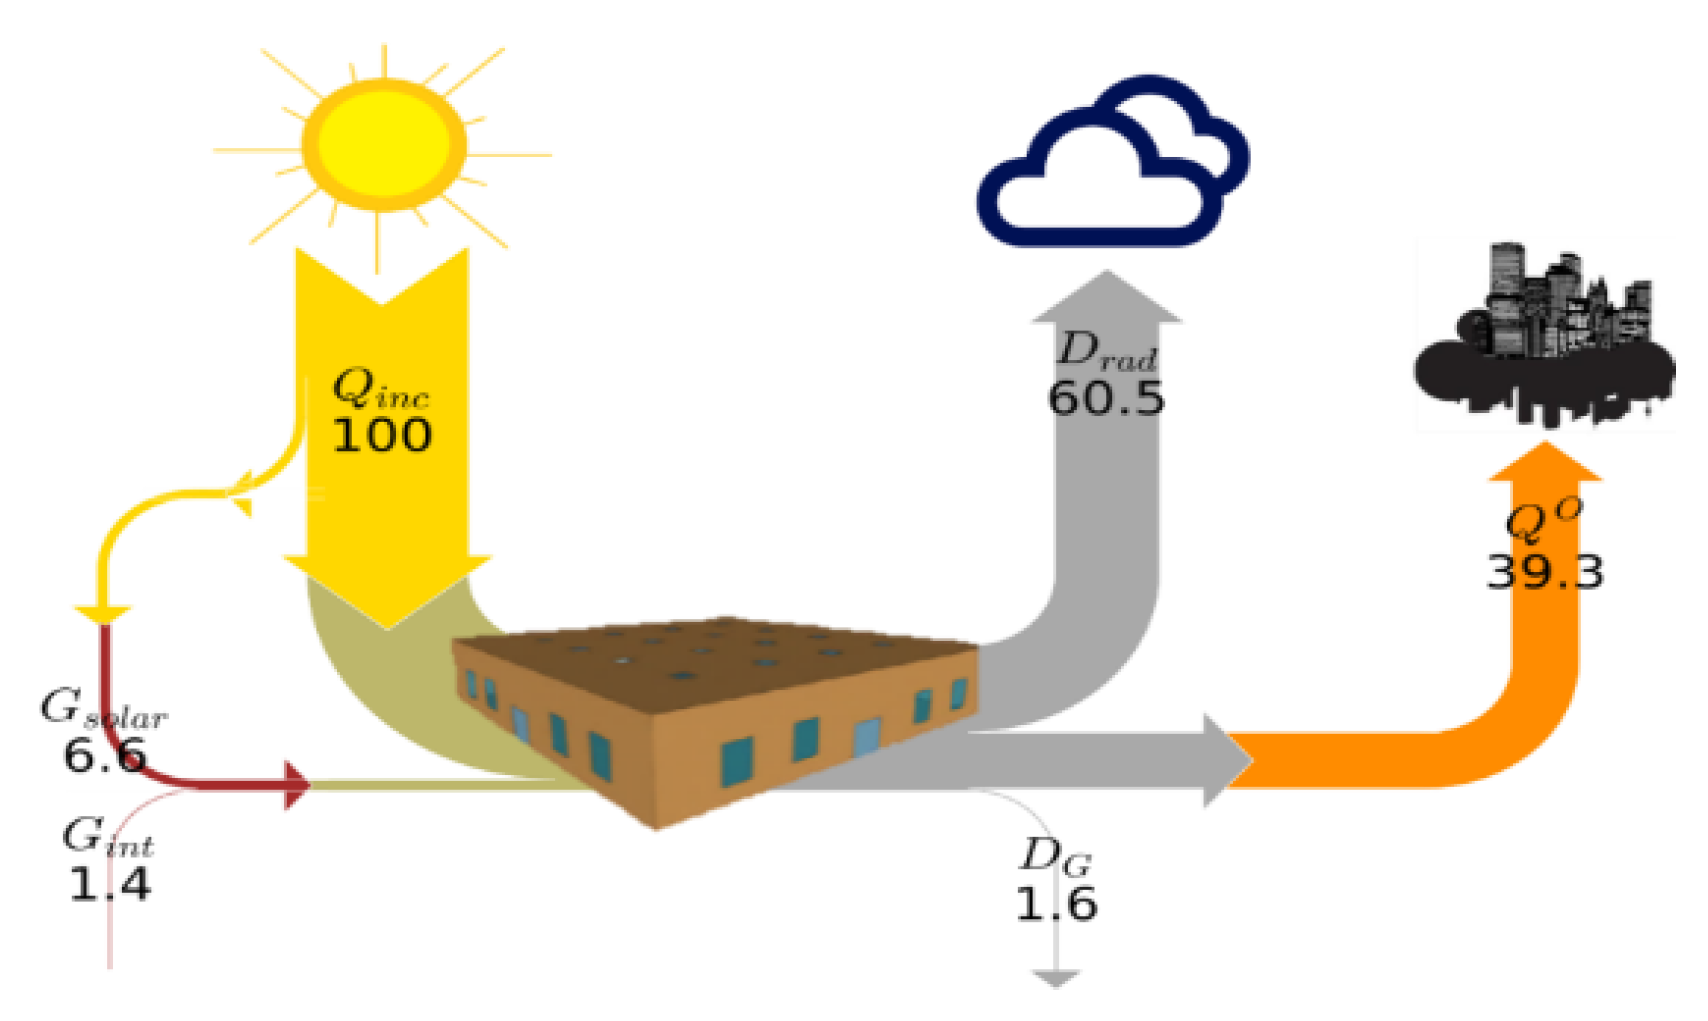
2.2. Sankey Diagram of the Heat Quantities and Cooling Performance Indexes
- -
- Cooling efficiency for the indoor environment (): mitigation potential of thermal discomfort during the cooling season. The cooling season is the period in which the building presents cooling needs and may vary according to the climate and the passive solution implemented. For the reference building in Marseille, the cooling season represents 59% of the year. This efficiency is computed only for the occupied periods and based on the degree-hours (DH) according to the adaptive thermal comfort standard EN15251 [23] limits;
- -
- Cooling efficiency of the external environment (): UHI mitigation potential during the cooling season;
- -
- Energy efficiency (ηCEP): energy consumption benefits for the full year, including the heating system. This is especially important when studying the impacts of a passive cooling solution on heating needs in moderate climatic areas. It is based on the primary energy consumption CEP.
2.3. Wetted Roof Model
2.4. Green Roof Model
3. Results
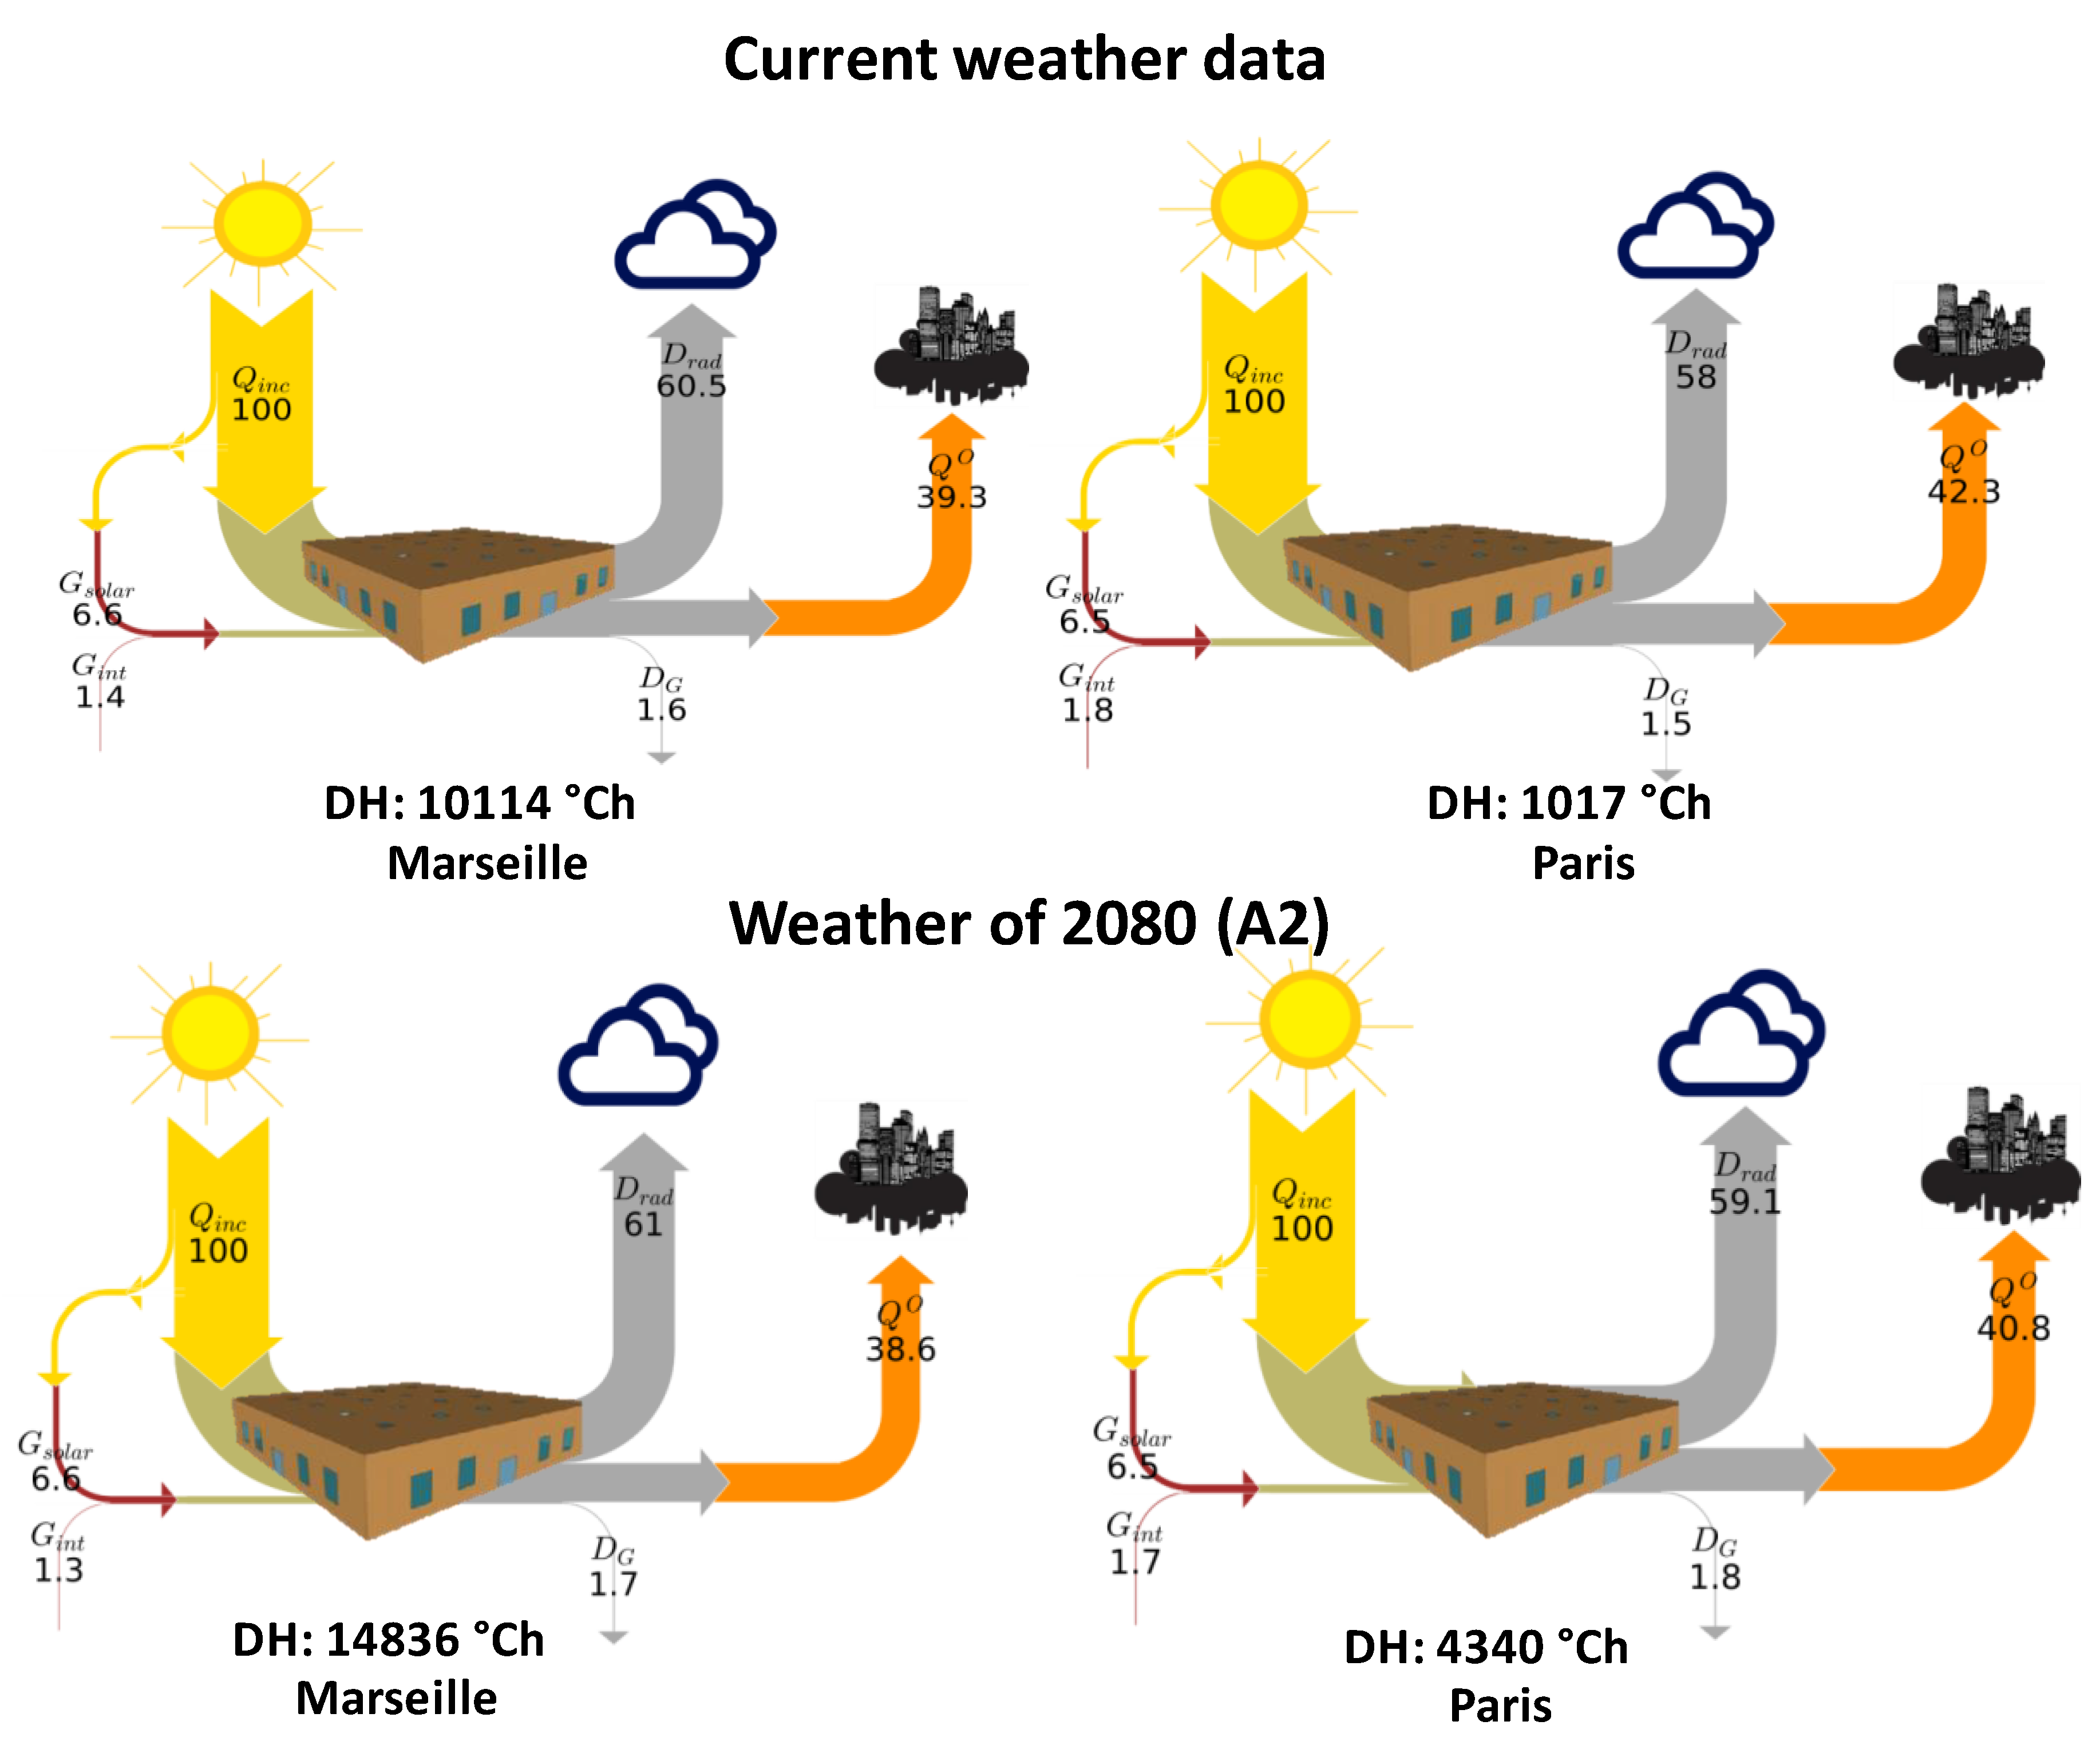
3.1. Simulation Results of the Reference Building—Current and Future Climates
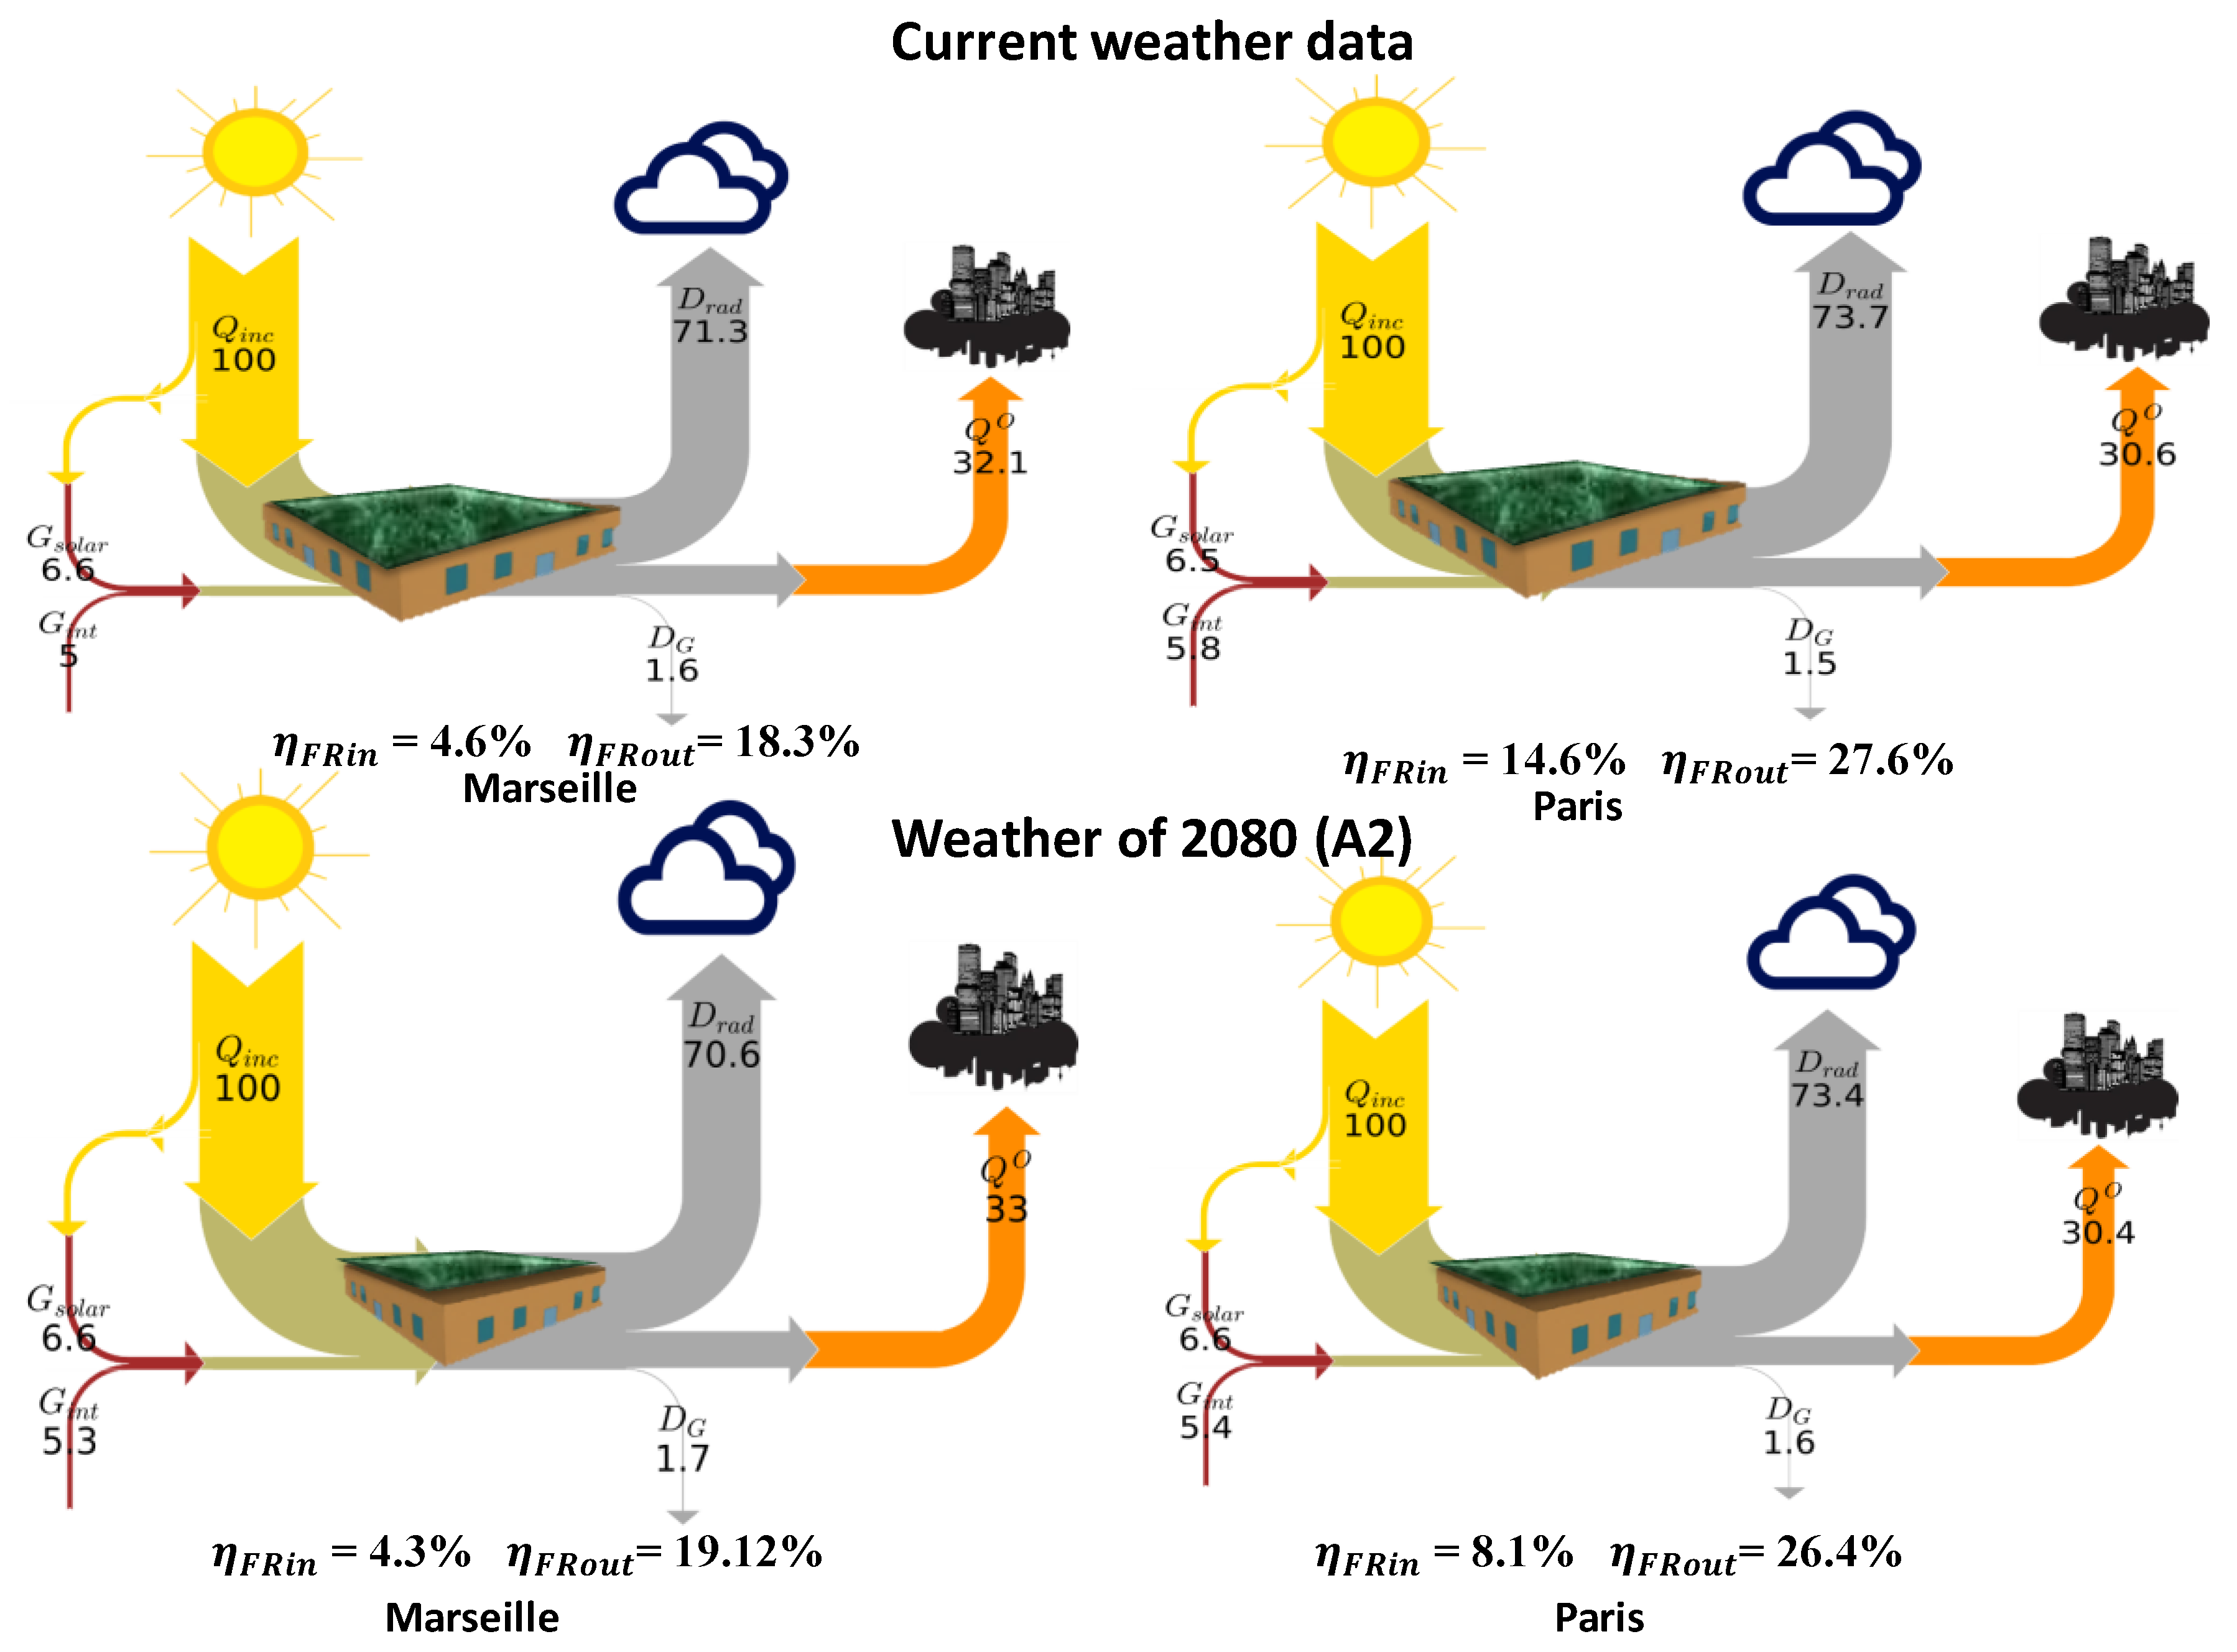
3.2. Impacts of Green Roof
3.2.1. Comparison of Current and Future Climates
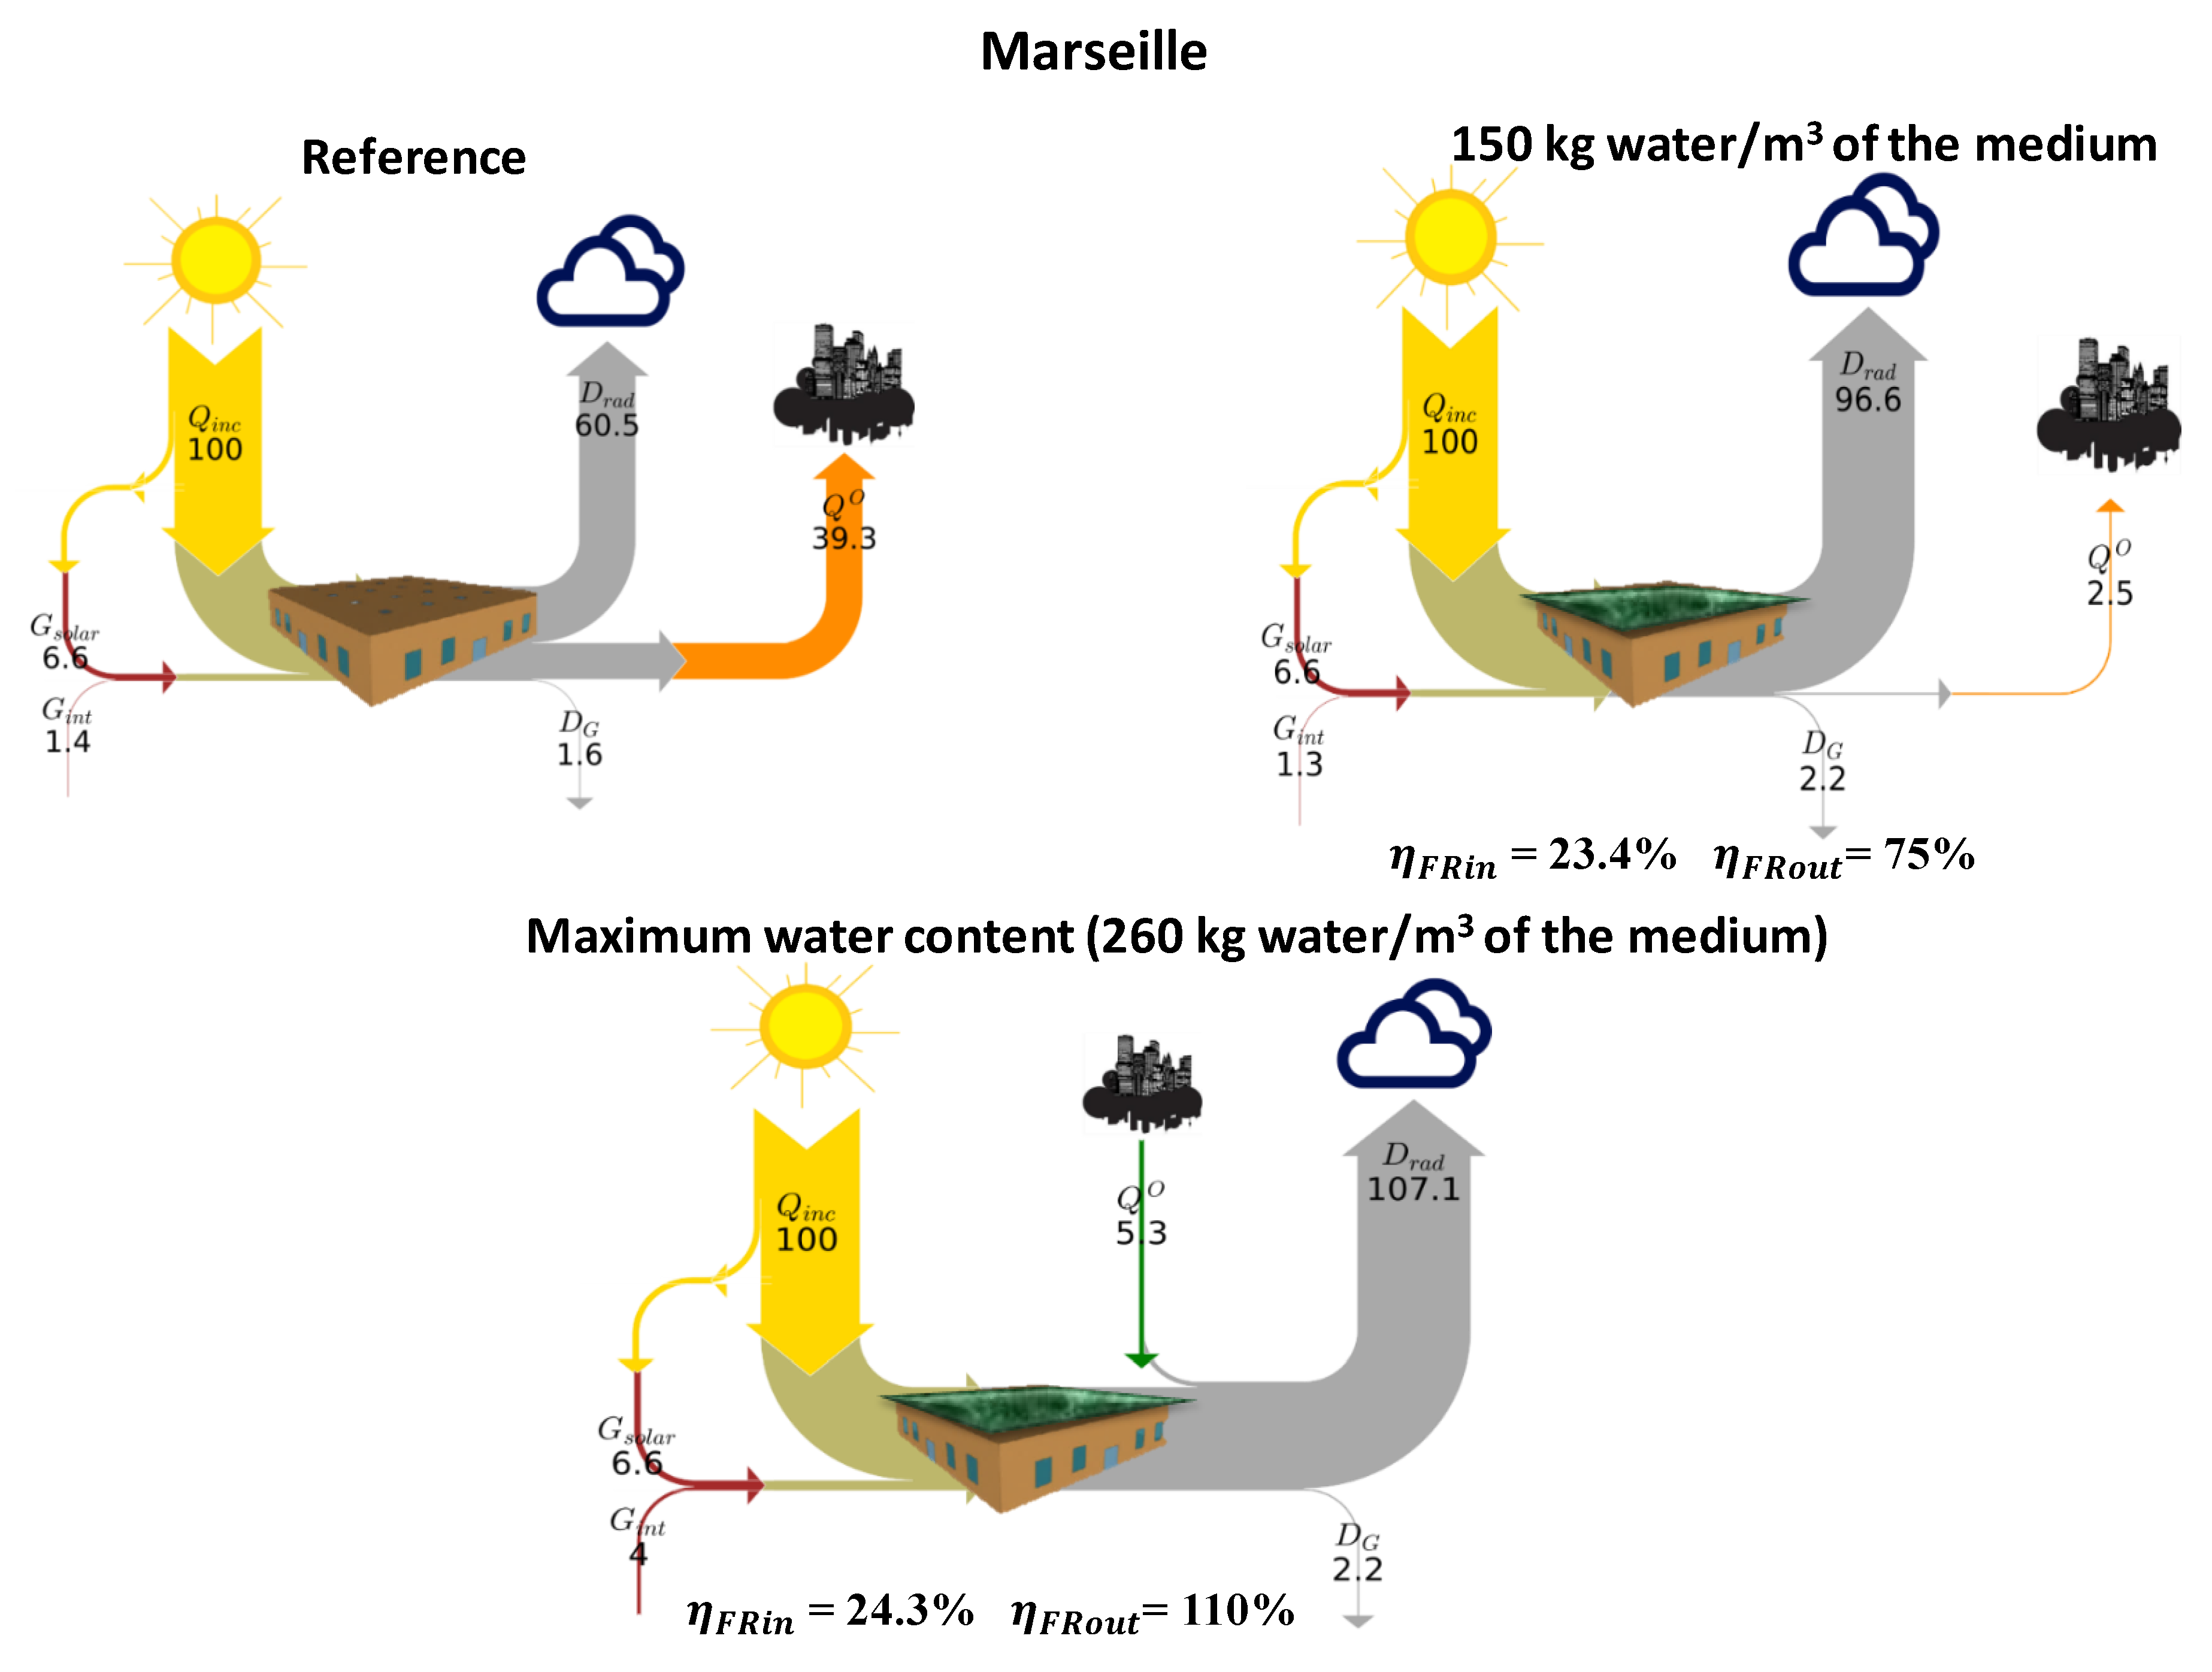
3.2.2. Watering Effect on Green Roof Performances
3.2.3. Impacts of Roof Insulation on Green Roof Performances
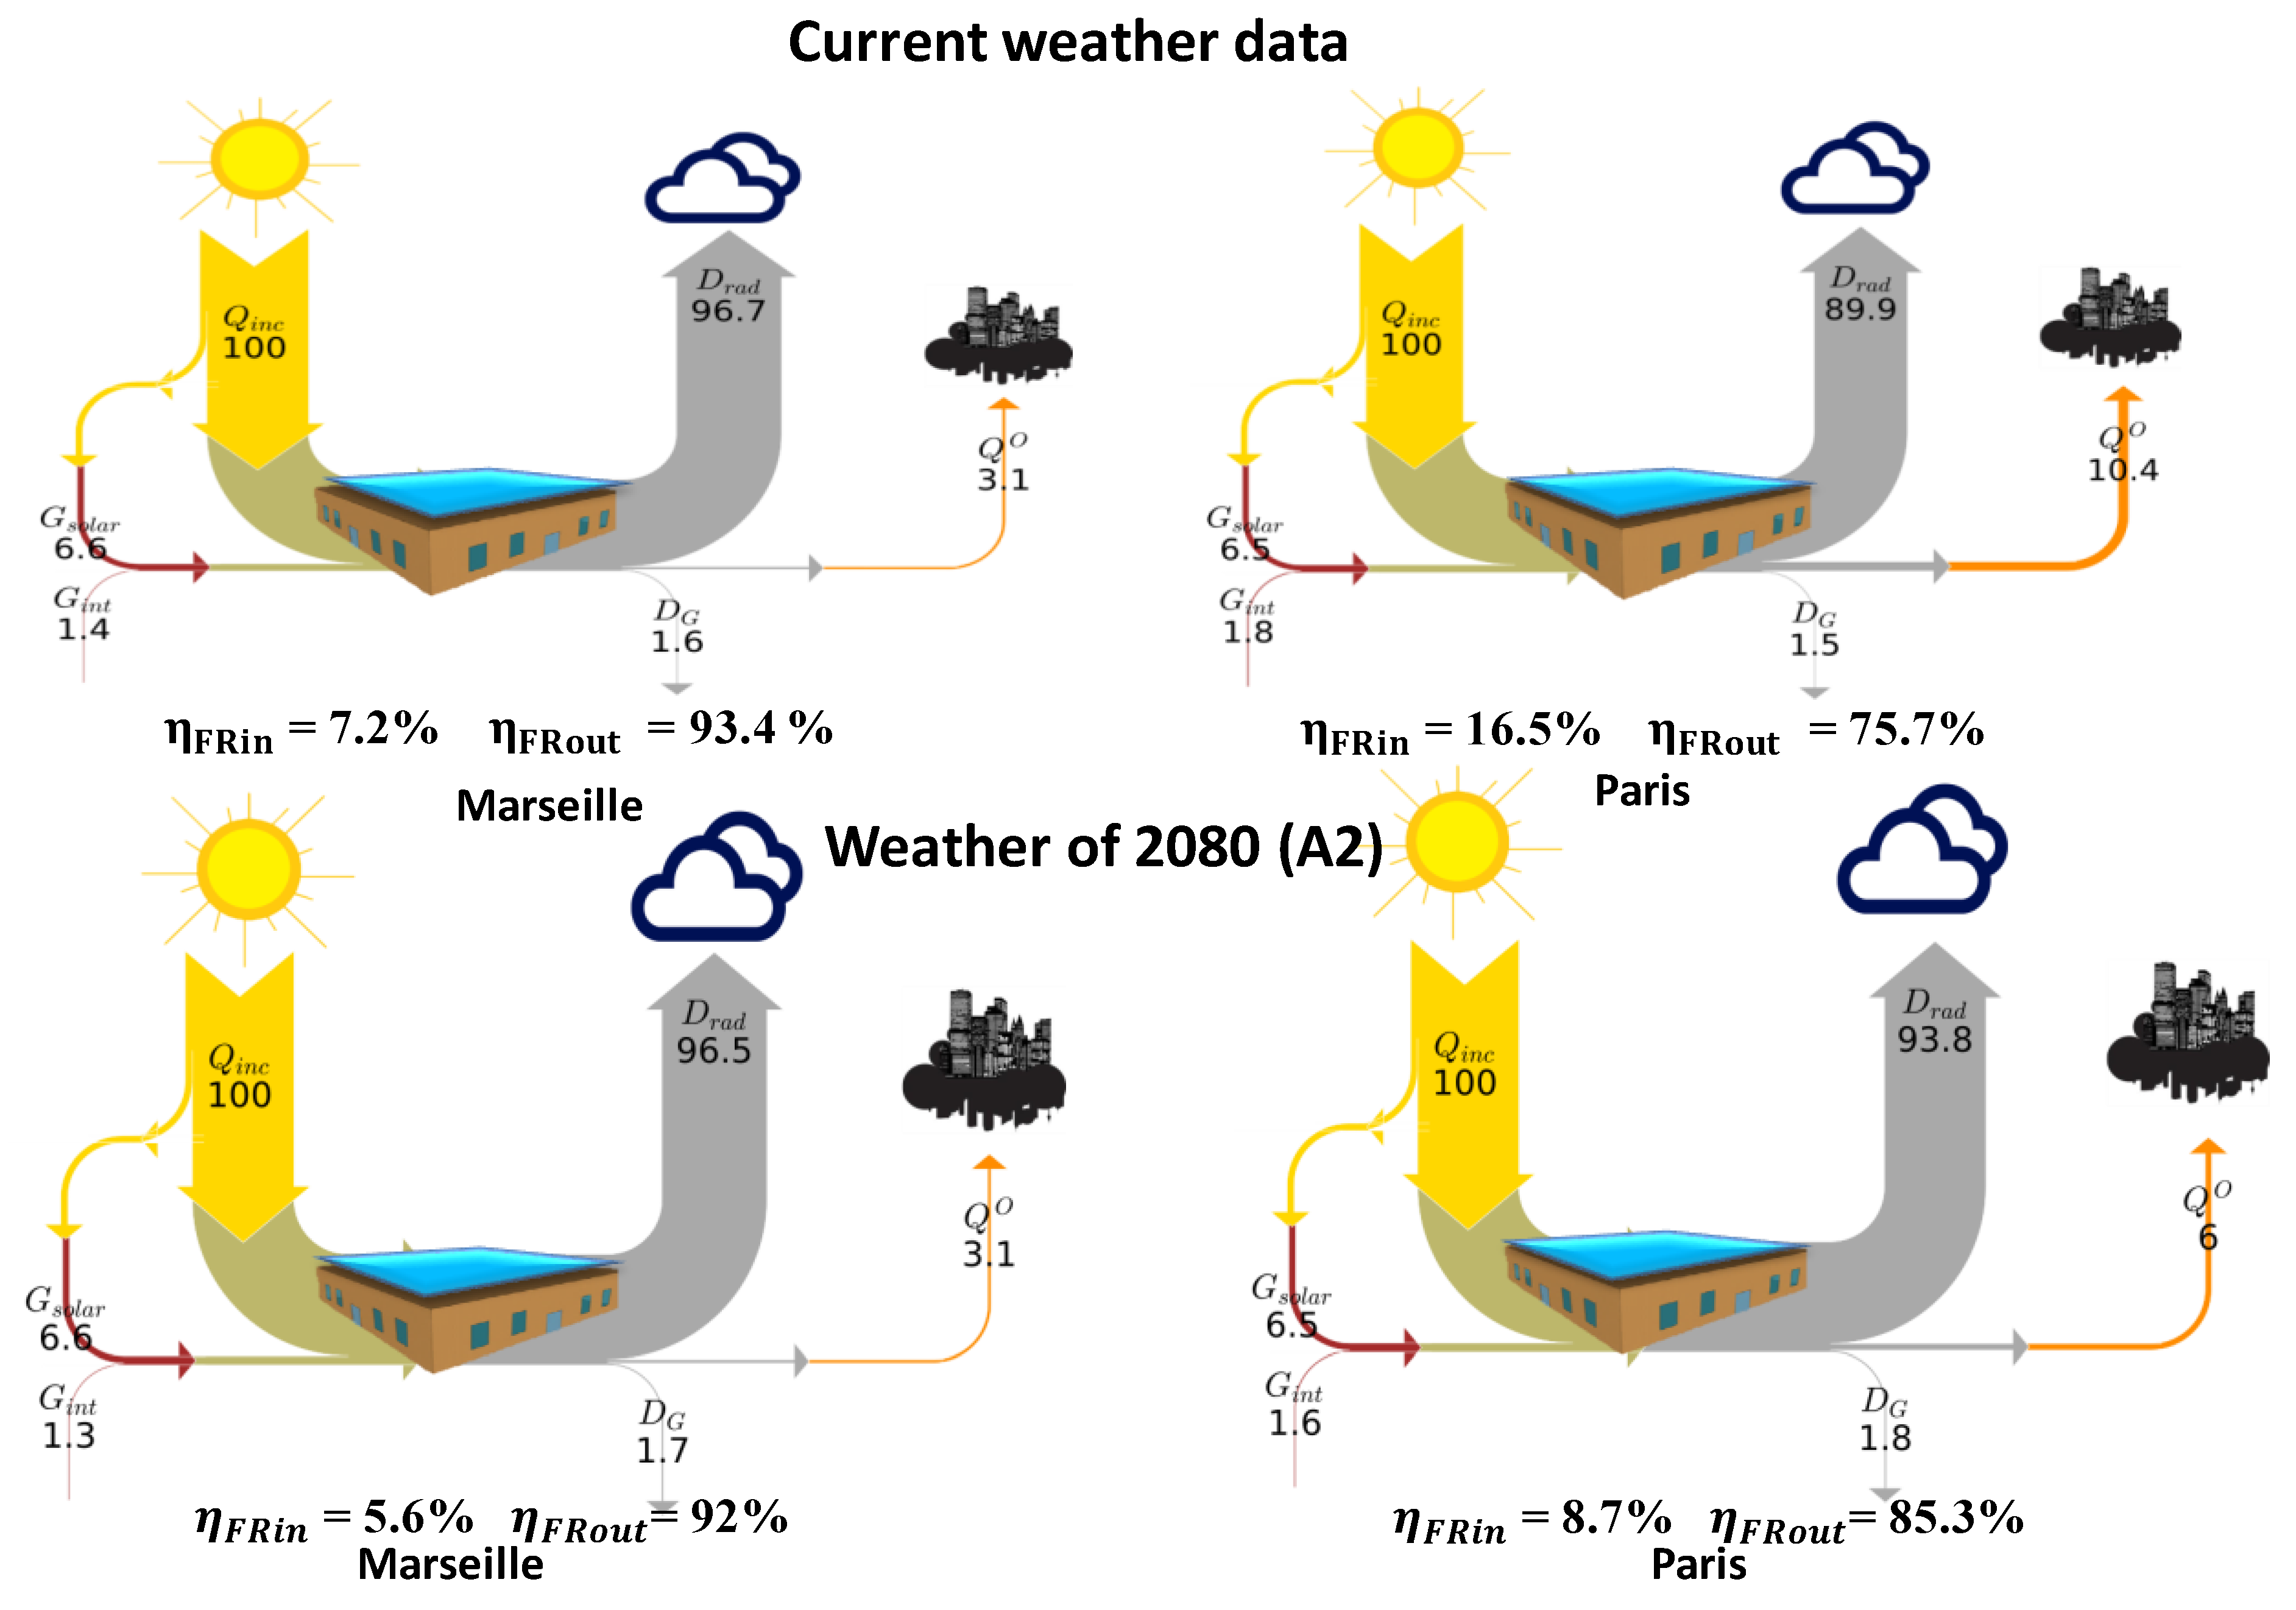
3.3. Impacts of Wetted Roof
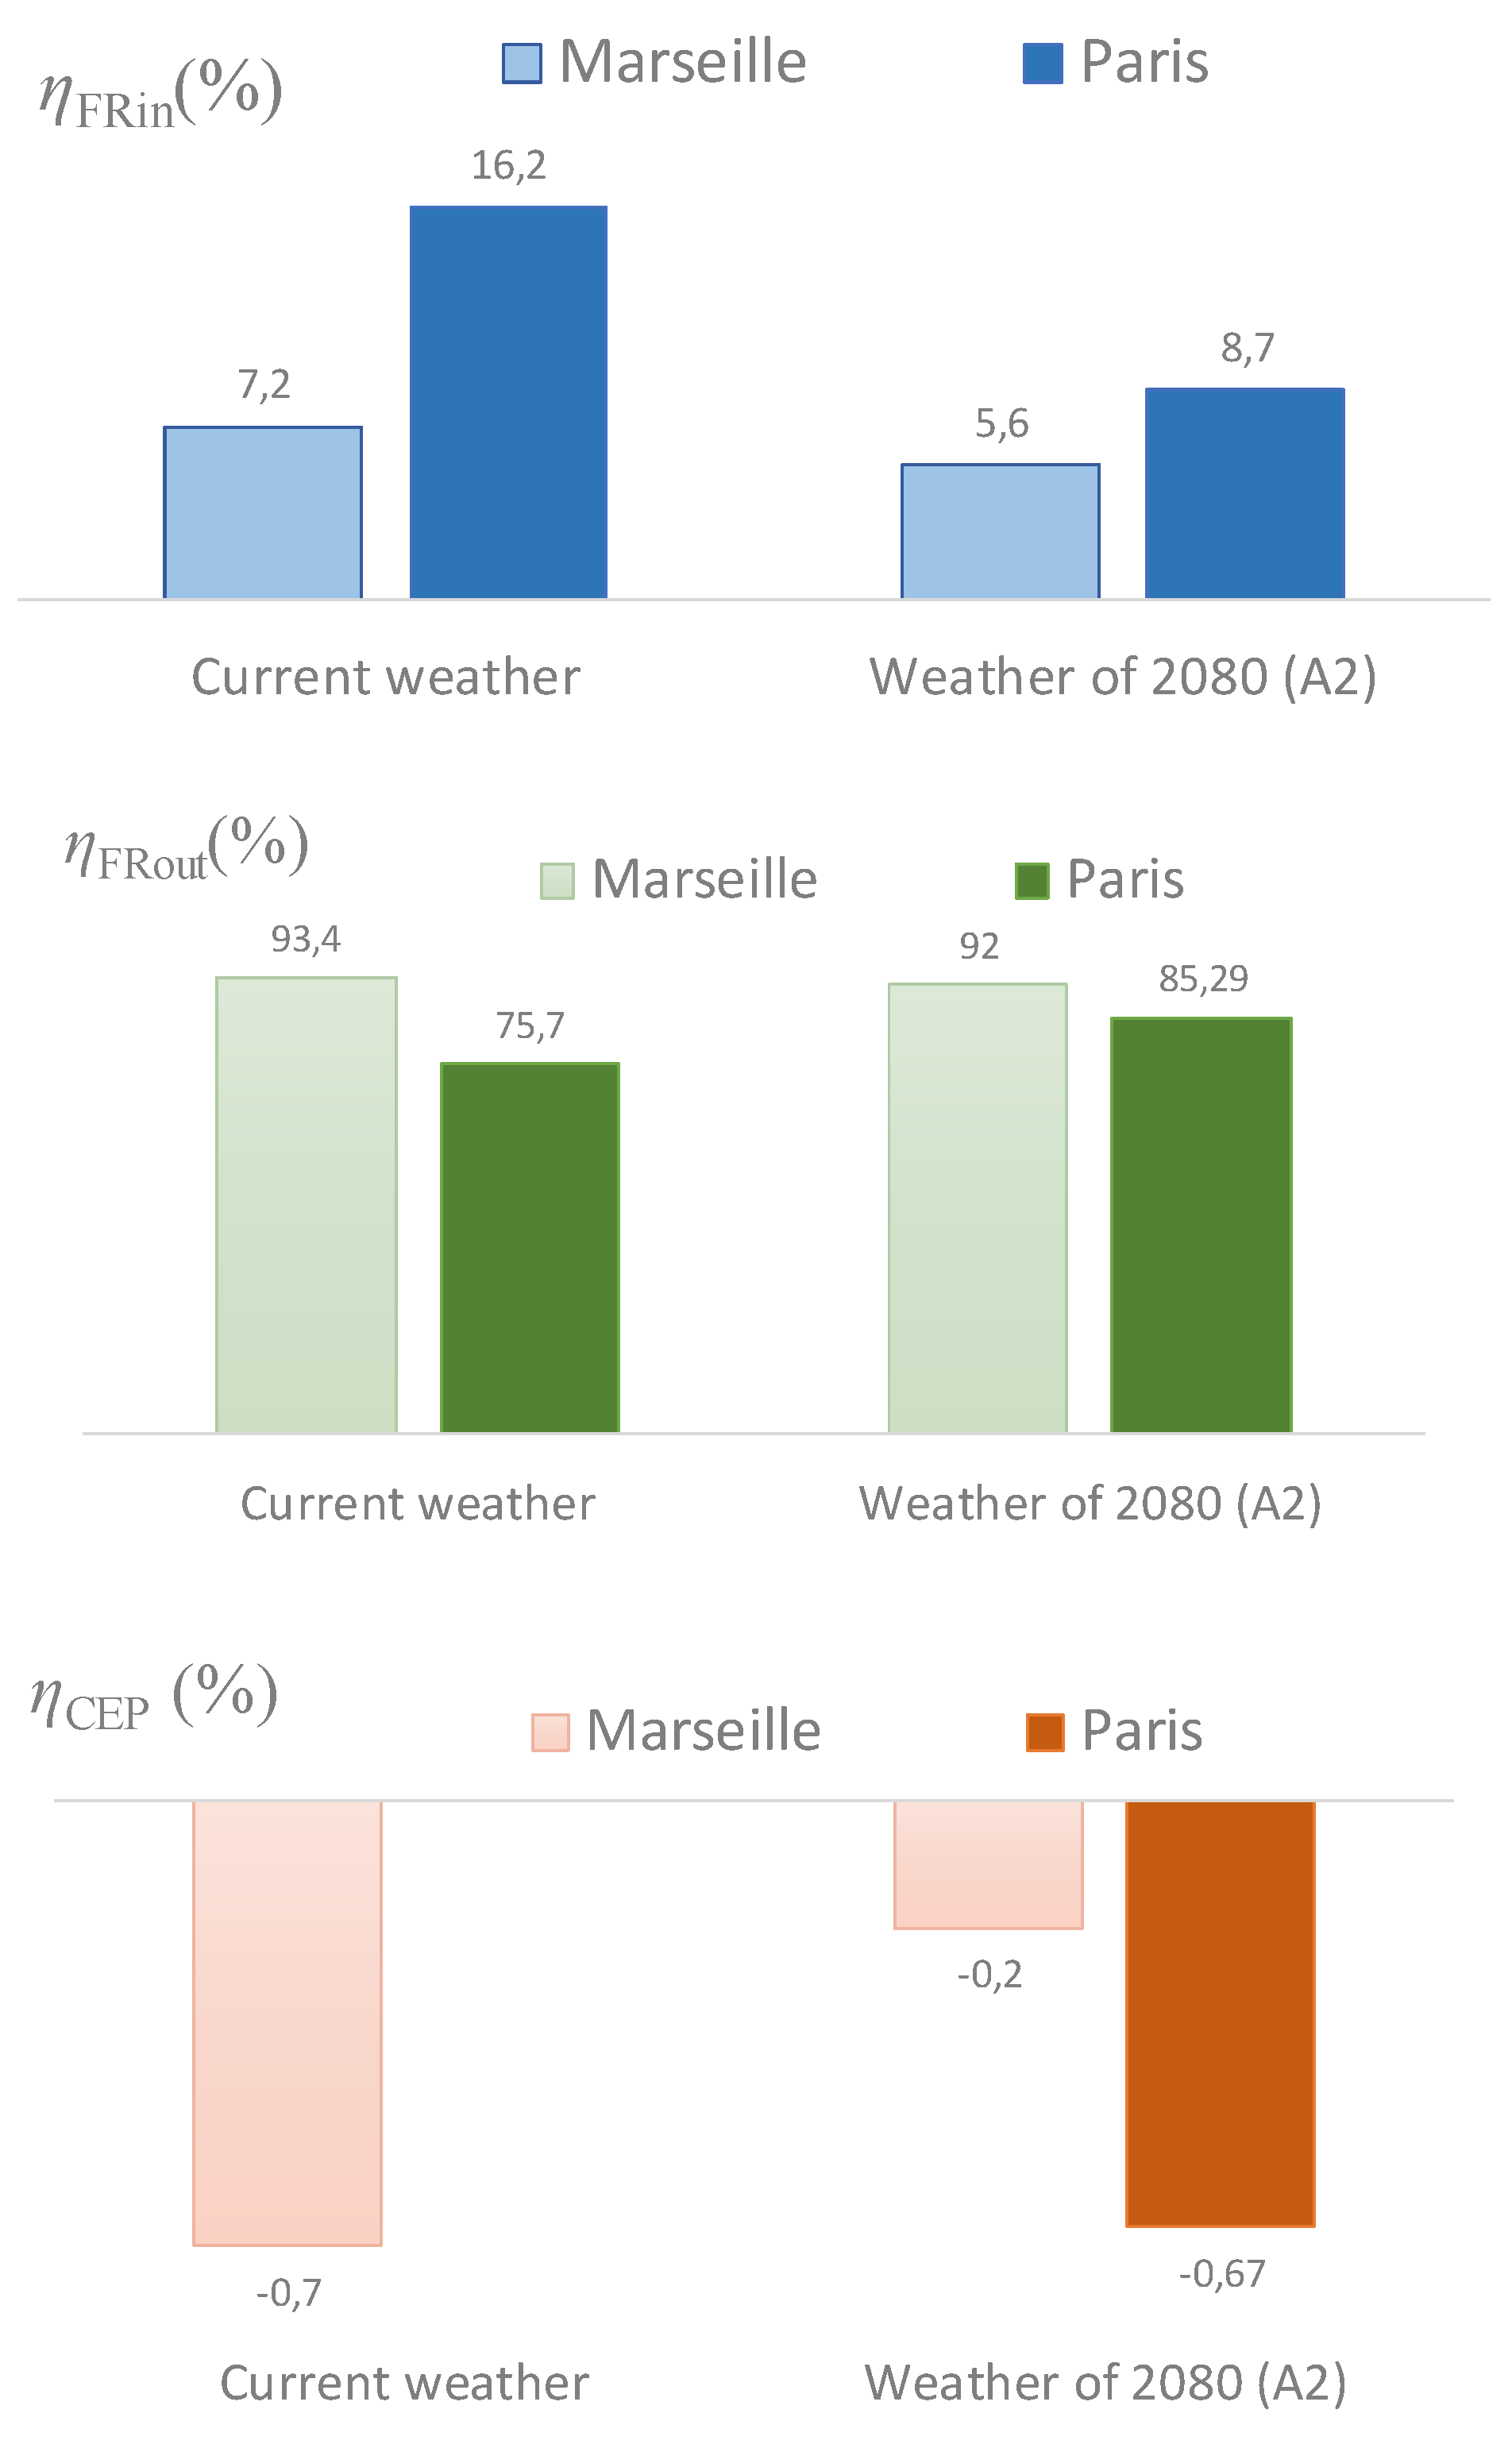
3.3.1. Comparison of Current and Future Climates
3.3.2. Impacts of roof insulation on wetted roof performances
4. Conclusions
Author Contributions
Funding
Acknowledgments
Conflicts of Interest
Nomenclature
| CEP | Primary energy consumption, Wh/m2 | Others | Internal loads |
| cp | Specific heat, J/(kg·K) | refl, R | Reflected |
| D | Dissipated part,% or drainage kg/(m2·s) | win | Openings |
| DH | Discomfort degree-hours, °C·h | Subscripts | |
| E | Incident radiation, W/m2 | air | Air |
| G | Gain part,% | C | Convective |
| h | Heat transfer coefficient, W/(m2·K) | FRin, FRout | Cooling indoor and outdoor |
| L | Specific latent heat of water vaporization, J/kg | G | Ground |
| q | Specific humidity kg/kg | i, int | Indoor |
| Ra | Aerodynamic resistance, s/m | inc | Incident solar radiation |
| t | Time, s | I | Infiltration |
| T | Temperature, °C | LW | Longwave |
| Greek symbols | rad | Radiative | |
| α | Solar absorptance | ref | Related to the reference case |
| ε | Long wave emissivity | S | Surface |
| η | Index,% | sat | Saturate |
| ρ | Density, kg·m−3 | SW | Shortwave |
| σ | Stefan–Boltzmann coefficient, W/(m2·K4) | V | Ventilation |
| Superscripts | w | Water | |
| i | Indoor | (+) | Positive value |
| heat | Heating system | (-) | Negative value |
| o | Outdoor |
References
- Guivarch, C.; Cassen, C. L’atténuation du changement climatique: Retour sur le 5e rapport du Giec. La Météorologie 2015, 8, 97. [Google Scholar] [CrossRef] [Green Version]
- Lemonsu, A.; Viguié, V.; Daniel, M.; Masson, V. Vulnerability to heat waves: Impact of urban expansion scenarios on urban heat island and heat stress in Paris (France). Urban. Clim. 2015, 14, 586–605. [Google Scholar] [CrossRef]
- Harlan, S.L.; Ruddell, D.M. Climate change and health in cities: Impacts of heat and air pollution and potential co-benefits from mitigation and adaptation. Curr. Opin. Environ. Sustain. 2011, 3, 126–134. [Google Scholar] [CrossRef]
- Santamouris, M. Regulating the damaged thermostat of the cities—Status, impacts and mitigation challenges. Energy Build. 2015, 91, 43–56. [Google Scholar] [CrossRef]
- Holmes, M.J.; Hacker, J.N. Climate change, thermal comfort and energy: Meeting the design challenges of the 21st century. Energy Build. 2007, 39, 802–814. [Google Scholar] [CrossRef]
- McCarthy, J.J.; Canziani, O.F.; Leary, N.A.; Dokken, D.J.; White, K.S. (Eds.) Climate Change 2001: Impacts, Adaptation, and Vulnerability: Contribution of Working Group II to the Third Assessment Report of the Intergovernmental Panel on Climate Change; Cambridge University Press: Cambridge, UK, 2001; ISBN 978-0-521-01500-4. [Google Scholar]
- Belcher, S.E.; Hacker, J.N.; Powell, D.S. Constructing design weather data for future climates. Build. Serv. Eng. Res. Technol. 2005, 26, 49–61. [Google Scholar] [CrossRef]
- Christensen, J.H.; Carter, T.R.; Rummukainen, M.; Amanatidis, G. Evaluating the performance and utility of regional climate models: The PRUDENCE project. Clim. Chang. 2007, 81, 1–6. [Google Scholar] [CrossRef]
- Déqué, M.; Jones, R.G.; Wild, M.; Giorgi, F.; Christensen, J.H.; Hassell, D.C.; Vidale, P.L.; Rockel, B.; Jacob, D.; Kjellström, E.; et al. Global high resolution versus Limited Area Model climate change projections over Europe: Quantifying confidence level from PRUDENCE results. Clim. Dyn. 2005, 25, 653–670. [Google Scholar] [CrossRef]
- Rummukainen, M. State-of-the-art with regional climate models. Wiley Interdiscip. Rev. Clim. Chang. 2010, 1, 82–96. [Google Scholar] [CrossRef]
- Santamouris, M. Cooling the buildings—past, present and future. Energy Build. 2016, 128, 617–638. [Google Scholar] [CrossRef]
- Santamouris, M. Cooling the cities—A review of reflective and green roof mitigation technologies to fight heat island and improve comfort in urban environments. Sol. Energy 2014, 103, 682–703. [Google Scholar] [CrossRef]
- Akbari, H.; Cartalis, C.; Kolokotsa, D.; Muscio, A.; Pisello, A.L.; Rossi, F.; Santamouris, M.; Synnefa, A.; Wong, N.H.; Zinzi, M. Local climate change and urban heat island mitigation techniques - The state of the art. J. Civ. Eng. Manag. 2016, 22, 1–16. [Google Scholar] [CrossRef] [Green Version]
- Doya, M.; Bozonnet, E.; Allard, F. Experimental measurement of cool facades’ performance in a dense urban environment. Energy Build. 2012, 55, 42–50. [Google Scholar] [CrossRef]
- Kolokotsa, D.; Rovas, D.; Kosmatopoulos, E.; Kalaitzakis, K. A roadmap towards intelligent net zero- and positive-energy buildings. Sol. Energy 2011, 85, 3067–3084. [Google Scholar] [CrossRef]
- Synnefa, A.; Saliari, M.; Santamouris, M. Experimental and numerical assessment of the impact of increased roof reflectance on a school building in Athens. Energy Build. 2012, 55, 7–15. [Google Scholar] [CrossRef]
- Akbari, H.; Matthews, H.D.; Seto, D. The long-term effect of increasing the albedo of urban areas. Environ. Res. Lett. 2012, 7, 024004. [Google Scholar] [CrossRef]
- Santamouris, M.; Kolokotsa, D. Passive cooling dissipation techniques for buildings and other structures: The state of the art. Energy Build. 2013, 57, 74–94. [Google Scholar] [CrossRef]
- Kong, X.; Lu, S.; Li, Y.; Huang, J.; Liu, S. Numerical study on the thermal performance of building wall and roof incorporating phase change material panel for passive cooling application. Energy Build. 2014, 81, 404–415. [Google Scholar] [CrossRef]
- Steeneveld, G.J.; Koopmans, S.; Heusinkveld, B.G.; Theeuwes, N.E. Refreshing the role of open water surfaces on mitigating the maximum urban heat island effect. Landsc. Urban. Plan. 2014, 121, 92–96. [Google Scholar] [CrossRef]
- Hathway, E.A.; Sharples, S. The interaction of rivers and urban form in mitigating the Urban Heat Island effect: A UK case study. Build. Environ. 2012, 58, 14–22. [Google Scholar] [CrossRef] [Green Version]
- Inard, C.; Groleau, D.; Musy, M. Energy balance study of water ponds and its influence on building energy consumption. Build. Serv. Eng. Res. Technol. 2004, 25, 171–182. [Google Scholar] [CrossRef] [Green Version]
- Ip, K.; Marta, L.; Miller, A. Bioshaders for sustainable buildings. In Proceedings of the CIB 2004 World Building Congress, Toronto, ON, Canada, 1–7 May 2004. [Google Scholar]
- Djedjig, R.; Bozonnet, E.; Belarbi, R. Modeling green wall interactions with street canyons for building energy simulation in urban context. Urban. Clim. 2016, 16, 75–85. [Google Scholar] [CrossRef]
- Kaboré, M.; Bozonnet, E.; Salagnac, P.; Abadie, M. Indexes for passive building design in urban context–indoor and outdoor cooling potentials. Energy Build. 2018, 173, 315–325. [Google Scholar] [CrossRef]
- Pérez-Lombard, L.; Ortiz, J.; Pout, C. A review on buildings energy consumption information. Energy Build. 2008, 40, 394–398. [Google Scholar] [CrossRef]
- Persily, A.K. Airtightness of commercial and institutional buildings: Blowing holes in the myth of tight buildings. In Proceedings of the Thermal Envelopes VII Conference, Clearwater, FL, USA, 6–10 December 1998; pp. 829–837. [Google Scholar]
- Deru, M.; Field, K.; Studer, D.; Benne, K.; Griffith, B.; Torcellini, P.; Liu, B.; Halverson, M.; Winiarski, D.; Rosenberg, M.; et al. U.S. Department of Energy commercial reference building models of the national building stock. Publ. E 2011, 1–118. [Google Scholar]
- Meteotest. Meteonorm 7, Global Irradiation and Climate Data; Meteotest AG: Bern, Switzerland, 2016. [Google Scholar]
- Jain, D. Modeling of solar passive techniques for roof cooling in arid regions. Build. Environ. 2006, 41, 277–287. [Google Scholar] [CrossRef]
- Kondepudi, S.N. A simplified analytical method to evaluate the effects of roof spray evaporative cooling. Energy Convers. Manag. 1993, 34, 7–16. [Google Scholar] [CrossRef]
- Djedjig, R.; Ouldboukhitine, S.-E.; Belarbi, R.; Bozonnet, E. Development and validation of a coupled heat and mass transfer model for green roofs. Int. Commun. Heat Mass Transf. 2012, 39, 752–761. [Google Scholar] [CrossRef]
- Djedjig, R.; Bozonnet, E.; Belarbi, R. Analysis of thermal effects of vegetated envelopes: Integration of a validated model in a building energy simulation program. Energy Build. 2015, 86, 93–103. [Google Scholar] [CrossRef]


| Surface Type | Plaster | Mineral Wool | Steel Cladding | Thermal Emissivity (ε) | Solar Reflectance (α) |
|---|---|---|---|---|---|
| Walls | 13 | 140 | 2 | 0.9 | 0.3 |
| Roof | 13 | 120 | 2 | 0.9 | 0.3 |
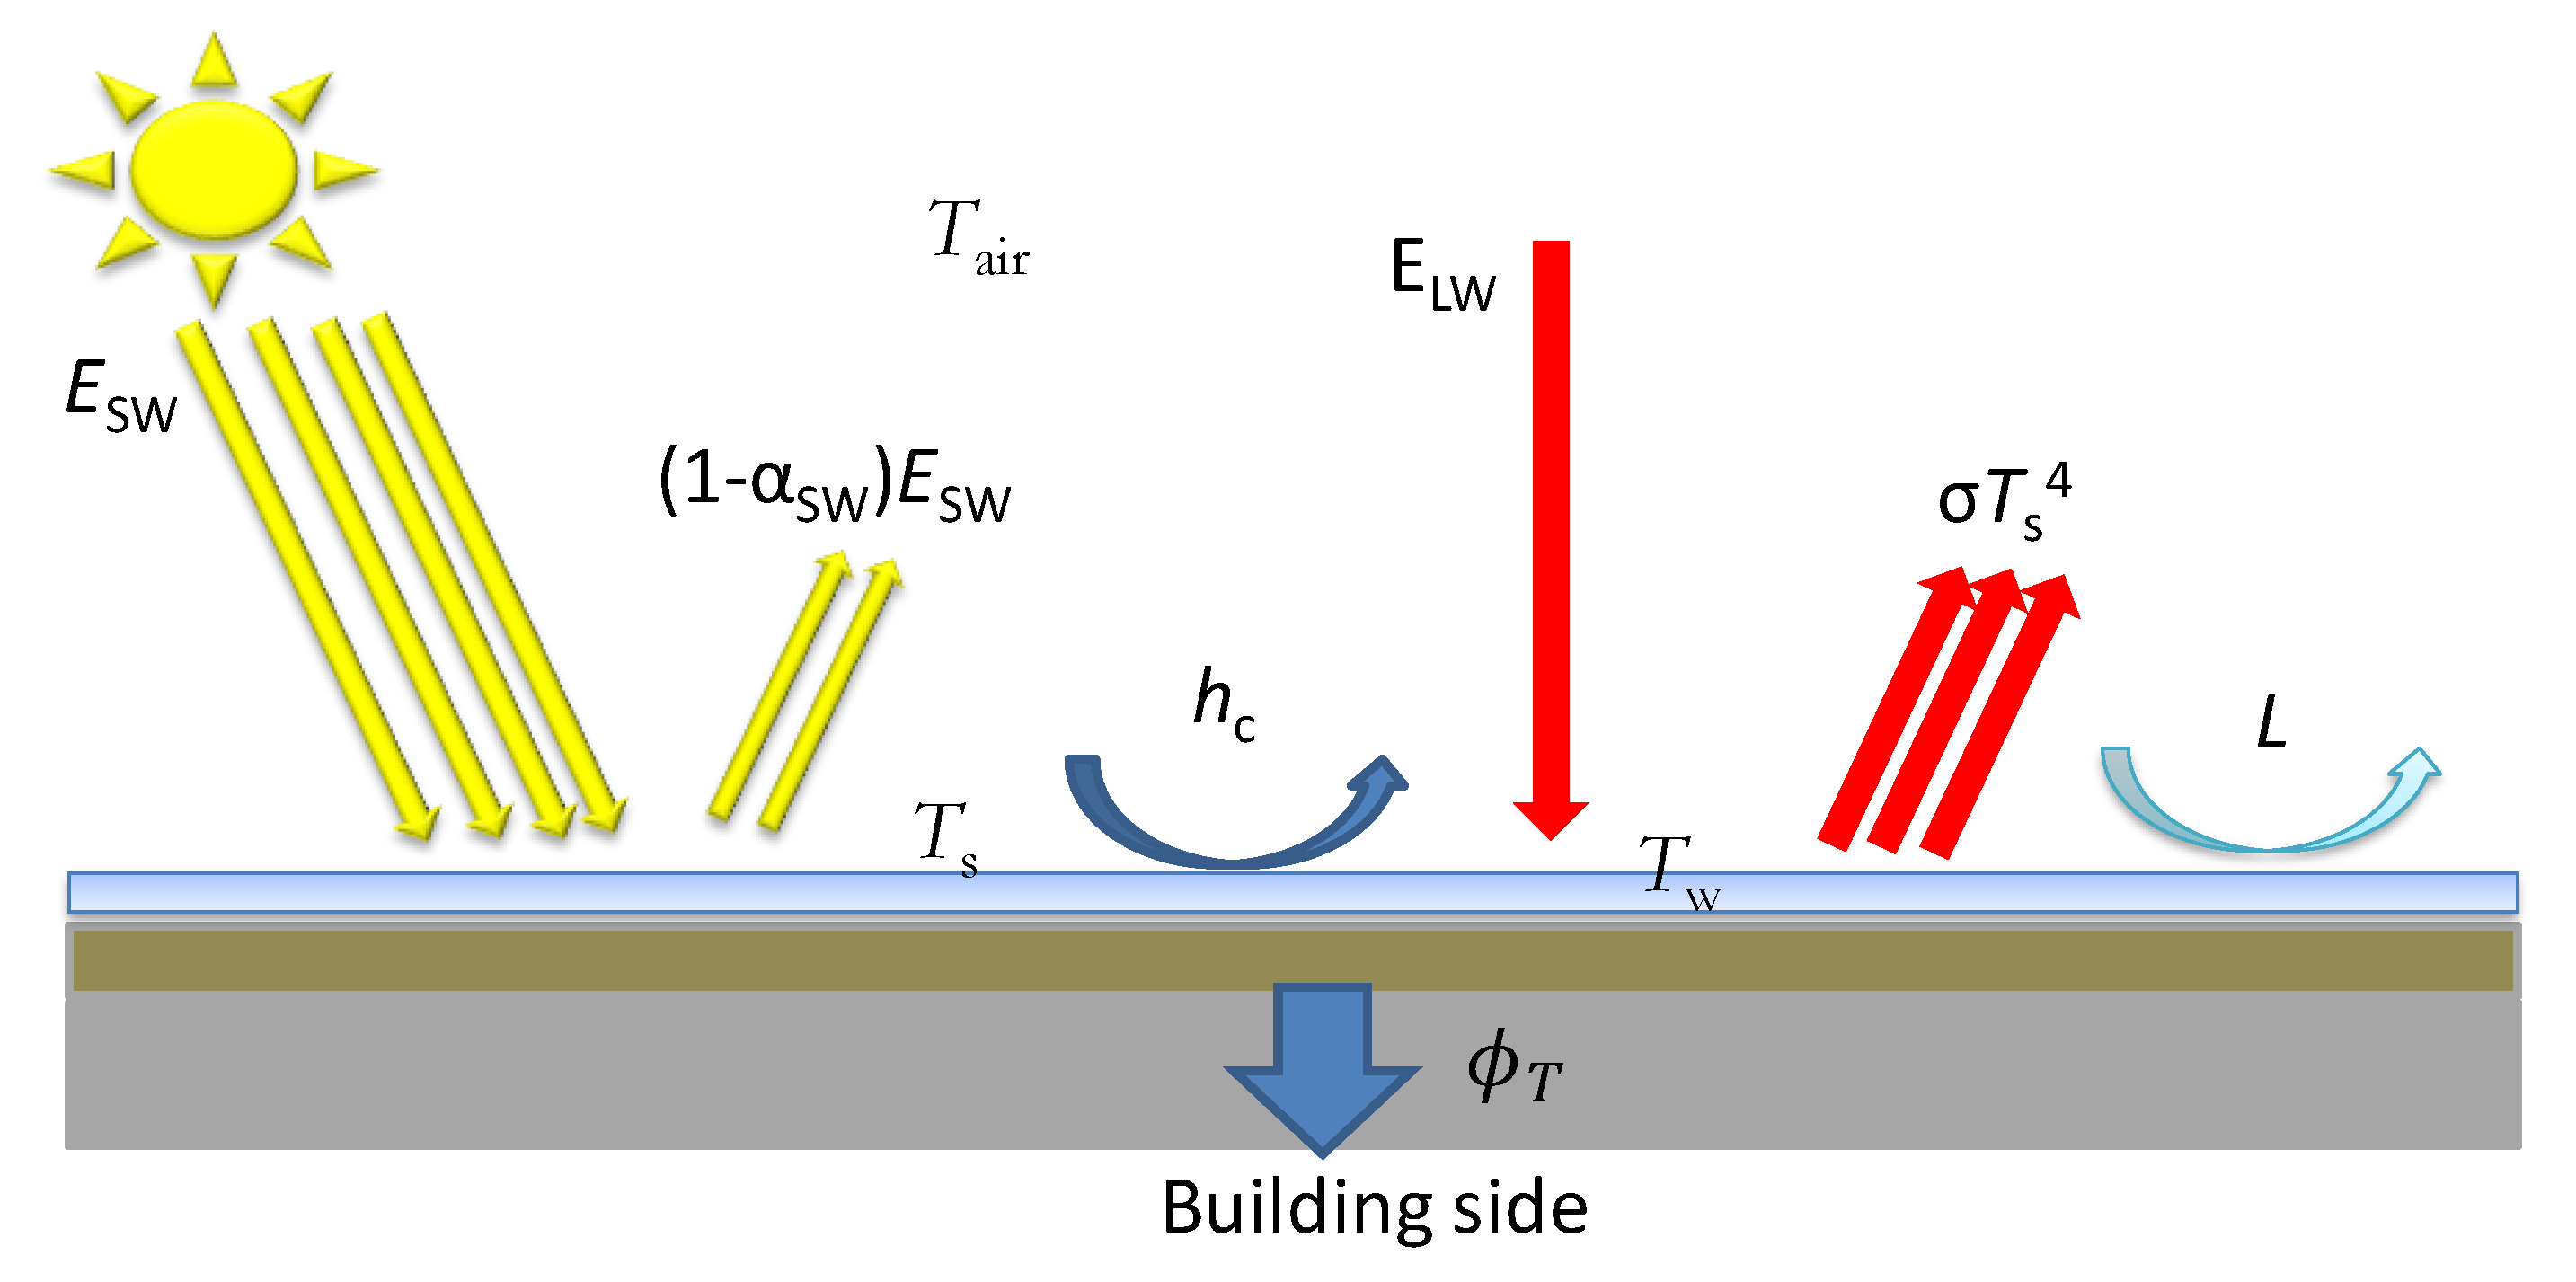
| Expression | Description |
|---|---|
| the absorbed solar irradiance by the building envelope | |
| the net longwave (LW) heat loss radiated to the sky and the environment | |
| the net convective heat transmitted by the envelope to the ambient air | |
| the net conducted heat to the ground | |
| the indoor solar gains (SW) through windows and skylights | |
| the radiative internal gains | |
| the net longwave heat gains from indoor surfaces radiation | |
| the net heat stored within the building envelope and internal walls |
| Insulation’s Thermal Resistance R (m2·K/W) | ηFRin | ηCEP | ηFRout |
|---|---|---|---|
| 1.25 | 13% | 1% | 18.3% |
| 2.25 | 7% | 3% | 18.3% |
| 2.75 | 6% | 4% | 18.3% |
| Insulation’s Thermal Resistance R (m2·K/W) | ηFRin | ηCEP | ηFRout |
|---|---|---|---|
| 1.25 | 25.1% | −10.7% | 92.11% |
| 2.25 | 12.5% | −3.1% | 92.85% |
| 2.75 | 9.5% | −2.01% | 92.11% |
Publisher’s Note: MDPI stays neutral with regard to jurisdictional claims in published maps and institutional affiliations. |
© 2020 by the authors. Licensee MDPI, Basel, Switzerland. This article is an open access article distributed under the terms and conditions of the Creative Commons Attribution (CC BY) license (http://creativecommons.org/licenses/by/4.0/).
Share and Cite
Kaboré, M.; Bozonnet, E.; Salagnac, P. Building and Urban Cooling Performance Indexes of Wetted and Green Roofs—A Case Study under Current and Future Climates. Energies 2020, 13, 6192. https://doi.org/10.3390/en13236192
Kaboré M, Bozonnet E, Salagnac P. Building and Urban Cooling Performance Indexes of Wetted and Green Roofs—A Case Study under Current and Future Climates. Energies. 2020; 13(23):6192. https://doi.org/10.3390/en13236192
Chicago/Turabian StyleKaboré, Madi, Emmanuel Bozonnet, and Patrick Salagnac. 2020. "Building and Urban Cooling Performance Indexes of Wetted and Green Roofs—A Case Study under Current and Future Climates" Energies 13, no. 23: 6192. https://doi.org/10.3390/en13236192