Article

Investigation of the Geometric Shape Effect on the Solar Energy Potential of Gymnasium Buildings

1
School of Architecture, Nanjing Tech University, Nanjing 211816, China
2
College of Civil Engineering, Nanjing Tech University, Nanjing 211816, China
3
Department of Research Center, Jiangsu Institute of Urban Planning and Design, Nanjing 210036, China
4
College of Water Conservancy and Hydropower Engineering, Hohai University, Nanjing 210098, China
*
Authors to whom correspondence should be addressed.
Energies 2020, 13(23), 6369; https://doi.org/10.3390/en13236369
Submission received: 2 October 2020 / Revised: 30 November 2020 / Accepted: 30 November 2020 / Published: 2 December 2020

Abstract

:
Gymnasium are typically large-span buildings with abundant solar energy resources due to their extensive roof surface. However, relevant research on this topic has not been thoroughly conducted to investigate the effect of the geometric shape of gymnasium buildings on their solar potential. In this paper, an investigation of the geometric shape effect on the solar potential of gymnasium buildings is presented. A three-dimensional radiation transfer model coupled with historical meteorological data was established to estimate the real-time solar potential of the roof of a gymnasium building. The rooftop solar potential of three typical building foundation shapes and different types of roof shapes that have evolved was systematically analyzed. An annual solar potential cloud map of each gymnasium building is generated. The monthly and annual average solar radiation intensities of the different types of roof shapes are investigated. Compared to the optimal tilt angle, the maximum decrease in the average radiation intensity reached −20.42%, while the minimum decline was −8.64% for all types of building shapes. The solar energy potential fluctuated by up to 11% across the various roof shapes, which indicate that shape selection is of vital importance for integrated photovoltaic gymnasium buildings. The results presented in this work are essential for clarifying the effects of the geometric shape of gymnasium buildings on the solar potential of their roofs, which provide an important reference for building design.

1. Introduction

The term large-span buildings usually refers to buildings with a span of more than 30 m, which is common for theatres, stadiums, gymnasiums, exhibition halls, city halls, airports and other large public civil buildings. The operation of large-span buildings inevitably requires consumption of a great amount of energy [1]. With the increasing demand for green building ratings, the utilization of rooftop solar energy appears to be a promising energy conservation option for these buildings [2]. Early in the 1990s, the green building concept was proposed at the United Nations Conference on Environment and Development [3]. After more than 30 years of developments, the implementation of green buildings has gradually become a global consensus [4]. As construction energy savings are an imperative trend in architectural evolution, there is increasing interest in designing solar energy integrated buildings worldwide.
Photovoltaic (PV) power generation and photothermal utilization are the two primary utilization forms of rooftop solar energy [5]. Rooftop PV power generation can provide an electric supplement for buildings, and rooftop photothermal utilization can provide heat sources, such as hot water and spatial heating. The relevant equipment is user-friendly to install and maintain, and it can operate without noise or air pollution. The above merits are especially desirable for large-span buildings, since their extensive roof surfaces are highly conducive to the installation of solar energy systems. In addition, with the improvement of manufacturing methods and the application of new materials, solar energy utilization equipment is no longer limited to the traditional structure. There are numerous new options, including curved PV panels [6] and PV films [7], which fit curved roofs without producing residual mechanical stress and strain, and if the current matching problem can be handled properly, which will greatly expand the design space of solar energy integrated buildings.
The stadium is a typical large-span building with abundant solar energy resources on its extensive roof surface and is also a typical building suitable for integrating solar energy with the combination of personality and aesthetics. China’s National Stadium, which was rebuilt for the 2008 Beijing Olympics and known as Bird’s Nest due to its unique appearance, has an installed total capacity of 130 kilowatts of solar PV power above its 12 main passageways. The electricity generated by the PV power generation system has been directly integrated into the power supply system of the national stadium, which has played a good complementary role to the power supply of this Olympic venue [8]. The Taiwan solar energy-powered stadium completed in 2009 is the first stadium worldwide to be completely powered by solar energy. This stadium, with a roof of 14,155 square metres covered with 8844 solar panels, can provide 1.1 million kilowatts of electricity, which has been claimed to be enough to supply 80% of the electricity demand of the surrounding population [9]. Subsequently, the Brazilian National Stadium, which was rebuilt for the 2014 World Cup in Brazil, has an installed total capacity of 2.5 MW of solar power, the highest capacity globally [10]. In fact, Brazil is emerging as one of the world’s fastest growing markets for PV products [11]. The average annual sunshine days in Brazil are approximately 280 days, with sufficient sunshine and abundant solar energy resources, making it an ideal region for the construction of solar energy integrated buildings [12]. The 2014 World Cup in Brazil observed the birth of five PV stadiums. In addition to the Brazilian National Stadium, there are Mineirao Stadium, Maracana Stadium, Pernambuco Stadium, and new Water Source Stadium, all of which are examples of solar energy-integrated buildings [13].
A relevant survey reported that for some solar energy integrated buildings, the original design target was a 50% to 60% solar energy utilization rate, but the actual energy savings effect has only amounted to approximately 30% [14]. The actual energy saving effect of solar and thermal systems has fallen short from meeting the design requirements, which is ascribed to the lack of reliable technical support for the operation of solar energy systems under different climatic conditions and seasons. Moreover, architectural design is often separated from the solar energy system design. These iconic stadiums with adequate construction budgets were usually designed in a way that emphasized their personality and exterior beauty rather than the optimal use of solar energy. For buildings with tight budgets that need to focus on long-term benefits, the optimization of solar energy utilization is particularly important.
Since solar energy resources are highly random and seasonal, evaluating the potential of solar energy resources has become the premise for the design of solar energy integrated buildings. Considerable research efforts have been devoted to the estimation of the solar radiation resources across a given building surface. Light detection and ranging (LiDAR), a remote sensing method that can acquire geometric data of ground objects, has been widely applied in building solar energy evaluation. For instance, Redweik et al. [15] developed a 3D evaluation model for the solar energy potential of urban complexes. They established a digital surface model (DSM) from LiDAR data and evaluated the solar energy potential by the shadow algorithm. Similarly, Kodysh et al. [16] proposed a solar energy estimation method using LiDAR data and a geographic information system (GIS) and combined it with the upward-looking hemispherical viewshed algorithm. Based on high-resolution data obtained from a digital elevation model (DEM), this method is suitable for the evaluation of solar energy resources on cluster building rooftops. These LiDAR-based methods, however, are costly and only applicable to existing buildings [17]. Moreover, limited by the data accuracy, it is difficult to accurately assess the solar energy resources of a single building surface [18]. To obtain a more accurate assessment of the solar energy potential of a building surface, the reconstruction of a 3D model of a given building may be a better option. Li et al. [19] proposed a pixel-based method to estimate the solar energy potential of building surfaces. Building shapes were reconstructed in SketchUp, and a series of instantaneous shadow images was generated. Then, the solar energy potential of each pixel on the building surface was determined based on MATLAB digital image processing.
The geometric shape of a gymnasium building greatly impacts the solar energy resources on its roof surface [20]. However, little research has been performed to investigate the effect of the geometric shapes of gymnasium buildings on their solar potential. In contrast to an independent PV system with sunlight tracking ability, the installation tilt angle of PV panels in PV-integrated buildings remains constant. Therefore, it is impossible to obtain the maximum solar radiation at the optimal tilt angle at every moment, which dramatically limits the benefits of rooftop solar energy. Therefore, to improve the solar energy utilization rate of roofs, it is very important to study the influence of different roof shapes on the solar energy potential.
In this investigation, we focus on the effects of the geometric shapes of gymnasium buildings on their solar potential. A radiation transfer model coupled with historical meteorological data is established to estimate the real-time solar potential of the roofs of gymnasium buildings. First, the optimal tilt angle of solar installation in different regions of China is analyzed. Selecting the Nanjing area as an example, the relation between the optimal installation tilt angle and the change in months is interpreted, which provides a data reference for the solar radiation assessment of buildings. Second, based on the meteorological data of Nanjing, the rooftop solar potential of three typical building foundation shapes and different types of roof shapes that have evolved is systematically analyzed. An annual solar potential cloud map of each gymnasium building is generated. The results presented in this work are essential to clarify the effects of the geometric shapes of gymnasium buildings on the solar potential of their roof, which provides an important reference for building design.

2. Geometric Shape of the Gymnasium Building

Building structures can be divided into load-bearing and maintenance structures. In regard to gymnasium buildings, the load-bearing structure includes the roof and supporting structures. As a large-span building, the roof structure of a gymnasium is the basis of the realization of the architectural shape and imposes a great influence on the building space and image. Basic roof structures of gymnasiums include the truss structure, rigid frame structure, arch structure, thin shell structure, grid structure, reticulated shell structure, folded plate structure, suspension structure, and membrane structure, etc.
Generally, the basic plane shape and internal space of the competition hall are determined according to the scale of the gymnasium. Plane shapes of competition halls include square, rectangle, polygon, circle, ellipse, and irregular shapes. In addition to the span factor, roof shape selection for gymnasiums should also consider coordination with the selected plane shape. Table 1 provides examples of gymnasium shapes based on the typical plane shapes. These basic gymnasium shapes can be found in similar prototypes in buildings around the world, as shown in Figure 1. Most iconic gymnasium buildings are usually located in spacious areas where sunlight is not blocked by any surrounding buildings, so there are abundant solar energy resources on their roof surfaces. In this study, we choose three typical building foundation shapes and different types of roof shapes that have evolved to qualitatively analyze the differences in solar energy resources among the various roof shapes. A detailed analysis is performed in the following chapters.

3. Solar Radiation Assessment Model

3.1. Solar Radiation Intensity

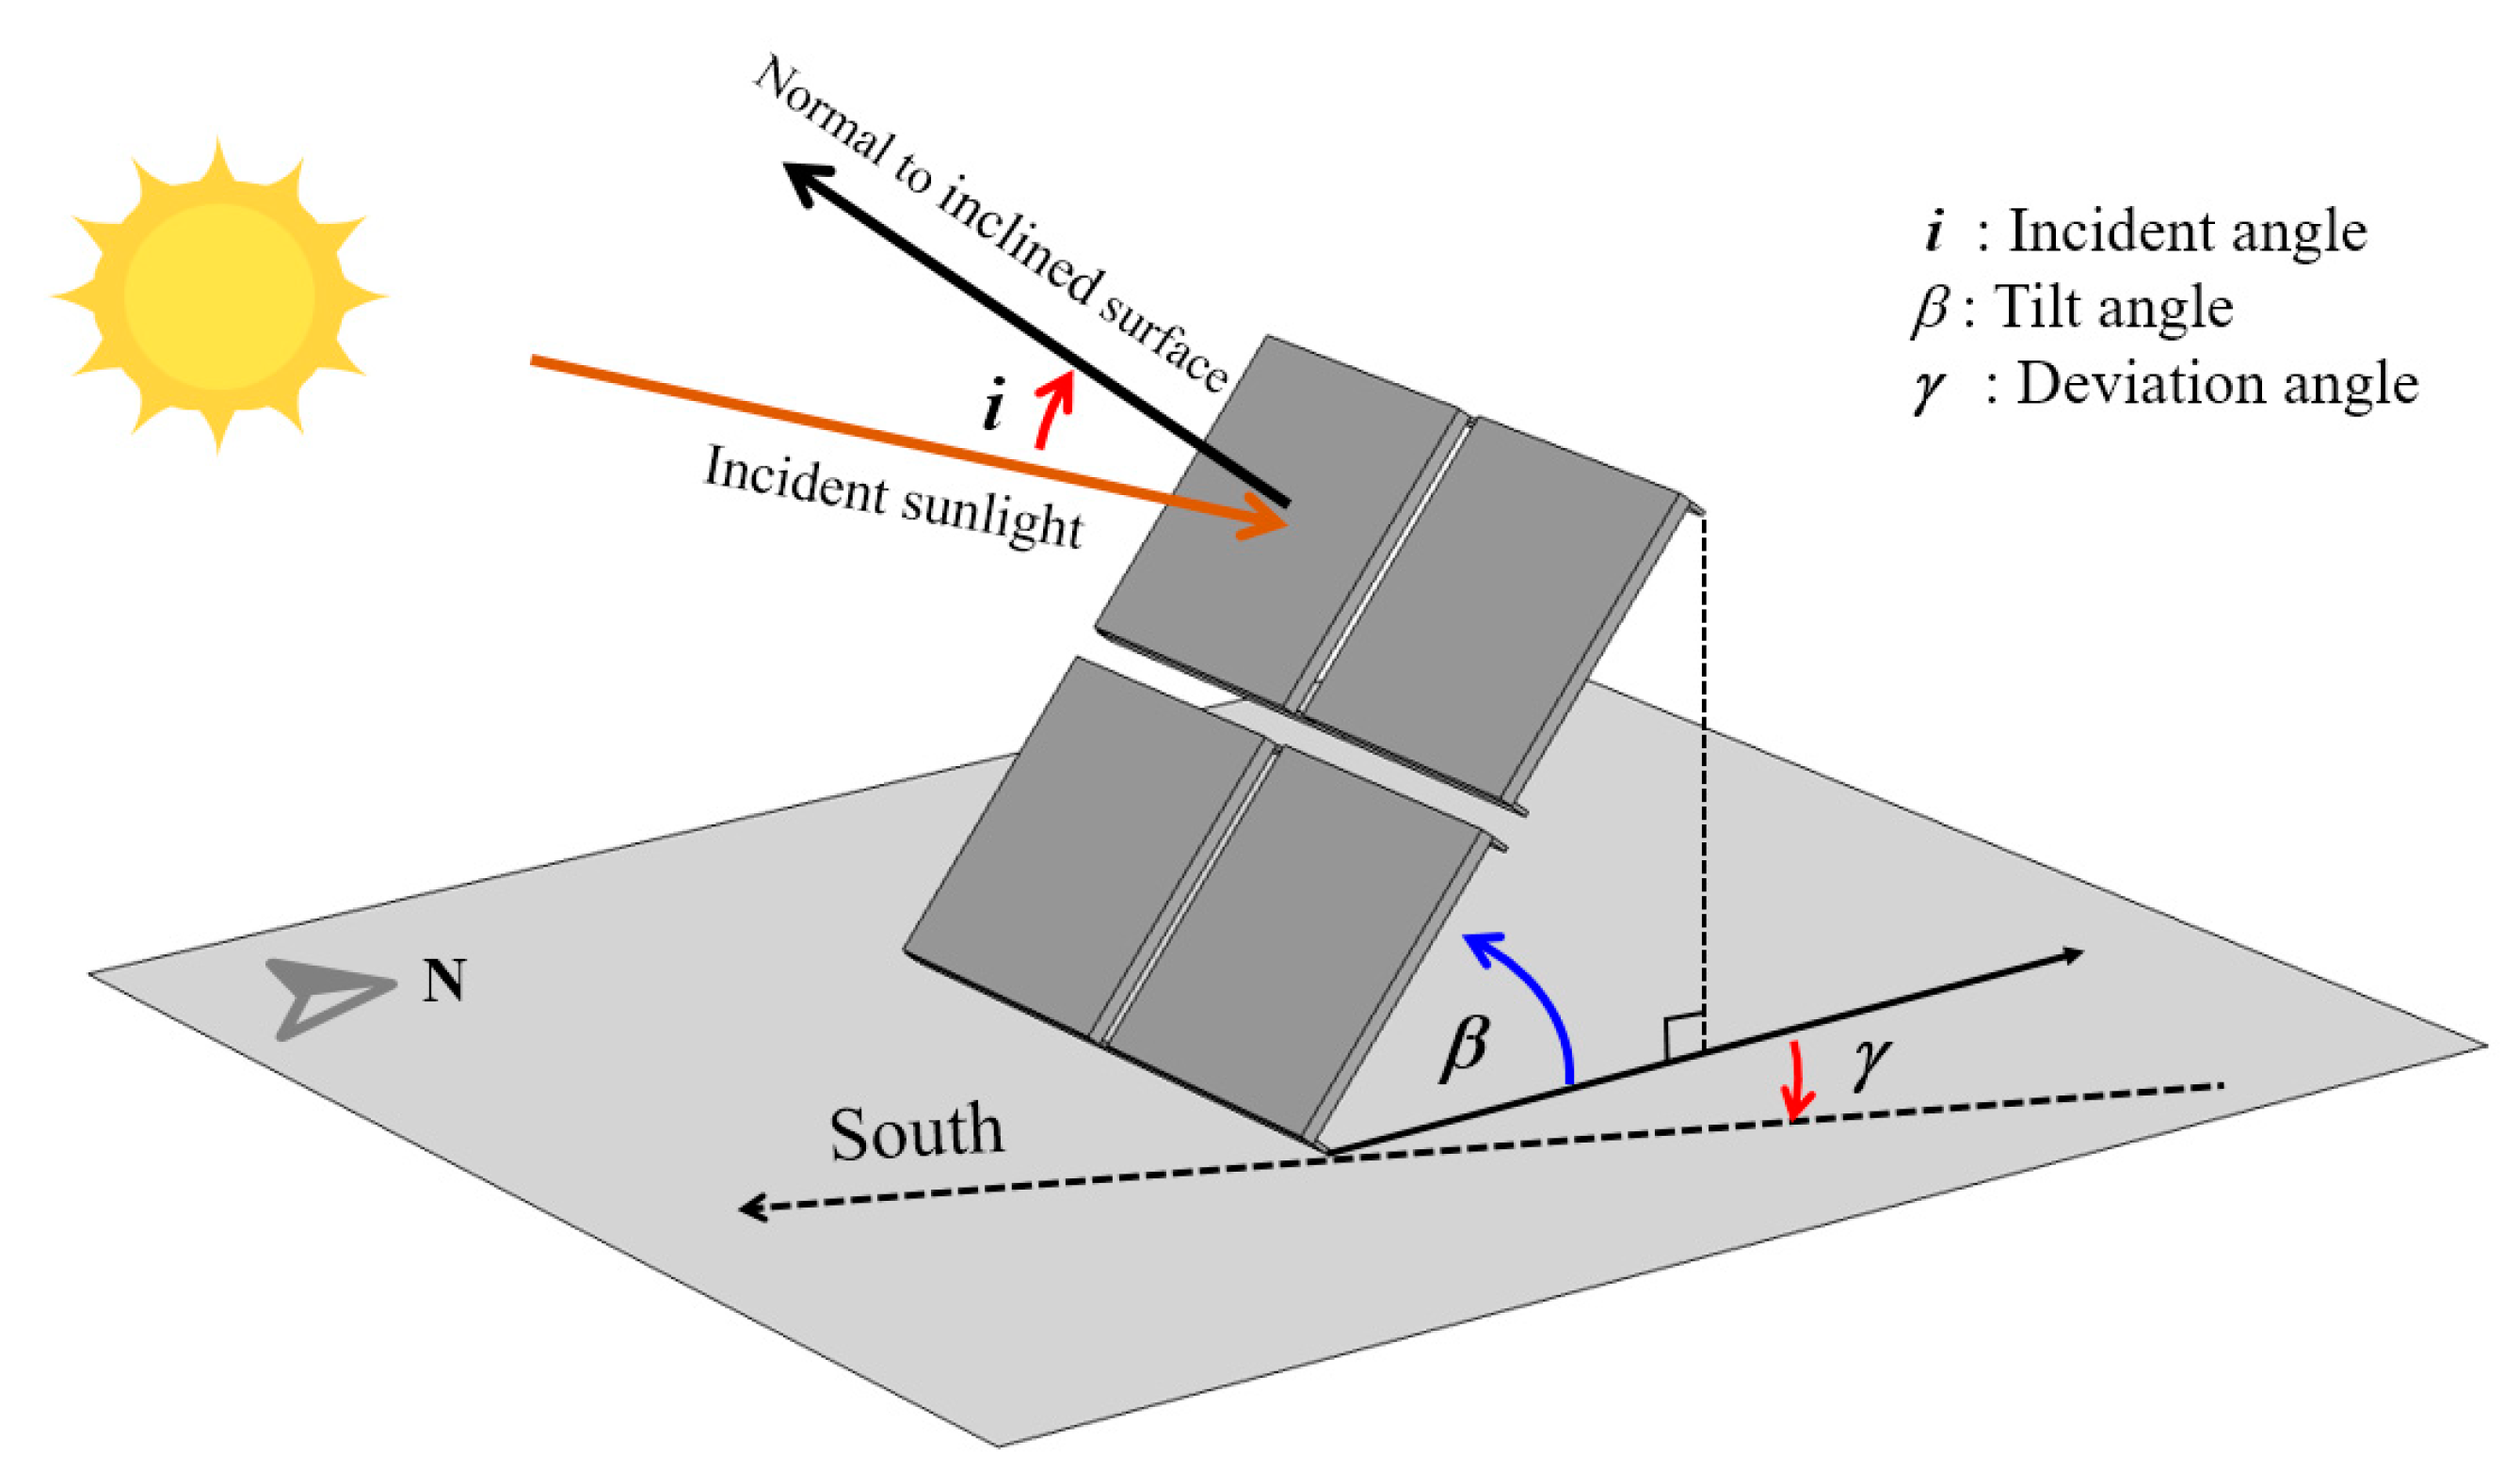
To obtain the intensity of the incident solar radiation, the sun position must be determined first. As shown in Figure 2, the zenith angle θs, the solar altitude angle αs and the altazimuth angle φs can be obtained as follows [28]:
cos θ s = sin α s = sin L sin δ + cos L cos δ cosh
cos ϕ s = ( sin δ cos L cosh cos δ sin L sin θ s ,       h < 0 360 ° arccos ( sin δ cos L cosh cos δ sin L sin θ s ) , h > 0
where L is the local latitude; δ is the current sun declination; and h is the hour angle or local solar time. The incident angle i between the incident sunlight and normal roof surface can be determined by the following equation [28]:
cos i = { cos θ r sinh + sin θ r cosh cos ( ϕ s γ r ) ,     γ r 0   cos ( L θ r ) cos δ cosh + sin ( L θ r ) sin δ , γ r = 0
where θr is the angle between the roof surface and horizontal plane, and γr is the angle between the south direction and normal projection of the roof surface. It should be noted that the azimuth angle is measured from the north, and when γr is equal to zero, the incident angle is calculated differently, as expressed in Equation (3).
Solar radiation mainly consists of two parts, namely, direct solar radiation along the original incidence direction and diffuse solar radiation, whose original direction has changed in the atmosphere. There are several advanced models for calculating the diffuse solar radiation, such as Kumar [29], Muneer [30], Gueymard [31] and Perez Models [32]. For this article, we chose Kumar’s model for radiation assessment as it is more common in the industry. In regard to the roof surface, the direct solar radiation IDr and diffuse solar radiation Idr can be determined as follows [29]:
I D r = η I 0 τ D cos i
I d r = sin α s I 0 τ d cos 2 ( θ r / 2 )
where η is the percentage of sunshine based on local weather conditions, i.e., the ratio of the actual sunshine duration to the possible sunshine duration (the number of sunshine hours on a cloudless day). The solar flux I0 outside the Earth’s atmosphere, the atmospheric transmission of the direct radiation τD, and the diffuse radiation τd can be obtained by [29]:
I 0 = I s c [ 1 + 0.034 cos ( 2 π n 265.25 ) ]
τ D = 0.56 ( e 0.65 M + e 0.095 M )
τ d = 0.271 0.294 τ D
M = [ 1229 + ( 614 sin α s ) 2 ] 0.5 614 sin α s
where Isc is a solar constant set to 1367 W/m2, n is the day of the year starting on 1 January, and M is the air mass coefficient which is defined as the ratio of the distance travelled through the atmosphere to the vertical depth of the atmosphere.

3.2. Surface Radiation Treatment

Up till now, the incident radiation intensity on the roof surface has been determined, but in the real environment, the roof surface also receives radiation reflected or scattered by other objects or the roof surface occurs in the shadow of other objects. Therefore, to obtain the solar radiation intensity of irregular roofs, a radiation transfer model based on the surface-to-surface radiation theory is established.
As shown in Figure 3, considering a point P located on a roof surface, the total incoming radiative flux at P is defined as irradiance G:
G = G s o l a r + G a m b + G m
where Gsolar and Gamb are the solar and ambient irradiance, respectively, and Gm is the mutual irradiance originating from the other surfaces.
G s o l a r = F S D I D r + F S d I d r
G a m b = F a m b e a m b ( T a m b )
where FS−D and FS−d are the view factors of the direct and diffuse solar radiation, respectively, Famb is the ambient view factor, and eamb is the ambient emissivity depending on the temperature. For an opaque roof surface, when exposed to the irradiance, radiation transmission can be divided into three processes: specular reflection, diffuse reflection, and thermal emission. The outgoing radiosity J from point P is defined as the sum of the diffusively reflected and emitted radiation [33]:
J = ρ d G + ε r e r ( T )
where ε and ρd are the hemispherical spectral surface emissivity and diffuse reflectivity of the roof surface, and er is the blackbody hemispherical emissive power of the roof surface, all of which are dependent on the radiation wavelength λ and surface temperature T, with dimensionless quantities ranging from 0–1 [31]. To simplify the model, it is assumed that these parameters remain constant or are dependent on only the temperature. The net inward radiative heat flux qrad at point P is thus obtained as the difference between the incoming irradiance G and outgoing radiosity J:
q r a d = ( 1 ρ s ) G J
where ρs is the specular reflectivity of the roof surface material.

3.3. Numerical Methods and Statistics

The 3D building geometry model studied in this paper was established with SketchUp software, and the solar radiation intensity was calculated by the surface-to-surface radiation module of COMSOL Multiphysics 5.4. The hemi-cube method was applied to account for shadowing effects by adopting a z-buffered projection on the sides of a hemi-cube. Based on the finite element radiation model, the intensity of solar radiation at any point on the roof is obtained, and the overall radiant power is determined by integrating the radiation intensity across the entire roof surface. The real-time overall radiant power for the entire roof surface is obtained as follows:
Q h o u r ( t ) = A r G ( t ) d s
where t is a temporal variable. The daily overall radiant power is calculated by integrating the real-time overall radiant power throughout the entire sunshine duration:
Q d a i l y ( n ) = s u n r i s e s u n s e t Q h o u r ( t ) d t
where n is the day of the year starting on 1 January. To compare the solar radiation benefits of the different types of roofs, the average solar radiation density was adopted for analysis:
q d a i l y = Q d a i l y / A r
Specifically, the annual radiation intensity distribution on the roof is determined by summing the radiation at various locations:
q s o l a r _ a n u a l = n = 1 365 s u n r i s e s u n s e t G ( n , t ) d t / A r

4. Results and Discussion

4.1. Optimal Tilt Angle for Solar Installations

Each region exhibits a fixed optimal tilt angle that maximizes the solar radiation benefits. This optimal tilt angle is closely related to local factors such as latitude, topography, and climate. Therefore, it is necessary to fully understand the local optimal tilt angle before investigating the geometric shape effects on the solar energy potential of gymnasium buildings. In this section, the solar radiation yield at various installation tilt angles is analyzed based on the method proposed in the previous section. The optimum tilt angle is obtained by adjusting the different tilt angles of a rectangular plate.
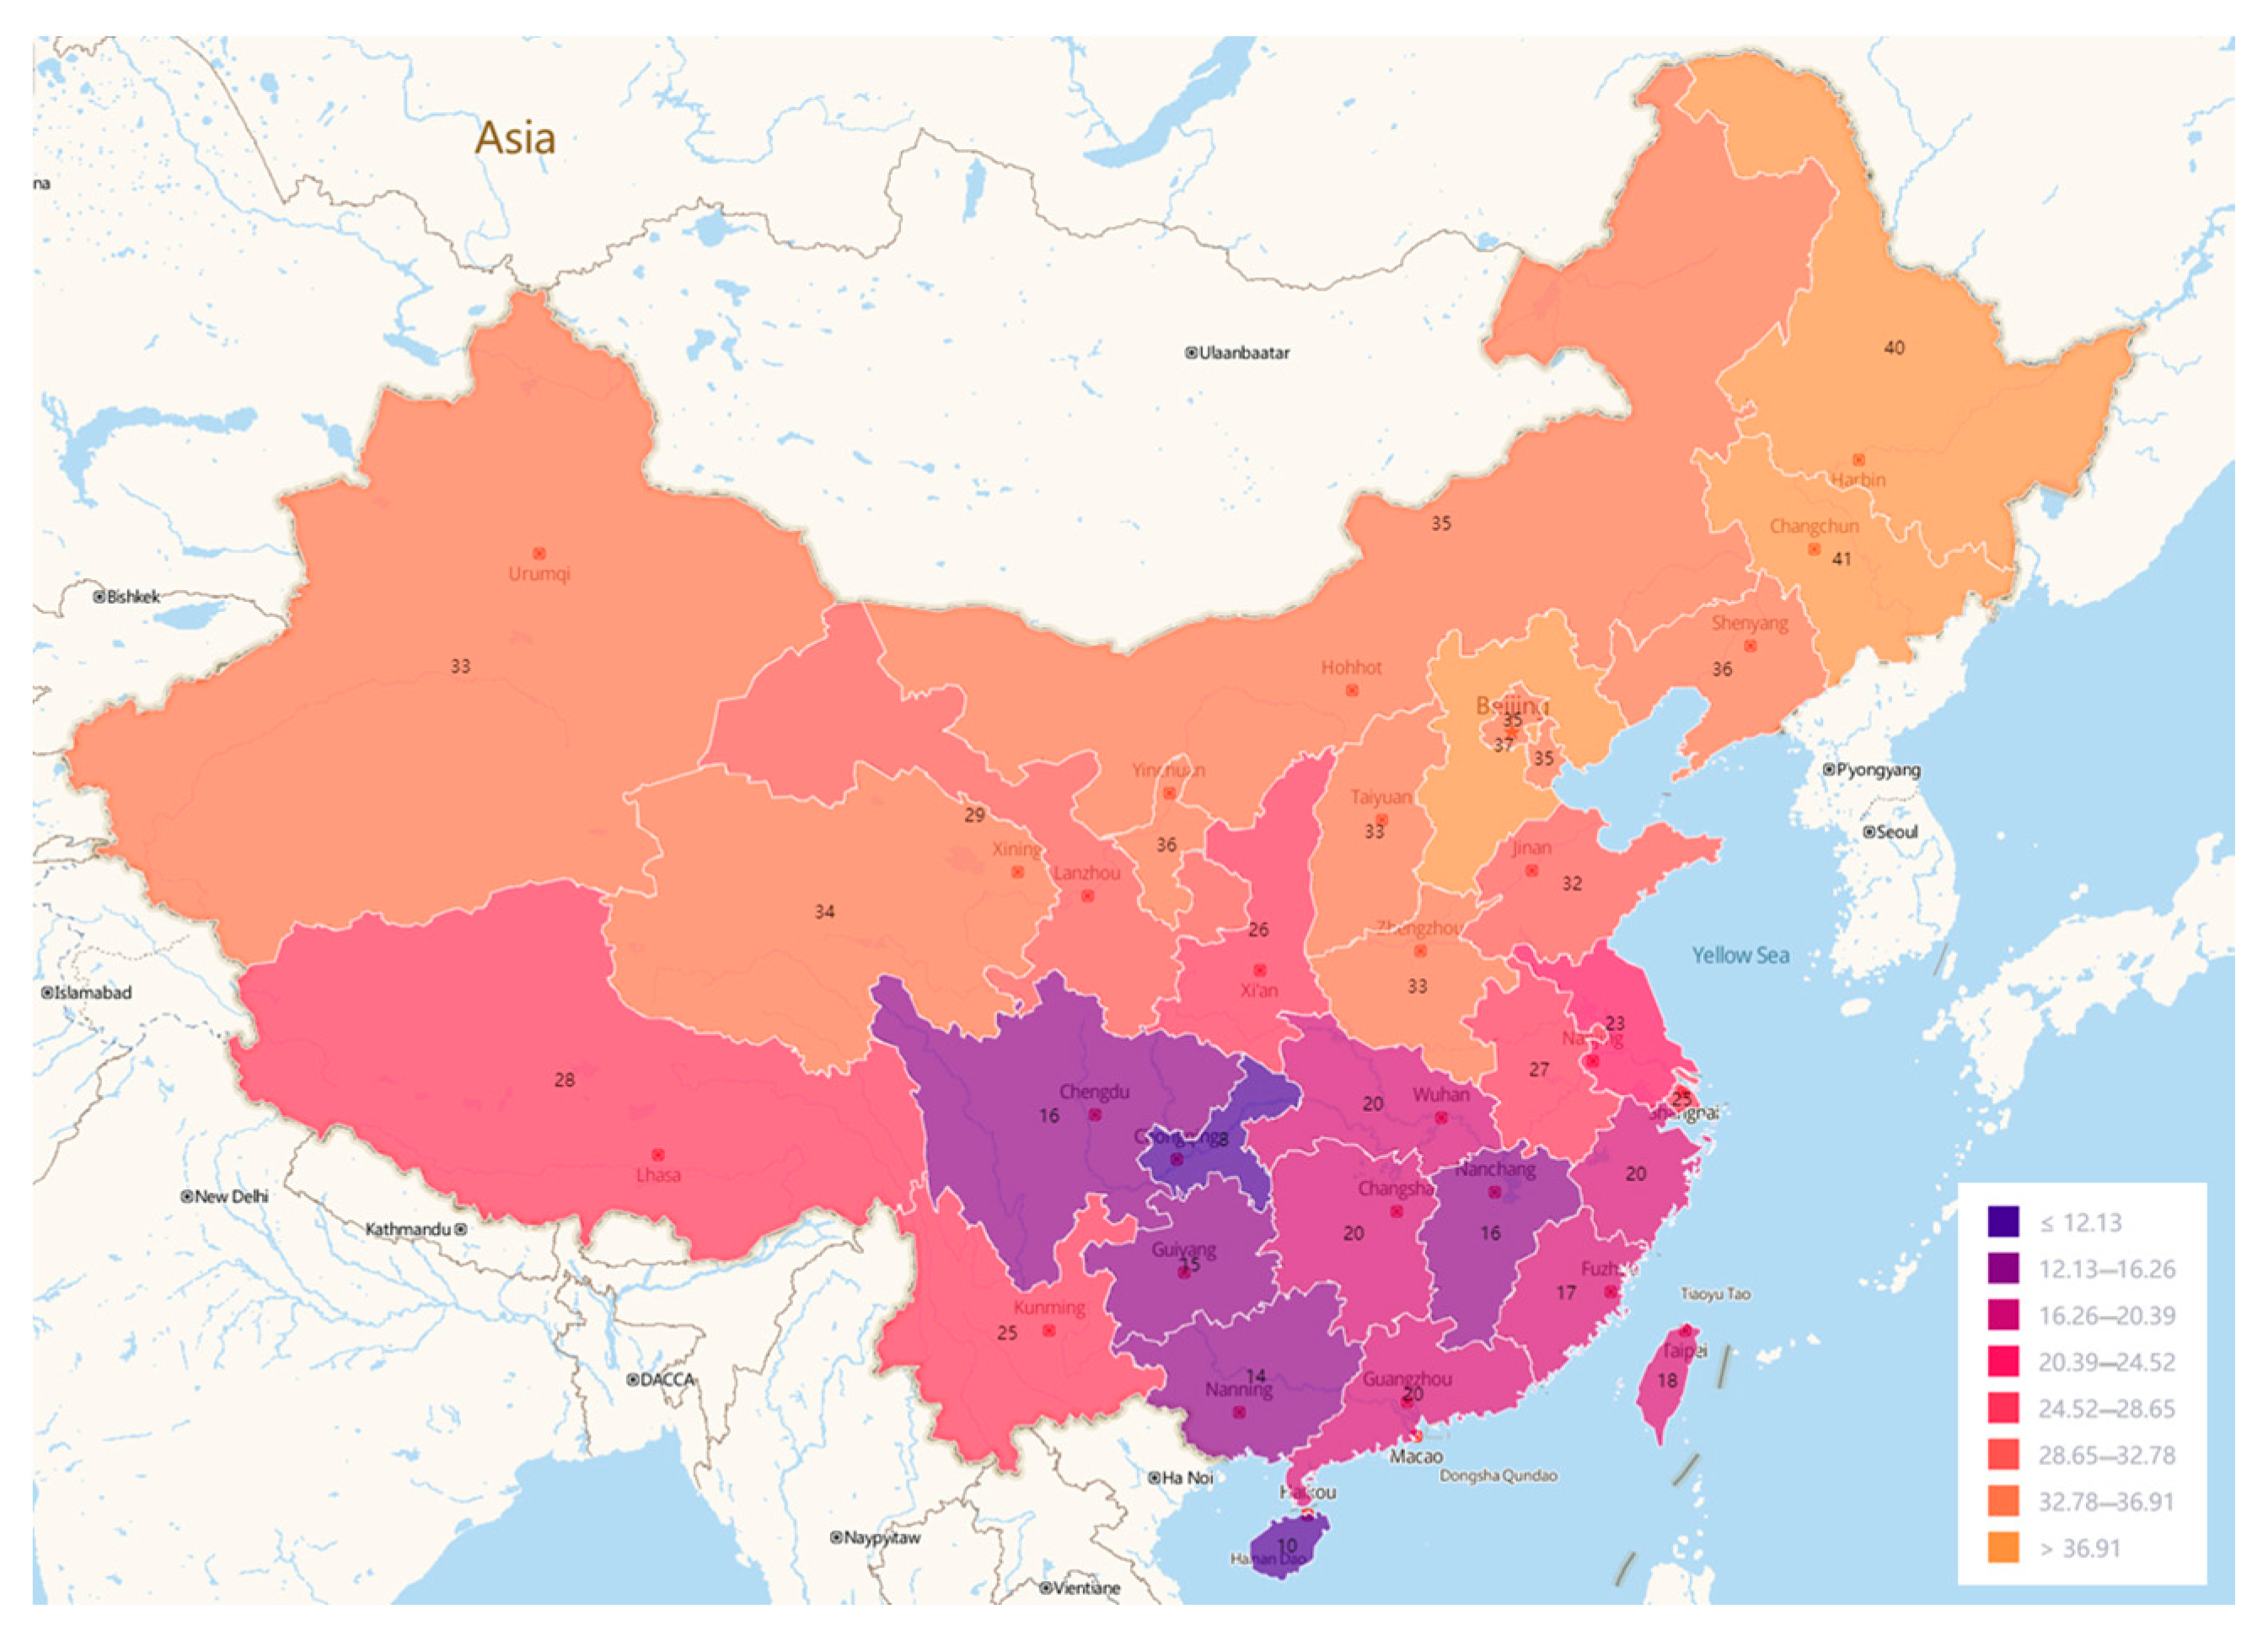
Figure 4 shows the average value of the optimal tilt angle for PV application in each region in China. Notice that these slant angles are facing to the south. It is observed that the optimal tilt angle decreases with decreasing latitude, but due to altitude and climate conditions, there are substantial differences in certain areas. A small optimal tilt angle is observed in the Chongqing Municipality, and the largest optimal tilt angle is observed in Heilongjiang Province. Sichuan and Guizhou provinces and the Chongqing Municipality occur at low altitudes and experience cloudy, rainy weather conditions throughout the year with a few sunny days. A long sunshine duration mainly occurs in summer, and the optimal tilt angle is relatively small. In the following analysis, Nanjing is chosen as a typical case to analyze its solar radiation yield at various inclination tilt angles in each month and year.
Figure 5 shows the monthly accumulated sunshine hours and sunshine percentage in Nanjing city, based on data from 2017 to 2019 recorded by the China Meteorological Administration [34]. The average monthly accumulated sunshine hours were obtained by averaging the data over these three years. The sunshine percentage was determined as the ratio of the actual sunshine hours to the possible sunshine hours (the number of sunshine hours on a cloudless day). Based on these historical sunshine data, the solar radiation intensity in each month was calculated.
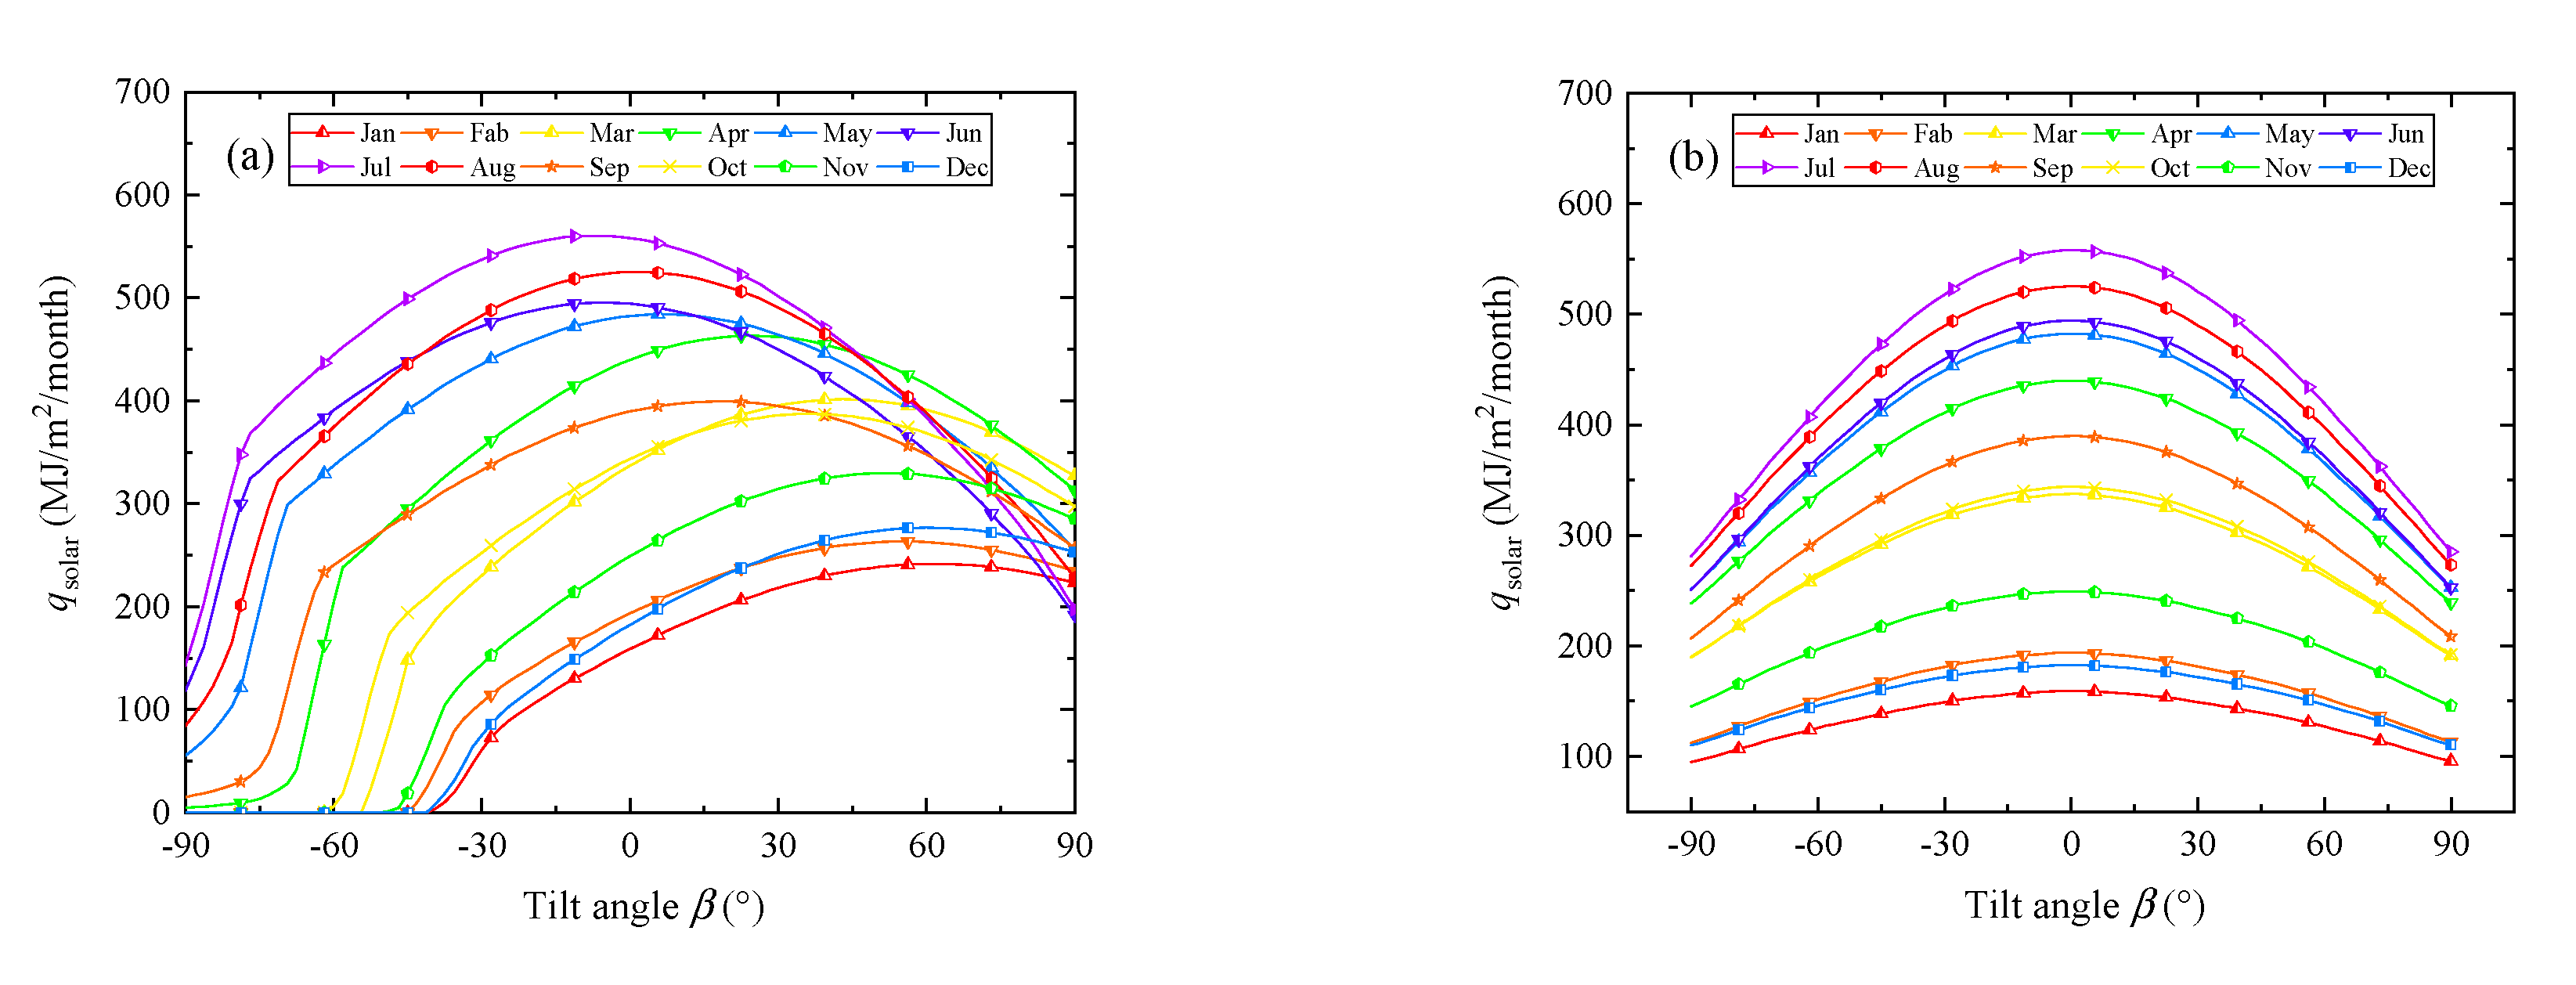
The monthly solar radiation intensity at various tilt angles in Nanjing city is shown in Figure 6. It should be noted that, as shown in Figure 6a, when the tilt angle is positive, the mounting angle is tilted to the south, and when the tilt angle is negative, the mounting angle is tilted to the north. Similarly, as shown in Figure 6b, a positive value of the tilt angle indicates an eastward tilt. It is observed that there are obvious differences in the monthly solar radiation intensity across the various tilt angles. As shown in Figure 6a, when the tilt angle increases from −90° to 90° (the direction changes from north to south), the monthly solar radiation intensity first increases and then decreases. The maximum monthly solar radiation intensity obtained is 560.25 MJ/m2/month at a tilt angle of −7.5°, which is tilted to the north. However, when the tilt angle is smaller than −30°, the monthly solar radiation intensity rapidly decreases. This occurs because direct solar radiation cannot reach the surface at these tilt angles at these times.
With the direction changing from west to east, the solar radiation intensity varies symmetrically with the tilt angle, and the intensity value ranges from 94.66 to 558.03 MJ/m2/month, as shown in Figure 6b. This indicates that solar radiation resources are available all year round from the east and west sides of the buildings.
Figure 7 shows the optimal tilt angle maximizing the solar radiation intensity in each month. With the direction changing from west to east, the fluctuation in the optimal tilt angle is not obvious. With the direction varying from north to south, the optimal tilt angle first decreases and then increases with increasing month. The optimal tilt angle is small in summer because the solar elevation angle is small.
Figure 8 shows the annual solar radiation intensity at various tilt angles in Nanjing city. With the direction changing from west to east, the solar radiation intensity varies symmetrically with the tilt angle. The optimal tilt angle approaches 0°, with a maximum solar radiation intensity of 4356.94 MJ/m2/year. With the direction varying from north to south, the solar radiation intensity first increases and then decreases with increasing tilt angle. The annual optimal tilt angle is 26°, with a maximum solar radiation intensity of 4585.99 MJ/m2/year.

4.2. Solar Energy Potential of Gymnasium Buildings with Symmetric Shapes

In this section, solar energy potential of gymnasium buildings with four typical symmetric roof shapes is analyzed: gymnasium buildings with hemispheroid, paraboloid, cone-type, and folded plate-type roofs. The structural parameters of these buildings are summarized in Table 2. Note that we assume that gymnasium buildings are constructed where they are not shaded by other buildings.
Figure 9 shows the annual solar radiation intensity of circular gymnasium buildings with various roof shapes. In regard to buildings with hemispherical roofs, as shown in Figure 9a, the variation in annual solar radiation intensity is very smooth. The high-radiation intensity area is mainly concentrated in the south direction, exhibiting a circular area. The maximum annual solar radiation intensity can reach 4585.99 MJ/m2/year at a tilt angle of 26°. Compared to the hemispheric roofs, the annual solar radiation intensity of parabolic roofs is more uniform, as shown in Figure 9b. The annual solar radiation intensity is up to 4500 MJ/m2/year in the southern area, and the minimum annual solar radiation intensity in the northern area still is higher than 3500 MJ/m2/year. In regard to buildings with cone roofs, as shown in Figure 9c, the tapered tip exerts a shielding effect on the north roof, leading to a notable decrease in solar radiation intensity in the middle of the north roof. Regarding buildings with folded plate-type roofs, as shown in Figure 9d, the roof panels facing south reveal a high radiation intensity, while those facing north exhibit a low radiation intensity, and the grooves between the panels demonstrate the lowest radiation intensity.
The monthly average solar radiation intensity of circular gymnasium buildings with the four roof shapes is shown in Figure 10. The average solar radiation intensity of buildings with hemispherical roofs is low throughout the year. This mainly occurs because the total area of the hemispherical roof reaches up to 11,127 m2, while the area with a high solar radiation intensity is only a part of it, as shown in Figure 9a. The roof shapes exhibiting a high monthly average solar radiation intensity are paraboloid and cone-type roofs. Maximum monthly solar radiation occurred on the cone-type roof in July, reaching 544.08 MJ/m2/month, relatively higher than that occurring on the paraboloid-type roof, which reaches 541.84 MJ/m2/month. The monthly average solar radiation intensity of buildings with cone-type roofs is high mainly because the total roof area is the smallest, only 7212.9 square metres, while the high-radiation area is not much smaller than that of the other shapes, as shown in Figure 9.
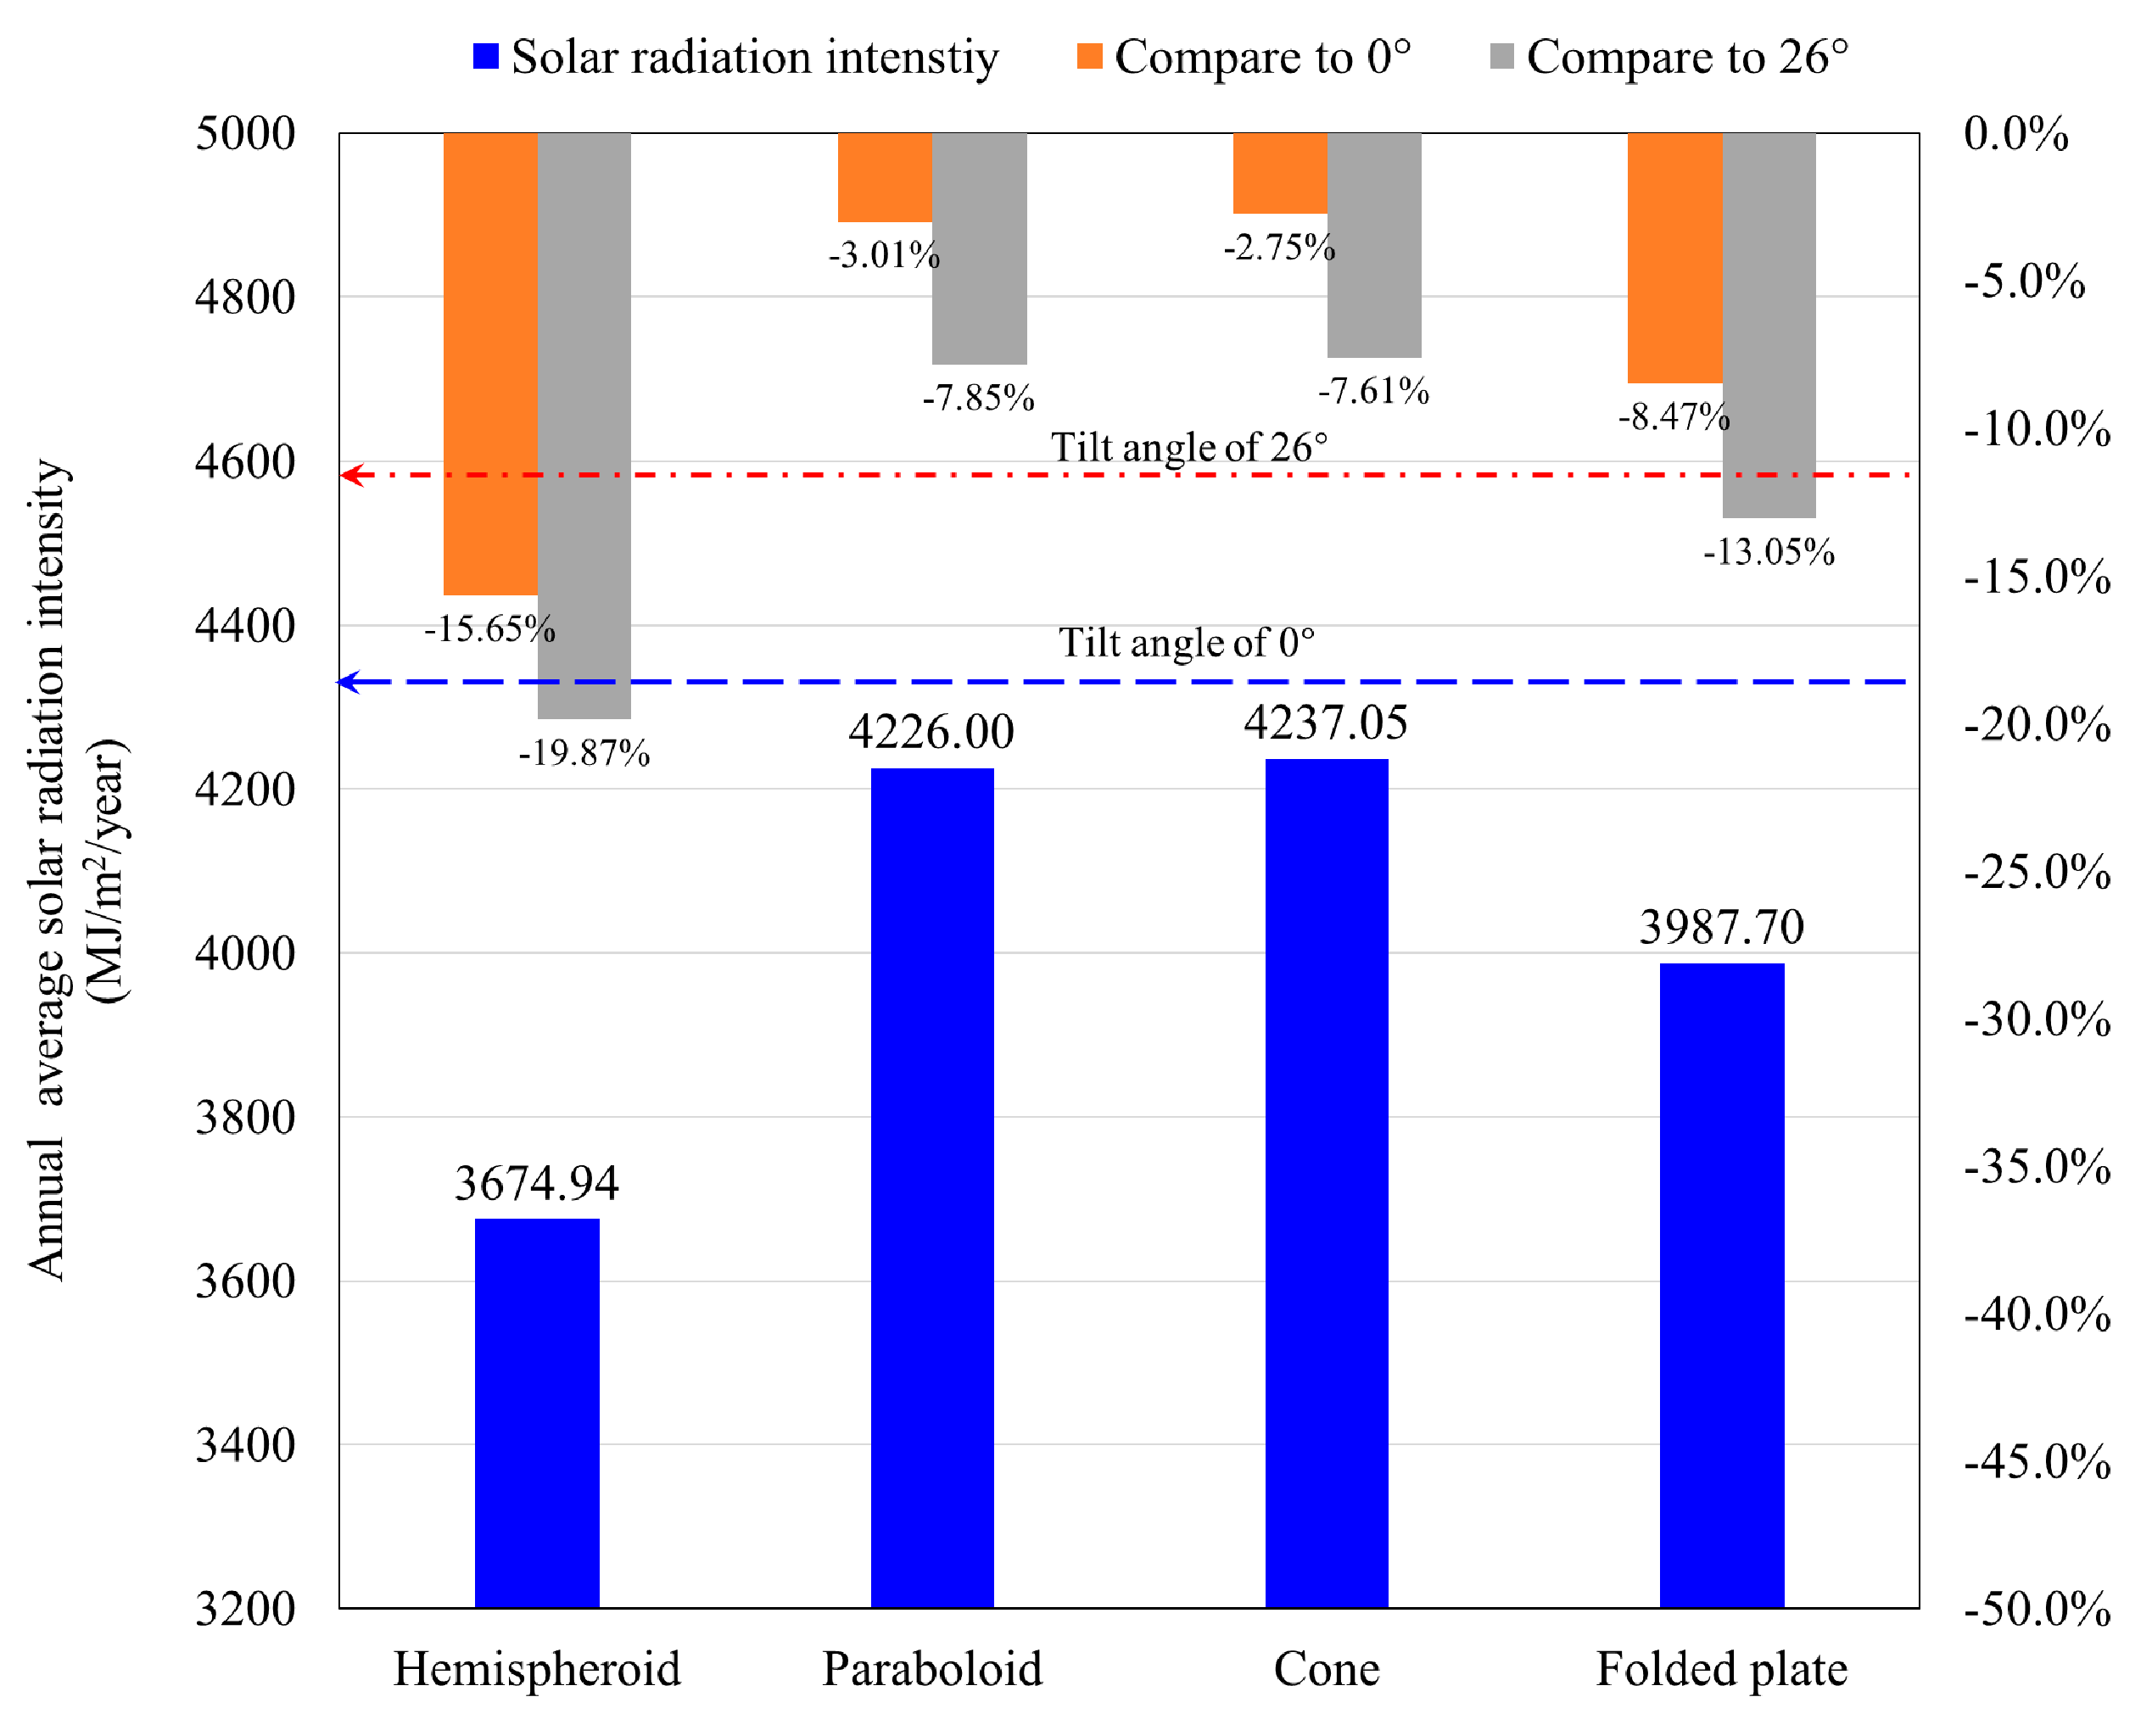
The average annual solar radiation intensity of circular gymnasium buildings with these four roof shapes is shown in Figure 11.
Maximum annual solar radiation occurred on the cone-type roof, reaching 5237.05 MJ/m2/year, relatively higher than that occurring on the paraboloid-type roof, which amounts to 4226.0 MJ/m2/year, but still lower than that at a tilt angle of 0°, reaching 4356.94 MJ/m2/year. Compared to the surface at the optimal tilt angle, the hemispheroid-type roof exhibited the largest decrease in the annual average solar radiation intensity, reaching −20.42%. This implies that the yield of a building with a hemispherical roof with PV panels installed at any given tilt angle other than the optimal tilt angle would generally be much smaller than that at the optimal tilt angle. Therefore, it is necessary to determine the installation range of PV panels according to the average annual radiation intensity distribution of the roof to reduce investment costs.

4.3. Solar Energy Potential of Rectangular Gymnasium Buildings

In this section, the solar energy potential of rectangular gymnasium buildings with four typical roofs is analyzed: single-slope, double-slope, arch-type, and folded plate-type roofs. To facilitate comparative analysis, a 100 m × 60 m rectangle is selected as the ground floor plan of the building, and the structural parameters of these buildings are listed in Table 3. Note that we assume that these gymnasium buildings are built where they receive no shade from other buildings.
Figure 12 shows the annual solar radiation intensity of rectangular gymnasium buildings with various roof shapes.
The 3D annual solar radiation intensity map clearly shows that the solar potential of the roof and vertical exterior walls is vastly different. The solar radiation intensity of the ground and roof is higher than 3200 MJ/m2/year, while that of the vertical walls of the building is usually lower than 2500 MJ/m2/year. The average solar radiation over a year reaching a horizontal surface amounts to 4356.94 MJ/m2/year.
In regard to buildings with single-slope roofs, as shown in Figure 12a, the annual solar radiation intensity of the southward roof increases with increasing tilt angle. It is clear that, regardless of the architectural aesthetics, the annual solar radiation benefits are the highest when the slope of the single-slope building roof is consistent with the optimal tilt angle. Regarding buildings with double-slope roofs, as shown in Figure 12b, the annual radiation benefits of these roofs are even lower than those of unsheltered horizontal planes. The average annual radiation intensities of the eastward and westward roofs are 4235.24 and 4232.47 MJ/m2/year, respectively. In terms of buildings with arch-type roofs, as shown in Figure 12c, the maximum annual solar radiation intensity occurs at the top surface, where the surface tilt angle approaches 0°, while the minimum annual solar radiation intensity is found along the bottom edge. The folded plate-type roof is shown in Figure 12d, and a distinct difference is observed between the southward and northward roofs. The maximum and minimum annual solar radiations reaching the roof surface are 4573.68 and 3284.67 MJ/m2/year, respectively, both dependent on the shape of the folded plate (Figure 12d) because the tilt angle of the southward surface is close to the annual optimal tilt angle (26°, as shown in Figure 5), while the tilt angle of the northward surface is negative.
The monthly average solar radiation intensity of rectangular gymnasium buildings with the above four roof shapes is shown in Figure 13. In the Nanjing area, the average radiation intensity of these roof types is relatively high from April to August, and the average radiation intensity reaches over 400 MJ/m2/month. The solar radiation intensity is relatively low in January, February, and December, with the average solar radiation below 200 MJ/m2/month. The average solar radiation intensity of buildings with single-slope roofs is the highest from January to April and from October to mid-December. From May to September, the average solar radiation intensity of the V- and F-shaped roofs is relatively high. The solar altitude is high in summer, and nearly horizontal roof surfaces exhibit a high average solar radiation intensity. The solar altitude is low in winter, and roofs tilted southward exhibit a high average solar radiation intensity. Maximum monthly solar radiation occurs on the arch-type roof in July, reaching 528.79 MJ/m2/month. The minimum monthly solar radiation is observed from the folded plate-type roof in January, only reaching 528.79 MJ/m2/month.
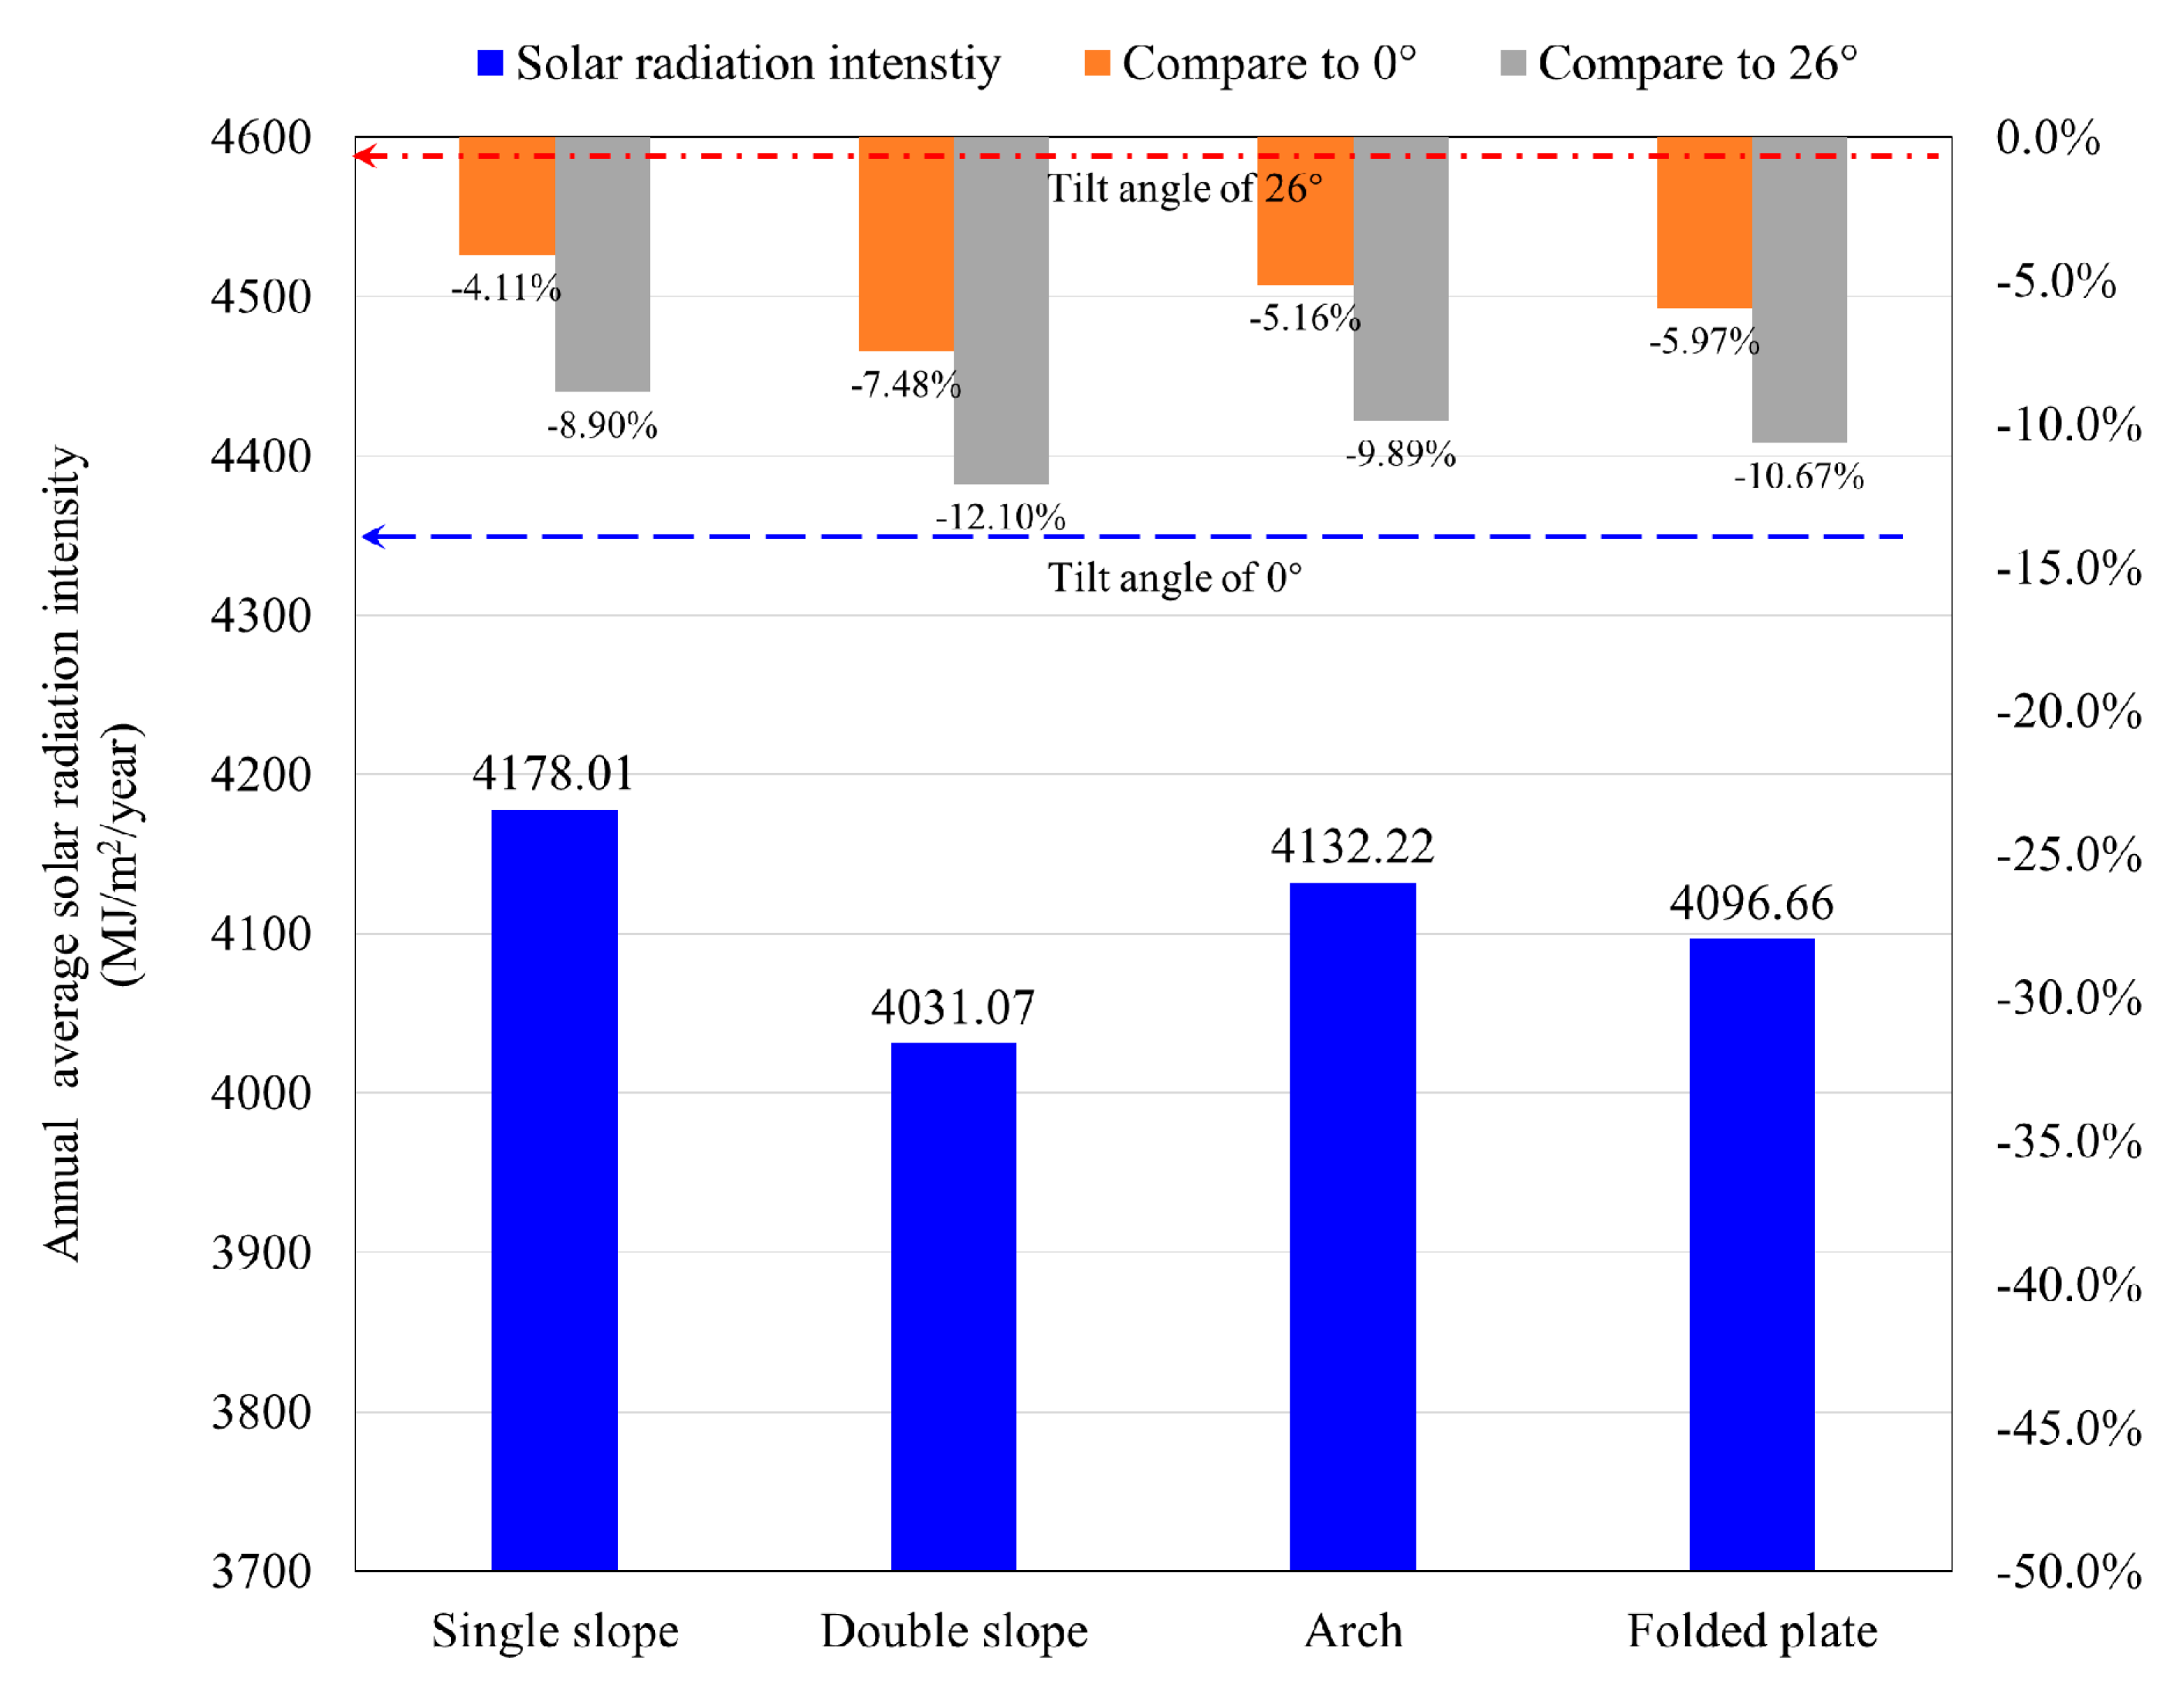
The annual average solar radiation intensity of rectangular gymnasium buildings with these four roof shapes is shown in Figure 14. It is evident that the annual average solar radiation intensities of the above roof shapes are all lower than that of a horizontal surface. This demonstrates that for the same PV panel area, the benefits of installing them on the roof are lower than those of installing them horizontally. Figure 14 also shows the decrease proportion of the solar radiation intensity of these roofs compared to that at a tilt angle of 0° and 26°. The maximum annual average solar radiation intensity is 4178.01 MJ/m2/year obtained by the building with the single-slope roof, while the average solar radiation over a year reaching a horizontal surface amounts to 4356.94 MJ/m2/year, a decrease of 4.11%. Compared to the optimal tilt angle, the double-slope roof exhibits the maximum decrease in the annual average solar radiation intensity, reaching −12.10%. This indicates that the double-slope roof may not be the best option when considering the symmetrical placement of PV panel matrices.

4.4. Solar Energy Potential of Elliptical Gymnasium Buildings

In this section, solar energy potential of elliptical gymnasium buildings with four typical roofs is analyzed. Four typical roof shapes were analyzed: ellipsoid, vertical ridge, funnel and saddle-type roofs. To allow comparative analysis, an ellipse with a long axis of 60 m and a short axis of 30 m is selected as the ground floor plan of the building, and the structural parameters of these buildings are provided in Table 4. Note that we assume that the designer wants the PV panel installation area to be symmetrical, and we only analyze the case where the tip of the ellipse faces south.
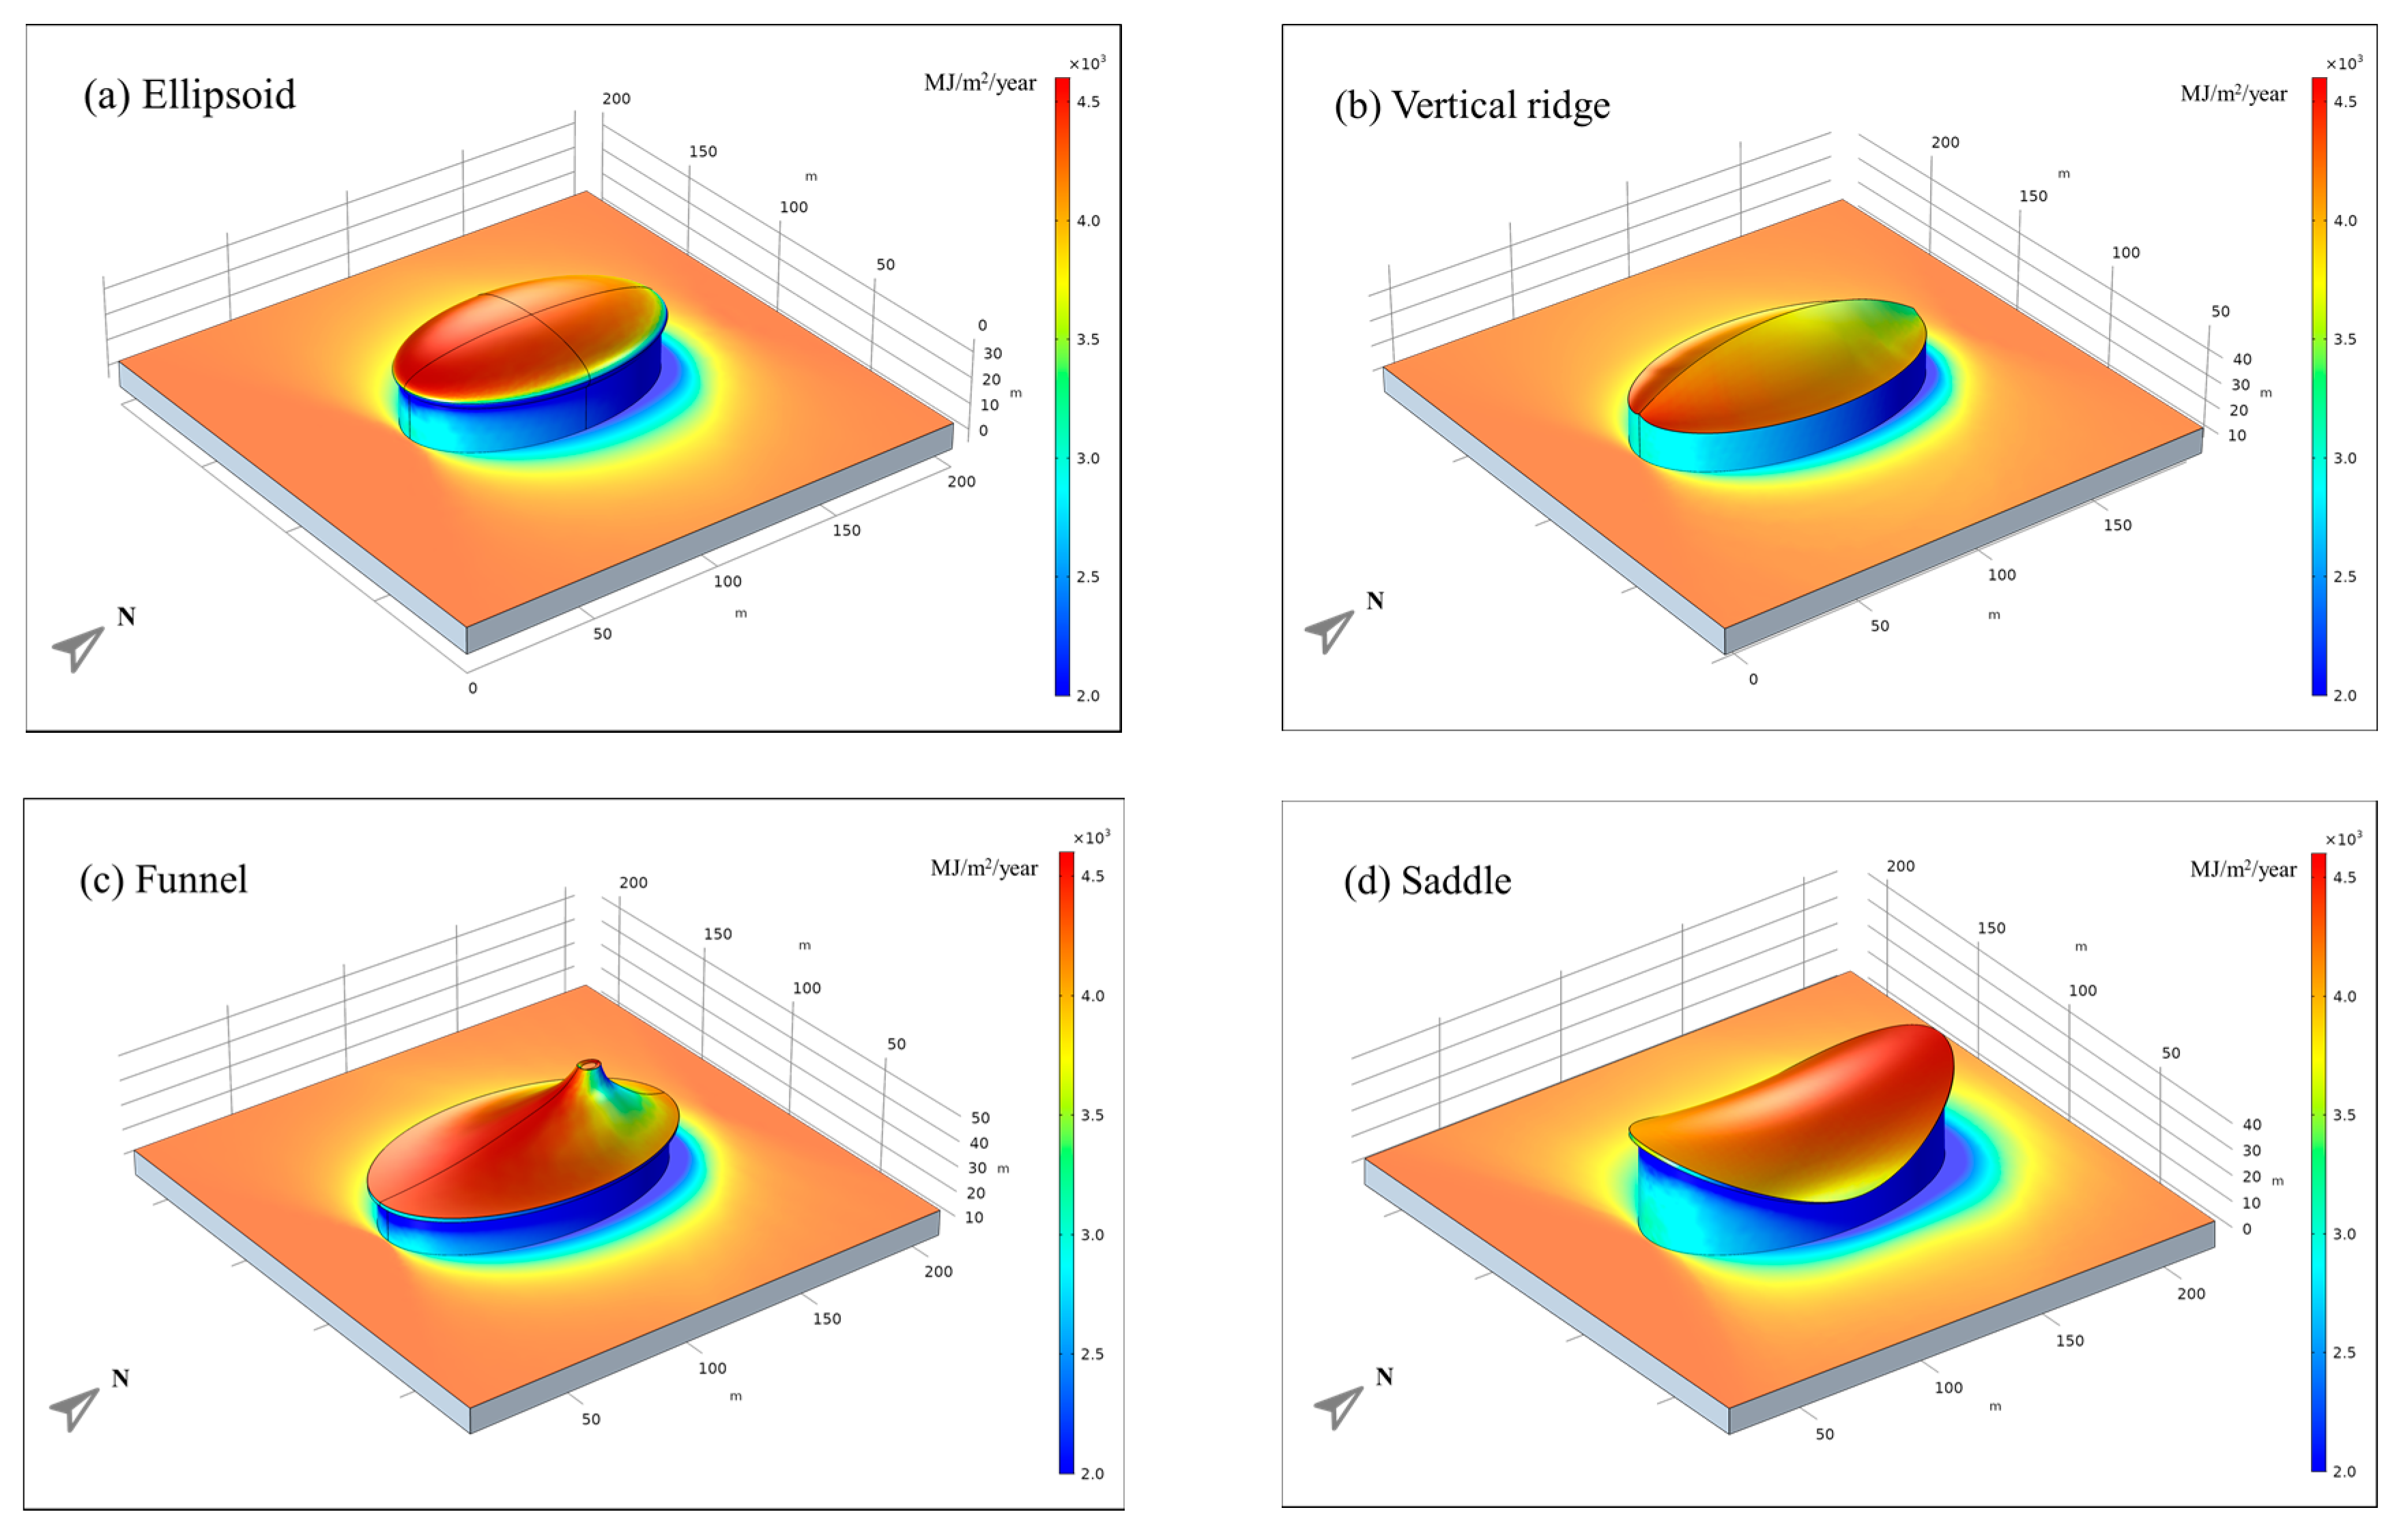
Figure 15 shows the annual solar radiation intensity of elliptical gymnasium buildings with various roof shapes. In regard to elliptical buildings, as shown in Figure 15a, most of the roof areas exhibit a solar radiation intensity above 4000 MJ/m2/year, with only the northern section and roof edges revealing a low solar radiation intensity. However, regarding buildings with vertical ridge roofs, as shown in Figure 15b, the areas with a high solar radiation intensity are much smaller. The two sides of the roof facing east and west exhibit low annual radiation levels. For buildings with funnel-type roofs, as shown in Figure 15c, the south-facing roof area is large because of the funnel shape. In the middle of the sloping roof, the maximum annual solar radiation intensity reaches 4580 MJ/m2/year as the surface tilt angle approaches 26°. However, in the northern part of its chimney, the annual solar radiation intensity sharply decreases to below 2000 MJ/m2/year, so that it is not recommended to install solar PV panels. Compared to the other roofs with sharp angles, the radiation intensity distribution of the saddle-type roof is more uniform, and the average intensity is relatively high. All roof areas reveal annual solar radiation intensities above 3700 MJ/m2/year. However, the southern roof slopes to the north, reducing the annual solar radiation yield to a certain extent.
The monthly average solar radiation intensity of elliptic gymnasium buildings with the four roof shapes is shown in Figure 16. As expected, the average solar radiation intensity throughout the year of the vertical ridge roof is low because only a small roof area is tilted towards the south. The saddle-type roof exhibits the highest average solar radiation intensity each month, which occurs due to its wide range of angles maximizing the solar radiation received at different altitude angles. The maximum monthly solar radiation reaches 536.97 MJ/m2/month in July for the saddle-type roof, relatively higher than that of the funnel-type roof, which amounts to 525.18 MJ/m2/month.
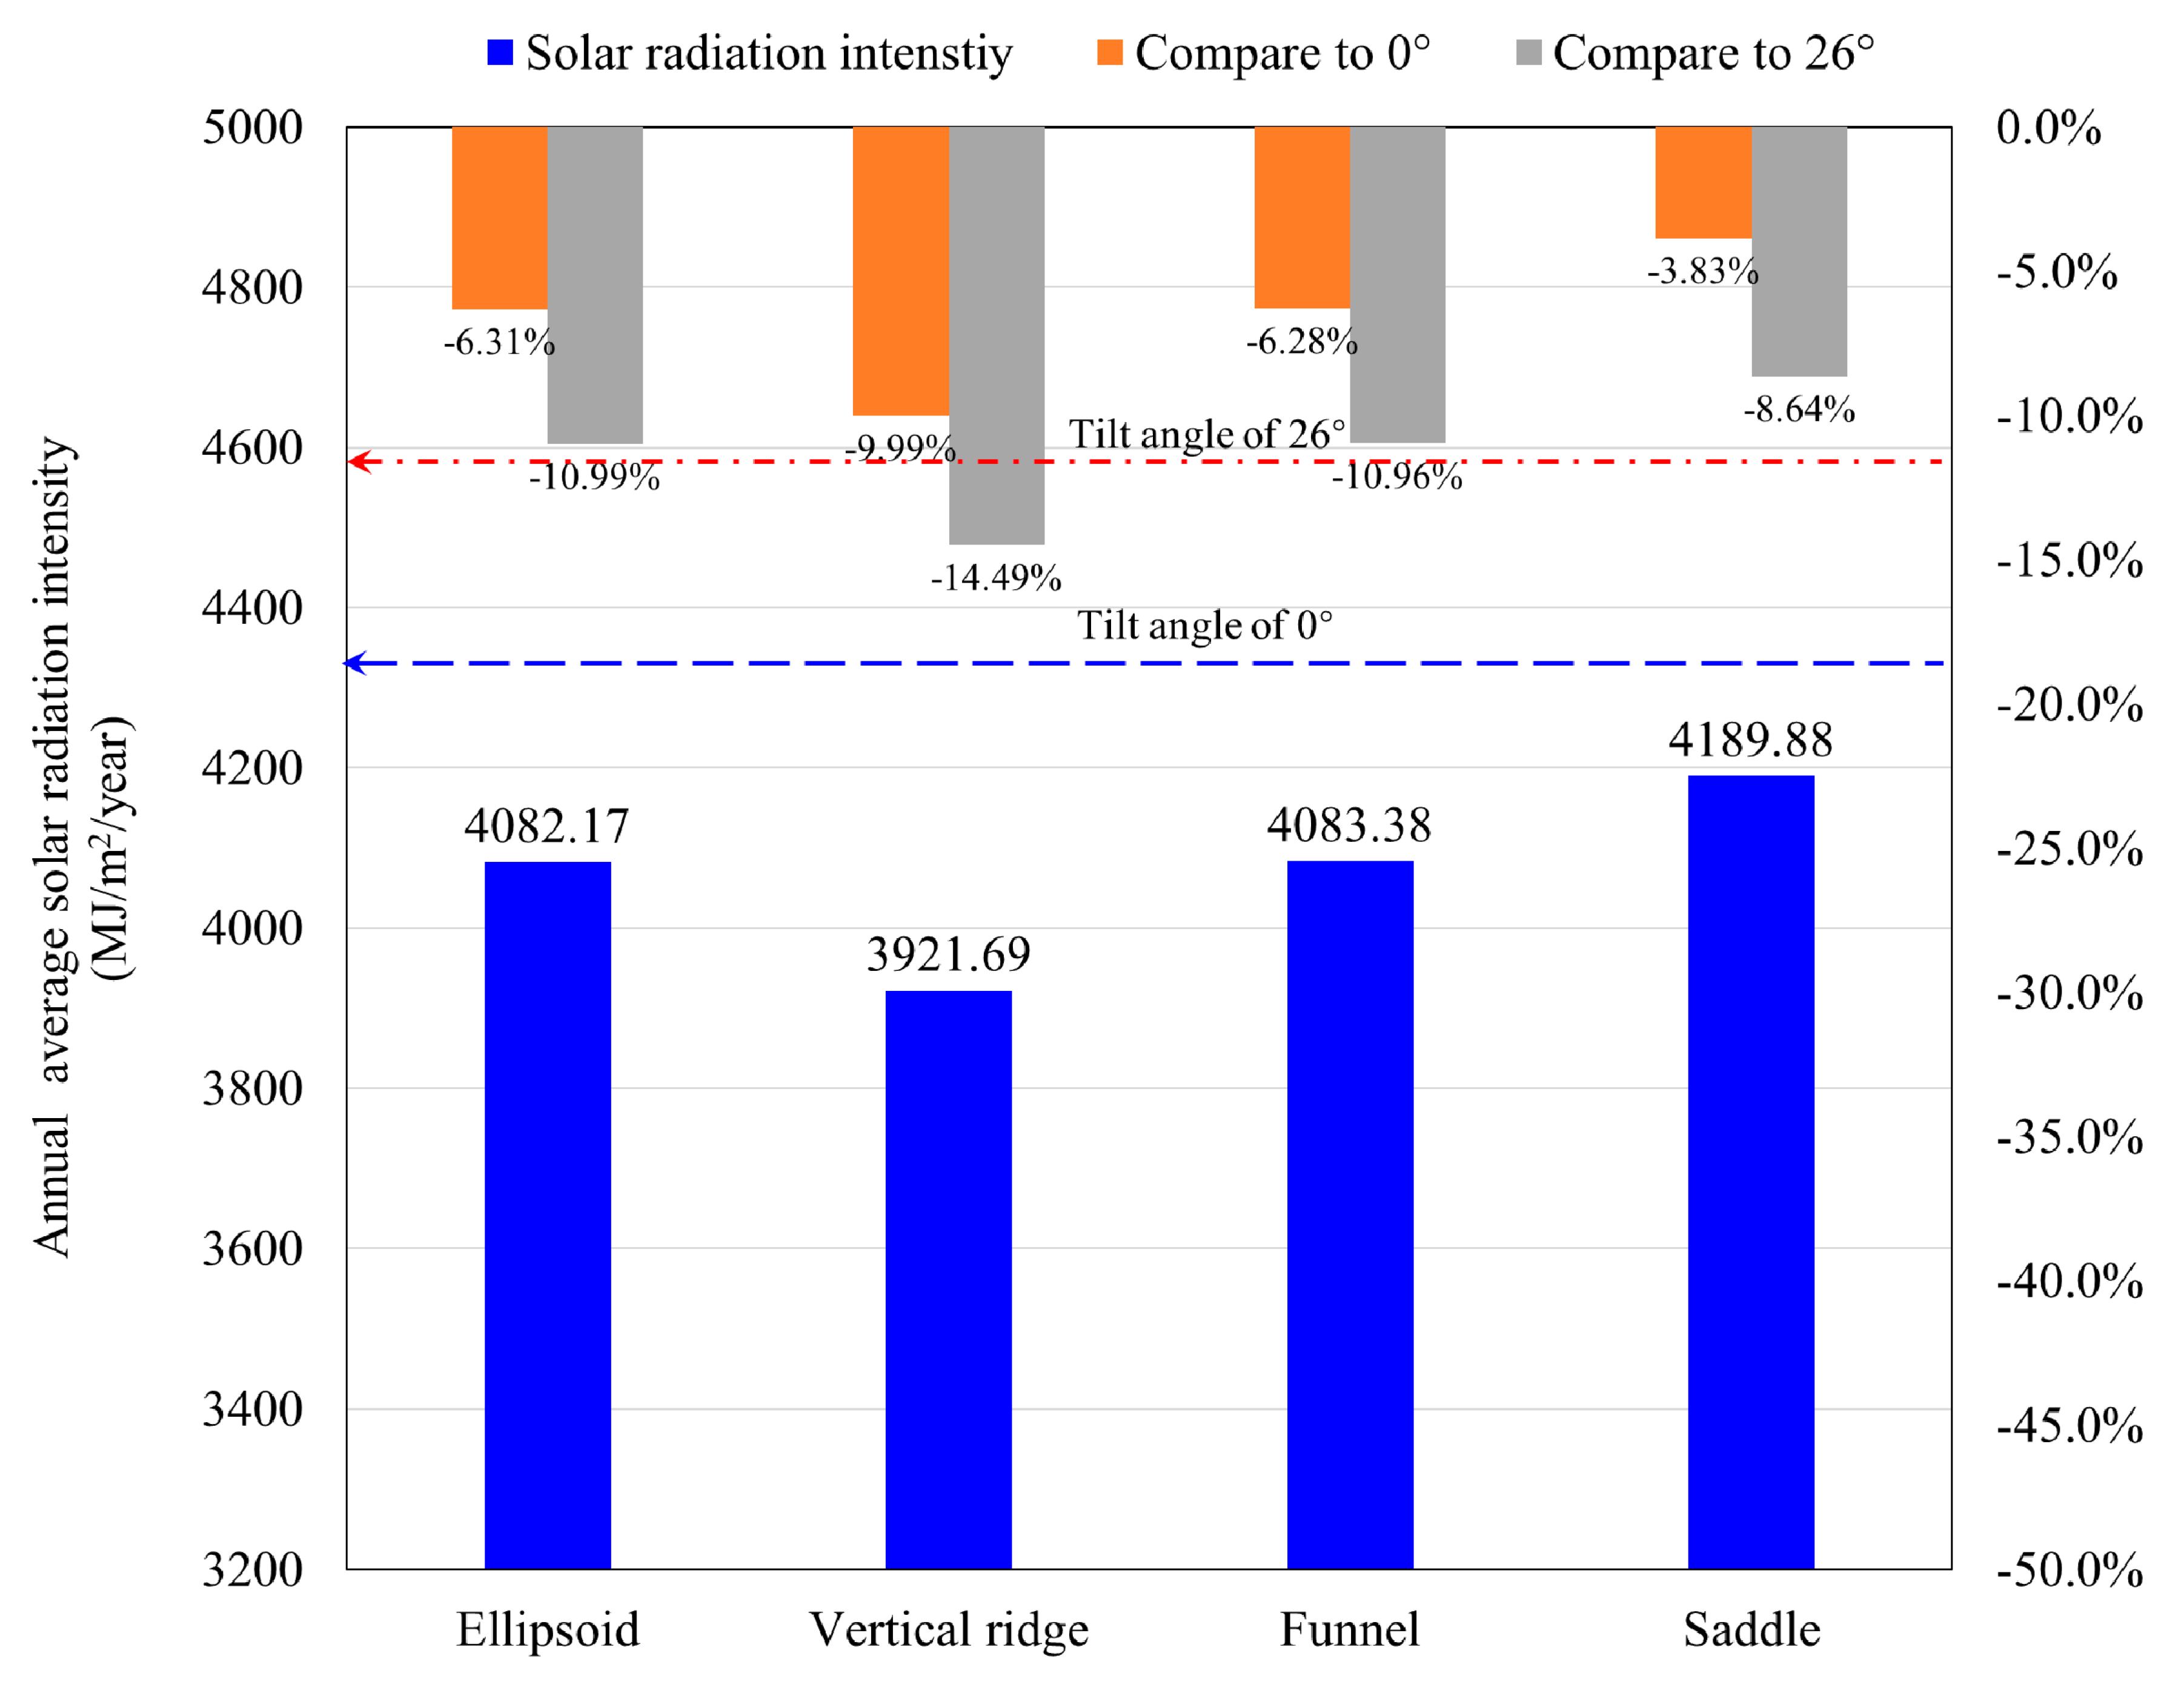
The annual average solar radiation intensity of elliptical gymnasium buildings with these four roof shapes is shown in Figure 17. The annual radiation intensities of the ellipsoid- and funnel-type roofs are very similar, reaching 4082.17 and 4083.38 MJ/m2/year, respectively. The maximum annual solar radiation intensity occurs on the saddle-type roof, which reaches 4189.88 MJ/m2/year, while the annual solar radiation intensity of the vertical ridge-type roof only amounts to 3921.69 MJ/m2/year. Compared to the surface at the optimal tilt angle, the vertical ridge-type roof revealed the largest decline in the annual average solar radiation intensity, reaching −14.49%. Therefore, roofs resembling the double-slope roof should consider tilting their PV panels southward to receive more solar radiation.

5. Conclusions

In this paper, an investigation of the geometric shape effects on the solar potential of gymnasium buildings was conducted. A three-dimensional radiation transfer model coupled with historical meteorological data was established to estimate the real-time solar potential of building roofs. The rooftop solar potential of three different building foundation shapes and different types of roof shapes that have evolved over time was systematically analyzed. Annual solar potential cloud maps of these gymnasium buildings were generated. The monthly and annual average solar radiation intensities of the different types of roof shapes were analyzed and compared to those of a roof surface at the local optimal tilt angle and a horizontal roof surface. The following conclusions were obtained:
(1)
In the same region, the optimal tilt angle varies widely in each month. In the Northern Hemisphere, the optimal tilt angle is small in summer and large in winter because the solar elevation angle varies with the season. This implies that at fixed PV panel installation angles, it is difficult to obtain the maximum radiation benefits in each season, which explains the fact that PV roofs are generally not as profitable as expected.
(2)
The annual radiation intensity of the building facade is much lower than that of the horizontal roof surface. Selecting the Nanjing area as an example, the average solar radiation reaching horizontal surfaces over a year is 4356.94 MJ/m2/year, while that reaching vertical building walls is usually lower than 2500 MJ/m2/year.
(3)
For rectangular gymnasium buildings, the annual solar radiation intensity of sloped roofs is relatively high. Regardless of the architectural aesthetics, the annual solar radiation benefits are the highest when the angle of the single-slope roof is consistent with the optimal tilt angle.
(4)
For circular gymnasium buildings, the average annual radiation intensity of hemispherical roofs is relatively low because the total surface area is large, and there are few areas with high radiation intensity. Compared to the surface at the optimal tilt angle, the hemispherical roof exhibits the largest decrease in the annual average solar radiation intensity, reaching –20.42%.
(5)
For elliptical gymnasium buildings, the saddle-type roof exhibits a high solar potential due to its wide range of angles, and the solar radiation at different altitude angles can be suitably utilized. Its annual radiation intensity reaches 4189.88 MJ/m2/year, which is only 3% lower than the horizontal surface radiation intensity and 8.64% lower than the radiation intensity of a surface at the optimal angle.
(6)
Compared to the optimal tilt angle, the maximum decline in the average radiation intensity reaches 20%, and the minimum decrease is 8.64% for all types of building shapes. The variability is as high as 11.78%.
In summary, to increase the solar radiation benefits and reduce the construction costs, the influence of the basic geometric shape should be considered in the design of integrated PV gymnasium buildings. The results presented in this work are essential for clarifying the effects of the geometric shapes of gymnasium buildings on the solar potential of their roofs, which provides an important reference for PV integrated building design.

Author Contributions

Conceptualization, L.J. and W.L.; methodology, L.J. and W.L.; software, J.L.; formal analysis, H.L.; resources, H.L.; data curation, H.L. and J.L.; writing—original draft preparation, writing—review and editing, L.J.; visualization, L.J.; supervision, project administration, W.L.; funding acquisition, L.J. and H.L. All authors have read and agreed to the published version of the manuscript.

Funding

This research was funded by the Science and Technology Project of the Ministry of Housing and Construction of China (Grant NO. K12018230).

Conflicts of Interest

The authors declare no conflict of interest.

Nomenclature

Abbreviations
ArRoof area (m2)
DEMDigital elevation model
FView factor
GIrradiance (W/m2)
GambAmbient irradiance (W/m2)
GISGeographic information system
GmMutual irradiance originating from the other surfaces (W/m2)
GsolarSolar irradiance (W/m2)
hHour angle or local solar time (h)
iIncident angle (°)
IRadiation flux (W/m2)
JRadiosity (W/m2)
LLocal latitude
LiDARLight detection and ranging
MAir mass coefficient
nDay of a year starting on 1 January
PVPhotovoltaic
qHeat flux (W/m2)
QRadiant power (W)
SDMDigital surface model
tTime
Greek symbols
αAltitude angle (°)
εEmissivity
γDeviation angle (°)
βTilt angle (°)
δSun declination (°)
θZenith angle (°)
φAltazimuth angle (°)
ρReflectivity
τTransmissivity

References

  1. Gaglia, A.G.; Dialynas, E.N.; Argiriou, A.A.; Kostopoulou, E.; Tsiamitros, D.; Stimoniaris, D.; Laskos, K.M. Energy performance of European residential buildings: Energy use, technical and environmental characteristics of the Greek residential sector-energy conservation and CO_2 reduction. Energy Build. 2019, 183, 86–104. [Google Scholar] [CrossRef]
  2. Amasyali, K.; El-Gohary, N.M. A review of data-driven building energy consumption prediction studies. Renew. Sustain. Energy Rev. 2018, 81, 1192–1205. [Google Scholar] [CrossRef]
  3. Zuo, J.; Zhao, Z.Y. Green building research–current status and future agenda: A review. Renew. Sustain. Energy Rev. 2014, 30, 271–281. [Google Scholar] [CrossRef]
  4. GhaffarianHoseini, A.; DalilahDahlan, N.; Berardi, U.; GhaffarianHoseini, A.; Makaremi, N.; Hoseini, M.G. Sustainable energy performances of green buildings: A review of current theories, implementations and challenges. Renew. Sustain. Energy Rev. 2013, 25, 1–17. [Google Scholar] [CrossRef]
  5. Fang, X.; Li, D. Solar photovoltaic and thermal technology and applications in China. Renew. Sustain. Energy Rev. 2013, 23, 330–340. [Google Scholar] [CrossRef]
  6. Sharma, P.; Duttagupta, S.P.; Agarwal, V. A Novel Approach for Maximum Power Tracking from Curved Thin-Film Solar Photovoltaic Arrays Under Changing Environmental Conditions. IEEE Trans. Ind. Appl. 2014, 50, 4142–4151. [Google Scholar] [CrossRef]
  7. Nelson, J. Organic photovoltaic films. Curr. Opin. Solid State Mater. Sci. 2002, 5, 20–27. [Google Scholar]
  8. Wang, S.Q.; Ke, Y. Risk Management of Infrastructure Projects in China with Case Study of the National Stadium. In Proceedings of the Inaugural Conference on Construction Law and Economics Circle in Asia and Pacific, Kyoto, Japan, 27–28 October 2008. [Google Scholar]
  9. Jordana, S. Taiwan Solar Powered Stadium. 2013. Available online: https://www.archdaily.com/22520/taiwan-solar-powered-stadium-toyo-ito (accessed on 1 December 2020).
  10. National Stadium, in Brasilia-Stadium of the World Cup 2014. 2012. Available online: http://www.aboutbrasilia.com/worldcup/stadium (accessed on 1 December 2020).
  11. Marafao, F.P.; Matheus, D.S.A.; Augusto, F.A.S.; Goncalves, H.K.; Morales Paredes, A.C.G.; Martins, D.I.J.; Brandao, D.I. Trends and Constraints on Brazilian Photovoltaic Industry: Energy Policies, Interconnection Codes and Equipment Certification. IEEE Trans. Ind. Appl. 2018, 54, 4017–4027. [Google Scholar] [CrossRef]
  12. Ferreira, A.; Sheila, S.K.; Kátia, C.F.; de Souza, T.A.; Tonezer, C.; Santos, G.R.D.; Coimbra-Araújo, C.H. Economic overview of the use and production of photovoltaic solar energy in brazil. Reviews 2018, 81, 181–191. [Google Scholar] [CrossRef]
  13. Stadiums of the World Cup 2014. Available online: http://www.v-brazil.com/world-cup/stadium (accessed on 1 December 2020).
  14. Papamanolis, N. An overview of solar energy applications in buildings in Greece. Int. J. Sustain. Energy 2016, 35, 814–823. [Google Scholar] [CrossRef]
  15. Redweik, P.; Catita, C.; Brito, M. Solar energy potential on roofs and facades in an urban landscape. Sol. Energy 2013, 97, 32–341. [Google Scholar] [CrossRef]
  16. Kodysh, J.B.; Omitaomu, O.A.; Bhaduri, B.L.; Neish, B.S. Methodology for estimating solar potential on multiple building rooftops for photovoltaic systems. Sustain. Cities Soc. 2013, 8, 31–41. [Google Scholar] [CrossRef]
  17. Li, Y.; Liu, C. Estimating solar energy potentials on pitched roofs. Energy Build. 2017, 139, 101–107. [Google Scholar] [CrossRef]
  18. Li, Y.; Liu, C. Revenue assessment and visualisation of photovoltaic projects on building envelopes. 2018, 182, 177–186. [Google Scholar] [CrossRef]
  19. Li, Y.; Ding, D.; Liu, C.; Wang, C. A pixel-based approach to estimation of solar energy potential on building roofs. Energy Build. 2016, 129, 463–473. [Google Scholar] [CrossRef]
  20. Hachem, C.; Athienitis, A.; Fazio, P. Parametric investigation of geometric form effects on solar potential of housing units. Sol. Energy 2011, 85, 1864–1877. [Google Scholar] [CrossRef]
  21. Wetland Research and Education Center. 2020. Available online: https://www.gooood.cn/topic-dongtan-research-and-education-center.htm?tdsourcetag=s_pctim_aiomsg (accessed on 1 December 2020).
  22. The Ariake Gymnastics Centre. 2019. Available online: https://www.gooood.cn/ariake-gymnastics-centre-by-nikken-sekkei-ltd.htm (accessed on 1 December 2020).
  23. Visionary Legacy Olympic Venue Catalyzes Urban Redevelopment. 2020. Available online: https://www.cannondesign.com/our-work/work/city-of-richmond-richmond-olympic-oval/ (accessed on 1 December 2020).
  24. Gymnasium of International Christian University. 2020. Available online: https://www.gooood.cn/icu-new-physical-education-center-by-kengo-kuma-and-associates.htm (accessed on 1 December 2020).
  25. Odate Jukai Dome. 2020. Available online: https://www.makmax.com/applications/sports/odate_juki_dome.html (accessed on 1 December 2020).
  26. Suzhou olympic Sports Centre. Available online: https://www.szosc.cn/ (accessed on 1 December 2020).
  27. Sekularac, N.; Ivanovic-Sekularac, J.; Cikic-Tovarovic, J. Folded structures in modern architecture. Facta Univ. Ser. Archit. Civ. Eng. 2012, 10, 1–16. [Google Scholar] [CrossRef] [Green Version]
  28. Kalogirou, S. Solar Energy Engineering: Processes and Systems, 2nd ed.; Academic Press: Cambridge, MA, USA, 2009. [Google Scholar]
  29. Kumar, L.; Skidmore, A.K.; Knowles, E. Modelling topographic variation in solar radiation in a GIS environment. Int. J. Geogr. Inf. Sci. 1997, 11, 475–497. [Google Scholar] [CrossRef]
  30. Muneer, T. Solar radiation model for Europe. Build. Serv. Eng. Res. Technol. 1990, 11, 153–163. [Google Scholar] [CrossRef]
  31. Gueymard, C.A. Direct and indirect uncertainties in the prediction of tilted irradiance for solar engineering applications. Sol. Energy 2009, 83, 432–444. [Google Scholar] [CrossRef]
  32. Perez, R.; Ineichen, P.; Seals, R.; Michalsky, J.; Stewart, R. Modeling daylight availability and irradiance components from direct and global irradiance. Sol. Energy 1990, 44, 271–289. [Google Scholar] [CrossRef] [Green Version]
  33. Howell, J.R.; Siegel, R.M. Pinar Mengüç. Thermal Radiation Heat Transfer, 5th ed.; Thermal Radiation Heat Transfer; Hemisphere Publishing Corporation: Tallahassee, FL, USA, 2010. [Google Scholar]
  34. Information China Meteorological Administration. Available online: http://www.cma.gov.cn/en2014. (accessed on 1 December 2020).
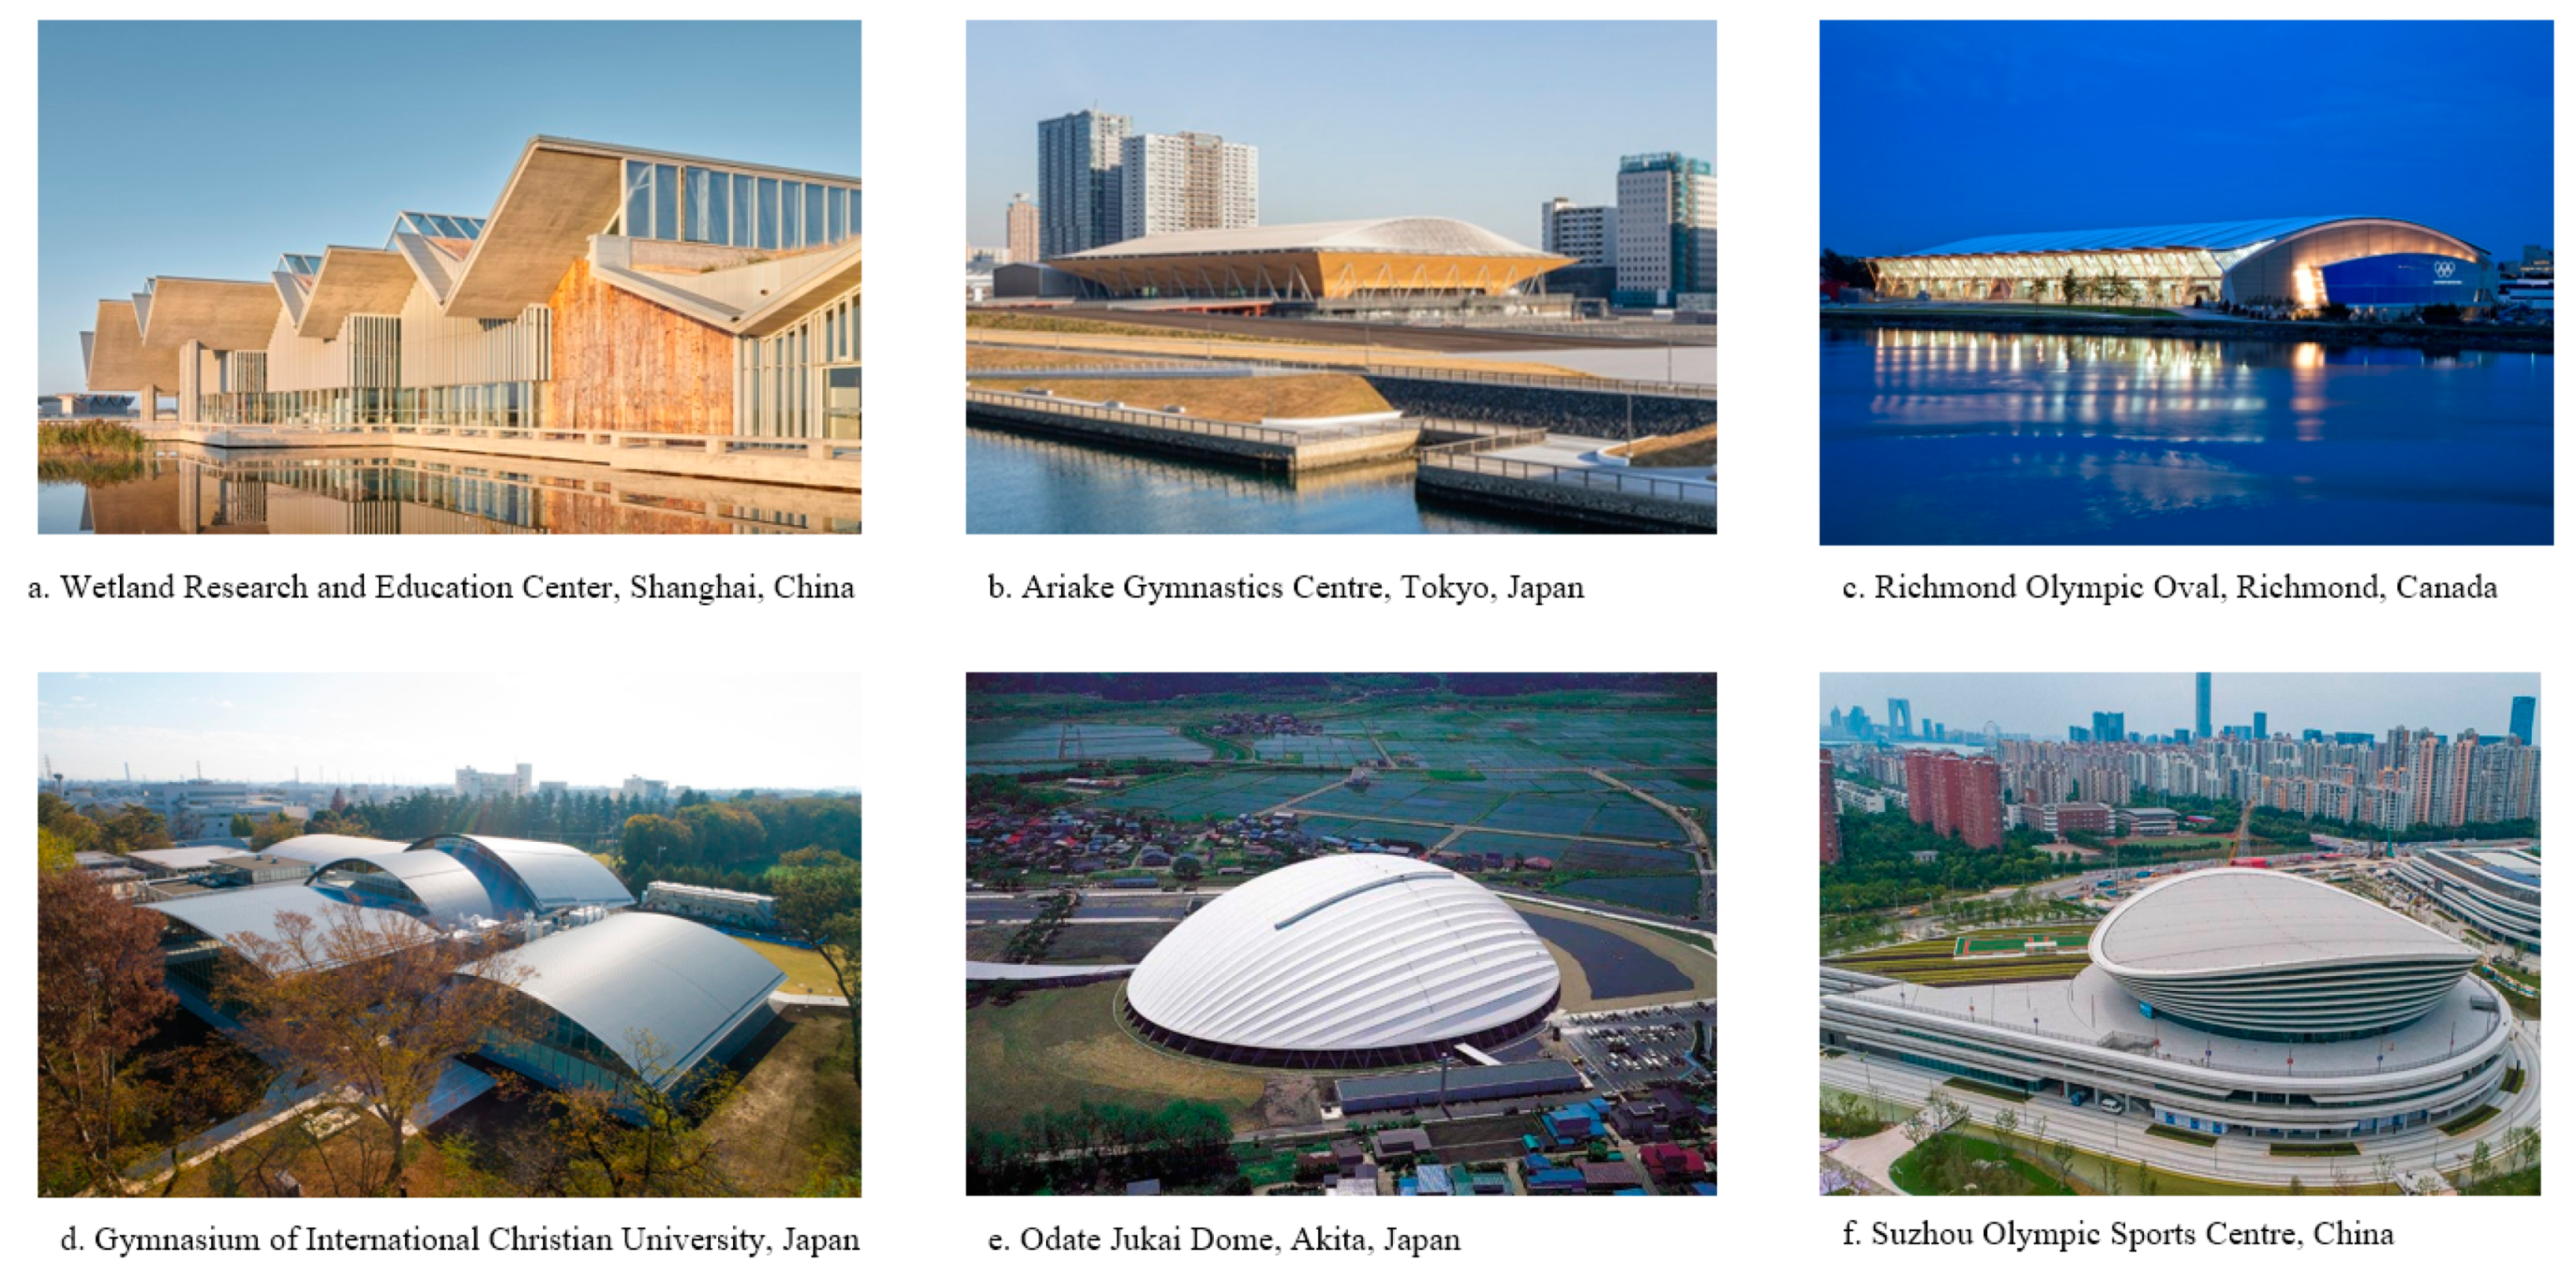
Figure 1. Various shapes of gymnasiums built around the world. (a) Wetland Research and Education Center, China [21]; (b) Ariake Gymnastics Centre, Japan [22]; (c) Richmond Olympic Oval, Canada [23]; (d) Gymnasium of the International Christian University, Japan [24]; (e) Odate Jukai Dome, Akita, Japan [25]; (f) Suzhou Olympic Sports Centre, China [26].
Energies 13 06369 g001
Figure 2. Schematic diagram of the solar angle.
Energies 13 06369 g002
Figure 3. Schematic diagram of the radiation transfer process of a roof surface.
Energies 13 06369 g003
Figure 4. Map showing the average value of the optimal tilt angle for PV application in China. This does not represent a complete map of the country.
Energies 13 06369 g004
Figure 5. Monthly accumulated sunshine hours and sunshine percentage in Nanjing city, based on recorded data from 2017 to 2019.
Energies 13 06369 g005
Figure 6. Monthly solar radiation intensity at various tilt angles in Nanjing city. (a) Tilting towards the south; (b) tilting towards the east.
Energies 13 06369 g006
Figure 7. Monthly optimal tilt angle in Nanjing city.
Energies 13 06369 g007
Figure 8. Annual solar radiation intensity at various tilt angles in Nanjing city.
Energies 13 06369 g008
Figure 9. Annual solar radiation intensity of gymnasium buildings with symmetric roof shapes. (a) hemispheroid, (b) paraboloid, (c) cone, (d) folded plate.
Energies 13 06369 g009aEnergies 13 06369 g009b
Figure 10. Monthly average solar radiation intensity of circular gymnasium buildings with the four roof shapes.
Energies 13 06369 g010
Figure 11. Annual average solar radiation intensity of circular gymnasium buildings with the four roof shapes.
Energies 13 06369 g011
Figure 12. Annual solar radiation intensity of rectangular gymnasium buildings with the various roof shapes. (a) single slope; (b) double slope; (c) arch; (d) folded plate.
Energies 13 06369 g012
Figure 13. Monthly average solar radiation intensity of rectangular gymnasium buildings with the four roof shapes.
Energies 13 06369 g013
Figure 14. Annual average solar radiation intensity of rectangular gymnasium buildings with the four roof shapes.
Energies 13 06369 g014
Figure 15. Annual solar radiation intensity of elliptic gymnasium buildings with the various roof shapes. (a) Ellipsoid; (b) vertical ridge; (c) funnel; (d) saddle.
Energies 13 06369 g015
Figure 16. Monthly average solar radiation intensity of elliptic gymnasium buildings with the four roof shapes.
Energies 13 06369 g016
Figure 17. Annual average solar radiation intensity of elliptic gymnasium buildings with the four roof shapes.
Energies 13 06369 g017
Table 1. Examples of gymnasium building shapes based on the typical plane shape [27].
Basic Plane ShapeApplicable StructureExample Gymnasium Building Shape
Square/rectangle Energies 13 06369 i001Truss frame, rigid frame, arch Energies 13 06369 i002 Energies 13 06369 i003
Arch, shell, Energies 13 06369 i004 Energies 13 06369 i005
Folded plate Energies 13 06369 i006 Energies 13 06369 i007
Polygon Energies 13 06369 i019Truss frame, folded plate Energies 13 06369 i008 Energies 13 06369 i009
Circle Energies 13 06369 i010Thin shell, grid Energies 13 06369 i011 Energies 13 06369 i012
Folded plate, thin shell Energies 13 06369 i013 Energies 13 06369 i014
Ellipse Energies 13 06369 i020Thin shell, grid Energies 13 06369 i015 Energies 13 06369 i016
Span wire Energies 13 06369 i017 Energies 13 06369 i018
Table 2. Structural parameters of the building and annual radiation intensity of its roof.
Basic ShapeBasic Plane ShapeHeight (m)Plane Area (m2)Total Roof Area (m2)Average Annual Radiation Intensity (MJ/m2/year)Total Annual Radiation Intensity (GJ)
HemispheroidCircle, r = 40 m405024.011,127.03674.9440,891.06
ParaboloidCircle, r = 40 m355024.08342.74226.0035,256.25
ConeOctagon, a = 38 m404914.87212.94237.0530,561.42
Folded plateOctagon, a = 38 m354914.88846.53987.7035,277.19
Table 3. Structural parameters of the rectangular building and annual radiation intensity of its roof.
Basic ShapeBasic Plane ShapeHeight (m)Plane Area (m2)Total Roof Area (m2)Average Annual Radiation Intensity (MJ/m2/year)Total Annual Radiation Intensity (GJ)
Single slopeRectangle 100 m × 60 m2060007929.34178.0133,128.69
Double slope2060008221.44031.0733,141.04
Arch2560009544.84132.2239,441.21
Folded plate2560007945.34096.6632,549.19
Table 4. Structural parameters of the elliptical building and annual radiation intensity of its roof.
Basic ShapeBasic Plane ShapeHeight (m)Plane Area (m2)Total Roof Area (m2)Average Annual Radiation Intensity (MJ/m2/year)Total Annual Radiation Intensity (GJ)
EllipsoidEllipse A = 60 m, b = 30 m3056525957.44082.1724,319.12
Vertical ridge35565271033921.6927,855.76
Funnel5056527744.84083.3831,624.96
Saddle45565277424189.8832,438.05
Publisher’s Note: MDPI stays neutral with regard to jurisdictional claims in published maps and institutional affiliations.