Abstract
Under dynamic loading, the geomechanical properties of porous clastic rocks differ from those in quasistatic loading. A small experimental rig was built to directly assess the influence of vibrations on the uniaxial compressive strength (UCS), Young modulus, and Poisson’s ratio. A piezoelectric actuator powered by a signal from an oscillator was used in the rig as a generator of vibrations. A laser sensor and eddy current probe measured the longitudinal and transverse deformation. Tinius Hounsfield and Instron Series 4483 installations were used to determine the geomechanical properties of new red sandstone in a quasistatic regime. The boundaries of elastic deformations determined in the quasistatic loading were implemented in the dynamic loading. To perform the experiments in the elastic zone (on the graph of stress (σ)–strain (ε)), small samples with diameters ranging between 7.5 and 24.7 mm were manufactured. The investigation demonstrated that the Young’s modulus of the sandstone increased with increasing values of the dynamic load and frequency.
1. Introduction
The dynamic geomechanical properties of rocks are a type of physical property that characterizes the ability of rocks to sustain a loading that changes in force amplitude over time. Geomechanical properties alter under dynamic loading at all stages of reservoir engineering, such as the drilling [1,2], completion [3], and treatment [4,5,6,7,8] of wells, as well as reservoir production [9,10,11,12]. In addition, dynamic mechanical properties are widely used in many other fields, such as civil engineering [13,14,15,16,17], medicine [18,19], and marine structures [20,21]. Although these areas use different kinds of mechanical properties, the basic principles are similar.
Determining the dynamic geomechanical properties of rocks in reservoir engineering is crucial in the following examples. First, understanding rock dynamic behavior during well drilling (small-scale) can significantly improve the borehole stability [22] and casing lifetime. Secondly, the amount of additional oil-in-place, produced as a result of hydraulic fracturing, depends on the dynamics of crack propagation and the behavior in time, which is mainly controlled by the rock geomechanics [23,24,25]. Thirdly, during hydrocarbon production and subsequent (large-scale) reservoir depletion, the formation pressure decreases. To maintain the pressure at a constant level, the flooding of reservoirs is utilized. The fluctuating reservoir pressure in these processes affects the rock (especially clastic rocks [26]) and the capillary imbibition rate [7]. Due to the rock stress state, an alteration of its matrix structure and compaction is observed [27,28]. As a result, the porosity and permeability (and thus the hydrocarbon recovery potential) decrease due to their strong reliance on the geomechanical properties [29,30,31,32].
The dynamics of geomechanical properties are studied through one-way (at strain rates from 10−8 to 106 s−1 [33]), multi-stage [34,35], cyclic [36,37], and high-frequency loading (up to 1 MHz) [38]. Under high-frequency loading, the dynamic mechanical properties of the rock are usually measured by non-destructive ultrasonic methods [39]. The study of the dynamic geomechanical properties of rocks at high frequencies began after it was noticed in seismology that the propagation velocity of elastic waves is not constant due to attenuation. Traditional installations were not suitable for studying the behavior of dynamic mechanical properties due to their low frequency of action (below Hz); therefore, it was necessary to use additional sensors.
Using a composite magnetostrictive resonator that generated longitudinal vibrations [40], the authors found that the internal friction of dry granite and quartzite nonlinearly depended on the amplitude of deformation (below 10−5) and frequency. Later, using force and displacement transducers and an electromechanical shaker [41], researchers found that the Young’s moduli of dry Navajo sandstone, Spergen limestone, and Oklahoma granite were independent of frequency between 4 and 400 Hz at strain amplitudes near 10−7. An experimental apparatus [42] with a servo-controlled confining pump [43,44] was used to determine that there was no frequency dependence of dry Fontainebleau sandstone elastic properties in the rage of 4·10−3 to 4·10−1 Hz.
At the same time, Opalinus clay [45] and Mancos shale [46] showed a steady slow growth of Young’s modulus and a decline of Poisson’s ratio as the frequency increased up to a 10−6 strain from 1 to 100 Hz and to an ultrasonic velocity of 500 kHz using an apparatus with a triaxial cell. Using an apparatus with a Hoek triaxial cell [47] the authors found that the Poisson ratio, Young’s modulus, and bulk and shear moduli of dry Donnybrook sandstone were not frequency-dependent in the range of strain amplitudes of 10−8 to 10−6 between 0.1 and 100 Hz. All forced oscillation facilities were generally united by the fact that elastic moduli (Young’s E, bulk K, and shear G moduli) are obtained from the amplitude of the recorded stress and strain signals [48,49]. Some of the rigs (e.g., [50]) represent a good platform for investigating the dynamics of mechanical property behavior.
In all the above works, the experimental facilities allowed the creation of dynamic loading with a maximum stress amplitude of up to 0.2 MPa. However, in practice, rocks can be subjected to higher dynamic loads; for example, when drilling. During drilling, the drill string through the bit acts on the rock with the weight of several tens of tons. The drill string, together with the bit, rotates in a stick–slip manner, as a result of which, when the bit interacts with the bottom, low-frequency vibrations (up to 40 Hz) occur. While the stick–slip action occurs, the change in weight on the bit contributes to high-amplitude (up to 10 MPa) stress fluctuations inside the rock below the contact of the bit cutters with the bottom.
Under the action of loads, the strength properties of rocks increase, which significantly affects the rate of penetration and the efficiency of drilling in general. Thus, it becomes necessary to study the effect of low-frequency high-amplitude dynamic loads on the properties of rocks. When conducting research on standard samples, it is extremely difficult to achieve high-amplitude dynamic loads (more than 0.2 MPa); therefore, we decided to reduce the size of the rock samples. A series of experiments on the quasi-static and dynamic loading of heterogeneous clastic rock was performed. The paper is organized as follows. In Section 2, the static mechanical properties of the manufactured sandstone samples are determined. The experimental methodology for the dynamic loading, experimental facility, and procedure are given in Section 3, followed by the results, discussion, and conclusions in Section 4 and Section 5.
2. Determination of Static Mechanical Parameters
2.1. Sandstone Samples Preparation and Treatment
New red sandstone of the Permian period mined in the Clashach quarry (Elgin, Scotland, UK) was selected for this study. The strength of a sample was determined by the strength of its weakest part (a defect), and the larger the sample volume, the greater the probability of a defect [51]. To assess the scale effect on the strength properties of the rock, and for the subsequent comparison of the strength properties with the data obtained in experiments on dynamic loading, four types of samples of different sizes were prepared in accordance with industry standards [52,53]. The ratio of the specimens’ length to diameter was 2. Small samples (d = 7.5, 9.2, and 11.5 mm) were milled with diamond bits (Figure 1) at a rotation frequency of 500 rpm with constant water flushing.
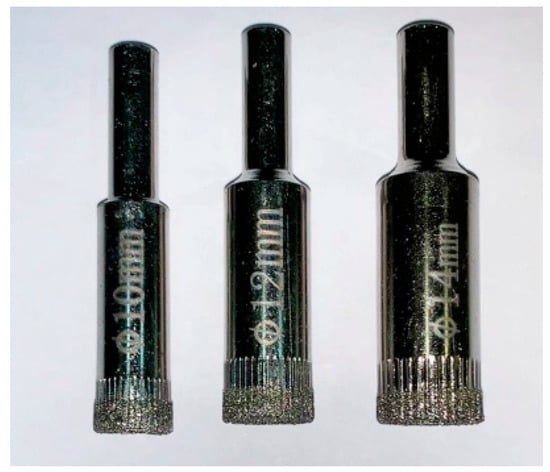
Figure 1.
Diamond bits for sample coring.
After coring, small cylindrical specimens were removed from the rock block, washed, and passed through a grinding procedure (Figure 2), where their end surfaces became parallel to each other and perpendicular to the axis of the specimen, which was necessary to ensure the maximum contact density between the plates of the stand in terms of loading and manner, as well as a uniform stress distribution in the sample. Samples on which defects were detected after processing were not used in subsequent experiments. When preparing samples with a diameter of 24.7 mm, a milling machine manufactured by ELE International Core Power Tools, model CX20-C3, was used. After milling, the samples were cut at the Cutrock & Brook Compton installation. Water was used as the washing and cooling liquid.
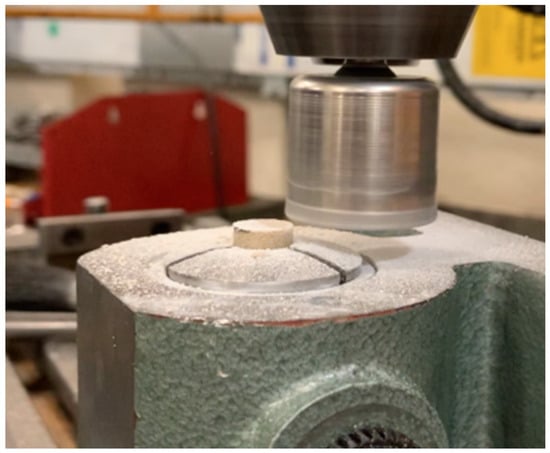
Figure 2.
Sample grinding.
The samples were washed and dried in an oven for 24 h at a temperature of 90 °C. The reservoir properties of the sandstone were determined on the UltraPoroPerm-500 installation in Perm National Research Polytechnic University (PNRPU) with a porosity of 17.5% and permeability of 0.353 μm2. The samples were then ready to be studied for their static and dynamic uniaxial compressive strength (UCS).
2.2. Static Testing
The experiments to determine the UCS σUCS of samples with diameters ranging from 7.5 to 11.5 mm were conducted on a Tinius Hounsfield instrument, and samples with a diameter of 24.7 mm used an Instron Series 4483 instrument with a loading cell of 150 kN. For each diameter of the samples, nine experiments were performed, making 72 experiments in total. The static loading of the clastic samples was carried out at a speed of 0.05 mm/min. To register the deformations, a video recorder was used. The specimens’ fractures were recorded at a frequency of 240 fps and considered to be standard (Figure 3).
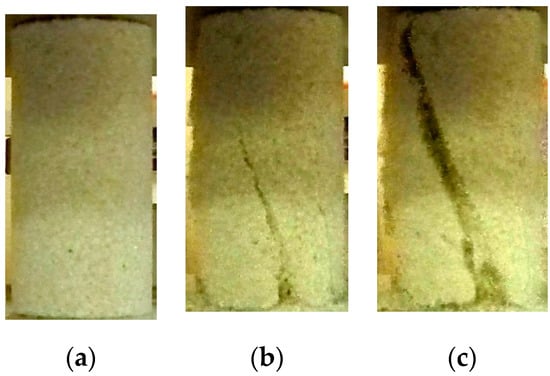
Figure 3.
Fracture propagation in specimens of 24.7 mm in diameter during the UCS test. (a) a specimen without a fracture, (b) the beginning of fracture propagation, (c) a fractured specimen.
As a result of the static loading of the samples of clastic rock, the average uniaxial compression strength σUCS was reduced by 34% when the diameter of the samples decreased from 24.7 to 7.5 mm (Table 1). This phenomenon contradicts the generally accepted theory that, as the size of the samples decreases, their strength increases—this phenomenon is called the scale effect. This theory is relevant for tight crystalline rocks, in which a decrease in the sample size leads to a decrease in the total number of natural defects. However, in practice, the manufacture of small-sized specimens, even for crystalline rocks, is typically associated with a number of difficulties: it is difficult to ensure the accuracy of specimen shapes, and small mechanical shocks can lead to the appearance of hidden microcracks, etc.

Table 1.
Results of the static compression testing. Uniaxial compressive strength (UCS).
In previous works [54,55], it was shown that both clastic and crystalline rocks are characterized by a decrease in the strength characteristics of the rocks with a decrease in the size of the samples. At the same time, in sedimentary rocks, a decrease in strength was observed in samples with a larger diameter compared with crystalline rocks [55]. This difference in behavior may be due to the fact that crystalline rocks are composed of smaller particles and that the strength of the rock is due to intermolecular interactions. In clastic rocks, the strength is primarily due to the strength of the contact between particles [56]. This is influenced by the ratio of the sample size to the particle size; with a decrease in this ratio, the total strength of the sample tends to decrease.
Using an example of samples with diameters of 7.5 and 11.5 mm, we considered the load–strain dependence obtained in UCS experiments (Figure 4). Changes in deformation due to load for both samples were the same. During the initial period of the static loading of the rock sample, a nonlinear dependence of the strain on the load was observed (compaction zone (zone 1, Figure 4), which was caused by the dislocation (defect) movement—the closing of the initial cracks and voids in the rock sample. With increasing load, the dependence became linear and elastic deformations were observed in the sample (zone 2). Tangent 4, drawn on the straight portion of the graph, describes the dependence of the rock deformation on the load according to Hooke’s law. When the load on the sample exceeded the proportionality limit in the rock, irreversible plastic deformations were observed with subsequent destruction (zone 3). UCS σUCS (MPa) is derived from
where F is force at which a sample is broken in the UCS test, N; S is the sample’s cross-sectional area, mm2; and d is the sample’s diameter, mm.
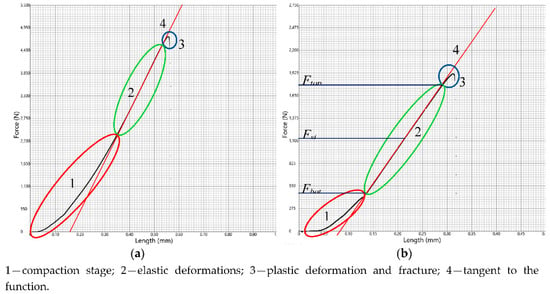
Figure 4.
Diagrams of static loading of samples (a) 11.5 mm diameter, and (b) 7.5 mm diameter.
The results of the uniaxial compression test showed that a decrease in the size of the samples led to a decrease in the calculated strength of the rocks, which was confirmed by other researchers. At the same time, as shown in Figure 4, there were no significant changes in the shape of the curves; the graphs have the same shape and go through the same stages. Based on this, we can assume that, with the dynamic loading of small samples, we can obtain a qualitative idea of how the rock behaves under the influence of high-amplitude low-frequency oscillations.
3. Dynamic Loading
3.1. Experimental Instrument
To studying the effect of dynamic loads on the mechanical properties of rocks, a special instrument was developed at the University of Aberdeen. The dynamic action on rock samples was carried out by an EXTREMA Magnetostrictive Electromechanical Transducer Model 250 µ actuator powered by the signal from a manual oscillator MOS-01 (CompactPower Titan series). The instantaneous force data were provided by the three-axis load sensor KISTLER 9027C. Accompanying data on the specimen’s deformation were recorded longitudinally by an eddy current probe (ECP). Signals from the sensors were directed to a workstation. A close view of a rock sample in the facility is shown in Figure 5.
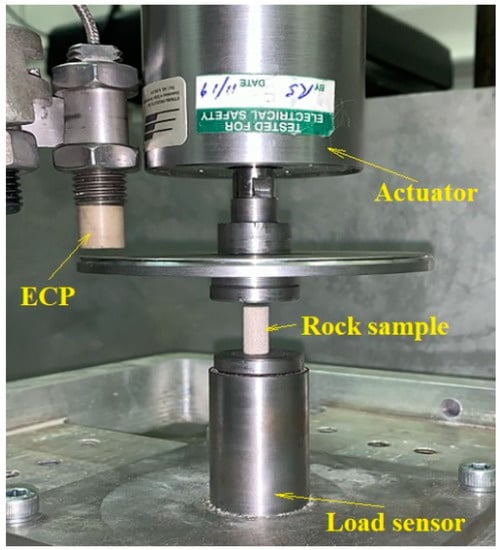
Figure 5.
Rock sample in the experimental instruments. ECP: eddy current probe.
To ensure a qualitatively generated sinusoidal signal from a generator to an actuator, the signal was also passed to the workstation. To process the incoming data from sensors via analog channels, as well as to synchronize the data acquisition, the interface and appropriate code were prepared in LabVIEW and MATLAB.
The ECP was calibrated using a laser sensor with an error of 1.5 μm in MATLAB. The vertical movement of the layout was performed using a reciprocating mechanism (the sensors were fixed). During the layout movement, the sensor data were registered in LabVIEW and saved as a “.txt” file.
We studied the effect of dynamic loading on the elastic properties of the rock; therefore, under dynamic loading, the sample needed to be in an elastic state. This means that the applied force and the corresponding deformation needed to be in zone 2 (Figure 4). To meet this requirement, a static load Fst needed to be applied to the sample. The Fst value could be chosen in the middle between the load Ftop, which corresponds to the upper boundary of the elastic deformation zone of the sample, and the load Fbot, which determines the lower boundary of the elastic zone of the specimen:
Then, the sample was in an elastic state under dynamic loading if the dynamic load amplitude .
Due to the limitations (technical characteristics) of the piezoelectric actuator (maximum dynamic load 1100 N), further experimental research was focused on specimens with a diameter of 7.5 mm. The Fst value was determined as follows: from Figure 4b, the lower limit of the elastic zone can be seen to be approximately 450 N and the upper limit was approximately 1800 N, while the limit of the actuator was only 1100 N. Thus, the peak values of the dynamic load needed not to exceed 450 and 1100 N. Then, Fst needed to be in the middle of this interval and equal to 775 N. As the studies were carried out on several samples, to avoid the risk of leaving the elastic zone, the Fst value was overestimated with a margin of +75 N, and, as a result, Fst was equal to 850 N. However, due to the design features of the installation, it was difficult to ensure the exact value of the preload; therefore, Fst was within 700–900 N. The amplitude of the dynamic load Fdyn was 250 N.
3.2. Experimental Procedure
The research procedure was as follows: a 7.5 mm sandstone sample was installed on the bottom plate of the experimental facility (Figure 5). An initial static load of 700–900 N was created on the sample by the upper plate. The static load was necessary for the test sample to be in the elastic deformation zone under dynamic action (Figure 4). Then, using a manual oscillator MOS-01 (CompactPower Titan series), a voltage was applied to the EXTREMA Magnetostrictive Electromechanical Transducer Model 250 µ actuator to create a dynamic load with a certain amplitude and frequency (determined according to the research program as shown in Table 2). The data from the sensors were recorded at the workstation in the LabVIEW program. At each loading step, the exposure mode was held for at least 10 s to stabilize the sensor readings.

Table 2.
Research program.
Testing of the samples was conducted according to the developed program with boundary conditions in the frequency and voltage (dynamic load) of the supplied current from a generator to an actuator (Table 2).
In total, 270 experiments were performed on nine samples. A specimen was subjected to a static preloading Fst of 850 N and dynamic loading of Fst ± Fdyn. During the experiment, the amplitude of the dynamic load Fdyn varied from 50 to 250 N, and the frequency f varied from 15 to 40 Hz.
The data from the sensors were collected and synchronized at the workstation using a specially developed algorithm in the LabVIEW software. Data processing was done using different filters in MATLAB. The findpeaks function was used to identify local extreme points. An example of the determination of the amplitude of wave signals is given in Figure 6.
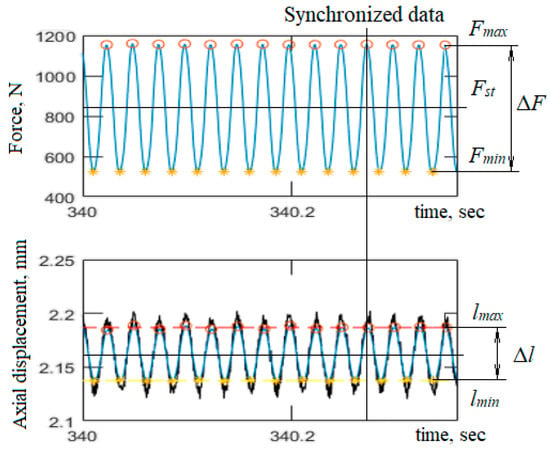
Figure 6.
Synchronized raw data.
Classically, the Young’s modulus characterizes the ratio of the stress arising in the sample to its relative deformation under static and quasi-static loading, but the Young’s modulus determined under dynamic loading is usually called dynamic [57]. In our case, the sample was subject to dynamic action; accordingly, the obtained experimental data were used to calculate the dynamic Young’s modulus. Young’s dynamic modulus is defined as the ratio of stress and strain increments tangential to the strain–stress curve at zone 2 (Figure 4) [38]:
where ΔσUCS is a stress increment during dynamic loading, MPa; and Δεl is a strain increment.
The stress increment ΔσUCS was determined by the formula
where Fmax and Fmin are the peak force of load N. This expression is valid only if the peak load values do not exceed the elastic zone of the sample: Fmin > Fbot; Fmax < Ftop. Otherwise, the load-deformation dependence will be non-linear and Equation (4) will not be valid.
Under dynamic loading, the maximum sample displacement lmax corresponds to the maximum load Fmax, and the minimum displacement lmin corresponds to the minimum load Fmin (Figure 6). The difference between these increments is the displacement increment; thus, the sample strain increment is given by the formula
where l is the initial sample length, mm.
4. Results and Discussion
The results of the study of the influence of dynamic load on the Young’s modulus are shown in Figure 7; the graph shows the behavior of the normalized dynamic Young’s modulus to the static modulus (Edyn/Est). The static Young’s modulus was determined from the UCS test.
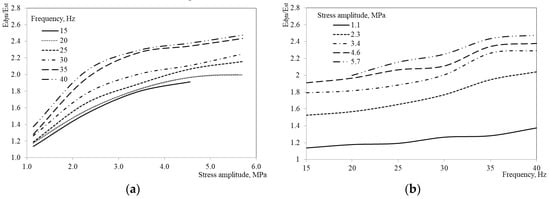
Figure 7.
The normalized dynamic Young’s modulus versus amplitude (a) and frequency (b) of dynamic loading.
Experimental studies established that with an increase in the stress amplitude and frequency of dynamic action, the dynamic Young’s modulus increases. In this case, the greatest dispersion of Young’s modulus was observed at a stress amplitude from 1 to 3 MPa. At stress amplitudes of more than 3 MPa, the Young’s modulus dependence becomes monotonic. The dependence of Young’s modulus on the frequency of dynamic action (Figure 8b) has a smoother form. Similar results regarding the dispersion behavior of the dynamic Young’s modulus were obtained in [42,46,47].
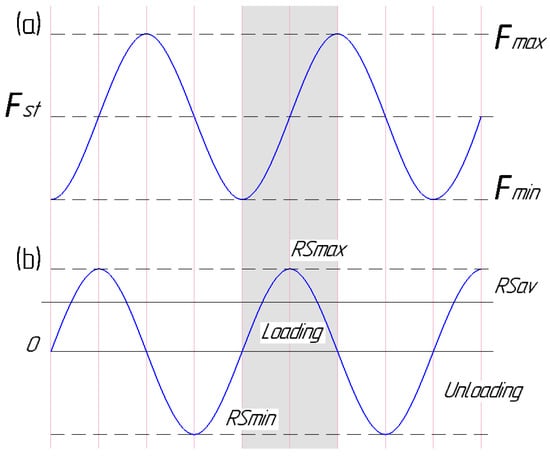
Figure 8.
The stress (a) and stress rate (b) during dynamic loading.
In these works, dry samples of clastic rocks had an insignificant dispersion of their Young’s modulus under dynamic loading, and saturated samples had a significant dispersion of Young’s modulus with the change in the frequency of dynamic loading. Researchers explained this behavior of Young’s modulus by the internal compaction of the rock material, as well as energy dissipation within the samples. The presence of pore fluid contributed to a change in the properties of the material due to the swelling of clay particles. It was shown in [42] that the samples saturated with glycerol had a greater dispersion of their Young’s modulus in comparison with water-saturated samples, which can be explained by the higher viscosity of glycerol compared to water, which contributes to an increase in energy dissipation.
In the studied samples, in contrast to the works mentioned above [42,46,47] for dry samples, the dispersion of Young’s modulus was higher. This can be explained by the fact that, in our work, we used small-diameter rock samples, which made it possible to create a larger stress amplitude (1–6 MPa) than in [42,46,47], in which, for comparison, the stress amplitude during the loading of the samples did not exceed 0.2 MPa. The dispersion of Young’s modulus could be influenced by the manufacturing process of small specimens; however, the results of the static loading of specimens showed that the pattern of deformation under load remained the same as for standard specimens, which indicates that the strength of small specimens decreases during the manufacturing process, but this does not significantly affect the structure of the material.
An increase in the dynamic Young’s modulus was also noted in studies of the effect of high-impulse dynamic action on various materials [58,59]. Summarizing the extensive research experience of laboratory studies of high-impulse action, in [33], the authors concluded that the main reason for the increase in the Young’s modulus and strength characteristics of materials at high loading rates was the internal inertia of the samples.
We used the ideas presented in [33] to study the behavior of the Young’s modulus under dynamic action on a sample. From the point of view of physics, the inertia of the sample is determined by the rate of the applied stress, the average value of which over the loading cycle can be found by the formula [33]
where RS is the stress rate, MPa/s; and f is the frequency. An explanation of the stress and stress rate behavior is shown in Figure 8. A positive value of the stress rate corresponds to the loading, while a negative value corresponds to unloading (Figure 8b). During loading, the stress rate (Figure 8b) begins to increase from zero when the specimen is subjected to the minimum load (Fmin) (Figure 8a); then, the stress rate (Figure 8b) increases and reaches its maximum values when the dynamic load (Figure 8a) is equal to the preliminary load (Fst). The stress rate (Figure 8b) begins to decrease and reaches zero when the sample is under maximum load (Fmax) (Figure 8a). Then, the unloading cycle begins, which goes through the same stages only in the reverse order. The change in the stress rate occurs smoothly along a sinusoid; therefore, there are no shock loads on the sample.
As a result of the analysis, we obtained the dependence of the normalized Young’s modulus on the rate of the applied stress (Figure 9). By the curve fitting analysis, we found that the change in the normalized Young’s modulus on the stress rate was best described by the power law
where X is the ratio (RS/RS0) of the stress rate to the minimum stress rate (at minimum Fdyn) in the study.
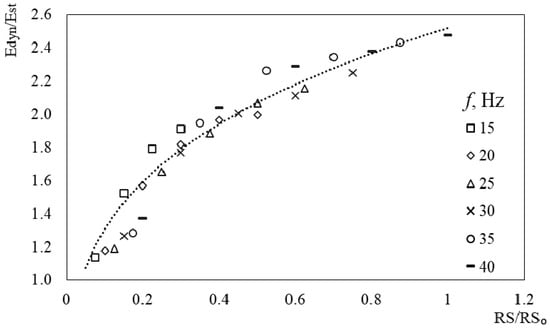
Figure 9.
The normalized dynamic Young’s modulus versus normalized stress rate of dynamic loading.
5. Conclusions
Sandstone samples were prepared in accordance with the relevant standards. The results of tests for uniaxial compression showed that a decrease in the size of samples led to a decrease in the calculated strength of rocks, which was confirmed by other researchers. At the same time, there were no significant changes in the form of strain–stress curves; they had the same shape and went through the same stages. This allowed us to use small-diameter samples to determine the rock properties under dynamic loading.
The created experimental setup made it possible to study samples under dynamic loading; however, there were limitations, with a maximum load of 1.1 kN. In this regard, before carrying out dynamic tests, it was necessary to test the rock samples under static loading to determine the boundaries of the sample’s elastic deformation zone. A static test was also required to determine the preload value and the maximum dynamic load amplitude. For example, in our case, the preload was 850 N, and the maximum dynamic loading amplitude was 250 N.
Experimental studies of sandstone samples under dynamic loading showed that the dynamic Young’s modulus increased with increasing frequency and amplitude. In our work, the Young’s modulus had a significant dispersion in comparison with similar works from other authors. This can be explained by the fact that, in our work, we used small-diameter rock samples, which made it possible to create a large stress amplitude.
During dynamic action, the stress in the sample is constantly changing with the stress rate. Since the loading and unloading process is constant, we assumed that the stress within the sample occurs with an average stress rate. With an increase in the amplitude and frequency of dynamic loading, the average stress rate increases, which leads to an increase in Young’s modulus. This behavior is explained by internal inertia, which is consistent with the results of other researchers. Using a curve fitting analysis, we found that the change in the Young’s modulus on the stress rate was best described by the power law.
Author Contributions
M.G. proposed the approach; E.K. performed sample preparation; M.T. performed installation preparation; E.R. prepared the graphics; V.P. conducted the experiments. All authors have read and agreed to the published version of the manuscript.
Funding
The support of the Russian Science Foundation (Project No. 19-19-00408) is gratefully acknowledged.
Conflicts of Interest
The authors are aware of the ethical responsibilities, and they declare that they have no conflict of interest.
List of Symbols
| σUCS | Uniaxial compressive strength (MPa) |
| F | Force at which a sample is broken in the UCS test (N) |
| Ftop | Load corresponding to the upper boundary of the specimen elastic deformation zone (N) |
| Fbot | Load corresponding to the lower boundary of the specimen elastic deformation zone (N) |
| Fst | Preload value (N) |
| Est | Static Young’s modulus (GPa) |
| Edyn | Dynamic Young’s modulus (GPa) |
| Fdyn | Amplitude of dynamic force (N) |
| ΔσUCS | Stress increment in the rock sample during dynamic loading (MPa) |
| F | Load applied to the specimen (N) |
| f | Frequency |
| Δεl | Strain increment |
| S | Specimen’s cross-sectional area (mm2) |
| d | Specimen’s diameter (mm) |
| Fmax | Peak maximum force (N) |
| Fmin | Peak minimum force (N) |
| l | Initial specimen’s length (m) |
| Е | Young’s modulus (MPa) |
| lmax | Peak value of maximum axial displacement (mm) |
| lmin | Peak value of minimum axial displacement (mm) |
| RS | Stress rate (MPa/sec) |
References
- Bandis, S.C.; Barton, N. Failure Modes of Deep Boreholes. In Proceedings of the 27th Symposium on Rock Mechanics, Tuscaloosa, AL, USA, 23–25 June 1986. [Google Scholar]
- Chuanliang, Y.; Deng, J.; Cheng, Y.; Li, M.; Feng, Y.; Li, X. Mechanical Properties of Gas Shale during Drilling Operations. Rock Mech. Rock Eng. 2017, 50, 1753–1765. [Google Scholar] [CrossRef]
- Lecompte, B.; Franquet, J.A.; Jacobi, D. Evaluation of Haynesville Shale Vertical Well Completions with a Mineralogy Based Approach to Reservoir Geomechanics. In Proceedings of the SPE Annual Technical Conference and Exhibition, New Orleans, LA, USA, 4–7 October 2009; Society of Petroleum Engineers (SPE). Volume 3. [Google Scholar] [CrossRef]
- Morsy, S.; Hetherington, C.; Sheng, J.J. Effect of low-concentration HCl on the mineralogy, physical and mechanical properties, and recovery factors of some shales. J. Unconv. Oil Gas Resour. 2015, 9, 94–102. [Google Scholar] [CrossRef]
- Valko, P.; Economides, M. Propagation of hydraulically induced fractures—A continuum damage mechanics approach. Int. J. Rock Mech. Min. Sci. Géoméch. Abstr. 1994, 31, 221–229. [Google Scholar] [CrossRef]
- Rybacki, E.; Meier, T.; Dresen, G. What controls the mechanical properties of shale rocks?—Part II: Brittleness. J. Pet. Sci. Eng. 2016, 144, 39–58. [Google Scholar] [CrossRef]
- Riabokon, E. Laboratory study on the effect of elastic wave treatment on geomechanical and capillary properties of clastic reservoirs. Neft. Khozyaystvo Oil Ind. 2020, 4, 54–57. [Google Scholar] [CrossRef]
- Riabokon, E. Methodology for forecasting the oil rate change while elastic wave propagation in the near-wellbore zone of clastic reservoirs. Neft. Khozyaystvo Oil Ind. 2020, 6, 76–79. [Google Scholar] [CrossRef]
- Far, P.B.; Hassani, A.H.; Al-Ajmi, A.M.; Heydari, H. A novel model for wellbore stability analysis during reservoir depletion. J. Nat. Gas Sci. Eng. 2016, 35, 935–943. [Google Scholar] [CrossRef]
- Trautwein, U.; Huenges, E. Poroelastic behaviour of physical properties in Rotliegend sandstones under uniaxial strain. Int. J. Rock Mech. Min. Sci. 2005, 42, 924–932. [Google Scholar] [CrossRef]
- Osorio, J.G.; Her-Yuan, C.; Teufel, L.W. Numerical Simulation of the Impact of Flow-Induced Geomechanical Response on the Productivity of Stress-Sensitive Reservoirs. In Proceedings of the SPE Symposium on Reservoir Simulation, Houston, TX, USA, 3–6 October1999. [Google Scholar] [CrossRef]
- Yi, X.; Ong, S.H.; Russell, J.E. Characterizing pore compressibility, reservoir compaction and stress path under uniaxial strain condition for nonlinear elastic rock. In Proceedings of the American Rock Mechanics Association—40th US Rock Mechanics Symposium, ALASKA ROCKS (2005): Rock Mechanics for Energy, Mineral and Infrastructure Development in the Northern Regions, Anchorage, AK, USA, 25–29 June 2005. [Google Scholar]
- Zhang, H.; Huang, L.; Yu, L.; Yang, Z. Macromechanical Properties and ITZ of Lightweight Aggregate Concrete from the Deck of Nanjing Yangtze River Bridge after 50 Years. J. Mater. Civ. Eng. 2020, 32, 05020005. [Google Scholar] [CrossRef]
- Song, P.; Hwang, S. Mechanical properties of high-strength steel fiber-reinforced concrete. Constr. Build. Mater. 2004, 18, 669–673. [Google Scholar] [CrossRef]
- Javdanian, H. Behavioral Interference of Vibrating Machines Foundations Constructed on Sandy Soils. Int. J. Eng. 2018, 31, 548–553. [Google Scholar] [CrossRef]
- Alavi, A.; Rahgozar, R.; Torkzadeh, P. The Effect of Geopolymerization on the Unconfined Compressive Strength of Stabilized Fine-grained Soils. Int. J. Eng. 2017, 30, 1673–1680. [Google Scholar] [CrossRef]
- Hassani, R.; Basirat, R. The Investigation of Subsidence Effect on Buried Pipes in 3D Space. Int. J. Eng. 2017, 30, 1182–1189. [Google Scholar] [CrossRef]
- Burton, H.E.; Freij, J.M.; Espino, D.M. Dynamic Viscoelasticity and Surface Properties of Porcine Left Anterior Descending Coronary Arteries. Cardiovasc. Eng. Technol. 2017, 8, 41–56. [Google Scholar] [CrossRef] [PubMed]
- Jin, X.; Yang, K.H.; King, A. Mechanical properties of bovine pia-arachnoid complex in shear. J. Biomech. 2011, 44, 467–474. [Google Scholar] [CrossRef]
- Cognard, J.; Davies, P.; Sohier, L.; Créac’Hcadec, R. A study of the non-linear behaviour of adhesively-bonded composite assemblies. Compos. Struct. 2006, 76, 34–46. [Google Scholar] [CrossRef]
- Jena, R.; Yue, C. Development of nanocomposite for rigid riser application: Diallyl bisphenol a modified Bismaleimide/epoxy interpenetrating network and its nanocomposite (NH 2-MWCNT). Compos. Sci. Technol. 2016, 124, 27–35. [Google Scholar] [CrossRef]
- Li, S.; Vaziri, V.; Kapitaniak, M.; Millett, J.M.; Wiercigroch, M. Application of Resonance Enhanced Drilling to coring. J. Pet. Sci. Eng. 2020, 188, 106866. [Google Scholar] [CrossRef]
- Chiachiarelli, F.C.; Merchán, V. Geomechanical characterization of the tight sandstones of Lajas Formation. In Proceedings of the 53rd US Rock Mechanics/Geomechanics Symposium, New York City, NY, USA, 23–26 June 2019. [Google Scholar]
- Suarez-Rivera, R.; Behrmann, L.A.; Green, S.; Burghardt, J.; Stanchits, S.; Edelman, E.; Surdi, A. Defining Three Regions Of Hydraulic Fracture Connectivity, In Unconventional Reservoirs, Help Designing Completions with Improved Long-term Productivity. In Proceedings of the SPE Annual Technical Conference and Exhibition; Society of Petroleum Engineers (SPE), New Orleans, LA, USA, 30 September–2 October 2013; Volume 7. [Google Scholar]
- Feng, Y.; Gray, K.E. Effects of Porous Properties of Rock on Near-Wellbore Hydraulic Fracture Complexity. In Proceedings of the SPE/AAPG/SEG Unconventional Resources Technology Conference, Houston, TX, USA, 23–25 July 2018. [Google Scholar] [CrossRef]
- Wang, H.; Ji, B.; Lv, C.; Zhang, L.; Li, X.; Cui, C.; Yu, H.; Nie, J. The stress sensitivity of permeability in tight oil reservoirs. Energy Explor. Exploit. 2019, 37, 1364–1376. [Google Scholar] [CrossRef]
- Belhaj, H.; Vaziri, H.; Islam, M. Laboratory Investigation of Effective Stresses’ Influence on Petrophysical Properties of Sandstone Reservoirs during Depletion. J. Can. Pet. Technol. 2009, 48, 47–53. [Google Scholar] [CrossRef]
- Schutjens, P.M.T.M.; Blanton, T.L.; Martin, J.W.; Lehr, B.C.; Baaijens, M.N. Depletion-induced compaction of an overpressured reservoir sandstone: An experimental approach. In Proceedings of the SPE/ISRM Rock Mechanics in Petroleum Engineering Conference, Trondheim, Norway, 8–10 July 1998; Volume 2. [Google Scholar] [CrossRef]
- Fortin, J.; Schubnel, A.; Guéguen, Y. Elastic wave velocities and permeability evolution during compaction of Bleurswiller sandstone. Int. J. Rock Mech. Min. Sci. 2005, 42, 873–889. [Google Scholar] [CrossRef]
- Sulem, J.; Ouffroukh, H. Shear banding in drained and undrained triaxial tests on a saturated sandstone: Porosity and permeability evolution. Int. J. Rock Mech. Min. Sci. 2006, 43, 292–310. [Google Scholar] [CrossRef]
- Wang, H.; Xu, W.; Zuo, J. Compact rock material gas permeability properties. Phys. B Condens. Matter 2014, 449, 10–18. [Google Scholar] [CrossRef]
- Head, D.; Vanorio, T. Effects of changes in rock microstructures on permeability: 3-D printing investigation. Geophys. Res. Lett. 2016, 43, 7494–7502. [Google Scholar] [CrossRef]
- Zhang, Q.; Zhao, J. A Review of Dynamic Experimental Techniques and Mechanical Behaviour of Rock Materials. Rock Mech. Rock Eng. 2014, 47, 1411–1478. [Google Scholar] [CrossRef]
- Peng, K.; Zhou, J.; Zou, Q.; Song, X. Effect of loading frequency on the deformation behaviours of sandstones subjected to cyclic loads and its underlying mechanism. Int. J. Fatigue 2020, 131, 105349. [Google Scholar] [CrossRef]
- Bijay, K.C.; Foroutan, M.; Ghazanfari, E. Analysis and Comparison of Measured Static and Dynamic Moduli of a Dolostone Specimen. Geotech. Spec. Publ. 2019, 2019, 484–493. [Google Scholar] [CrossRef]
- Zheng, Q.; Liu, E.; Sun, P.; Liu, M.; Yu, D. Dynamic and damage properties of artificial jointed rock samples subjected to cyclic triaxial loading at various frequencies. Int. J. Rock Mech. Min. Sci. 2020, 128, 104243. [Google Scholar] [CrossRef]
- Jafari, M.K.; Pellet, F.; Boulon, M.; Hosseini, K.A. Experimental Study of Mechanical Behaviour of Rock Joints under Cyclic Loading. Rock Mech. Rock Eng. 2004, 37, 3–23. [Google Scholar] [CrossRef]
- Bauer, A.; Bhuiyan, M.H.; Fjær, E.; Holt, R.M.; Lozovyi, S.; Pohl, M.; Szewczyk, D. Frequency-dependent wave velocities in sediments and sedimentary rocks: Laboratory measurements and evidences. Lead. Edge 2016, 35, 490–494. [Google Scholar] [CrossRef]
- Gong, F.; Di, B.; Zeng, L.; Wei, J.; Ding, P. Static and dynamic linear compressibility of dry artificial and natural shales under confining pressure. J. Pet. Sci. Eng. 2020, 192, 107242. [Google Scholar] [CrossRef]
- Gordon, R.B.; Davis, L.A. Velocity and attenuation of seismic waves in imperfectly elastic rock. J. Geophys. Res. Space Phys. 1968, 73, 3917–3935. [Google Scholar] [CrossRef]
- Spencer, J.W. Stress relaxations at low frequencies in fluid-saturated rocks: Attenuation and modulus dispersion. J. Geophys. Res. Space Phys. 1981, 86, 1803–1812. [Google Scholar] [CrossRef]
- Pimienta, L.; Fortin, J.; Gueguen, Y. Bulk modulus dispersion and attenuation in sandstones. Geophysics 2015, 80, D111–D127. [Google Scholar] [CrossRef]
- Batzle, M.L.; Han, D.-H.; Hofmann, R. Fluid mobility and frequency-dependent seismic velocity—Direct measurements. Geophysics 2006, 71, N1–N9. [Google Scholar] [CrossRef]
- Tisato, N.; Madonna, C. Attenuation at low seismic frequencies in partially saturated rocks: Measurements and description of a new apparatus. J. Appl. Geophys. 2012, 86, 44–53. [Google Scholar] [CrossRef]
- Lozovyi, S.; Bauer, A. From Static to Dynamic Stiffness of Shales: Frequency and Stress Dependence. Rock Mech. Rock Eng. 2019, 52, 5085–5098. [Google Scholar] [CrossRef]
- Szewczyk, D.; Bauer, A.; Holt, R.M. A new laboratory apparatus for the measurement of seismic dispersion under deviatoric stress conditions. Geophys. Prospect. 2016, 64, 789–798. [Google Scholar] [CrossRef]
- Mikhaltsevitch, V.; Lebedev, M.; Gurevich, B. A Laboratory Study of the Elastic and Anelastic Properties of the Sandstone Flooded with Supercritical CO2 at Seismic Frequencies. Energy Procedia 2014, 63, 4289–4296. [Google Scholar] [CrossRef]
- McKavanagh, B.; Stacey, F. Mechanical hysteresis in rocks at low strain amplitudes and seismic frequencies. Phys. Earth Planet. Inter. 1974, 8, 246–250. [Google Scholar] [CrossRef]
- Lakes, R. Introduction: Phenomena. In Viscoelastic Materials; Cambridge University Press (CUP): Cambridge, UK, 2010; pp. 1–13. [Google Scholar] [CrossRef]
- Wiercigroch, M.; Kovacs, S.; Zhong, S.; Costa, D.; Vaziri, V.; Kapitaniak, M.; Pavlovskaia, E. Versatile mass excited impact oscillator. Nonlinear Dyn. 2019, 99, 323–339. [Google Scholar] [CrossRef]
- Zaitsev, D.V.; Kochanov, A.N.; Toktogulov, S.Z.; Panfilov, P.E. The influence of the scale effect and heterogeneity of rocks in determining their strength properties. Mt. Inf. Anal. Bull. 2016, 208–215. [Google Scholar] [CrossRef]
- ASTM D4543. Standard Practices for Preparing Rock Core Specimens and Determining Dimensional and Shape Tolerances; ASTM International: West Conshohocken, PA, USA, 2008. [Google Scholar] [CrossRef]
- Bieniawski, Z.T.; Hawkes, I. Suggested methods for determining tensile strength of rock materials. Int. J. Rock Mech. Min. Sci. Géoméch. Abstr. 1978, 15, 99–103. [Google Scholar]
- Hawkins, A.B. Aspects of rock strength. Bull. Int. Assoc. Eng. Geol. 1998, 57, 17–30. [Google Scholar] [CrossRef]
- Darlington, W.J.; Ranjith, P.G.; Choi, X. The Effect of Specimen Size on Strength and Other Properties in Laboratory Testing of Rock and Rock-Like Cementitious Brittle Materials. Rock Mech. Rock Eng. 2011, 44, 513–529. [Google Scholar] [CrossRef]
- Dyke, C.G.; Dobereiner, L. Evaluating the strength and deformability of sandstones. Q. J. Eng. Geol. Hydrogeol. 1991, 24, 123–134. [Google Scholar] [CrossRef]
- Fjaer, E.; Stroisz, A.M.; Holt, R.M. Elastic Dispersion Derived from a Combination of Static and Dynamic Measurements. Rock Mech. Rock Eng. 2013, 46, 611–618. [Google Scholar] [CrossRef]
- Cui, J.; Wang, S.; Wang, S.; Li, G.; Wang, P.; Liang, C. The Effects of Strain Rates on Mechanical Properties and Failure Behavior of Long Glass Fiber Reinforced Thermoplastic Composites. Polymers 2019, 11, 2019. [Google Scholar] [CrossRef]
- Kumar, A. The Effect of Stress Rate and Temperature on the Strength of Basalt and Granite. Geophysics 1968, 33, 501–510. [Google Scholar] [CrossRef]
Publisher’s Note: MDPI stays neutral with regard to jurisdictional claims in published maps and institutional affiliations. |
© 2020 by the authors. Licensee MDPI, Basel, Switzerland. This article is an open access article distributed under the terms and conditions of the Creative Commons Attribution (CC BY) license (http://creativecommons.org/licenses/by/4.0/).