Solving Renewables-Integrated Economic Load Dispatch Problem by Variant of Metaheuristic Bat-Inspired Algorithm
Abstract
1. Introduction
2. Problem Formulation
2.1. Thermal Energy
2.2. Wind Energy
2.3. Solar PV Energy
2.4. Overall Cost Function Incorporating Renewables
3. A Variant of BA for the ELD Problem
3.1. Overview of BA
- Bats use echolocation to sense distance and to know the difference between food and prey. In our case, the fitness function is food and bats, which are the possible solutions;
- The bats fly randomly with some predefined velocity vi at a position xi with a predefined frequency fi. They can adjust their frequency of pulse emitted;
- They can vary the rate of pulses by looking at the target proximity;
- Loudness can be varied from a large positive value to a small value.
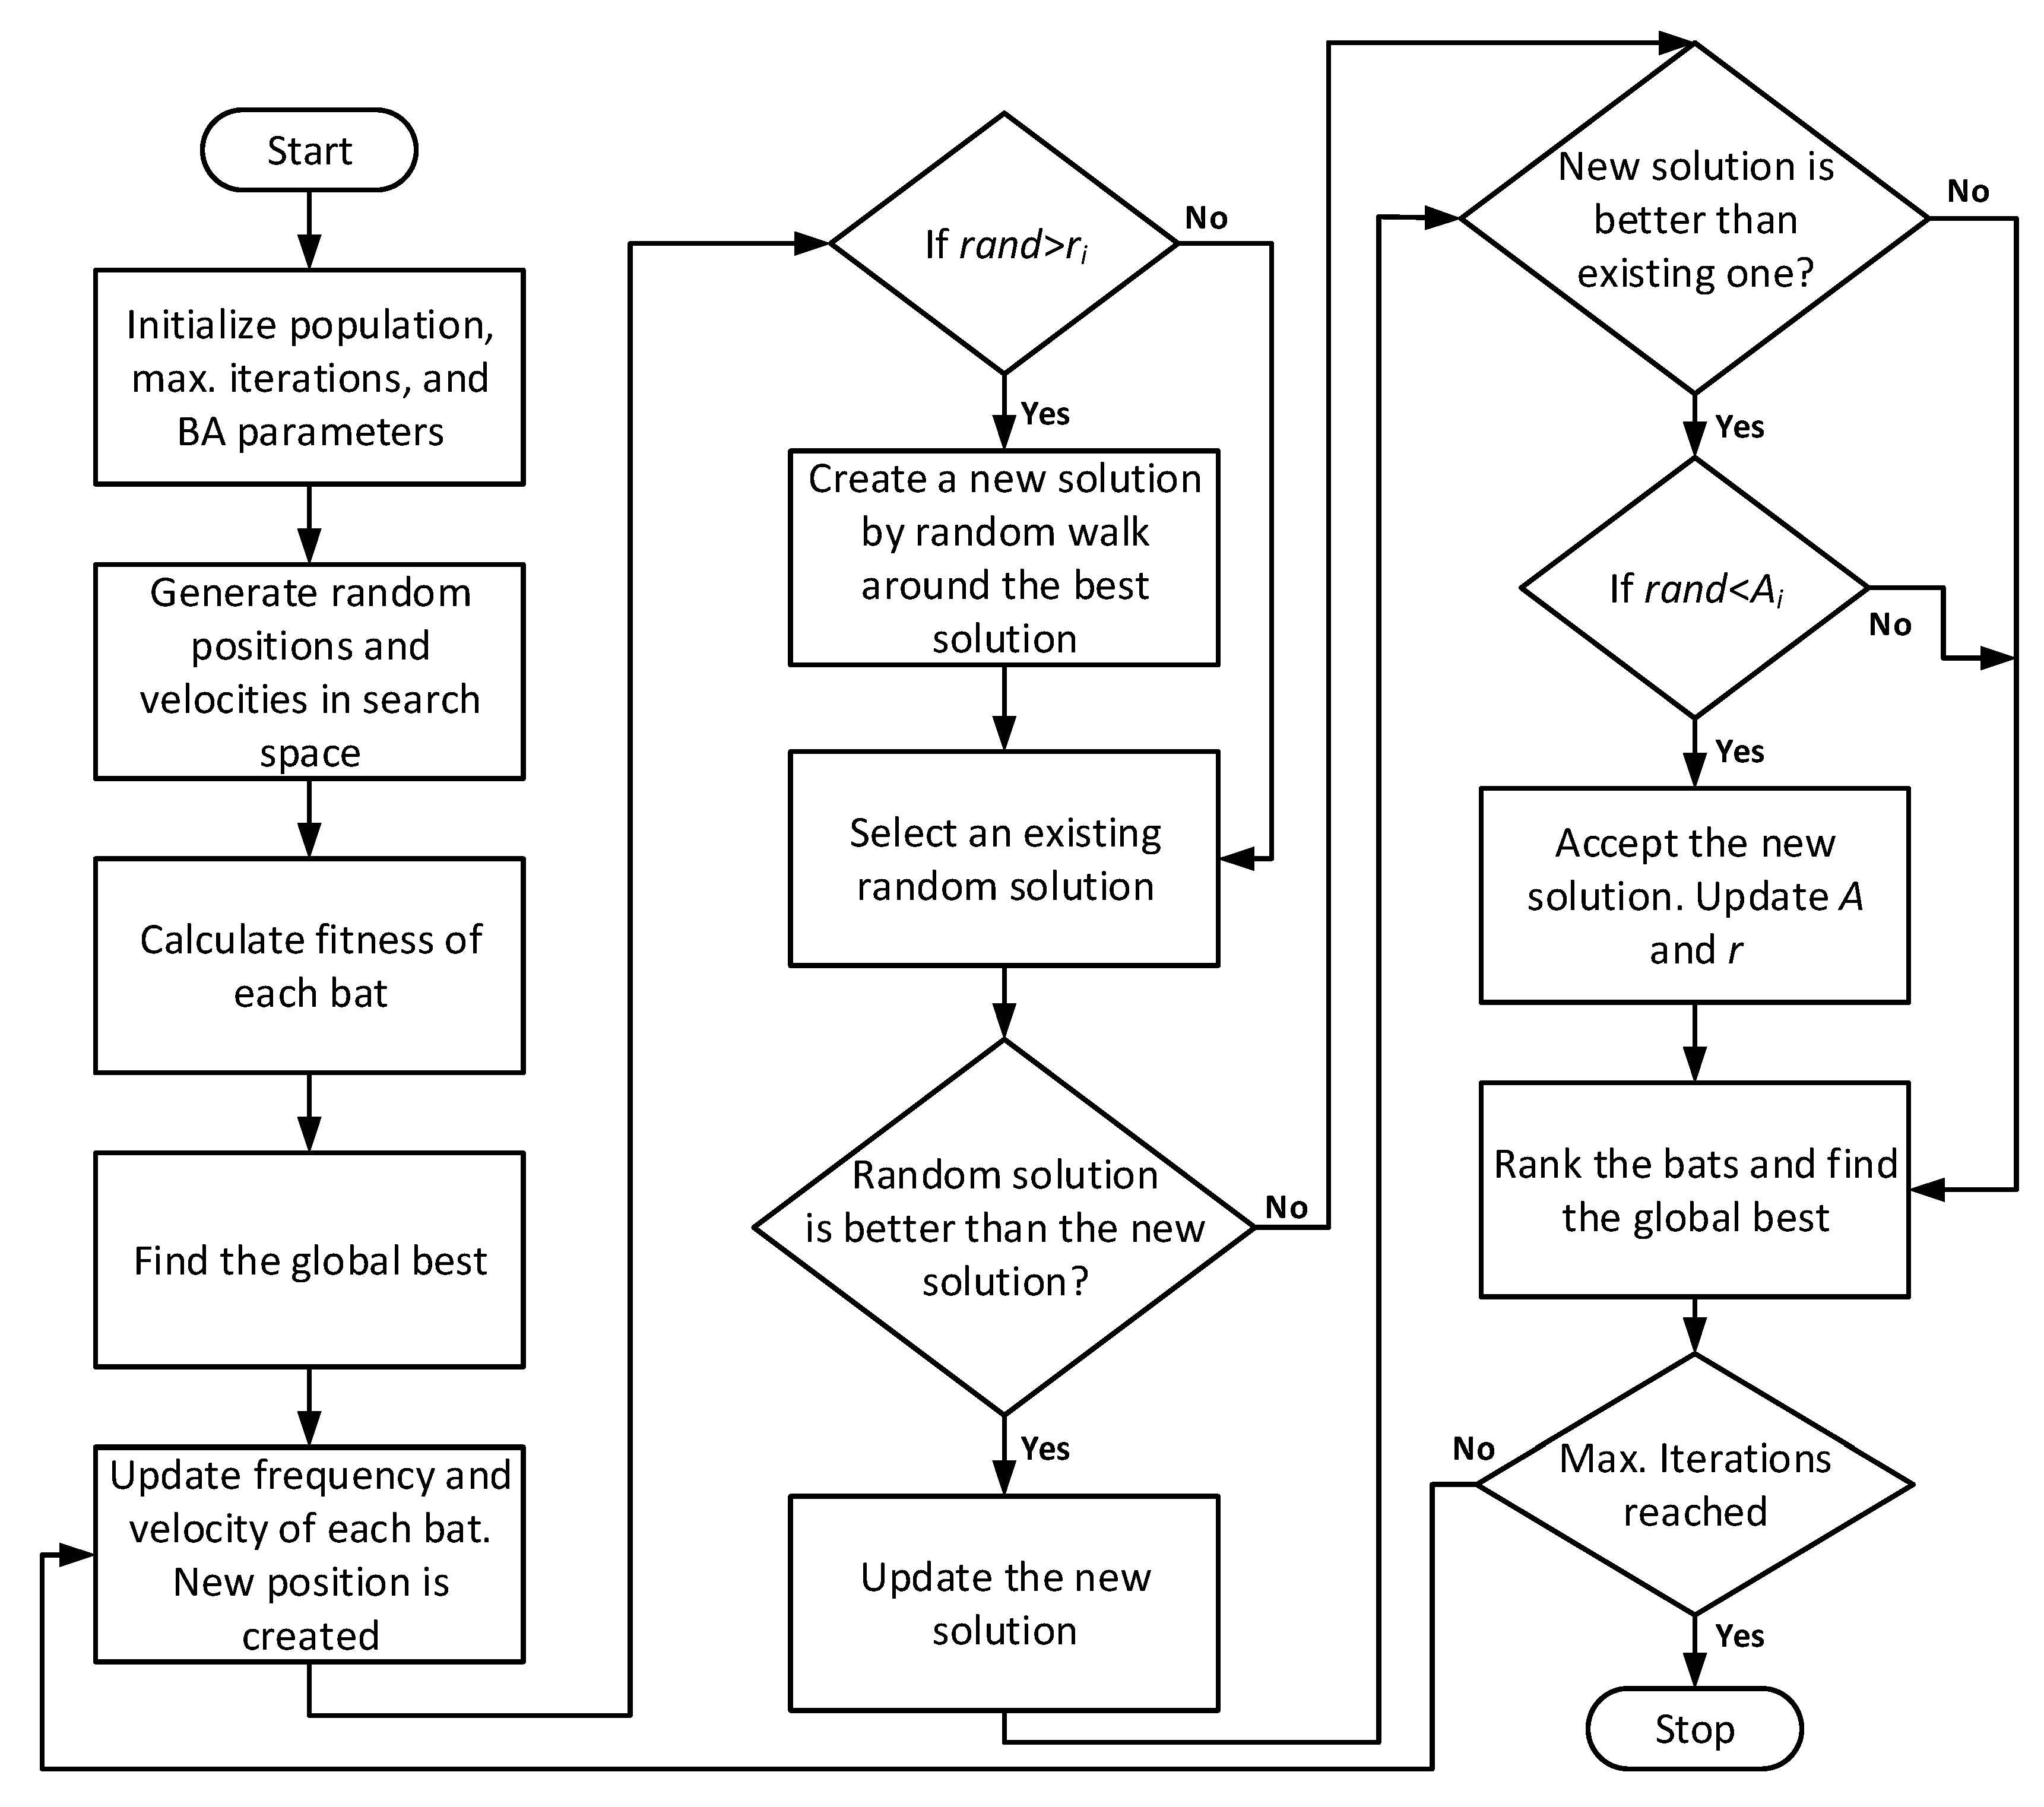
- Firstly, we initialize the algorithm with maximum iterations, bat population, loudness constant α, pulse rate constants γ, initial values of loudness, and pulse rates;
- Give a random position to all bats in the solution space within the lower and upper boundary;
- Find the best bat position x* and its fitness;
- Start the process in which the position is updated one by one by:where is the velocity of bat i at a certain position at iteration t. There is the global best position x* among all the bats. Minimum and maximum frequency is selected depending on the application. The value will be between 0 and 1.
- Now a random number is generated (between 0 and 1) and is compared with pulse rate. Based on pulse rate, local search is done around the best solution by:
- An existing random solution k is selected with k ≠ i and is compared with the new solution. If it is better, then update the new solution by:
- The new solution from the previous step will be compared with the existing positions of the current bat. Furthermore, a random number will again be generated and compared with loudness of that bat. If the new solution of the previous step is better than the global best solution, and the random number is less than loudness, then a new solution will be accepted, and the loudness and pulse rate of that bat will be updated based on the following expressions:
3.2. dBA
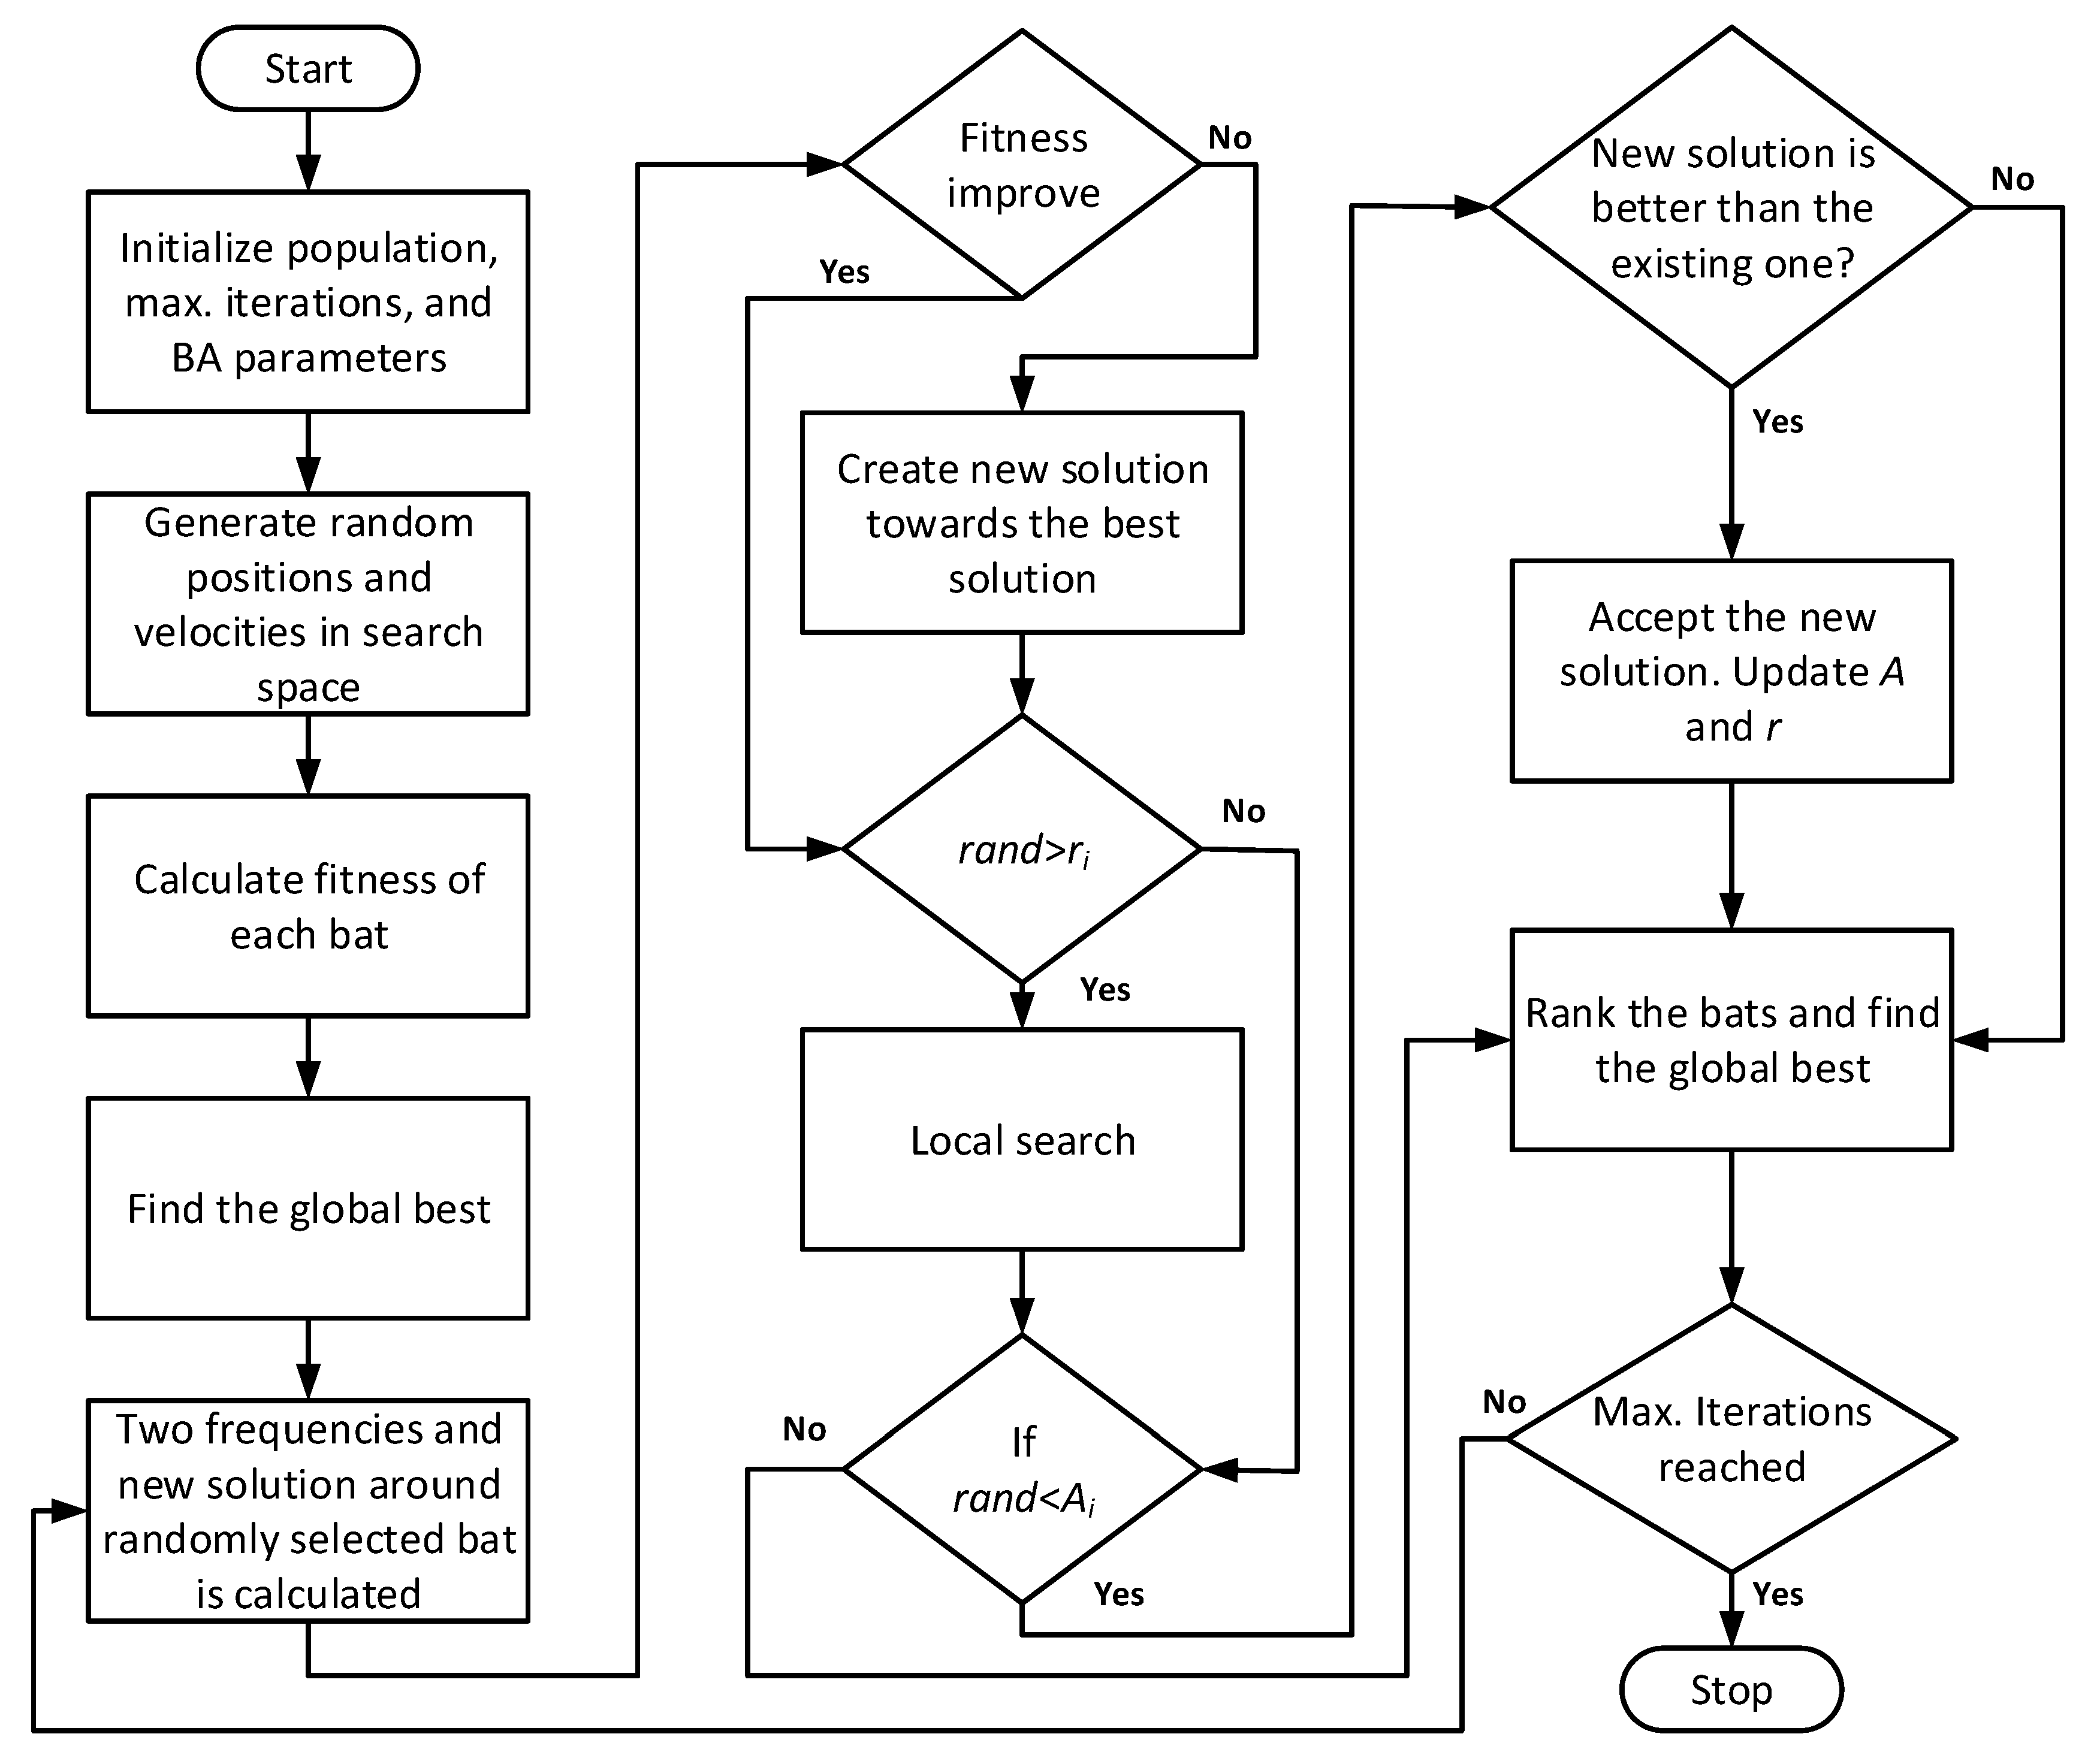
- Firstly, bats are initialized by giving random positions within the upper and lower boundaries of each bat;
- The standard BA has two navigation modes: First, towards the best solution and second, to exploit the best solution. In directional echolocation, bats move by analyzing their echoes. In addition, a bat takes help from other bats for better decisions. One of the bat pulses is toward the leader and another one toward a randomly selected bat. If the food exists around that random bat, the bat moves toward it otherwise, it moves toward the leader (best bat). Equations (13) and (14) depict this movement as follows:If the food does not exist around the random bat, then a bat will move towards the leader:where shows the position of randomly selected bat k where k ≠ i and shows the position of the global best. In the above equations, f1 and f2 are the frequencies of two pulses which are assigned as:where rand1 and rand2 are random numbers between 0 and 1;
- In the next step, the local search step is done similar to BA. However, the equation is modified by including a scale factor as follows:where is the average loudness and ε has a random value between −1 and 1. The value of starts from a large value and then reduces to 1% of a quarter of its length as follows:where and show the initial and final values, respectively, and t and tmax show the current and maximum iteration, respectively. The value of and can be set as:Here and show the upper and lower bounds, respectively;
- In the next step, which is similar to the standard BA, a random number is compared with loudness, but unlike the standard BA, a new solution is compared with the existing solution of that bat (not the global best). This step helps to improve the diversity of the algorithm. If these two conditions are true, then only new solutions are accepted. The pulse rate has an important role as it decides a balance between exploration and exploitation. Moreover, the loudness and pulse rate are updated as follows:where A and r show the loudness and pulse rate, respectively. For the best results, the optimum values recommended in the literature are 0.1 and 0.7 for pulse rate, and 0.9 and 0.6 for loudness;
4. Simulation Results and Discussion
4.1. Case 1: The IEEE 57 Bus System with Seven Thermal Units
4.1.1. Data
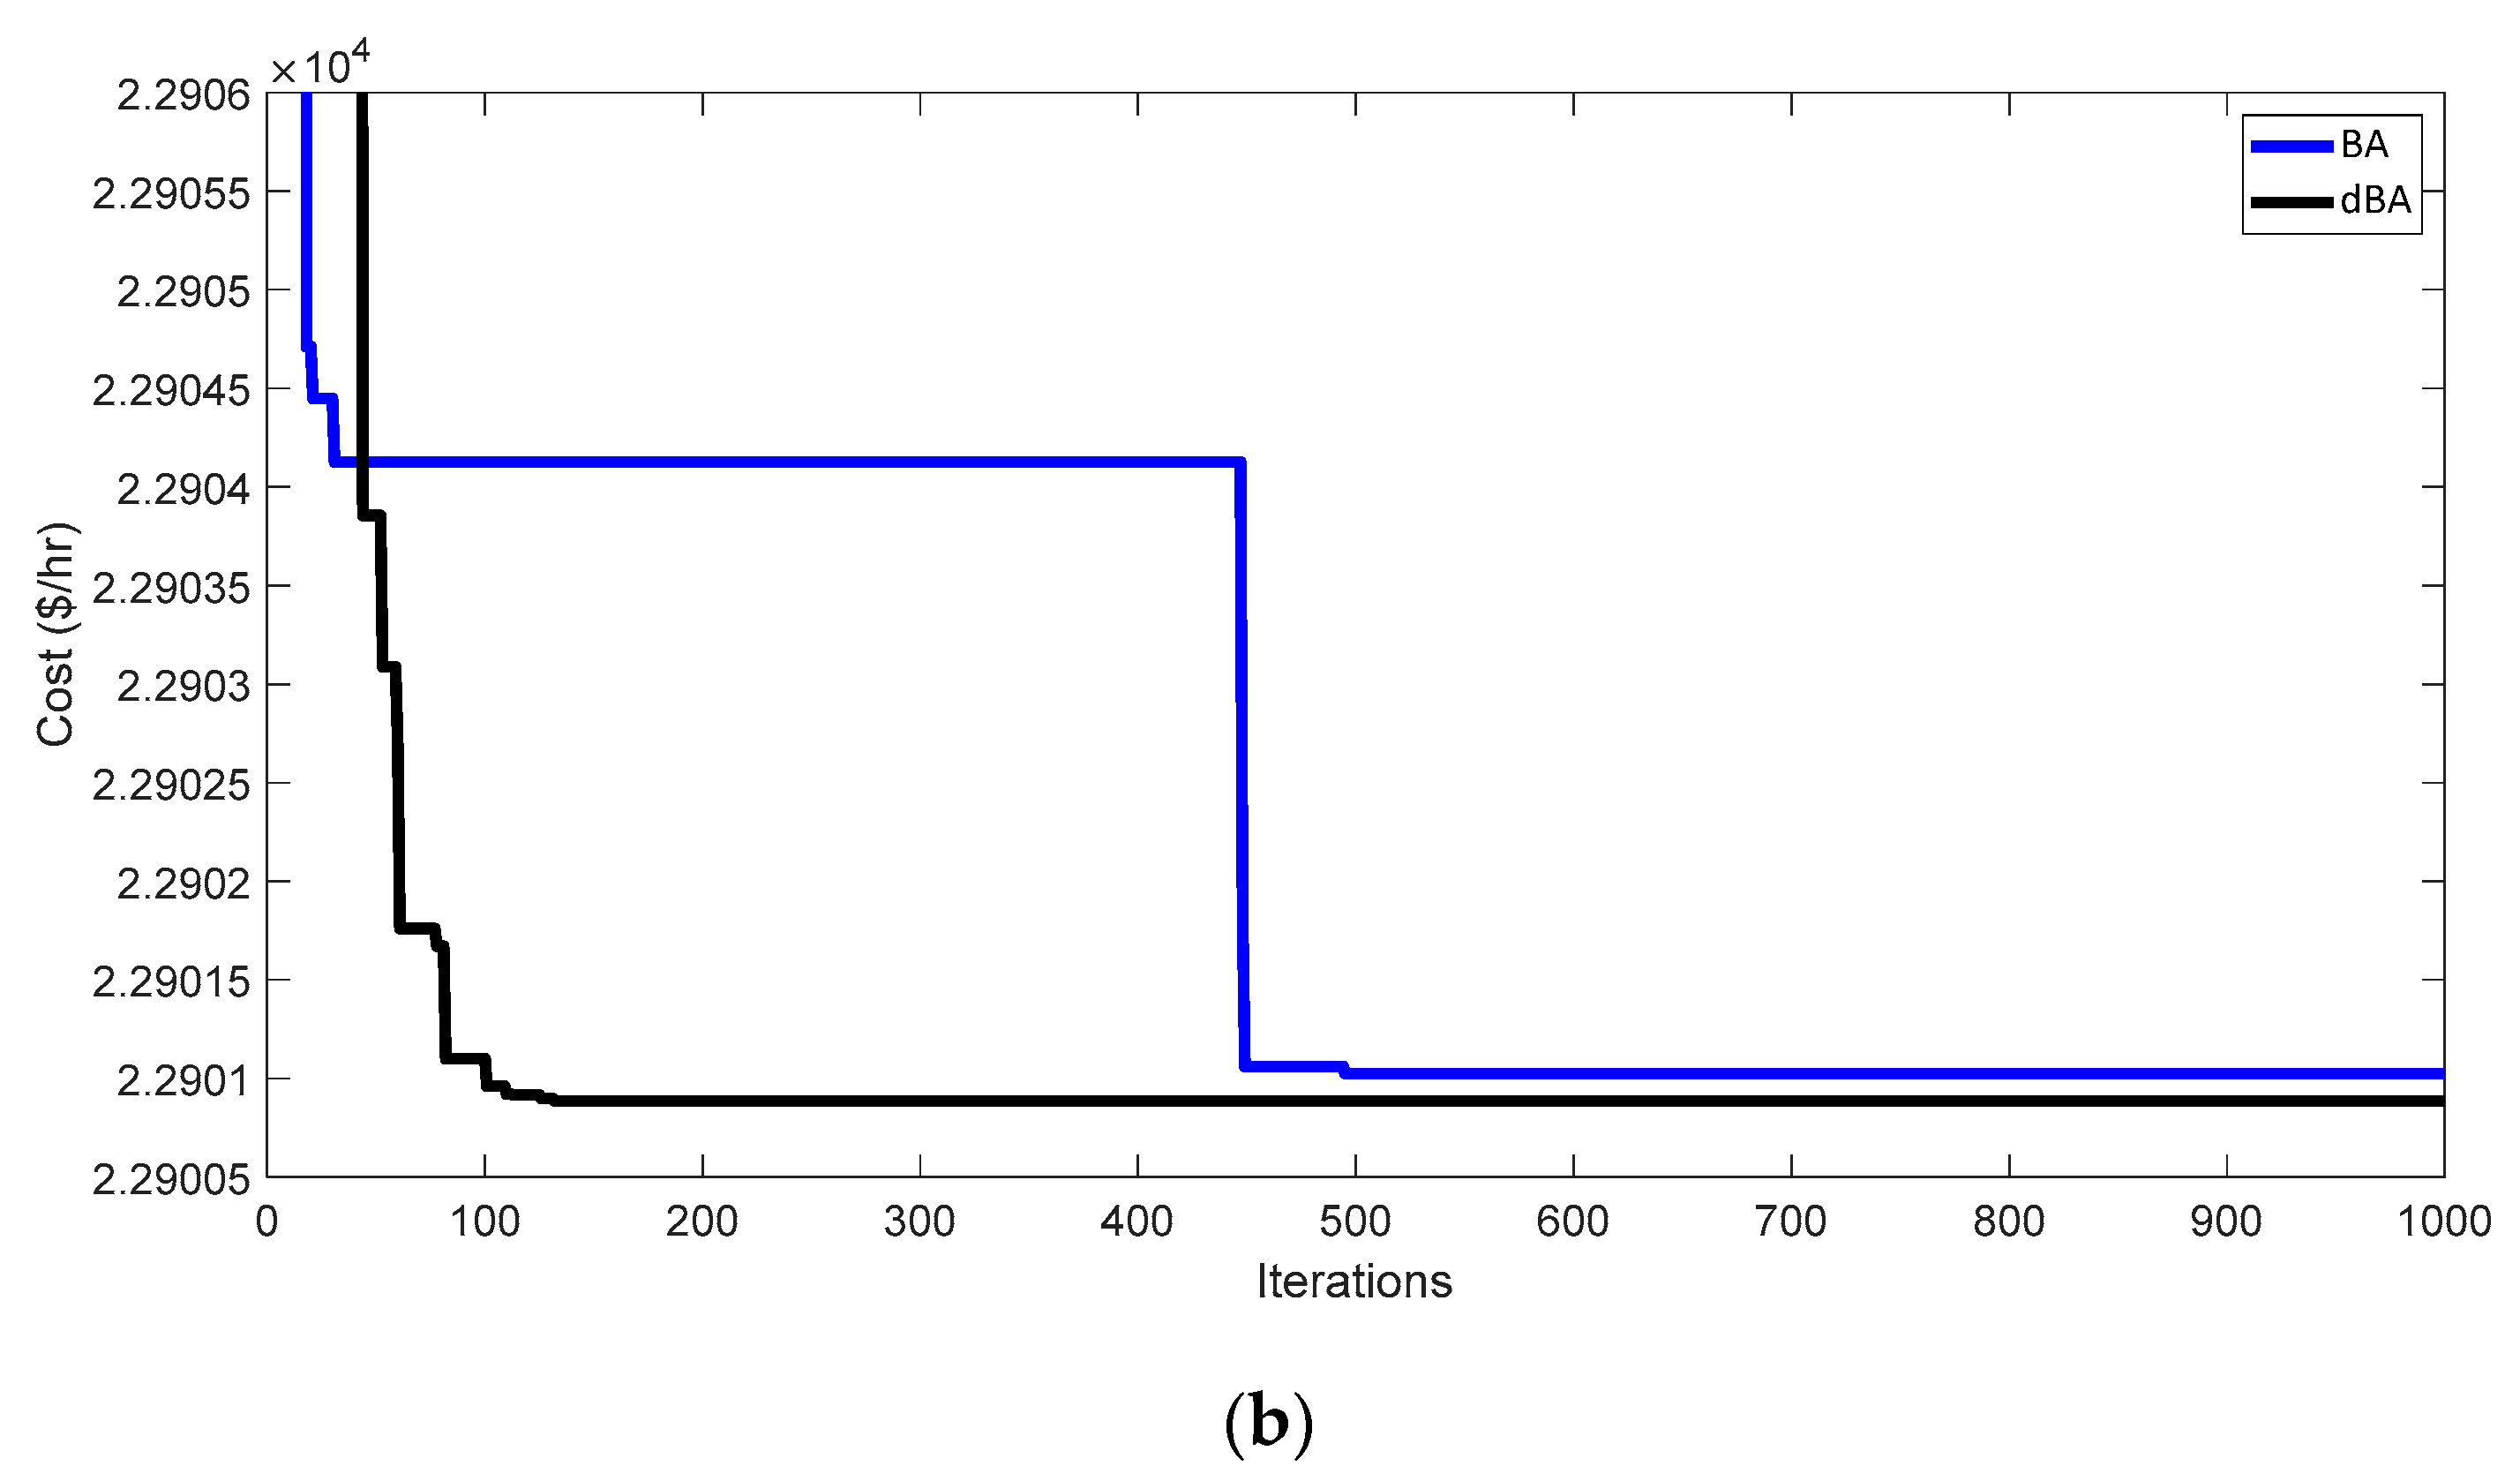
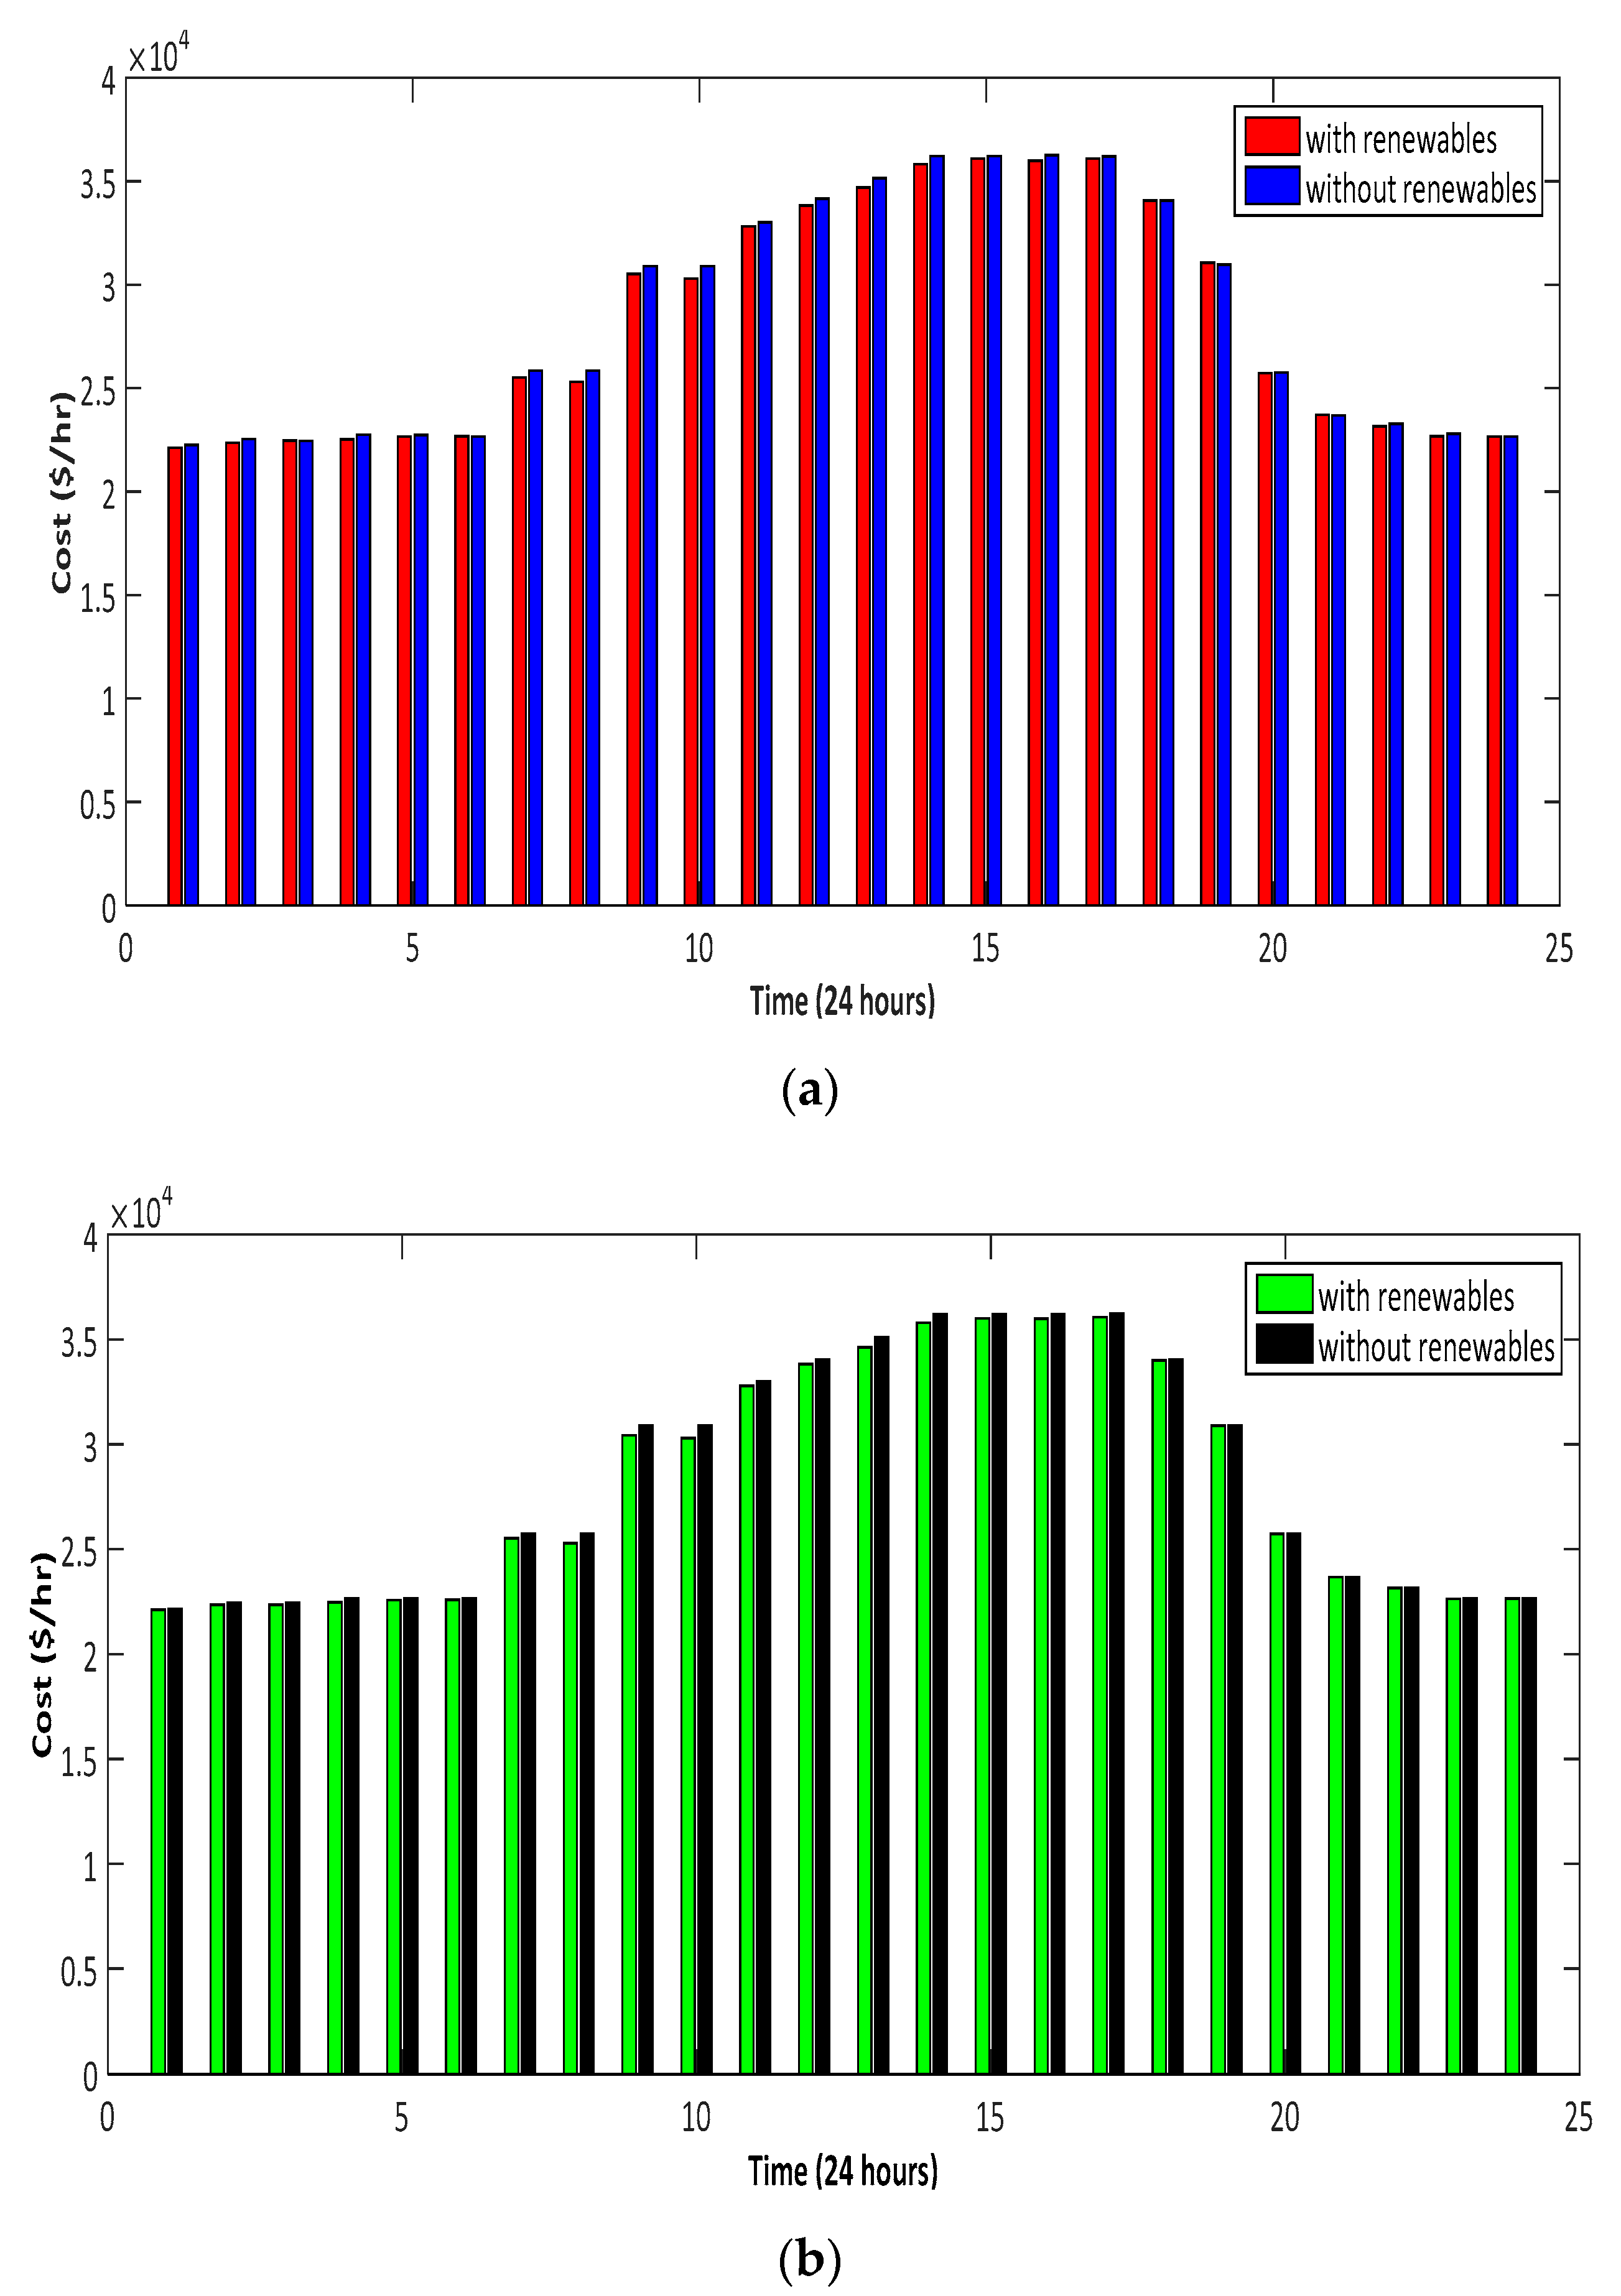
4.1.2. Cost Offered by BA and dBA
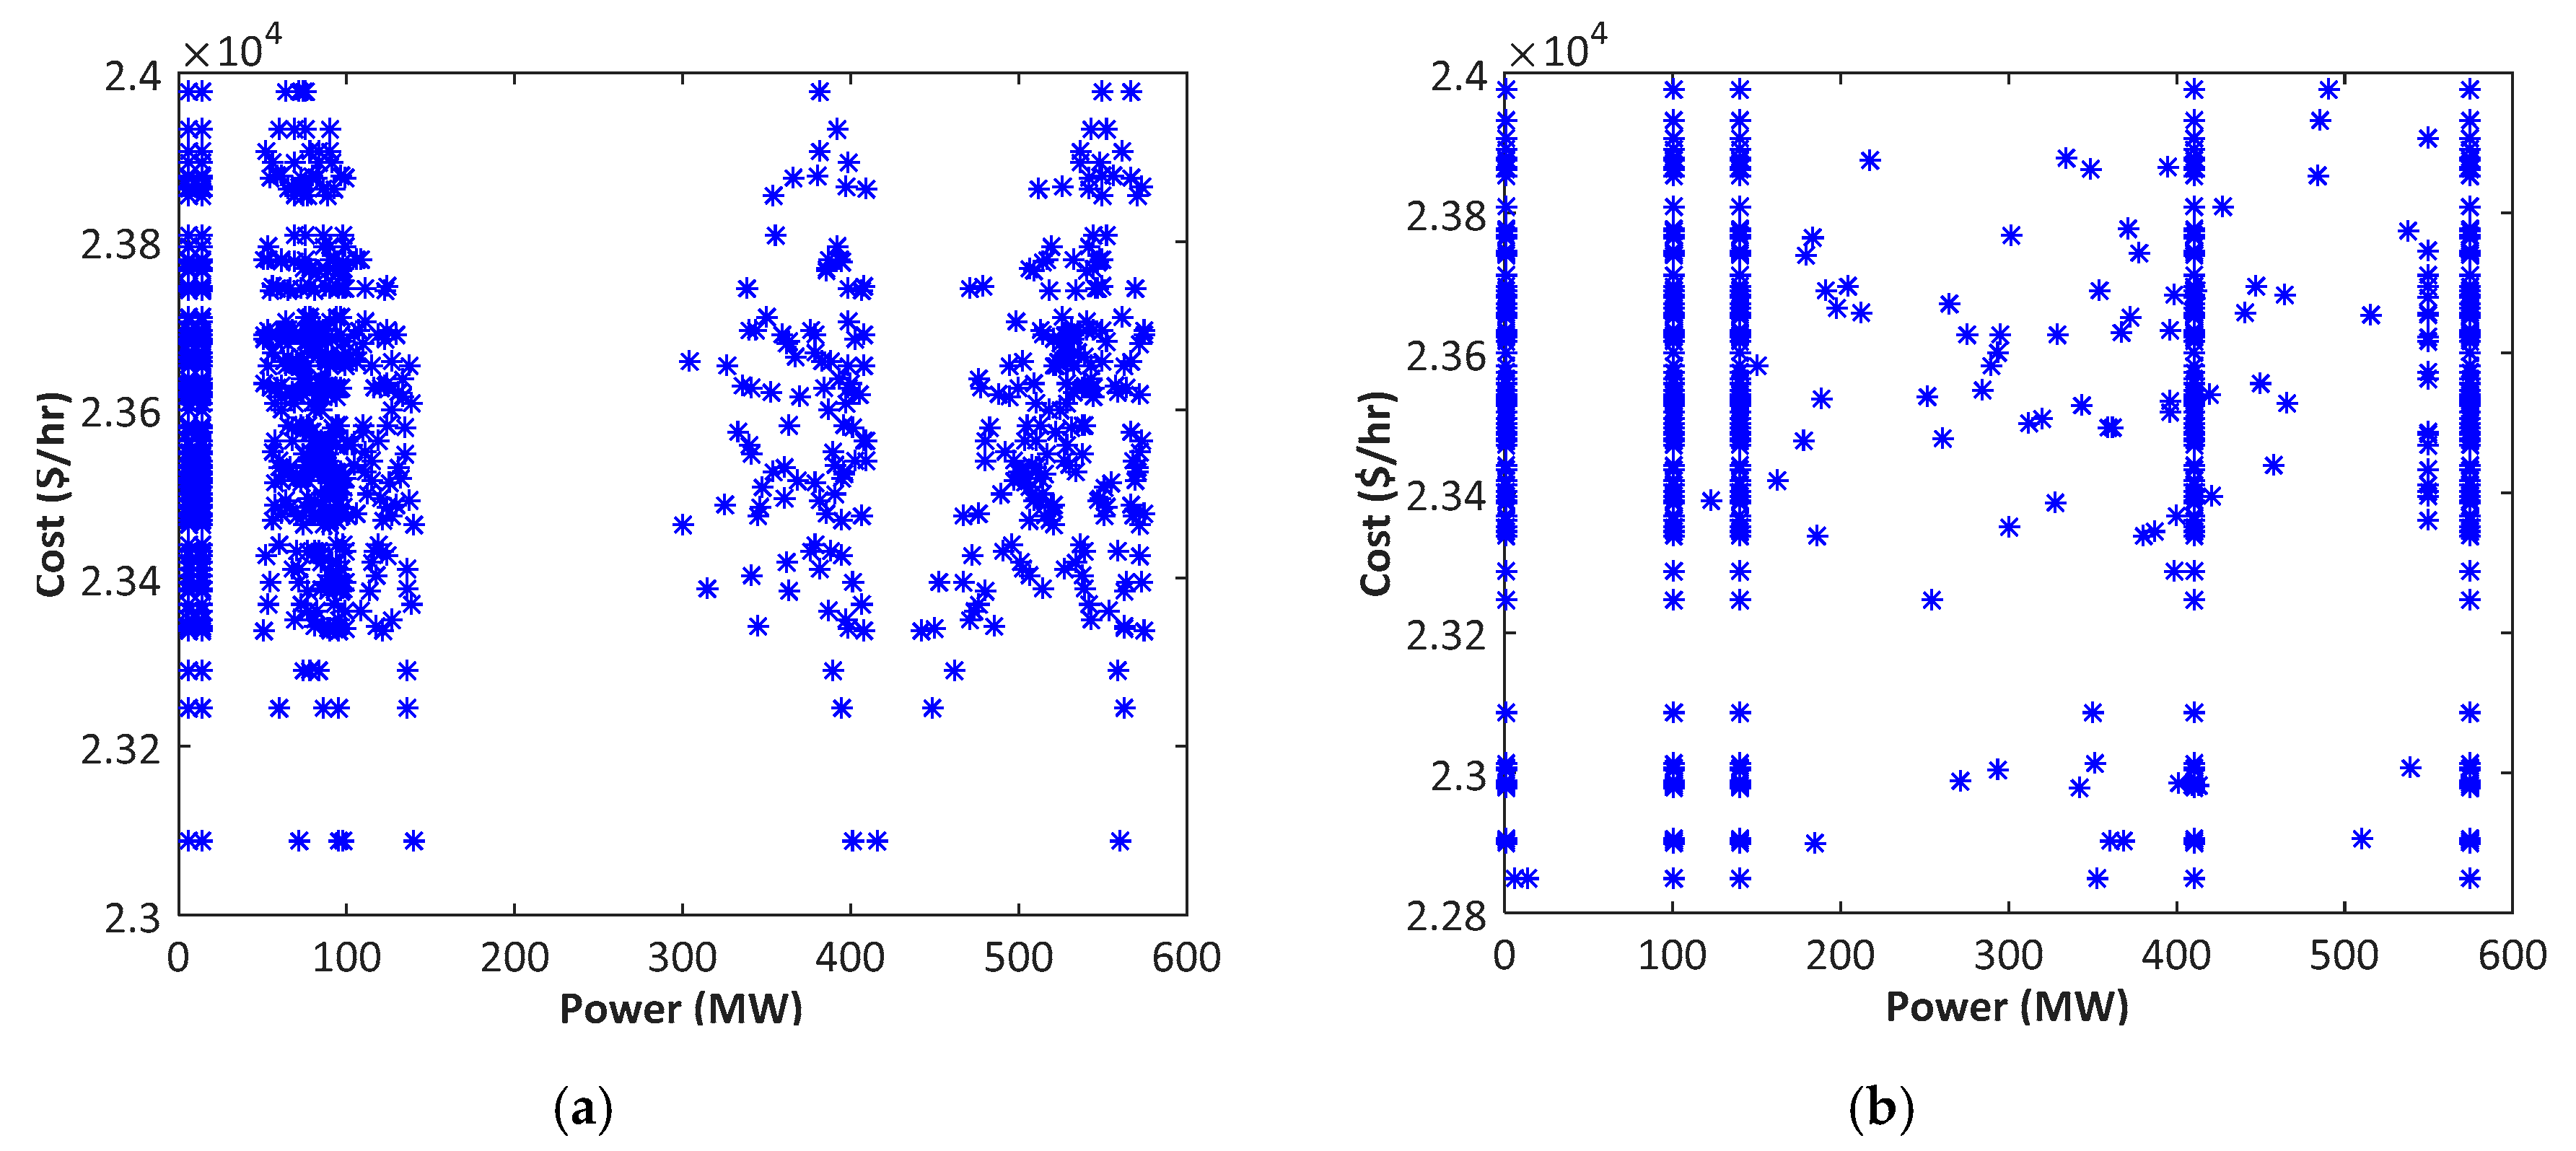
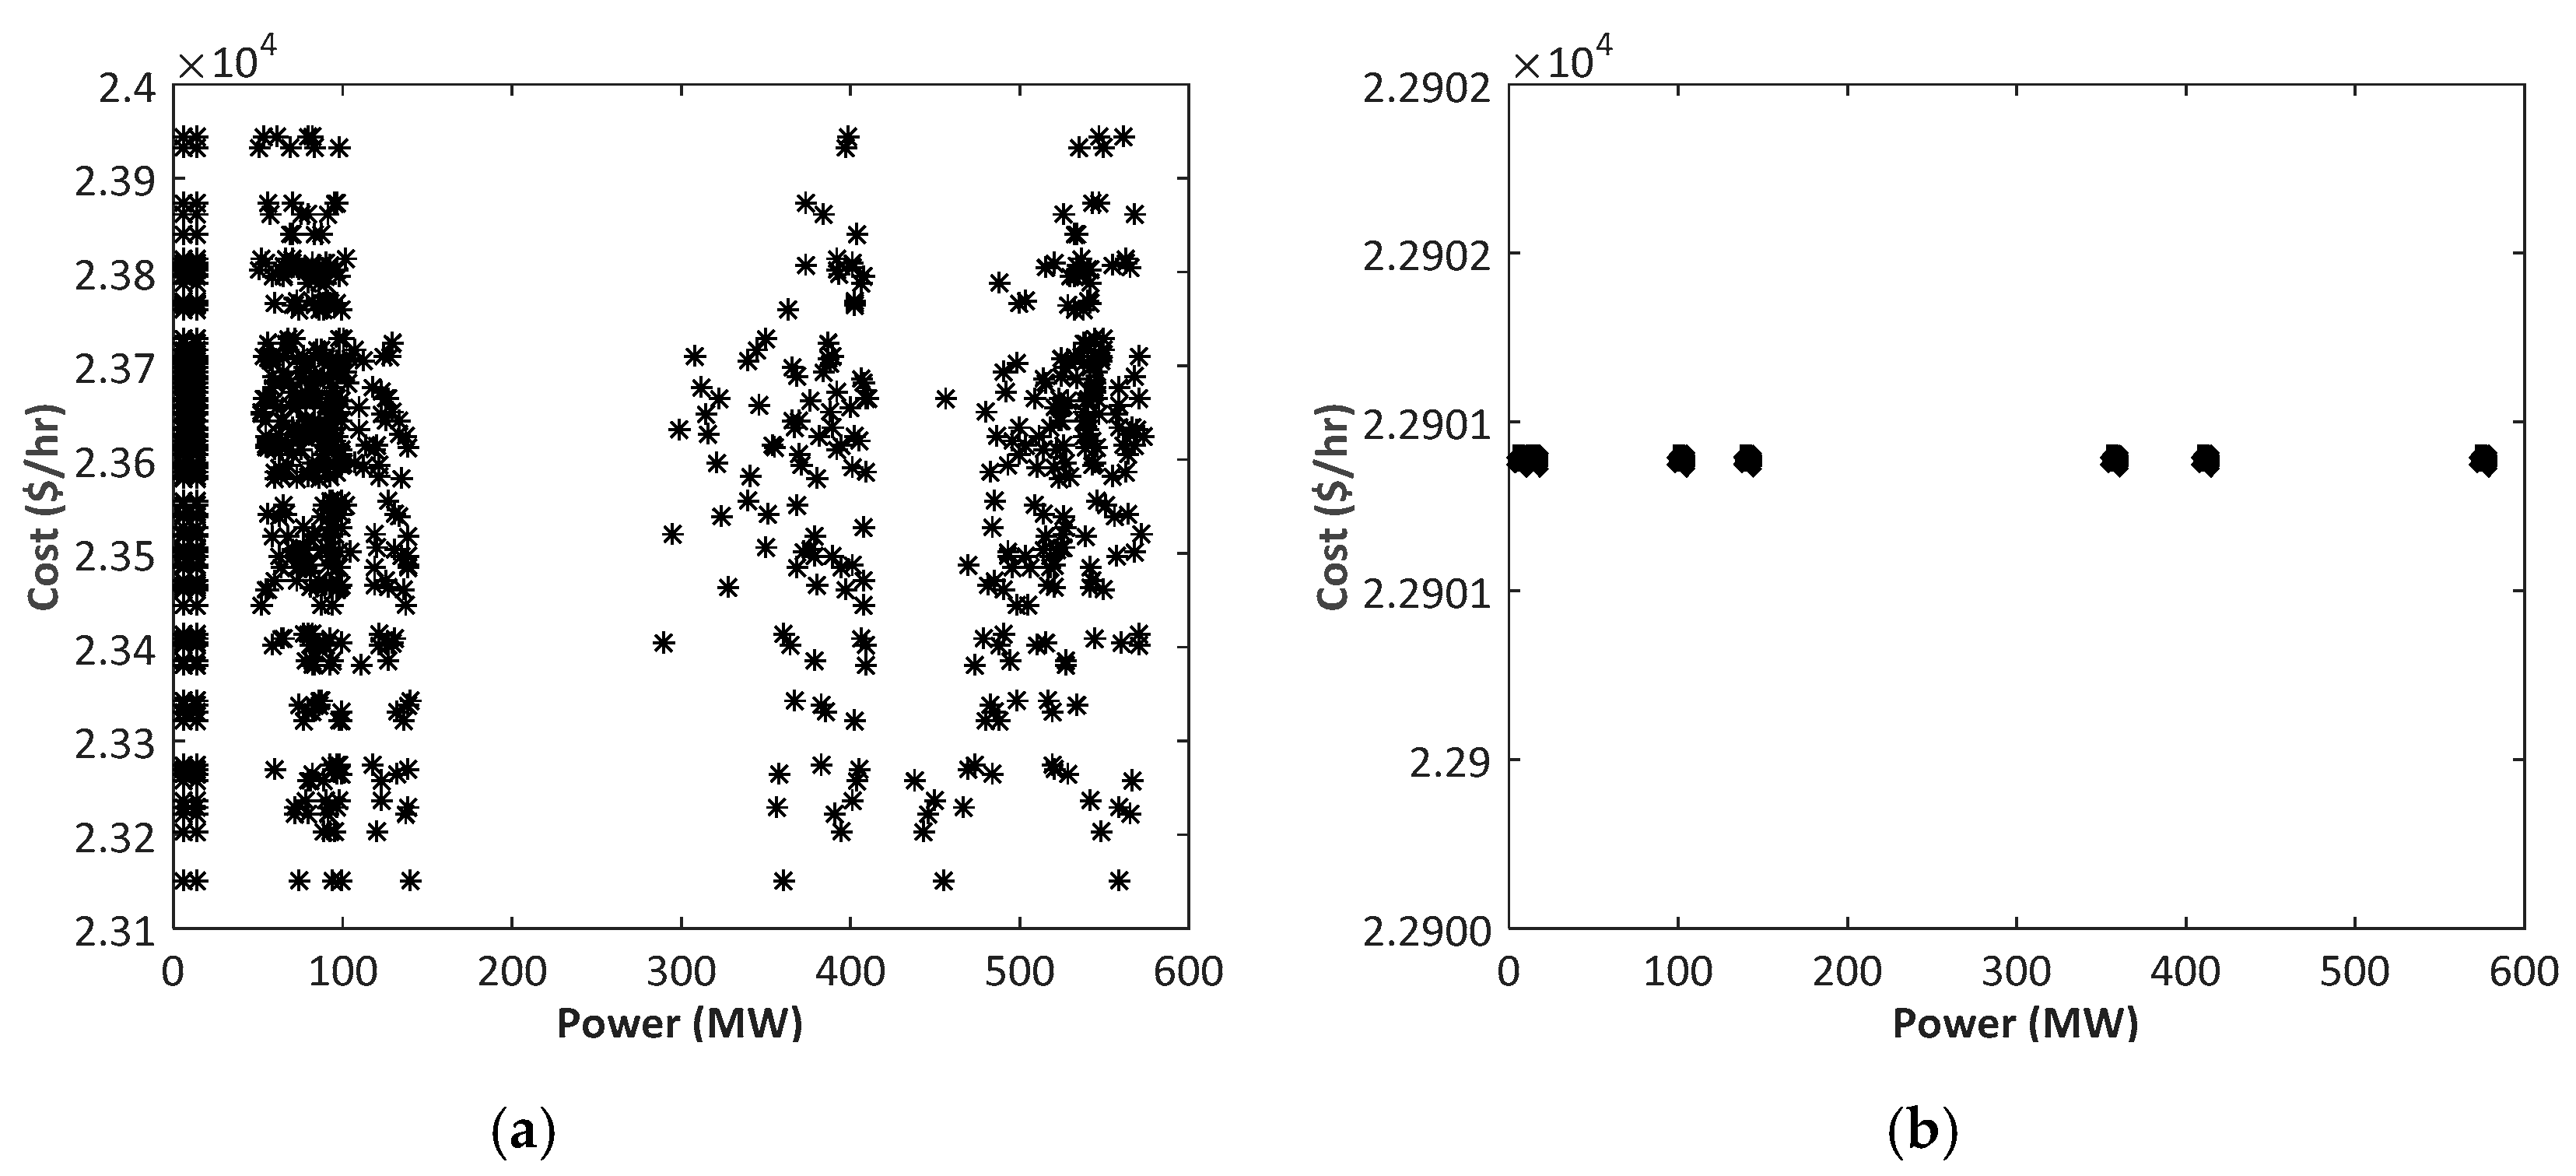
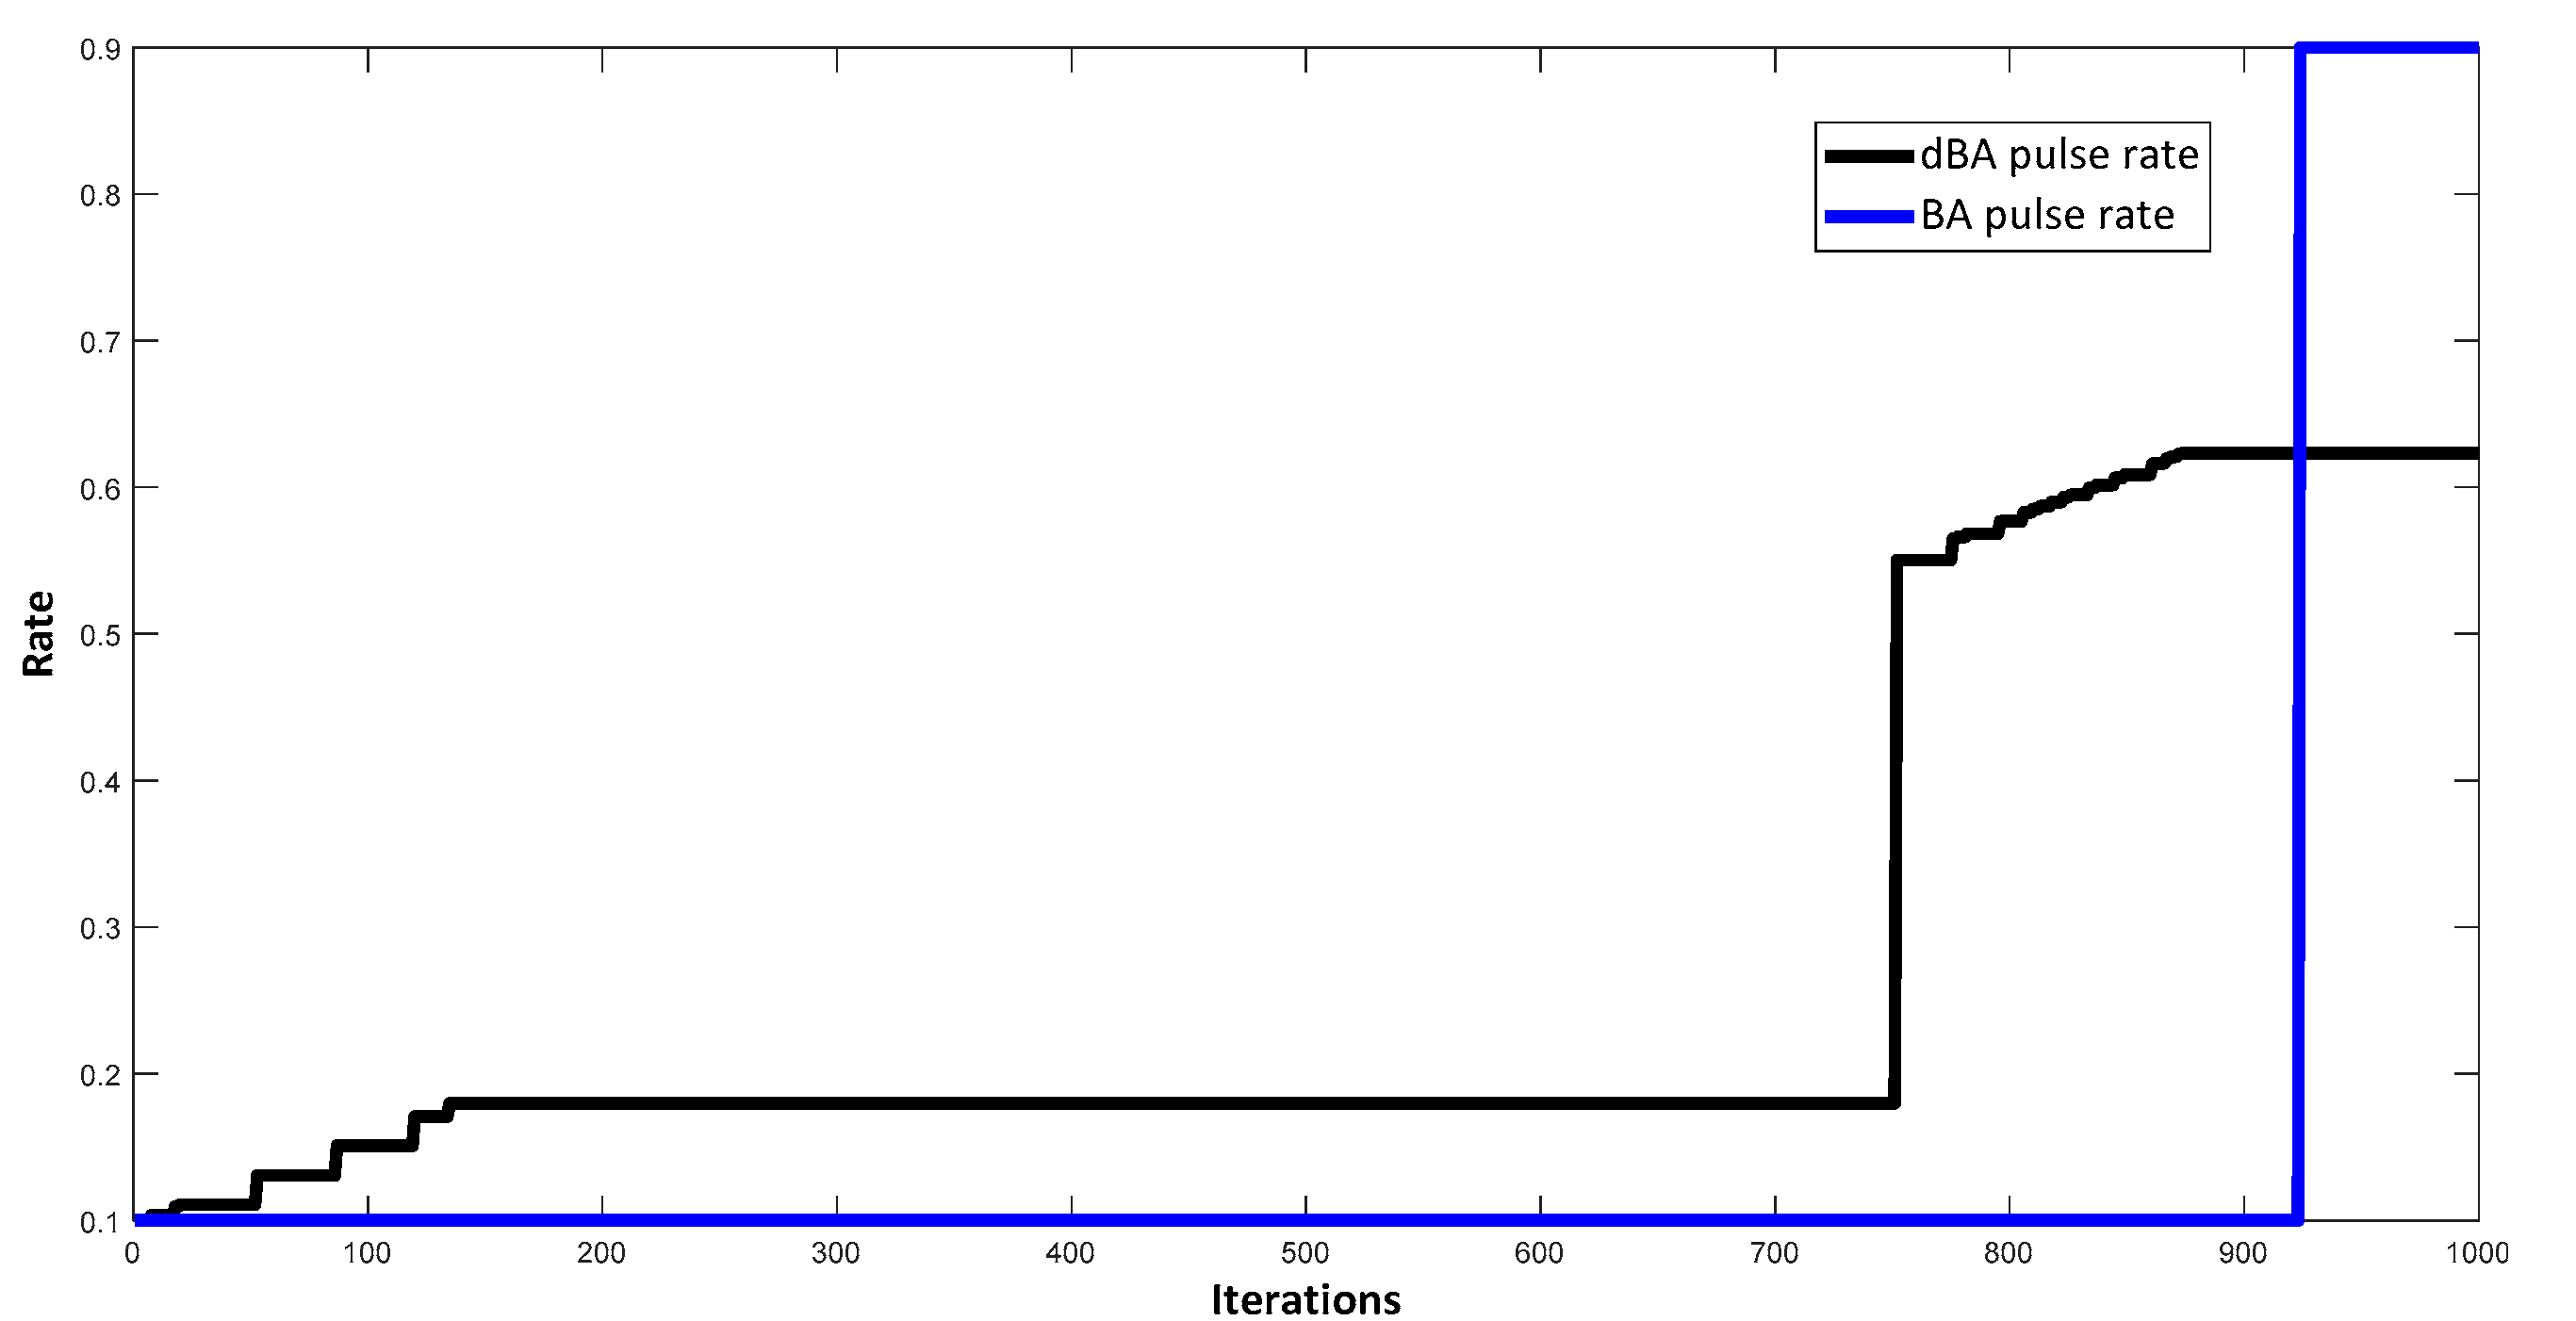
4.1.3. Characteristics Offered by BA and dBA
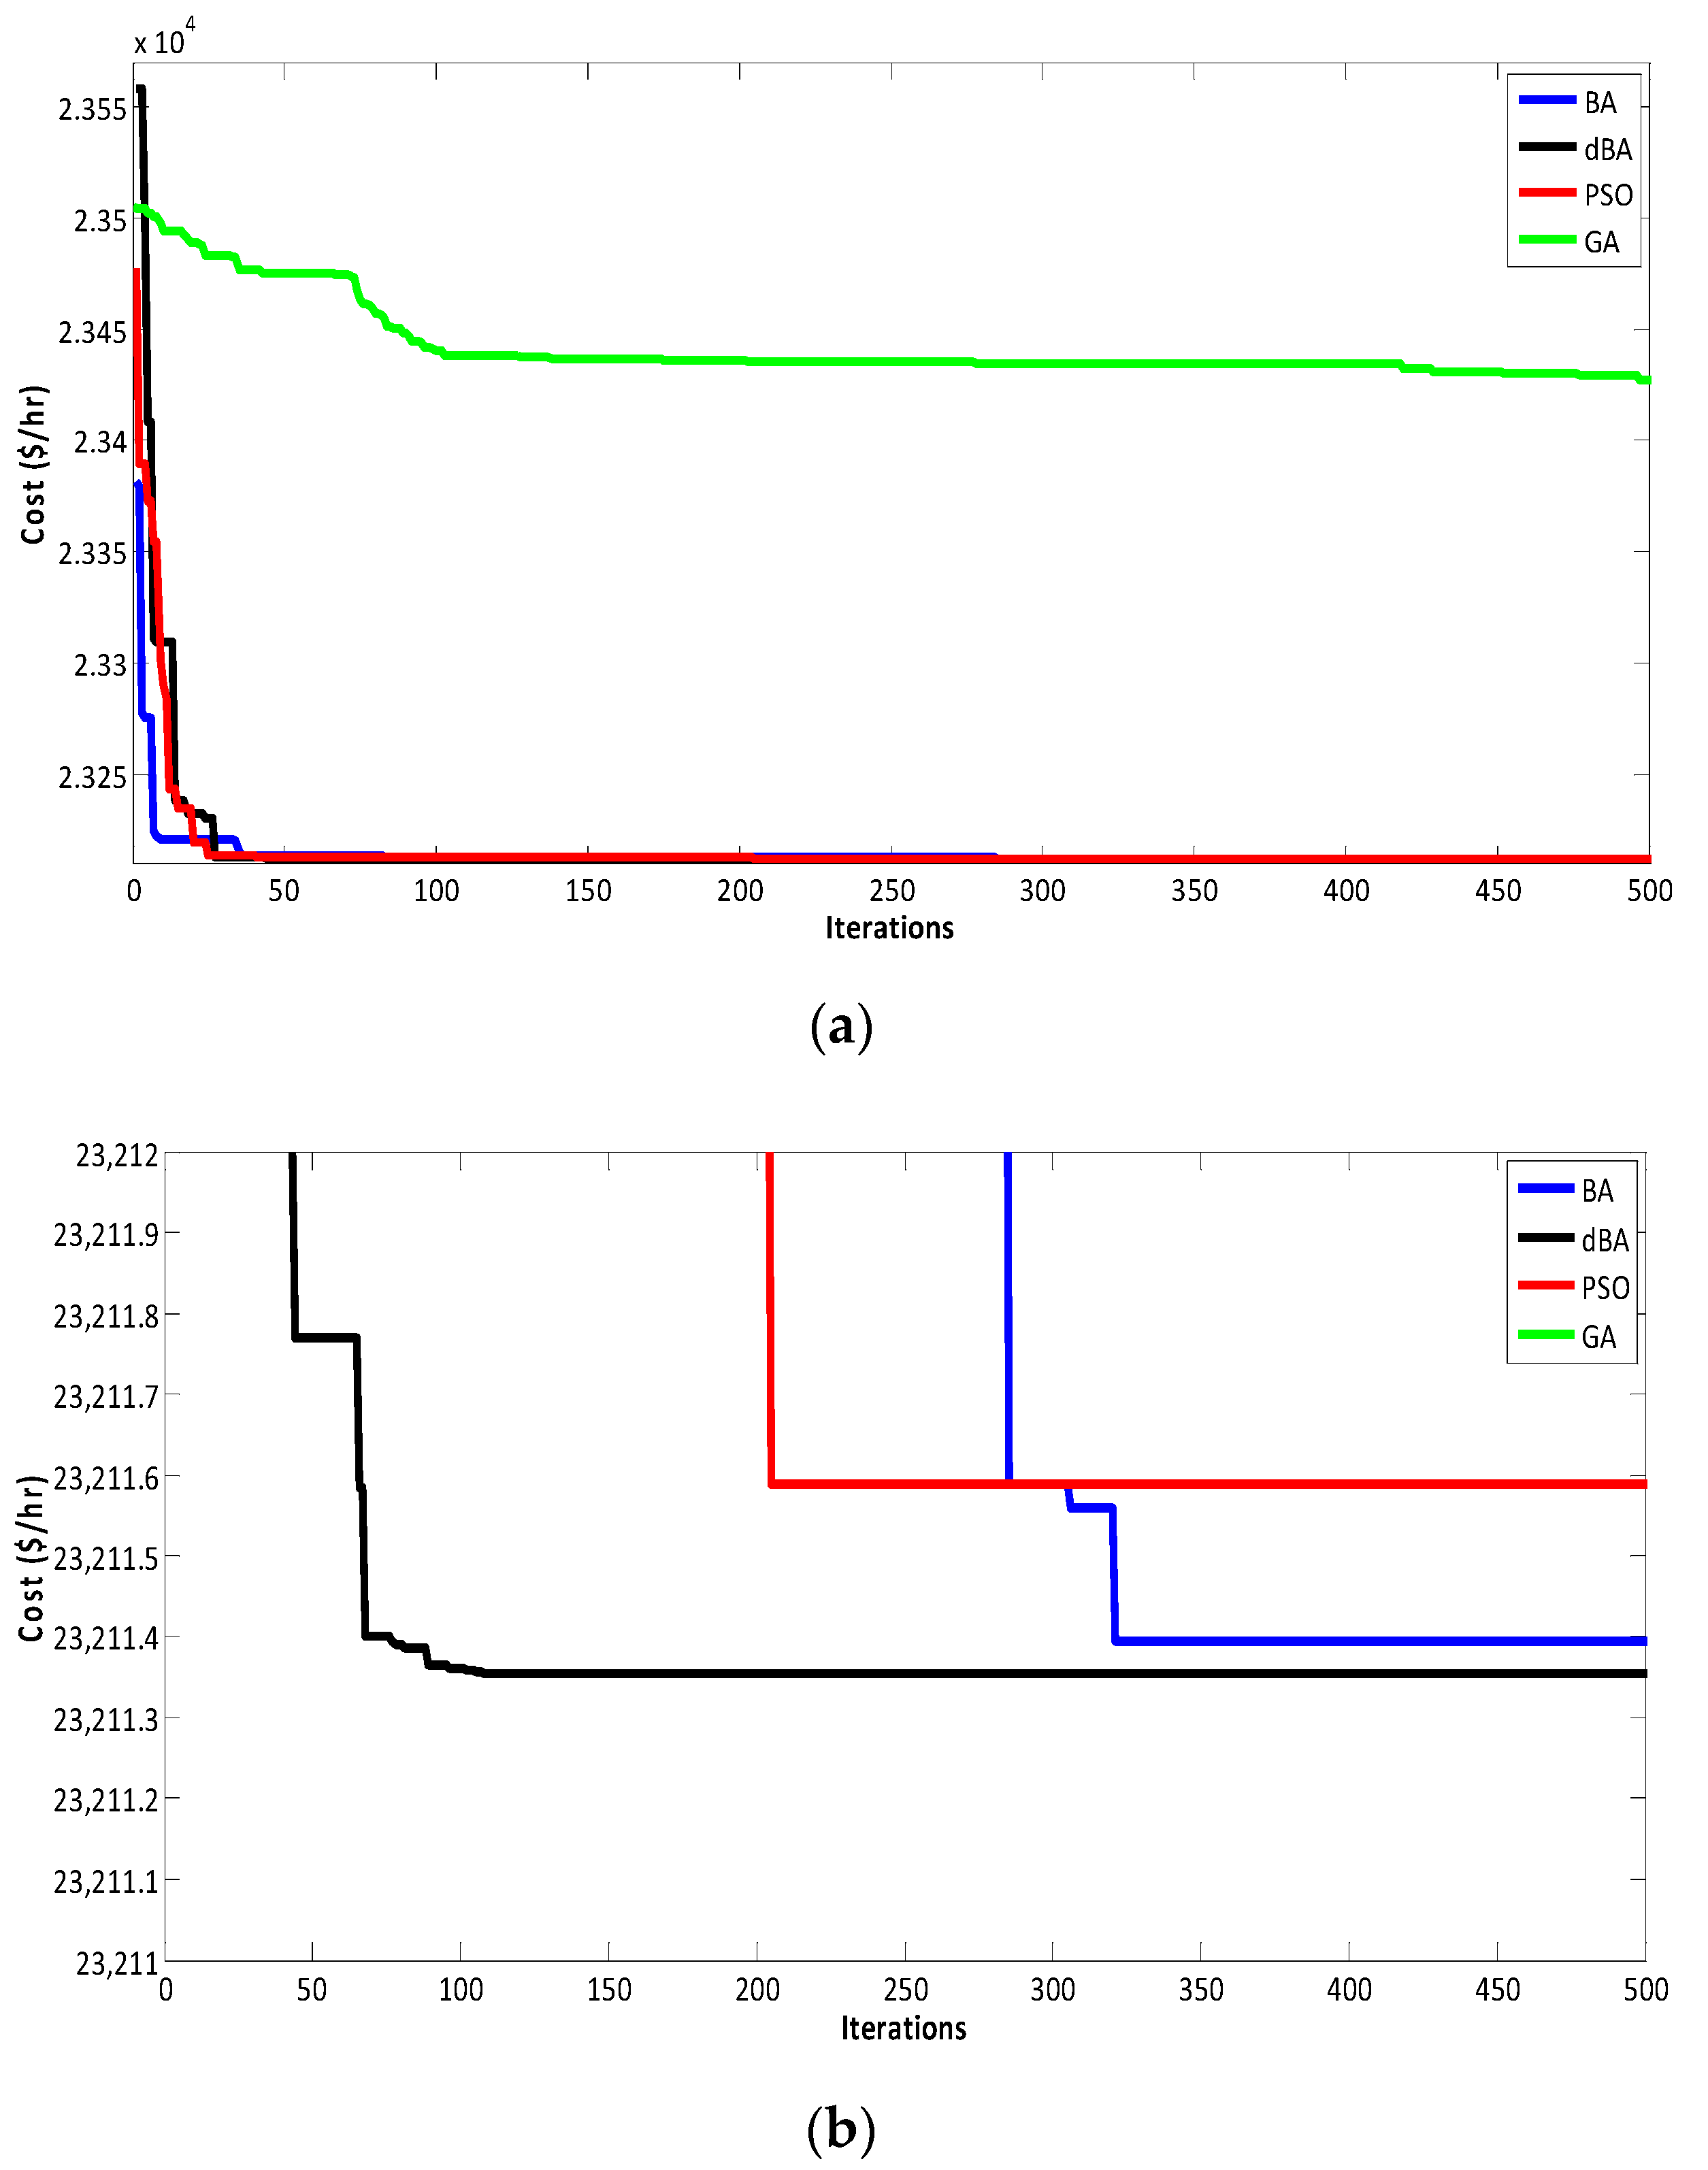
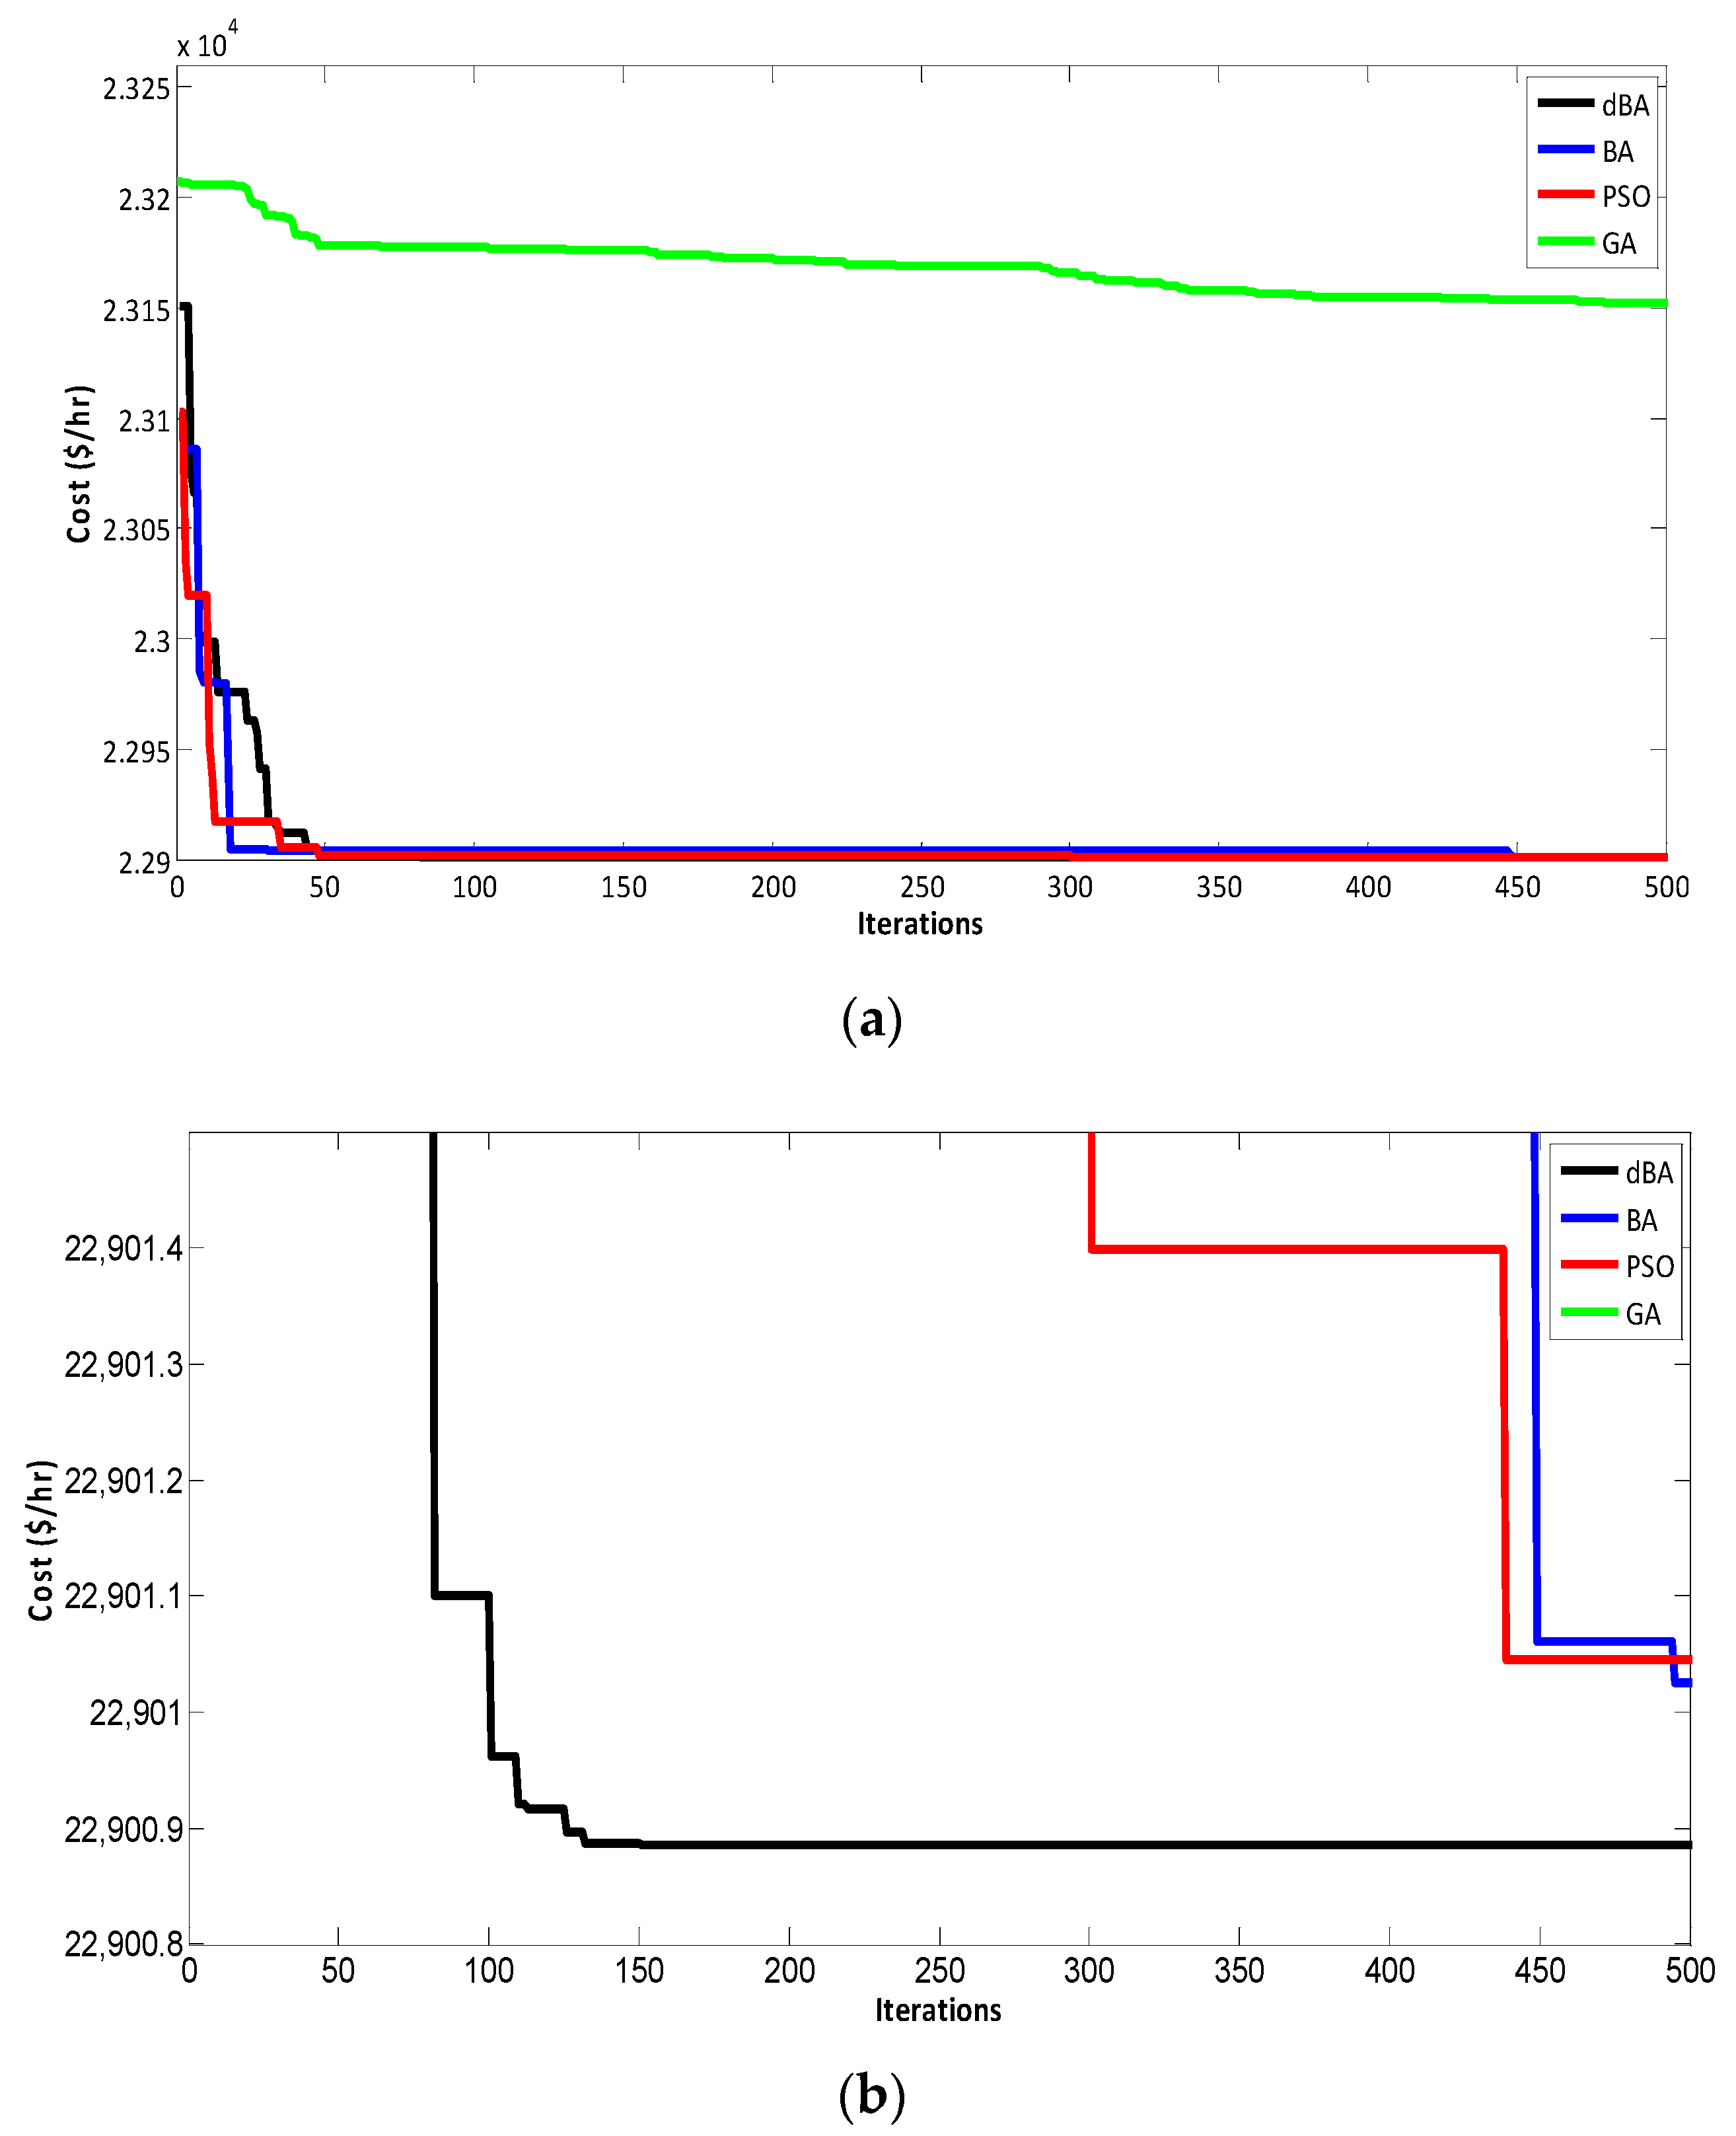
4.1.4. Comparison of dBA, BA, PSO, and GA
4.2. Case 2: A 15 Thermal Unit System
4.2.1. Data
4.2.2. Cost Offered by the BA and dBA
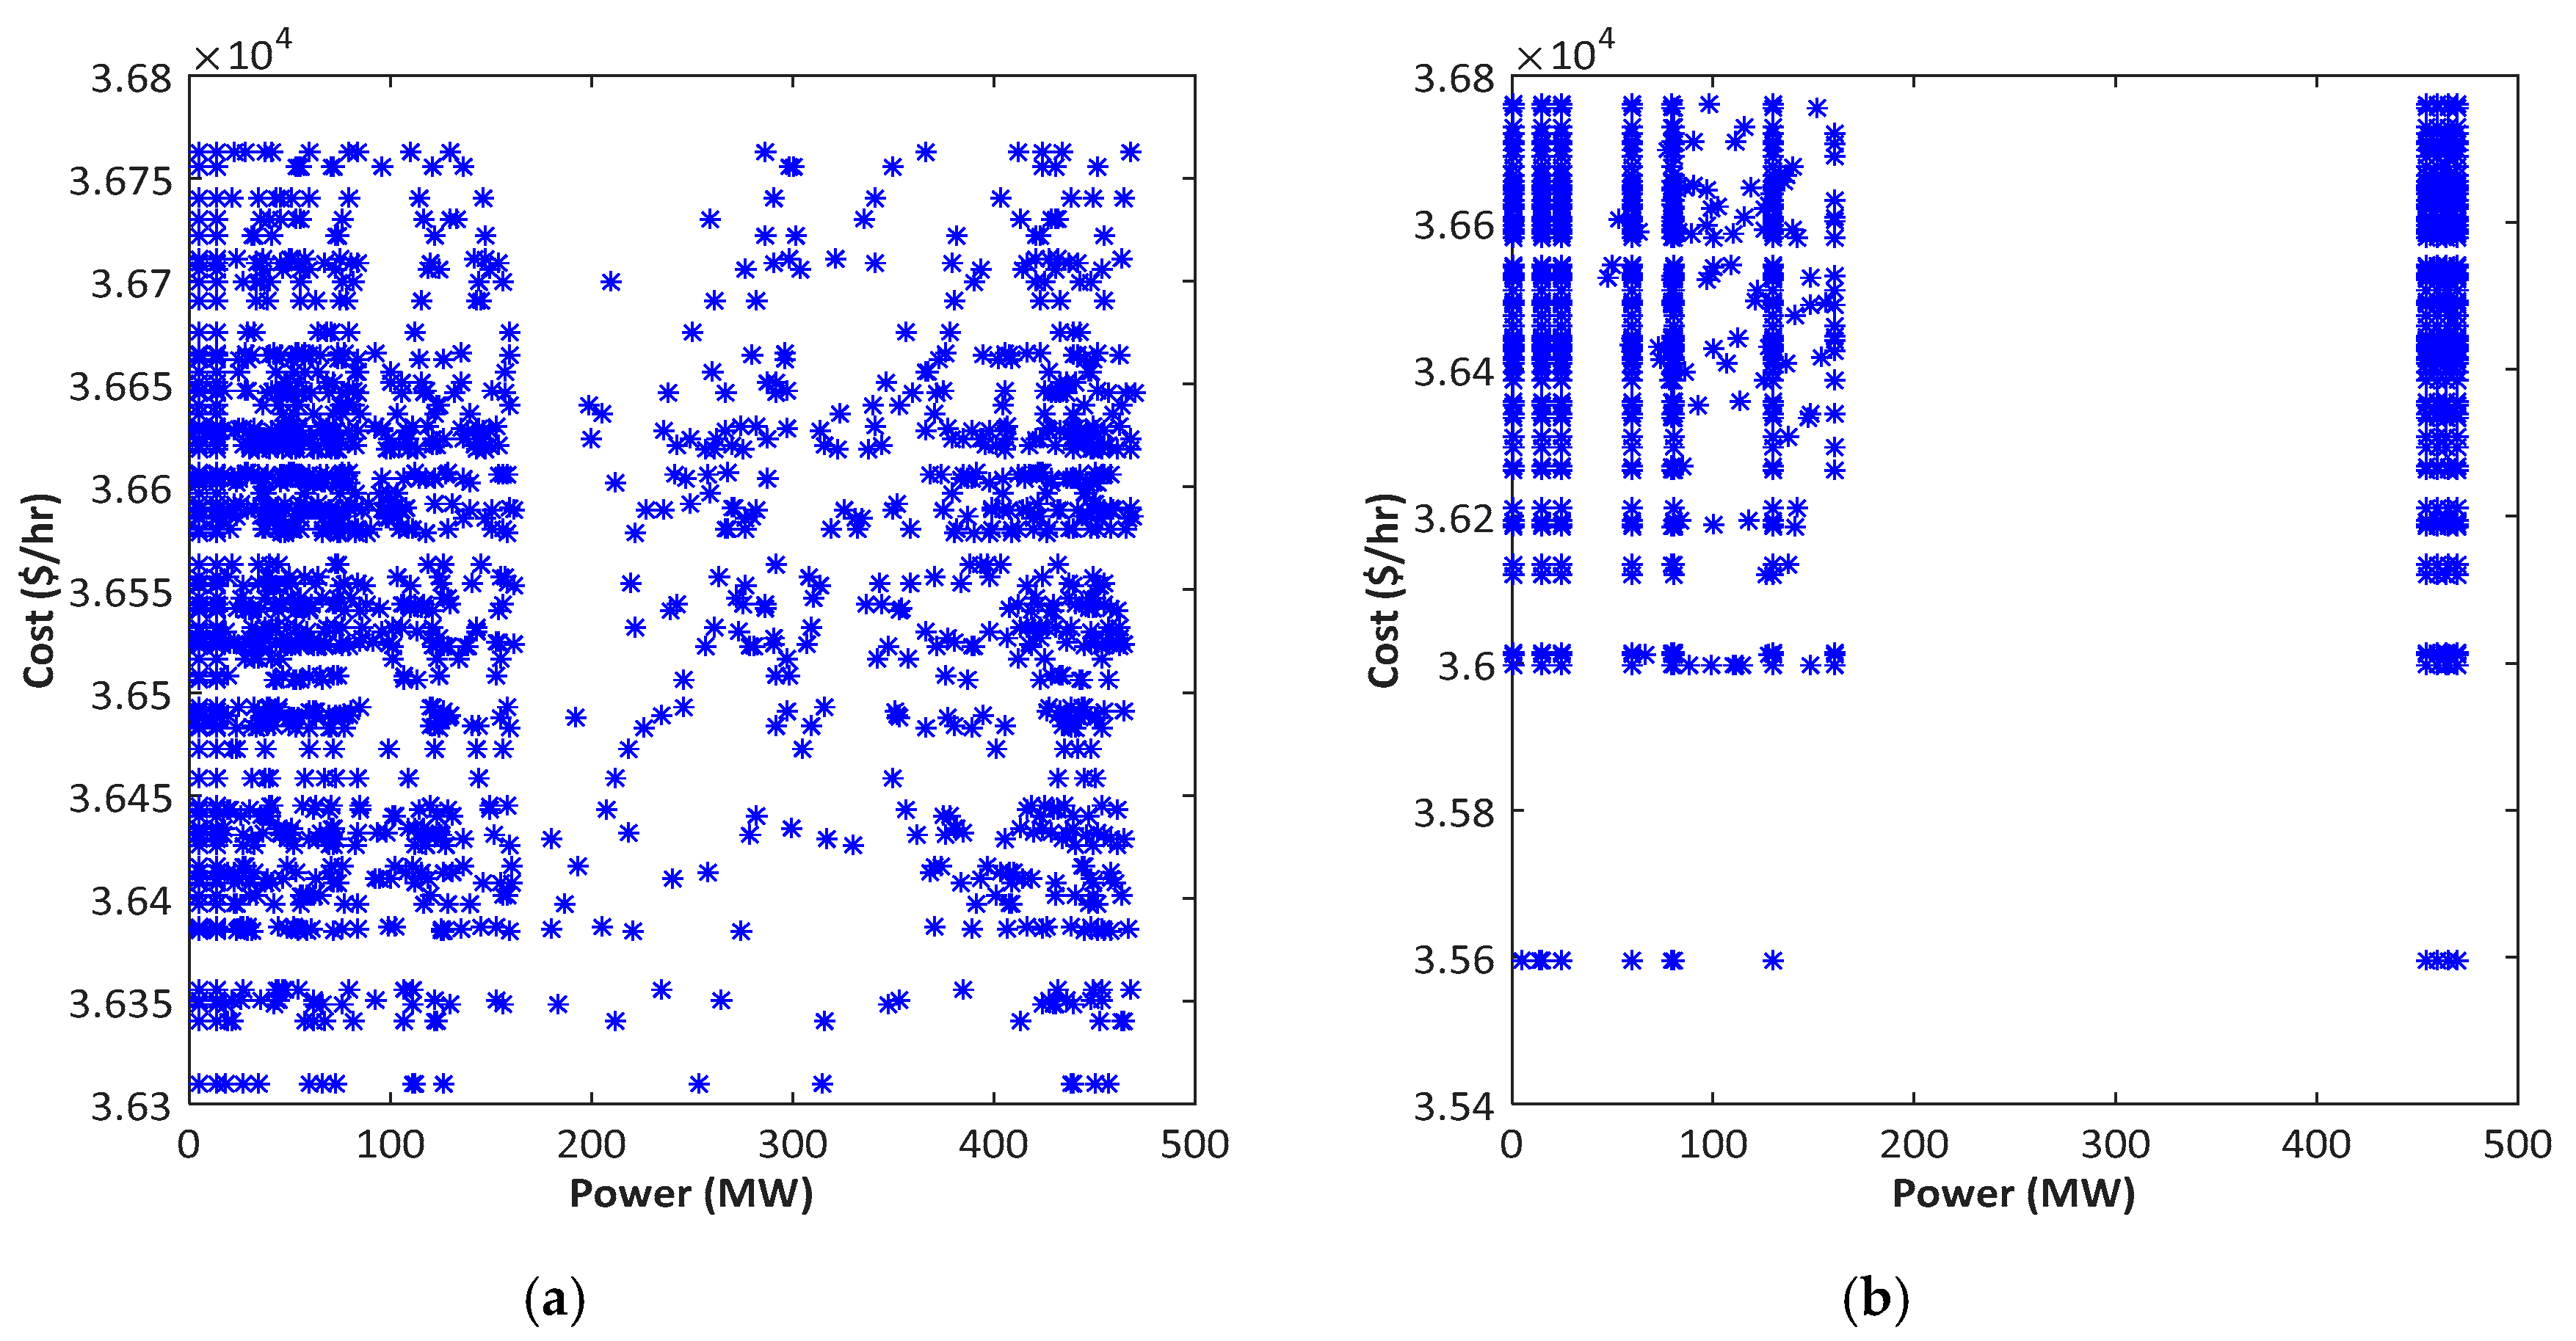
4.2.3. Characteristics Offered by BA and dBA
4.2.4. Comparison of dBA, BA, PSO, and GA
4.3. Case 3: 6 Thermal Units with Valve Point Effect
4.3.1. Data
4.3.2. Cost Offered by the BA and dBA
4.3.3. Comparison with Other Algorithms
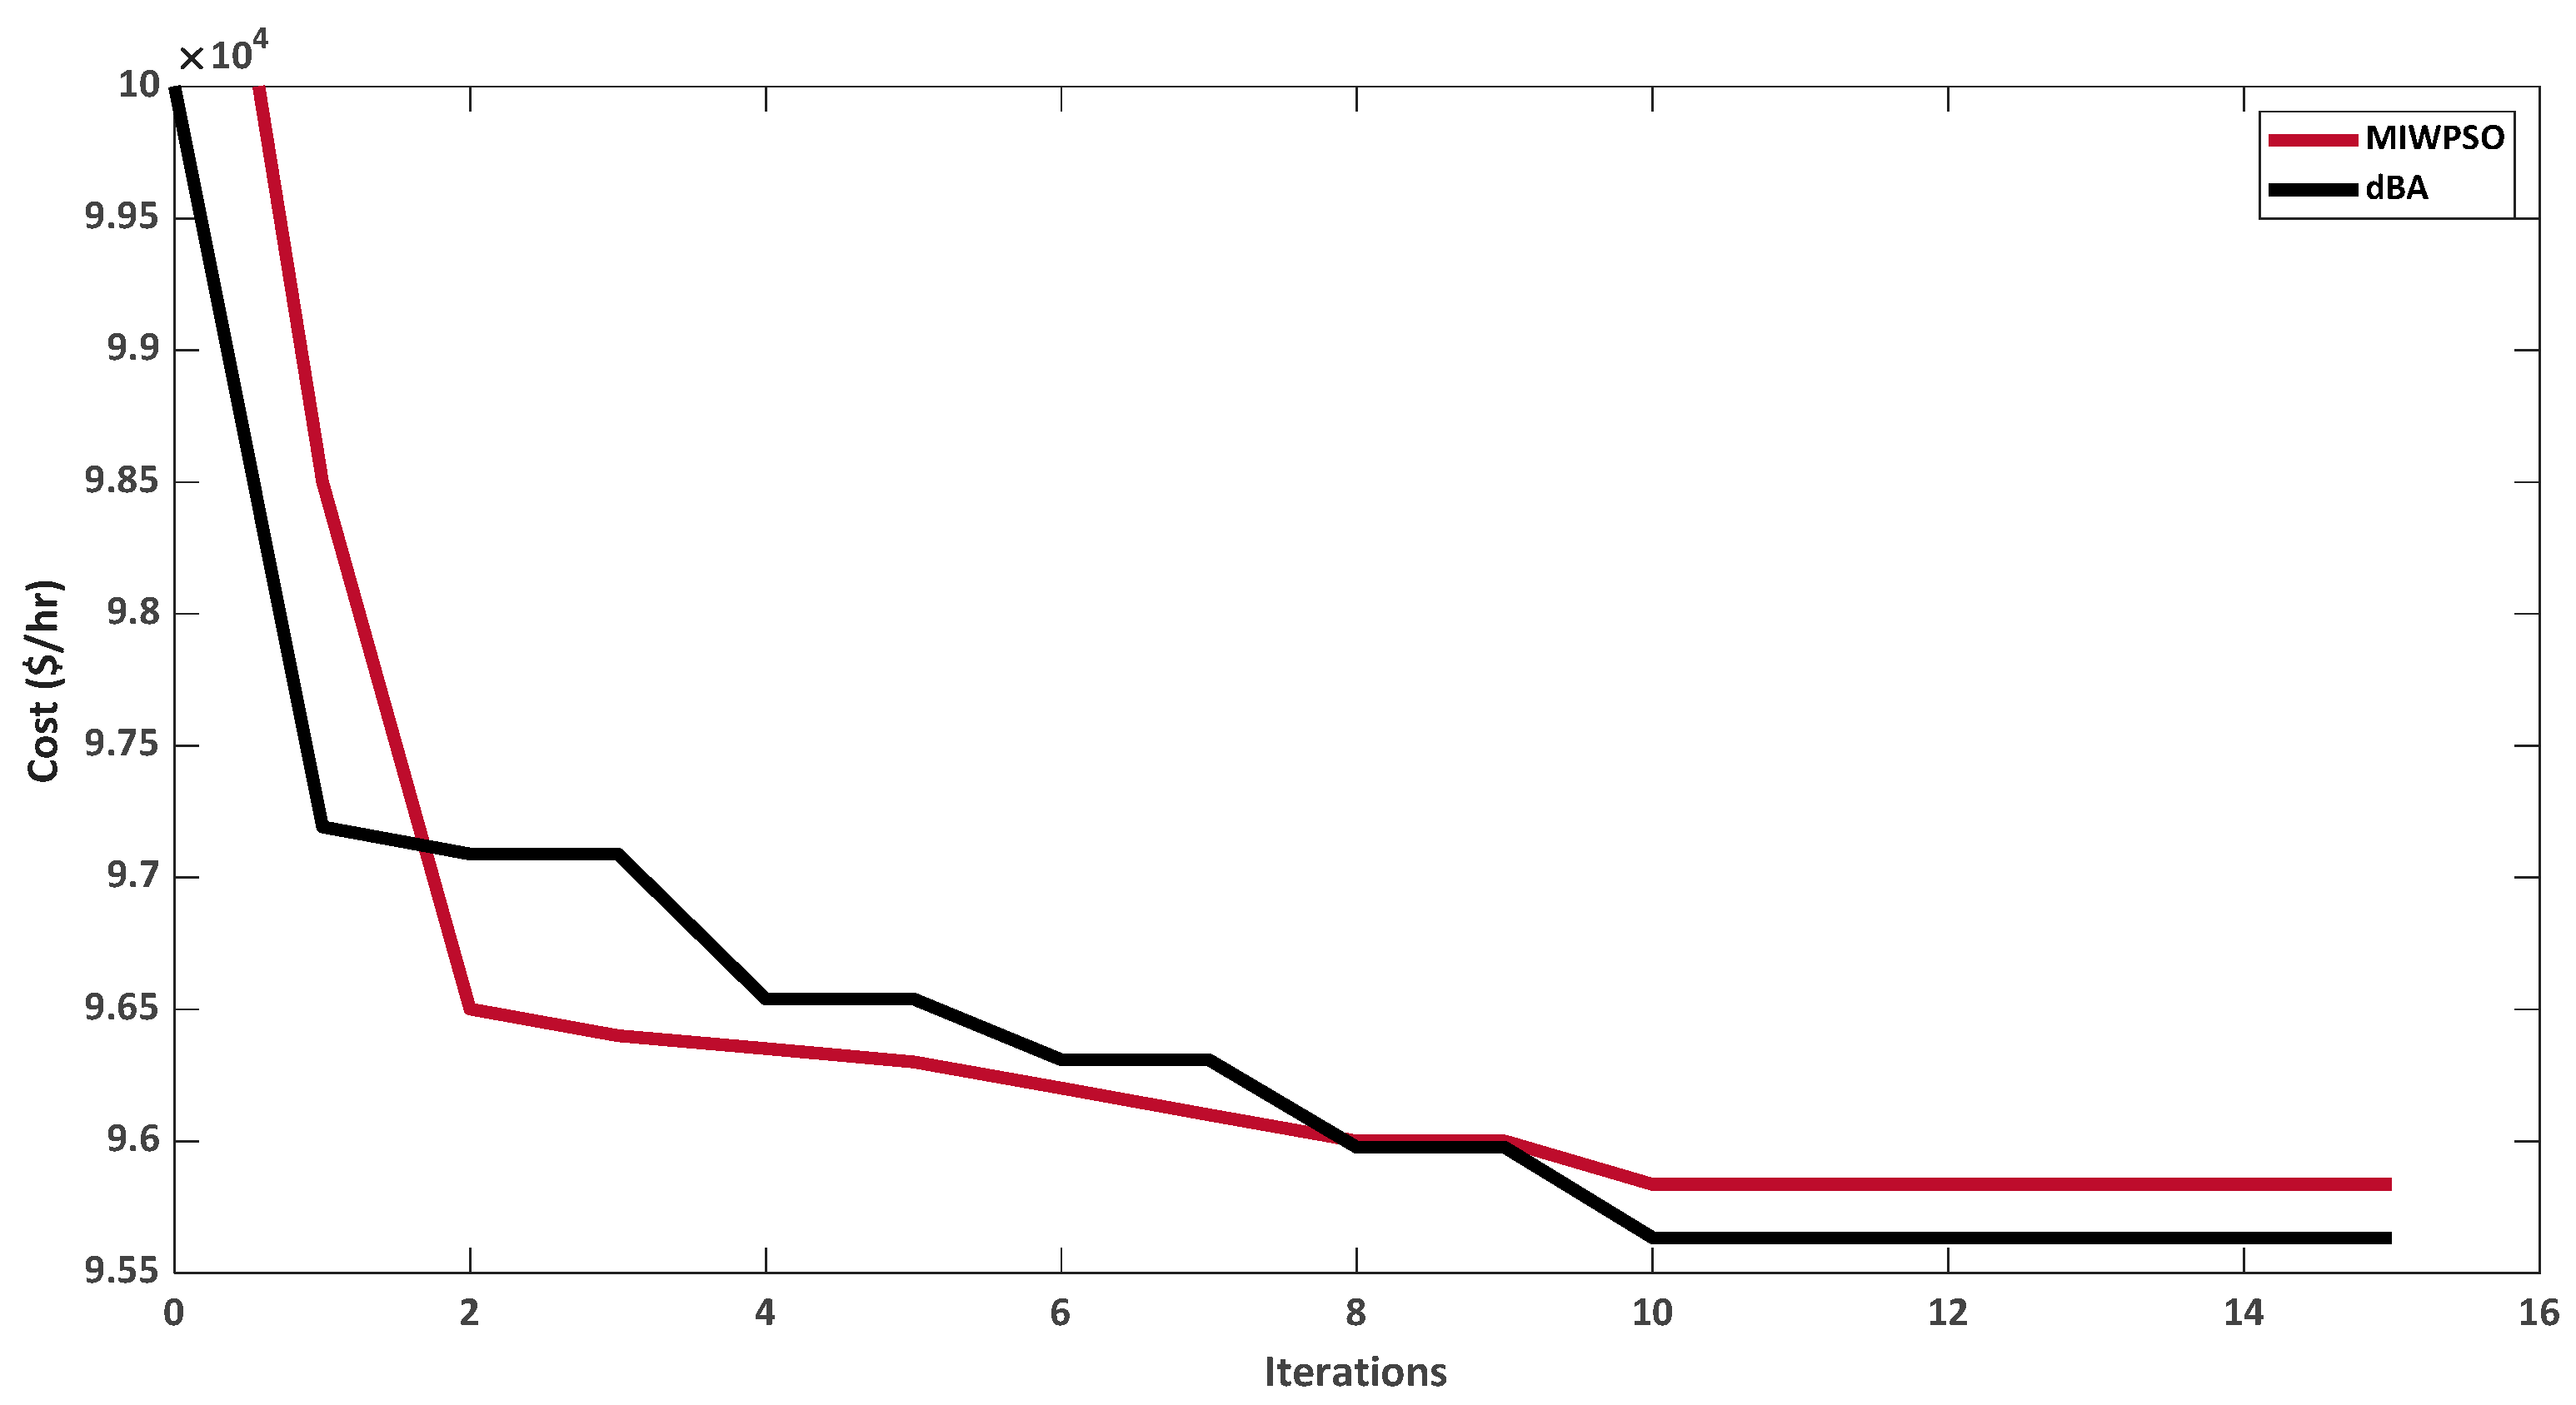
4.4. Case 4
5. Conclusions
Author Contributions
Funding
Acknowledgments
Conflicts of Interest
References
- Niknam, T.; Azizipanah-Abarghooee, R.; Aghaei, J. A new modified teaching-learning algorithm for reserve constrained dynamic economic dispatch. IEEE Trans. Power Syst. 2012, 28, 749–763. [Google Scholar] [CrossRef]
- Park, J.-B.; Lee, K.-S.; Shin, J.-R. A particle swarm optimization for economic dispatch with nonsmooth cost functions. IEEE Trans. Power Syst. 2005, 20, 34–42. [Google Scholar] [CrossRef]
- Puri, V.; Chauhan, Y.K. A solution to economic dispatch problem using augmented Lagrangian particle swarm optimization. Int. J. Emerg. Technol. Adv. Eng. ISSN 2012, 2250–2459. [Google Scholar]
- Park, J.-B.; Jeong, Y.-W.; Shin, J.-R.; Lee, K.Y. An improved particle swarm optimization for nonconvex economic dispatch problems. IEEE Trans. Power Syst. 2009, 25, 156–166. [Google Scholar] [CrossRef]
- Yang, Y.; Wei, B.; Liu, H.; Zhang, Y.; Zhao, J.; Manla, E. Chaos firefly algorithm with self-adaptation mutation mechanism for solving large-scale economic dispatch with valve-point effects and multiple fuel options. IEEE Access 2018, 6, 45907–45922. [Google Scholar] [CrossRef]
- Vo, D.N.; Schegner, P.; Ongsakul, W. Cuckoo search algorithm for non-convex economic dispatch. IET Gener. Transm. Distrib. 2013, 7, 645–654. [Google Scholar] [CrossRef]
- Niknam, T.; Golestaneh, F. Enhanced bee swarm optimization algorithm for dynamic economic dispatch. IEEE Syst. J. 2013, 7, 754–762. [Google Scholar] [CrossRef]
- Zaman, M.F.; Elsayed, S.M.; Ray, T.; Sarker, R.A. Evolutionary algorithms for dynamic economic dispatch problems. IEEE Trans. Power Syst. 2016, 31, 1486–1495. [Google Scholar] [CrossRef]
- Dekhici, L.; Borne, P.; Khaled, B. Firefly algorithm for economic power dispatching with pollutants emission. Inform. Econ. 2012, 16, 45–57. [Google Scholar]
- Zhao, J.; Liu, S.; Zhou, M.; Guo, X.; Qi, L. Modified cuckoo search algorithm to solve economic power dispatch optimization problems. IEEE/CAA J. Autom. Sin. 2018, 5, 794–806. [Google Scholar] [CrossRef]
- Ma, X.; Liu, Y. Particle swarm optimization to solving economic load dispatch with spinning reserve. In Proceedings of the 2010 International Conference on Computer Design and Applications, Qinhuangdao, China, 25–27 June 2010; Volume 4, pp. V4–214–V4–217. [Google Scholar]
- Gaing, Z.-L. Particle swarm optimization to solving the economic dispatch considering the generator constraints. IEEE Trans. Power Syst. 2003, 18, 1187–1195. [Google Scholar] [CrossRef]
- Meng, K.; Wang, H.-G.; Dong, Z.; Wong, K.P. Quantum-inspired particle swarm optimization for valve-point economic load dispatch. IEEE Trans. Power Syst. 2009, 25, 215–222. [Google Scholar] [CrossRef]
- Abdullah, N.R.H.; Ghazali, N.; Ibrahim, N.; Solleh, N.F.; Samad, R.; Mustafa, M.; Pebrianti, D. Solving economic dispatch (ED) problem using artificial immune system, evolutionary programming and particle swarm optimization. ARPN J. Eng. Appl. Sci. 2006, 11, 6663–6667. [Google Scholar]
- Khamsawang, S.; Jiriwibhakorn, S. Solving the economic dispatch problem using novel particle swarm optimization. World Acad. Sci. Eng. Technol.-Int. J. Electr. Comput. Energ. Electron. Commun. Eng. 2009, 3, 529–534. [Google Scholar]
- Abbas, G.; Gu, J.; Farooq, U.; Asad, M.U.; El-Hawary, M. Solution of an economic dispatch problem through particle swarm optimization: A detailed survey-Part I. IEEE Access 2017, 5, 15105–15141. [Google Scholar] [CrossRef]
- Abbas, G.; Gu, J.; Farooq, U.; Raza, A.; Asad, M.U.; El-Hawary, M.E. Solution of an economic dispatch problem through particle swarm optimization: A detailed survey; Part II. IEEE Access 2017, 5, 24426–24445. [Google Scholar] [CrossRef]
- Trivedi, I.N.; Jangir, P.; Bhoye, M.; Jangir, N. An economic load dispatch and multiple environmental dispatch problem solution with microgrids using interior search algorithm. Neural Comput. Appl. 2018, 30, 2173–2189. [Google Scholar] [CrossRef]
- Biswal, S.; Barisal, A.K.; Behera, A.; Prakash, T. Optimal power dispatch using BAT algorithm. In Proceedings of the 2013 International Conference on Energy Efficient Technologies for Sustainability, Nagercoil, India, 10–12 April 2013; pp. 1018–1023. [Google Scholar]
- Sakthivel, S.; Natarajan, R.; Gurusamy, P. Application of bat optimization algorithm for economic load dispatch considering valve point effects. Int. J. Comput. Appl. 2013, 67, 35–39. [Google Scholar] [CrossRef][Green Version]
- Nguyen, T.T.; Ho, S.D. Bat algorithm for economic emission load dispatch problem. Int. J. Adv. Sci. Technol. 2016, 86, 51–60. [Google Scholar] [CrossRef]
- Gherbi, Y.A.; Bouzeboudja, H.; Lakdja, F. Economic dispatch problem using bat algorithm. Leonardo J. Sci. 2014, 24, 75–84. [Google Scholar]
- Latif, A.; Palensky, P. Economic dispatch using modified bat algorithm. Algorithms 2014, 7, 328–338. [Google Scholar] [CrossRef]
- Niknam, T.; Azizipanah-Abarghooee, R.; Zare, M.; Bahmanifirouzi, B. Reserve constrained dynamic environmental/economic dispatch: A new multiobjective self-adaptive learning bat algorithm. IEEE Syst. J. 2013, 7, 763–776. [Google Scholar] [CrossRef]
- Adarsh, B.; Raghunathan, T.; Jayabarathi, T.; Yang, X.-S. Economic dispatch using chaotic bat algorithm. Energy 2016, 96, 666–675. [Google Scholar] [CrossRef]
- Pradhan, G.; Dewangan, P.D. Solving optimal load dispatch problem using enhanced BAT optimization algorithm. In Proceedings of the 2017 Innovations in Power and Advanced Computing Technologies (i-PACT), Vellore, India, 21–22 April 2017; pp. 1–6. [Google Scholar]
- Fister, I.; Yang, X.-S.; Fong, S.; Zhuang, Y. Bat algorithm: Recent advances. In Proceedings of the 2014 IEEE 15th International Symposium on Computational Intelligence and Informatics (CINTI), Budapest, Hungary, 19–21 November 2014; pp. 163–167. [Google Scholar]
- Gautham, S.; Rajamohan, J. Economic load dispatch using novel bat algorithm. In Proceedings of the 2016 IEEE 1st International Conference on Power Electronics, Intelligent Control and Energy Systems (ICPEICES), Dehli, India, 4–6 July 2016; pp. 1–4. [Google Scholar]
- Liang, H.; Liu, Y.; Shen, Y.; Li, F.; Man, Y. A hybrid bat algorithm for economic dispatch with random wind power. IEEE Trans. Power Syst. 2018, 33, 5052–5061. [Google Scholar] [CrossRef]
- Osório, G.; Lujano-Rojas, J.; Matias, J.C.D.O.; Catalão, J.P. A probabilistic approach to solve the economic dispatch problem with intermittent renewable energy sources. Energy 2015, 82, 949–959. [Google Scholar] [CrossRef]
- Nikmehr, N.; Ravadanegh, S.N. A study on optimal power sharing in interconnected microgrids under uncertainty. Int. Trans. Electr. Energy Syst. 2015, 26, 208–232. [Google Scholar] [CrossRef]
- Khan, N.A.; Awan, A.B.; Mahmood, A.; Razzaq, S.; Zafar, A.; Sidhu, G.A.S. Combined emission economic dispatch of power system including solar photo voltaic generation. Energy Convers. Manag. 2015, 92, 82–91. [Google Scholar] [CrossRef]
- Farhat, I.; El-Hawary, M. Dynamic adaptive bacterial foraging algorithm for optimum economic dispatch with valve-point effects and wind power. IET Gener. Transm. Distrib. 2010, 4, 989. [Google Scholar] [CrossRef]
- Li, Z.; Wu, W.; Zhang, B.; Sun, H.; Yang, Y. Dynamic economic dispatch using Lagrangian relaxation with multiplier updates based on a quasi-newton method. IEEE Trans. Power Syst. 2013, 28, 4516–4527. [Google Scholar] [CrossRef]
- Han, L.; Romero, C.E.; Wang, X.; Shi, L. Economic dispatch considering the wind power forecast error. IET Gener. Transm. Distrib. 2018, 12, 2861–2870. [Google Scholar] [CrossRef]
- Brini, S.; Abdallah, H.H.; Ouali, A. Economic dispatch for power system included wind and solar thermal energy. Leonardo J. Sci. 2009, 14, 204–220. [Google Scholar]
- Warsono; King, D.J.; Ozveren, C.S.; Bradley, D. Economic load dispatch optimization of renewable energy in power system using genetic algorithm. In Proceedings of the 2007 IEEE Lausanne Power Tech, Lausanne, Switzerland, 1–5 July 2007; pp. 2174–2179. [Google Scholar]
- Roy, S. Inclusion of short duration wind variations in economic load dispatch. IEEE Trans. Sustain. Energy 2012, 3, 265–273. [Google Scholar] [CrossRef]
- Jadoun, V.K.; Pandey, V.C.; Gupta, N.; Niazi, K.R.; Swarnkar, A. Integration of renewable energy sources in dynamic economic load dispatch problem using an improved fireworks algorithm. IET Renew. Power Gener. 2018, 12, 1004–1011. [Google Scholar] [CrossRef]
- Tang, C.; Xu, J.; Tan, Y.; Sun, Y.; Zhang, B. Lagrangian relaxation with incremental proximal method for economic dispatch with large numbers of wind power scenarios. IEEE Trans. Power Syst. 2019, 34, 2685–2695. [Google Scholar] [CrossRef]
- Kheshti, M.; Kang, X.; Li, J.; Regulski, P.; Terzija, V. Lightning flash algorithm for solving non-convex combined emission economic dispatch with generator constraints. IET Gener. Transm. Distrib. 2018, 12, 104–116. [Google Scholar] [CrossRef]
- Nivedha, R.R.; Singh, J.G.; Ongsakul, W. PSO based economic dispatch of a hybrid microgrid system. In Proceedings of the 2018 International Conference on Power, Signals, Control and Computation (EPSCICON), Thrissur, India, 6–10 January 2018; pp. 1–5. [Google Scholar]
- Augustine, N.; Suresh, S.; Moghe, P.; Sheikh, K. Economic dispatch for a microgrid considering renewable energy cost functions. In Proceedings of the 2012 IEEE PES Innovative Smart Grid Technologies (ISGT), Washington, DC, USA, 16–20 January 2020; pp. 1–7. [Google Scholar]
- Agrawal, S.P.; Porate, K.B. Economic dispatch of thermal units with the impact of wind power plant. In Proceedings of the 2010 3rd International Conference on Emerging Trends in Engineering and Technology, Goa, India, 19–21 November 2020; pp. 48–53. [Google Scholar]
- Jose, J.T. Economic load dispatch including wind power using Bat Algorithm. In Proceedings of the 2014 International Conference on Advances in Electrical Engineering (ICAEE), Singapore, Singapore, 19 February 2014; pp. 1–4. [Google Scholar]
- Ellahi, M.; Abbas, G.; Khan, I.; Koola, P.M.; Nasir, M.; Raza, A.; Farooq, U. Recent approaches of forecasting and optimal economic dispatch to overcome intermittency of wind and Photovoltaic (PV) systems: A review. Energies 2019, 12, 4392. [Google Scholar] [CrossRef]
- Yang, X.-S. A new metaheuristic bat-inspired algorithm. In Nature Inspired Cooperative Strategies for Optimization (NICSO 2010); Springer: Berlin/Heidelberg, Germany, 2010; pp. 65–74. [Google Scholar]
- Chakri, A.; Khelif, R.; Benouaret, M.; Yang, X.-S. New directional bat algorithm for continuous optimization problems. Expert Syst. Appl. 2017, 69, 159–175. [Google Scholar] [CrossRef]
- Chakri, A.; Ragueb, H.; Yang, X.-S. Bat algorithm and directional bat algorithm with case studies. In Nature-Inspired Algorithms and Applied Optimization; Springer: Cham, Switzerland, 2018; pp. 189–216. [Google Scholar]
- Rahmat, N.A.; Aziz, N.F.A.; Mansor, M.H.; Musirin, I. Optimizing economic load dispatch with renewable energy sources via differential evolution immunized ant colony optimization technique. Int. J. Adv. Sci. Eng. Inf. Technol. 2017, 7, 2012–2017. [Google Scholar] [CrossRef]
- Lee, C.-Y.; Tuegeh, M. An optimal solution for smooth and non-smooth cost functions-based economic dispatch problem. Energies 2020, 13, 3721. [Google Scholar] [CrossRef]
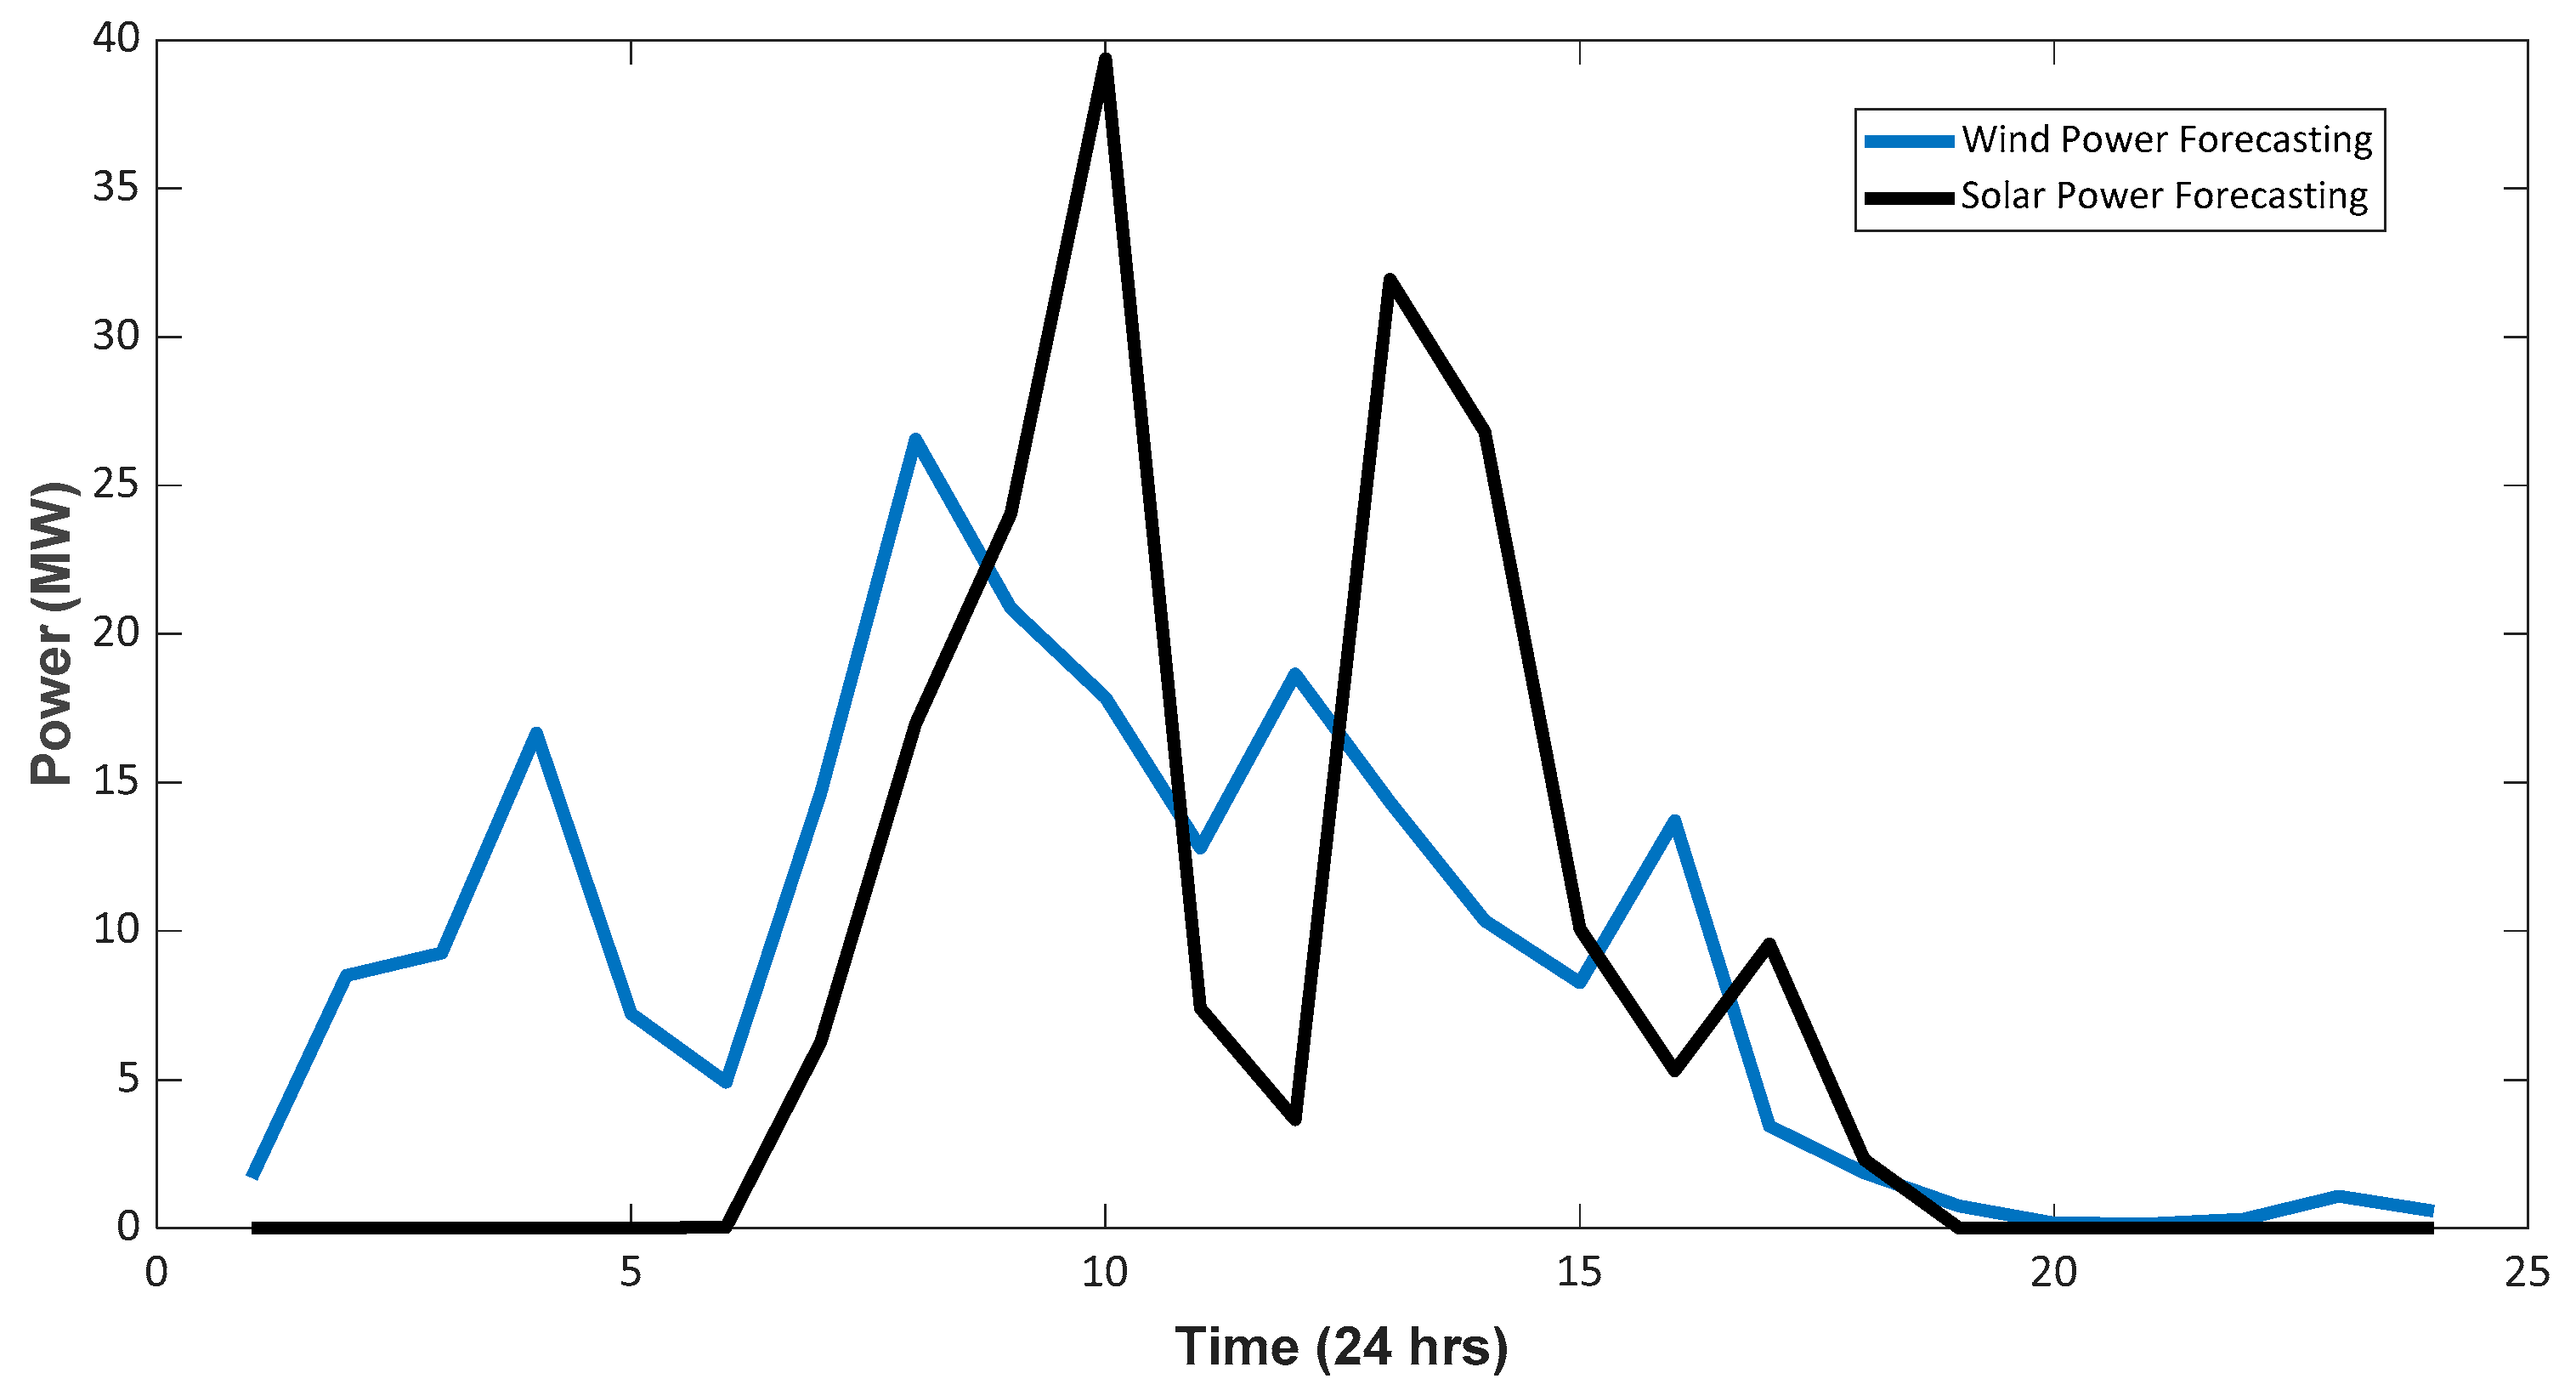
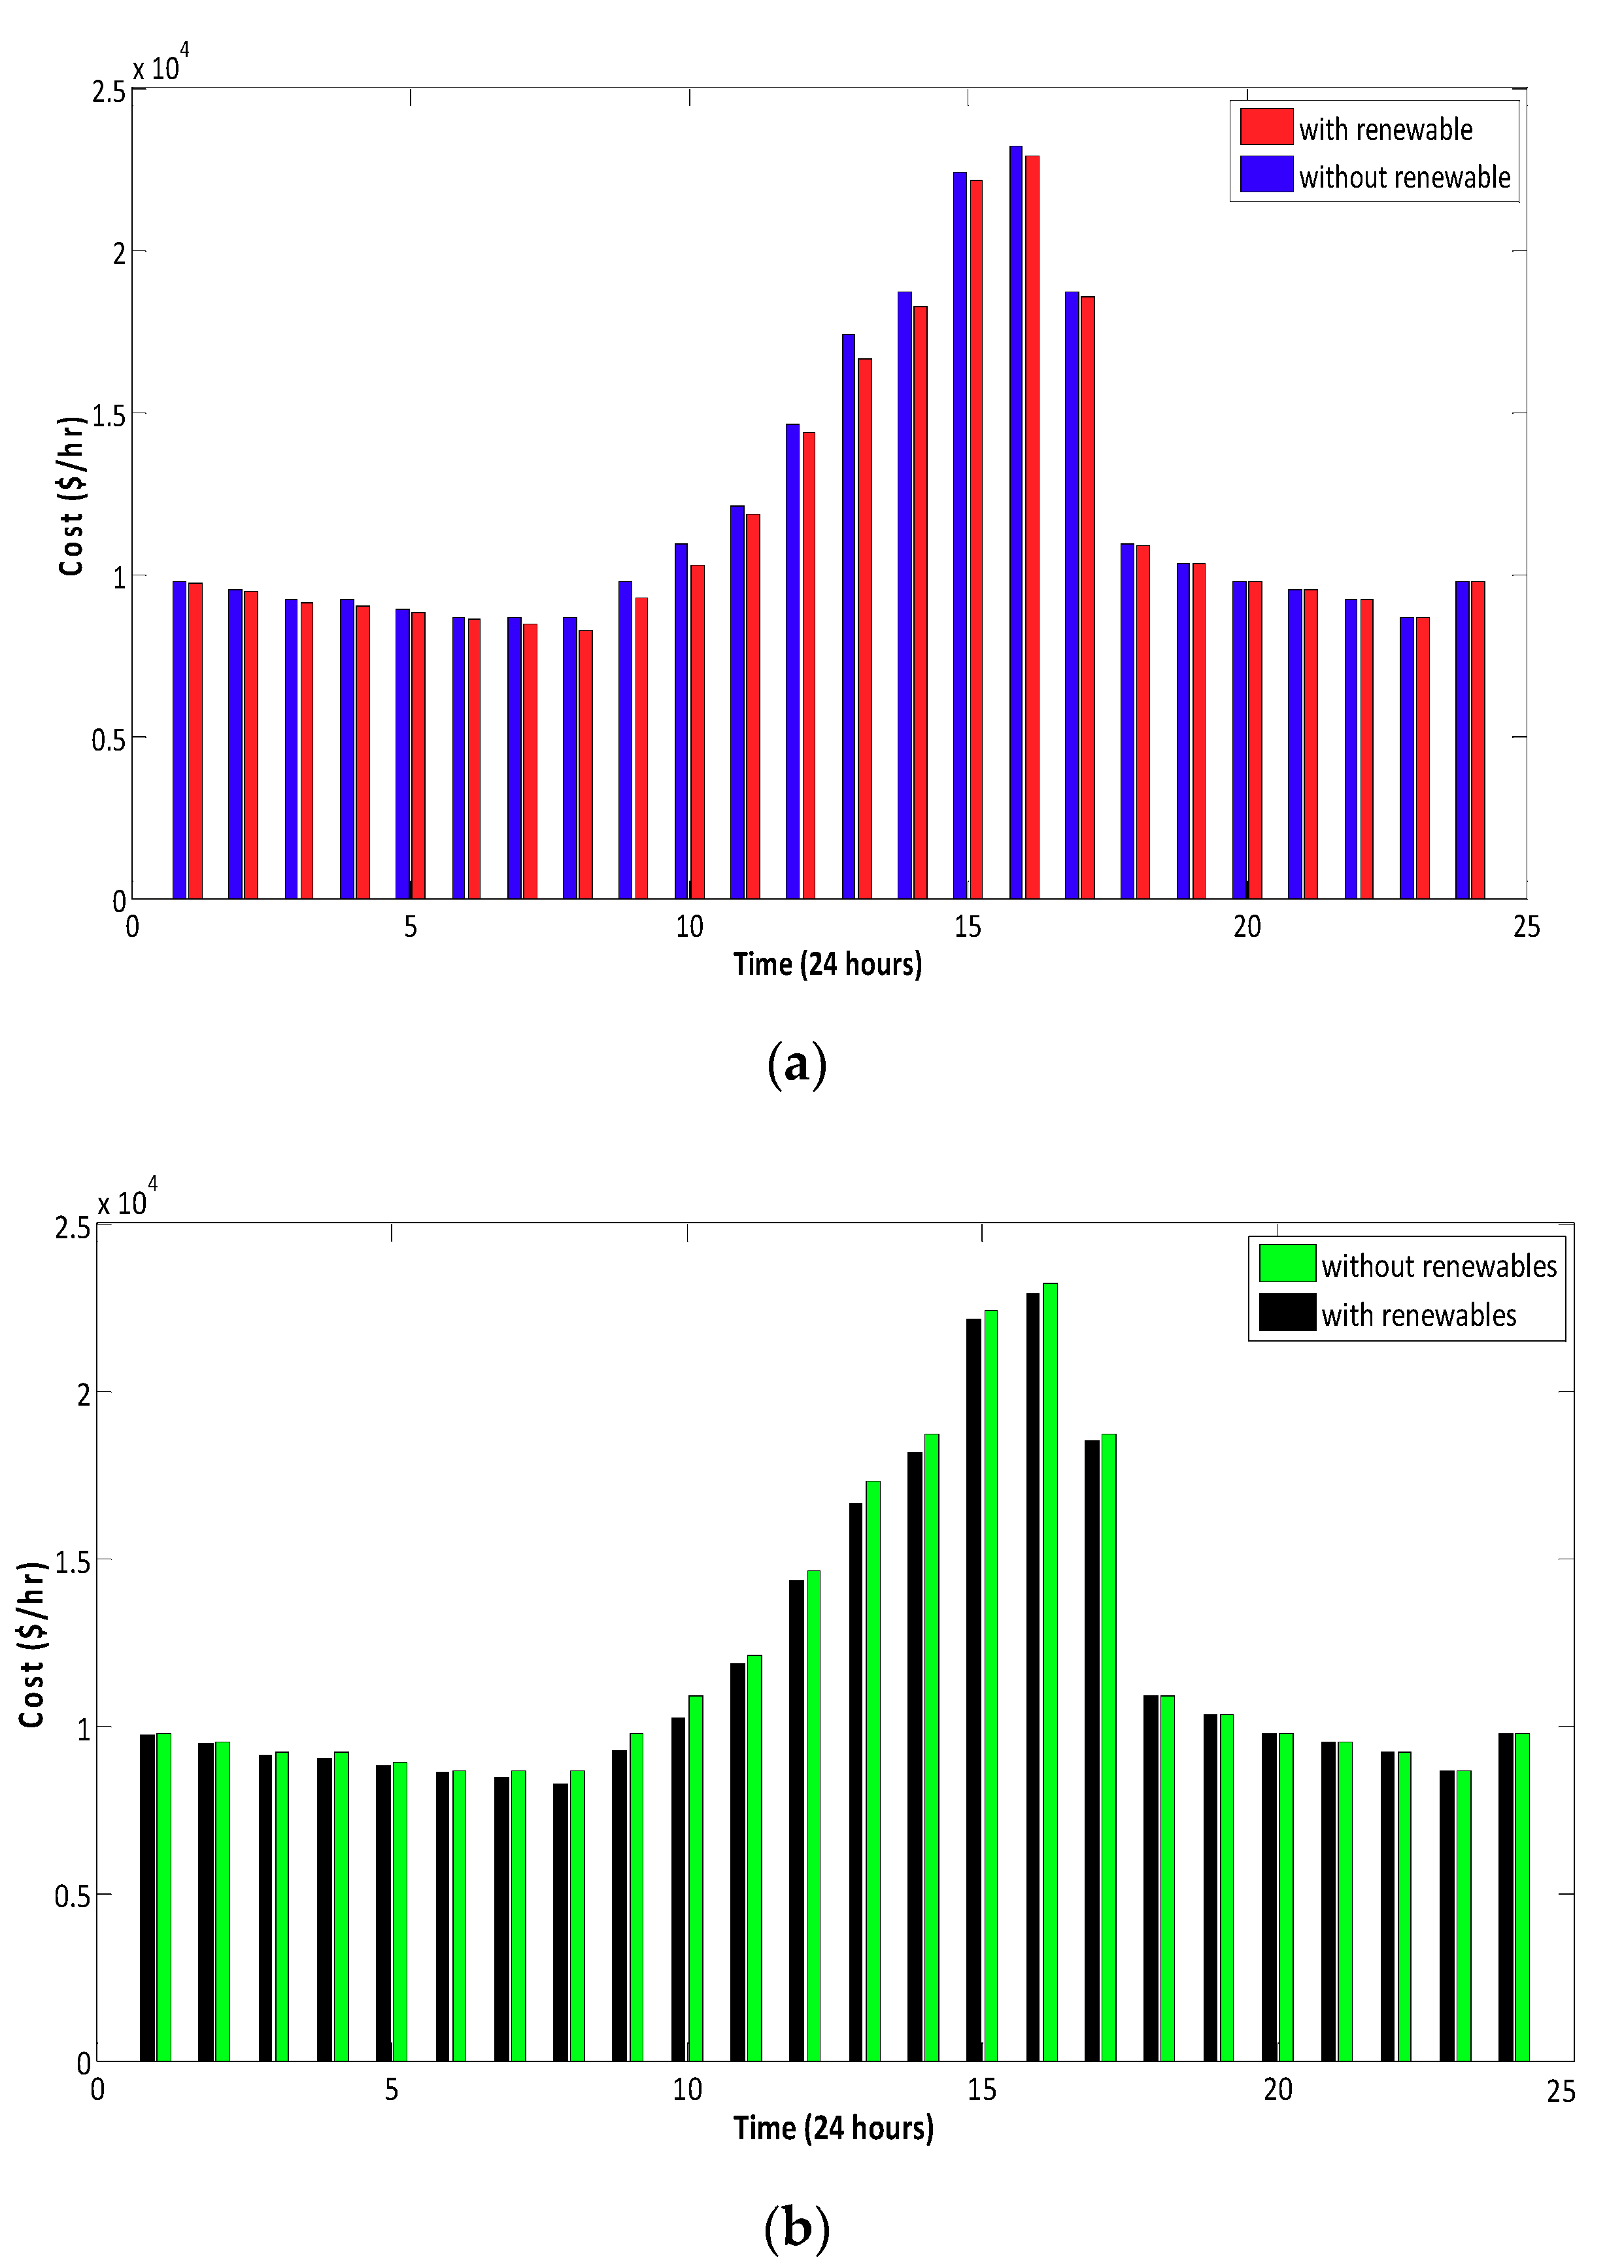


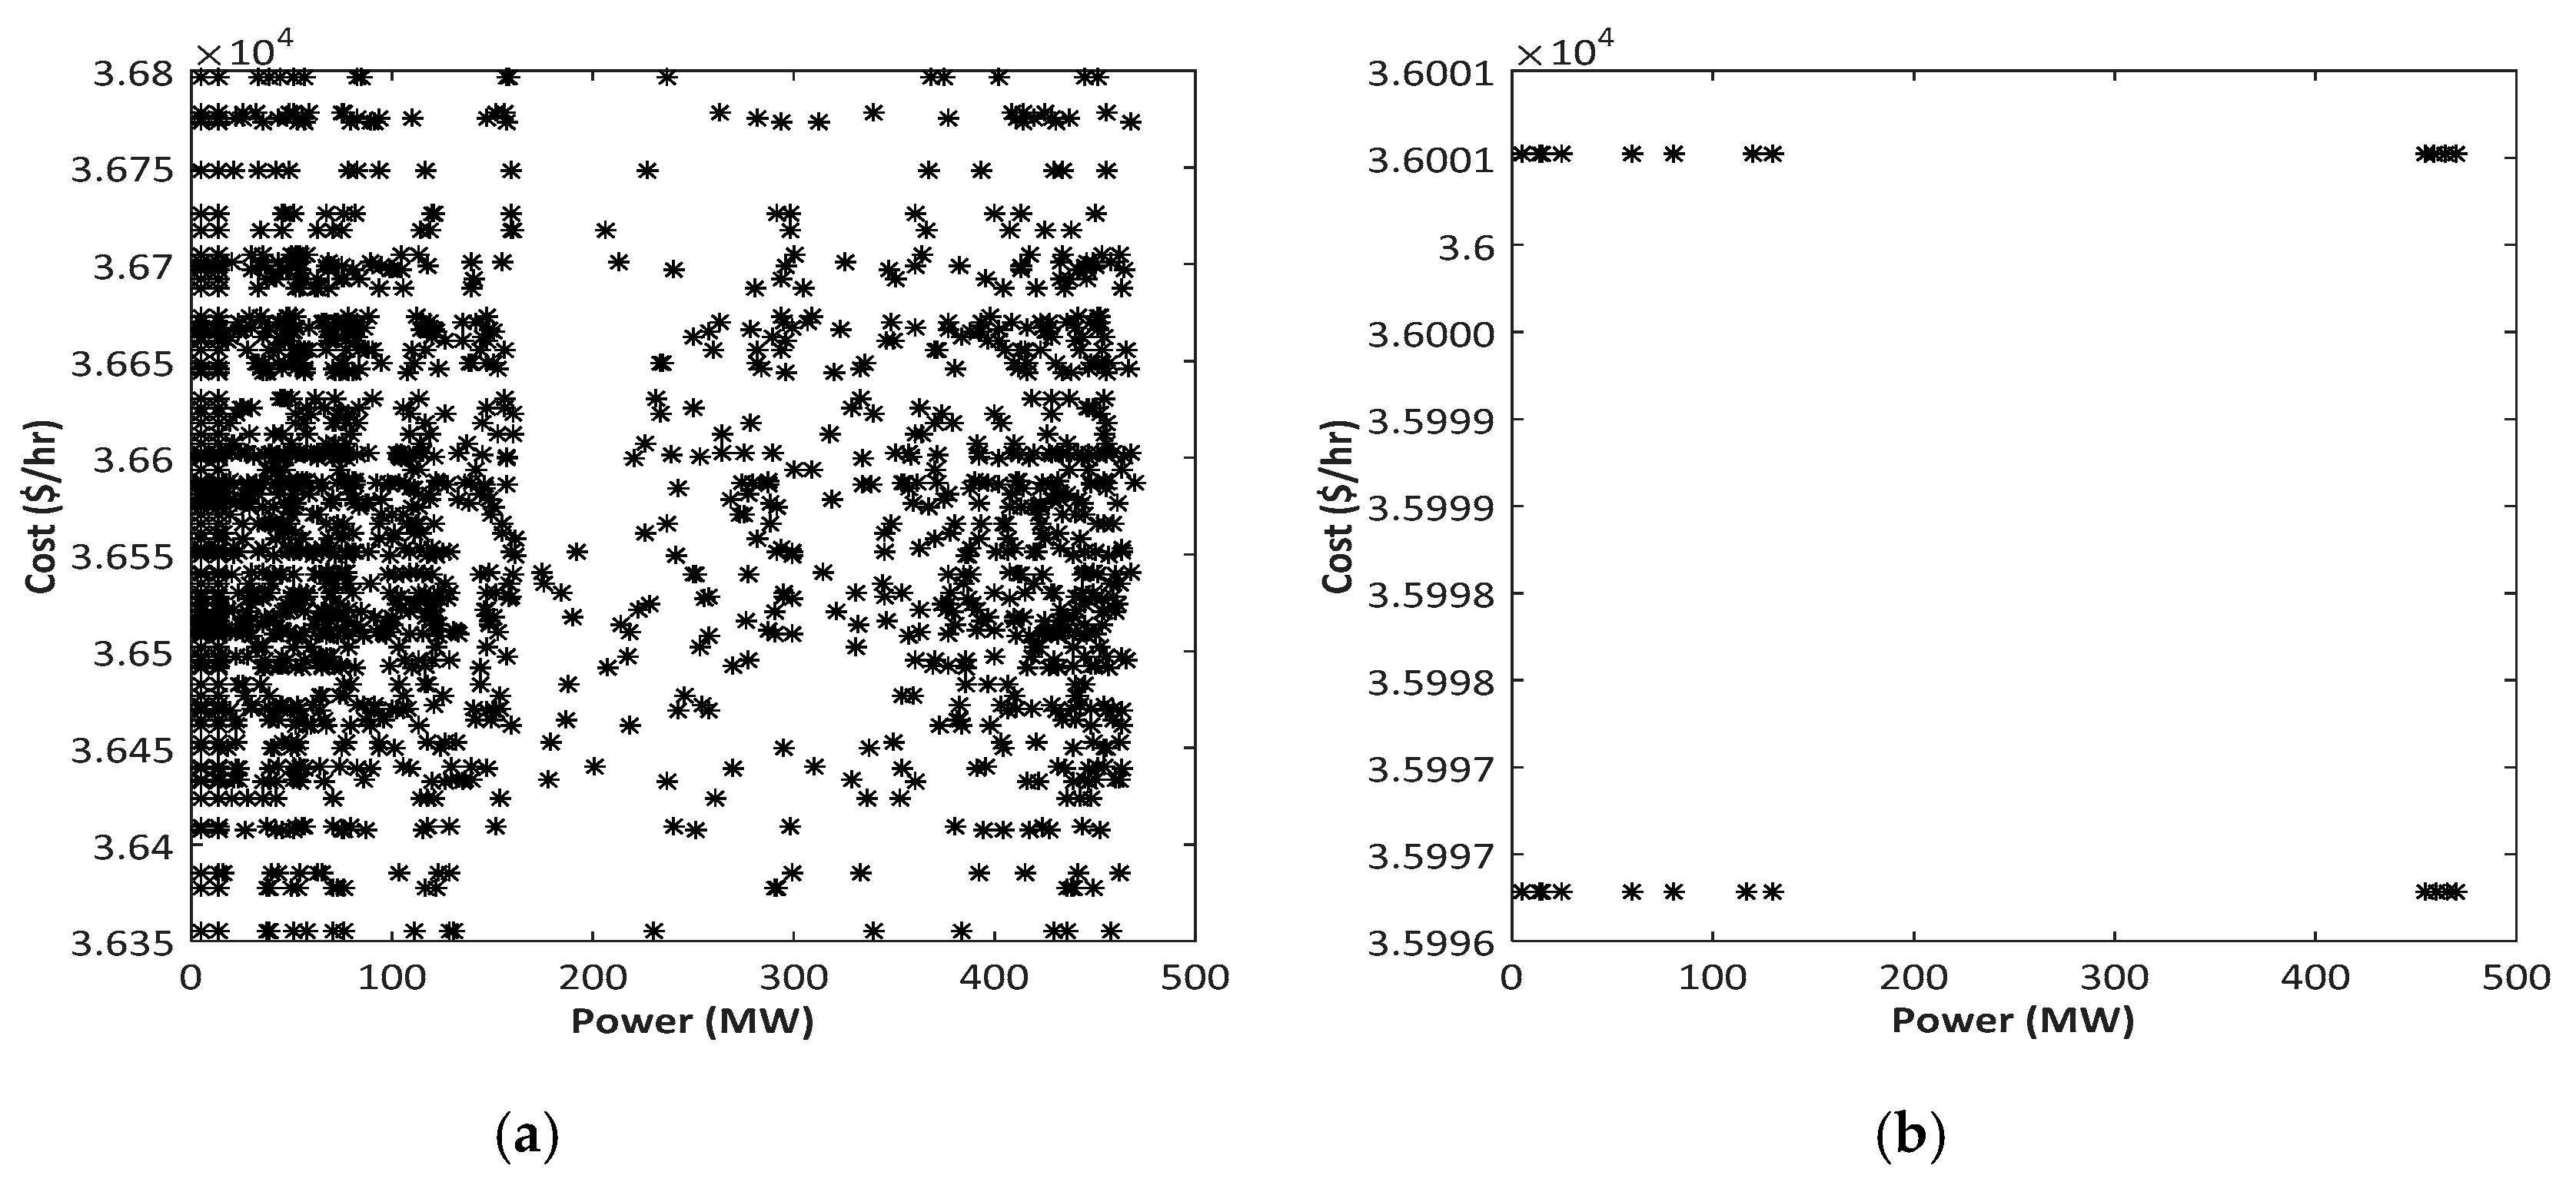


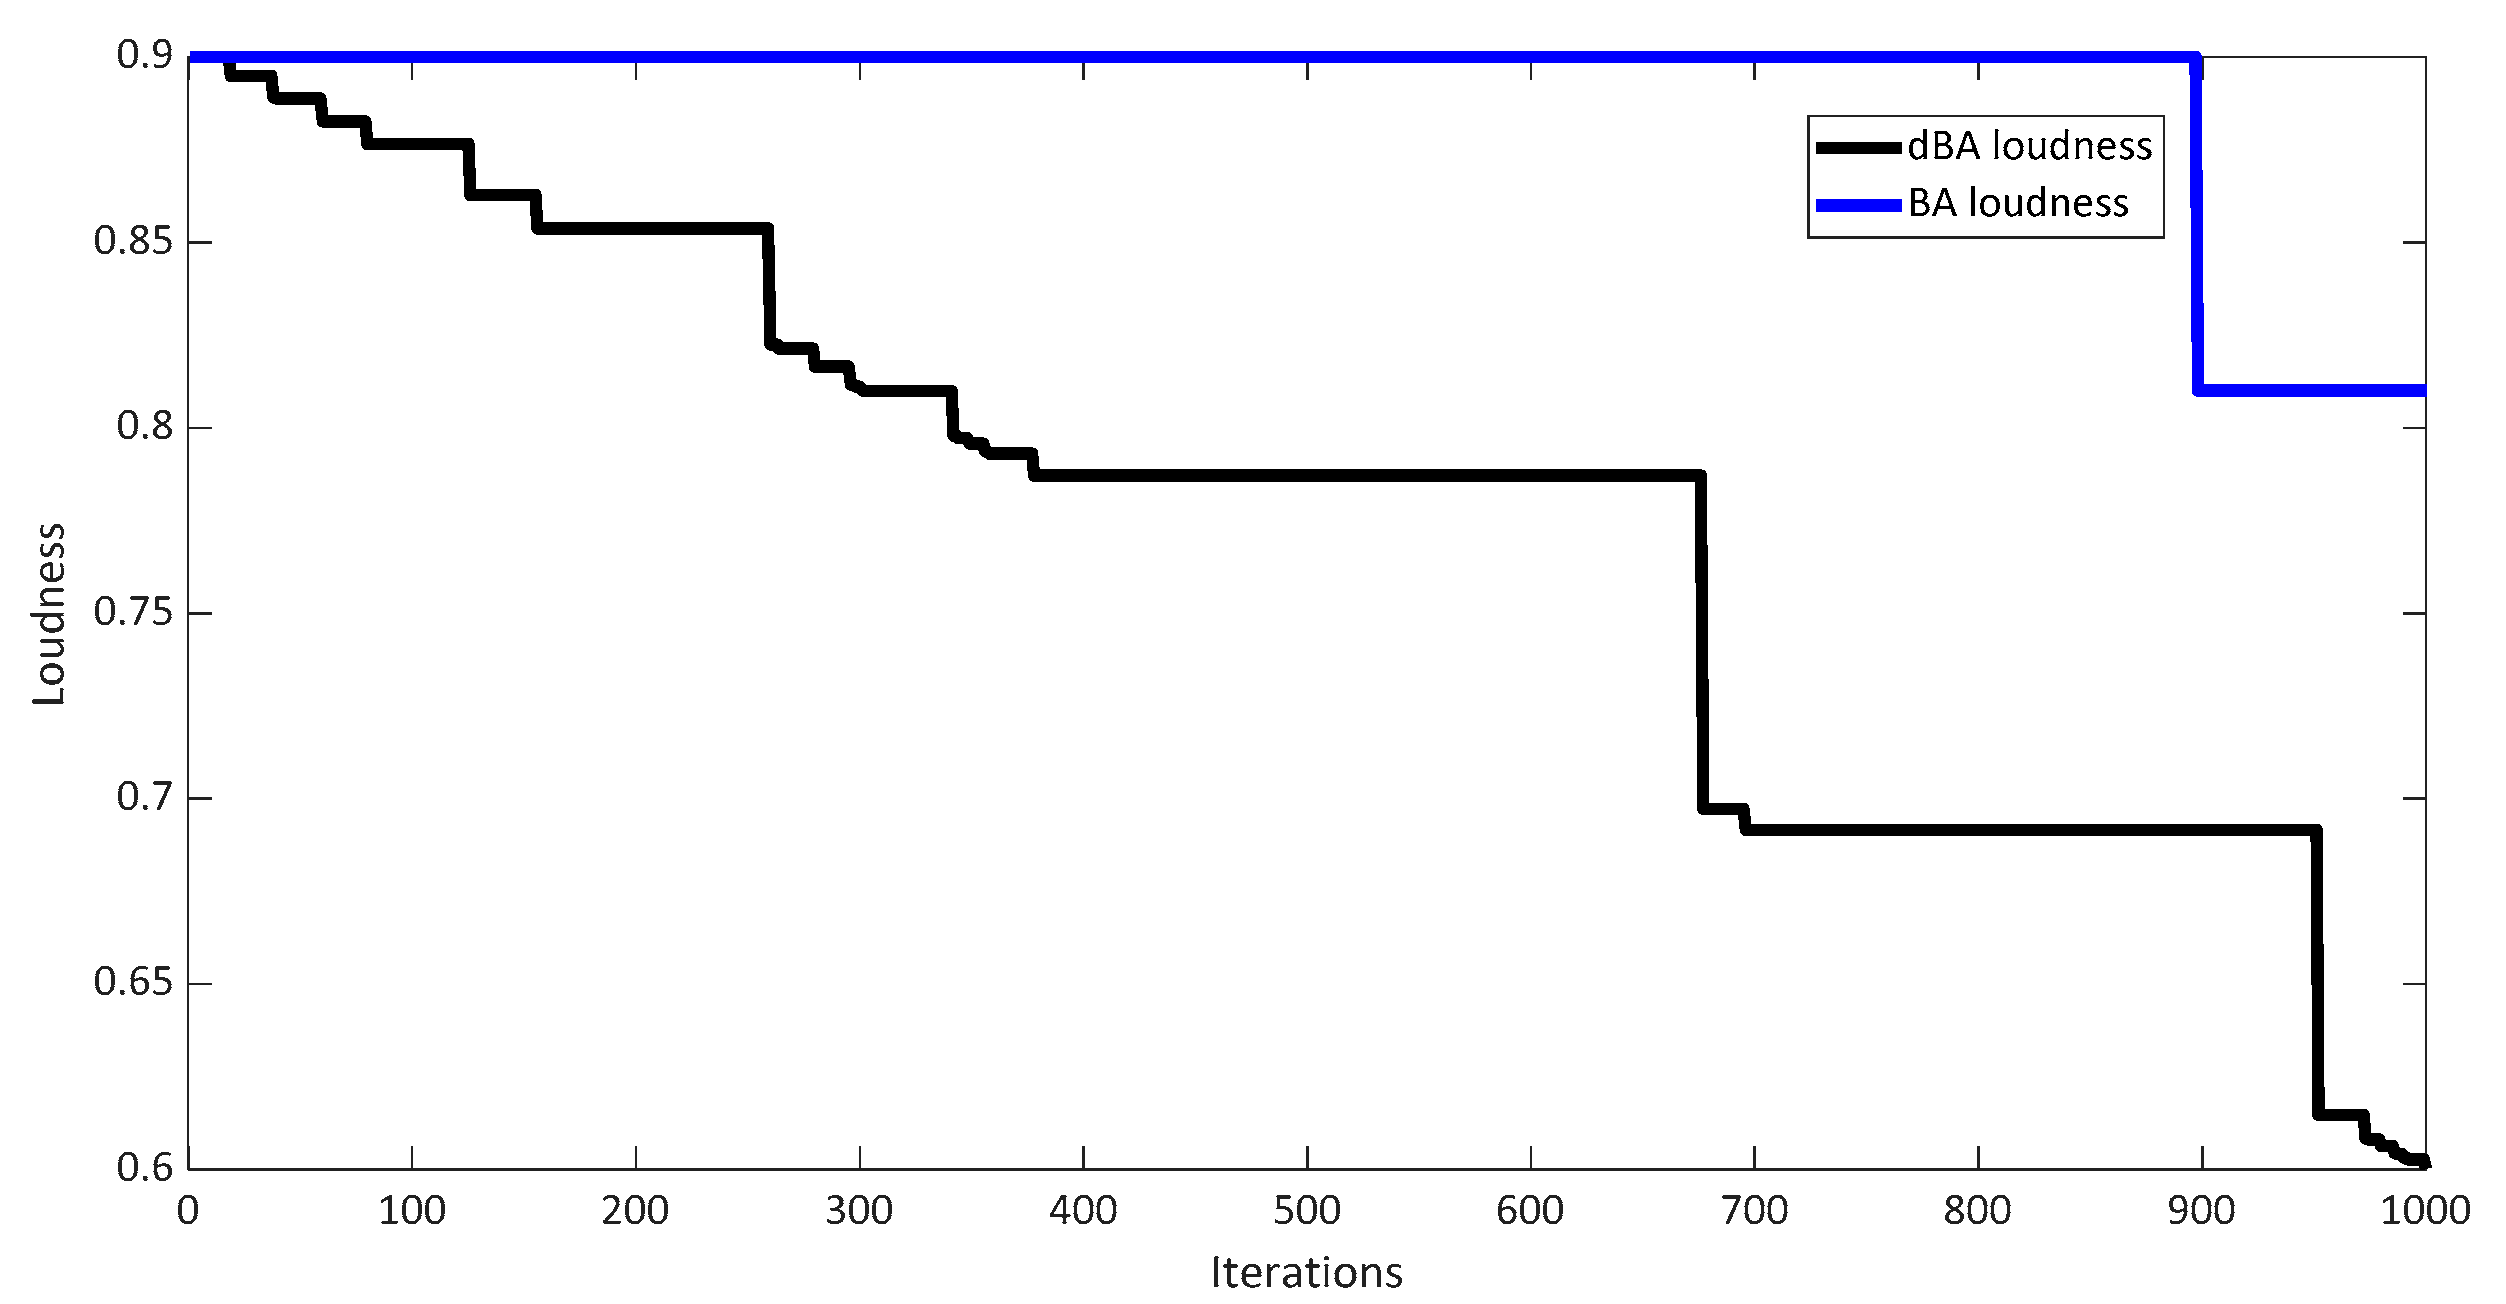


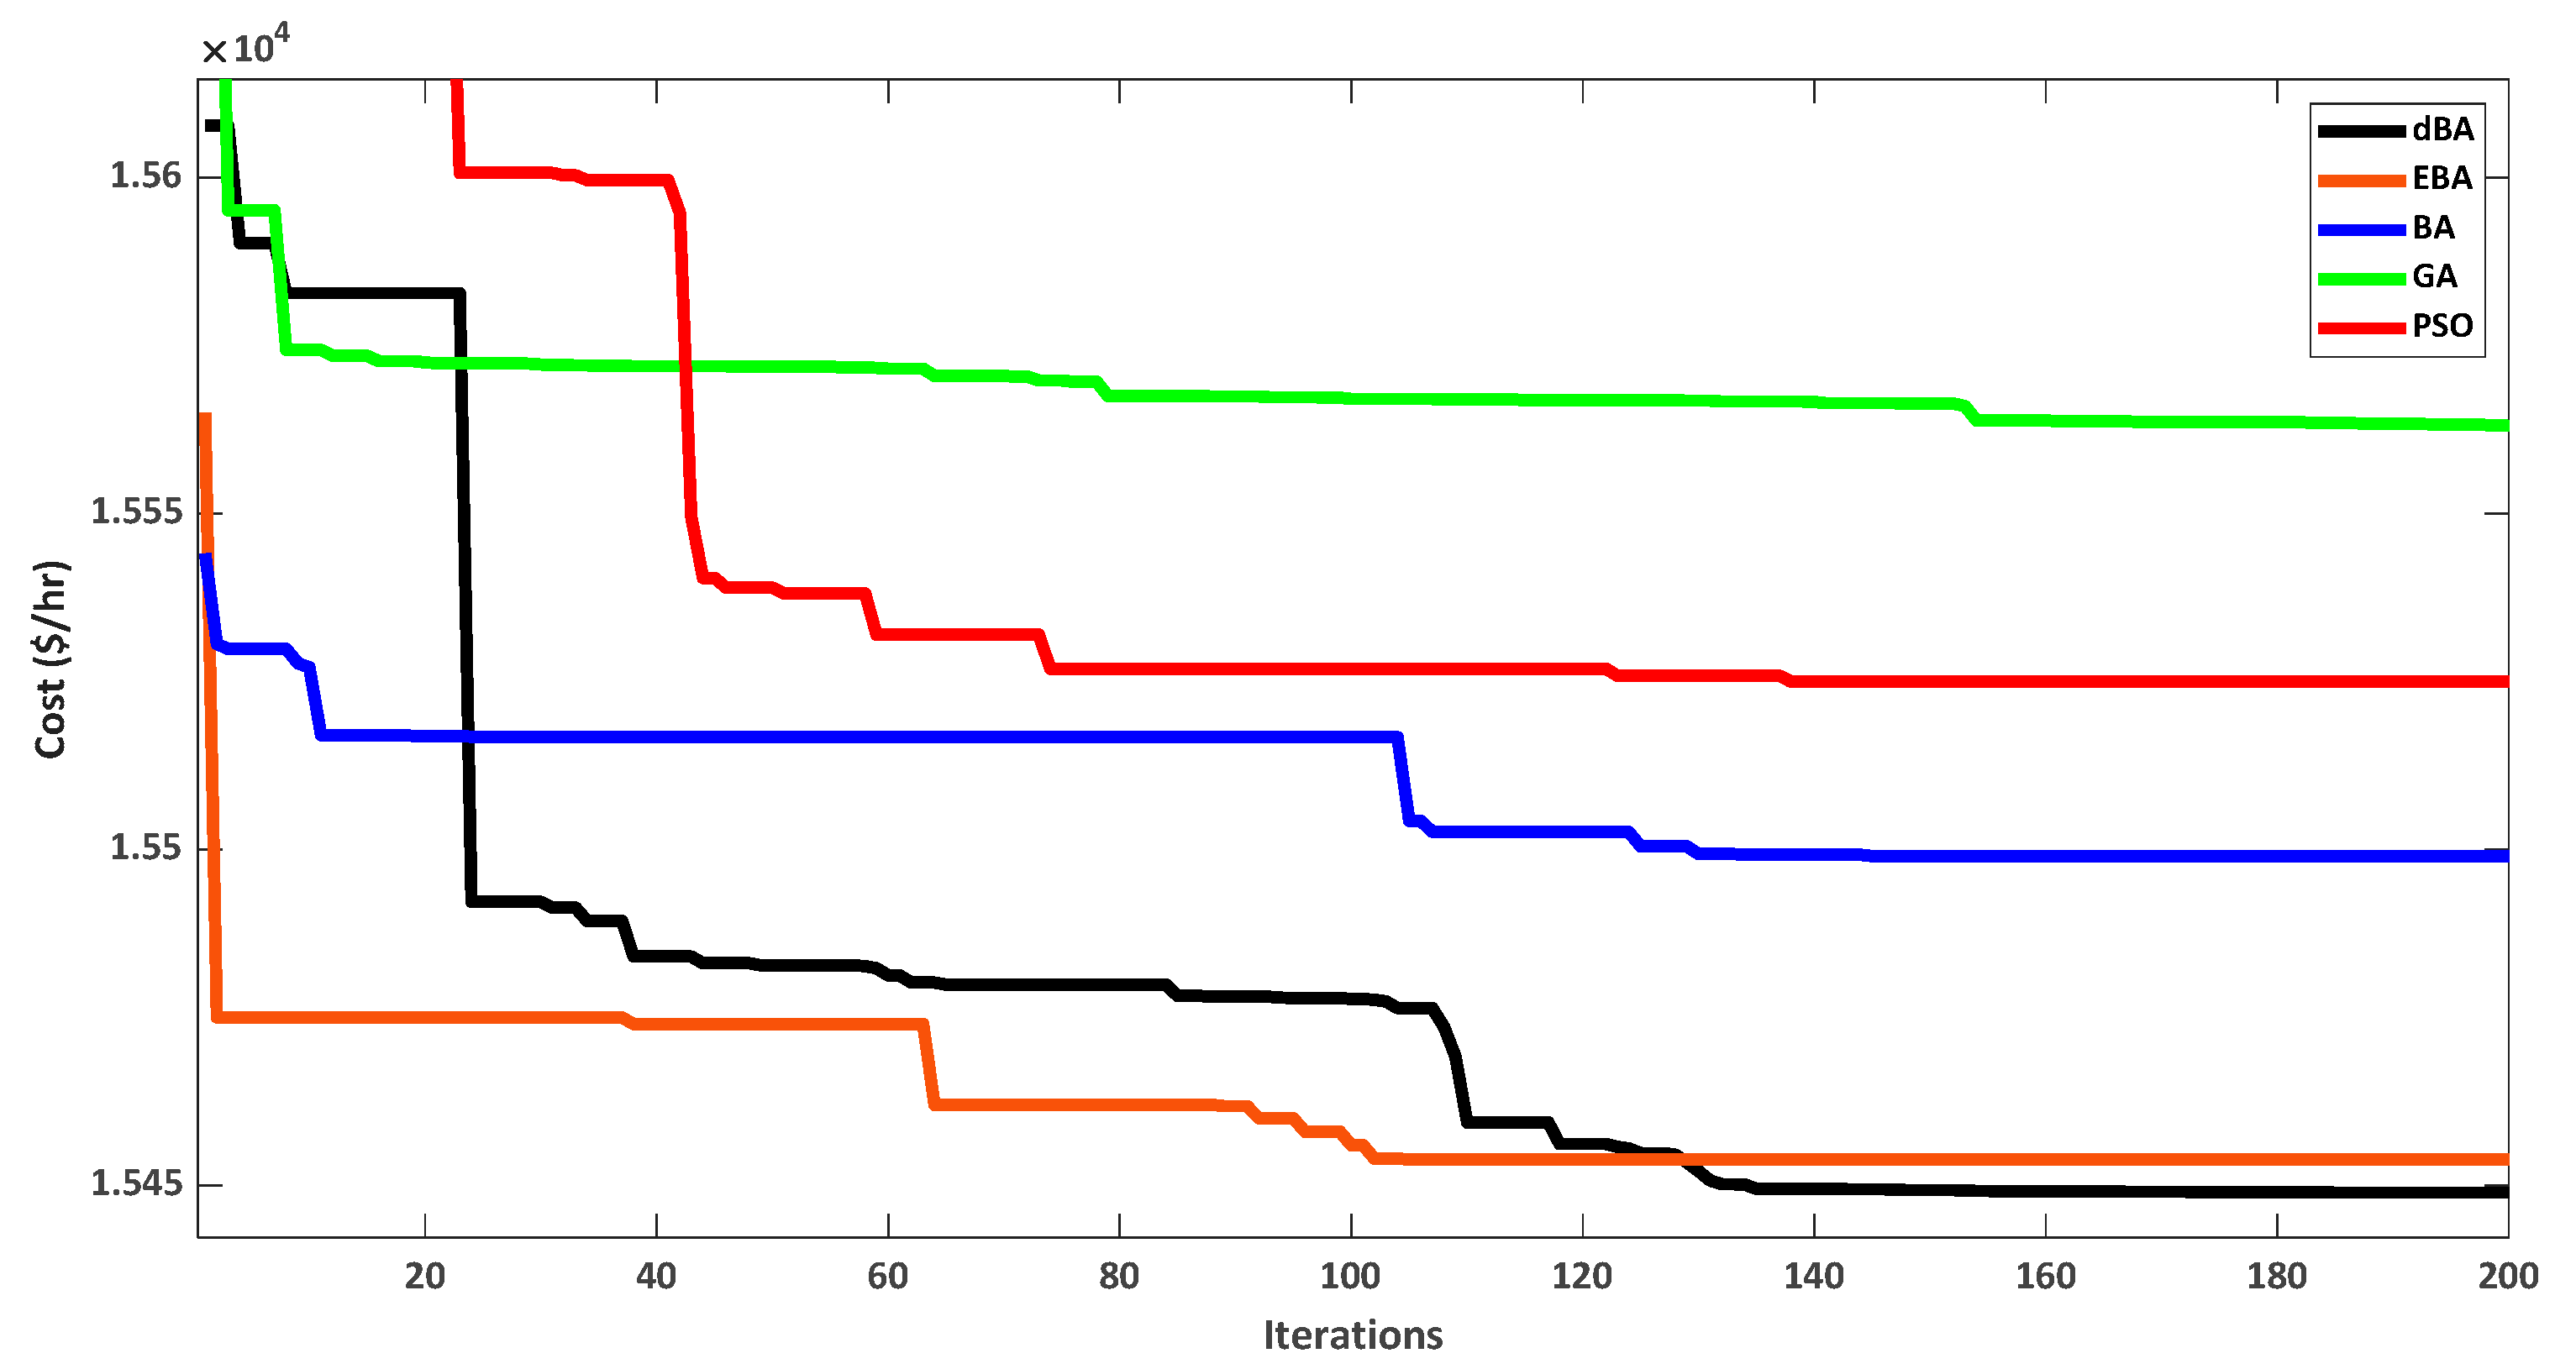
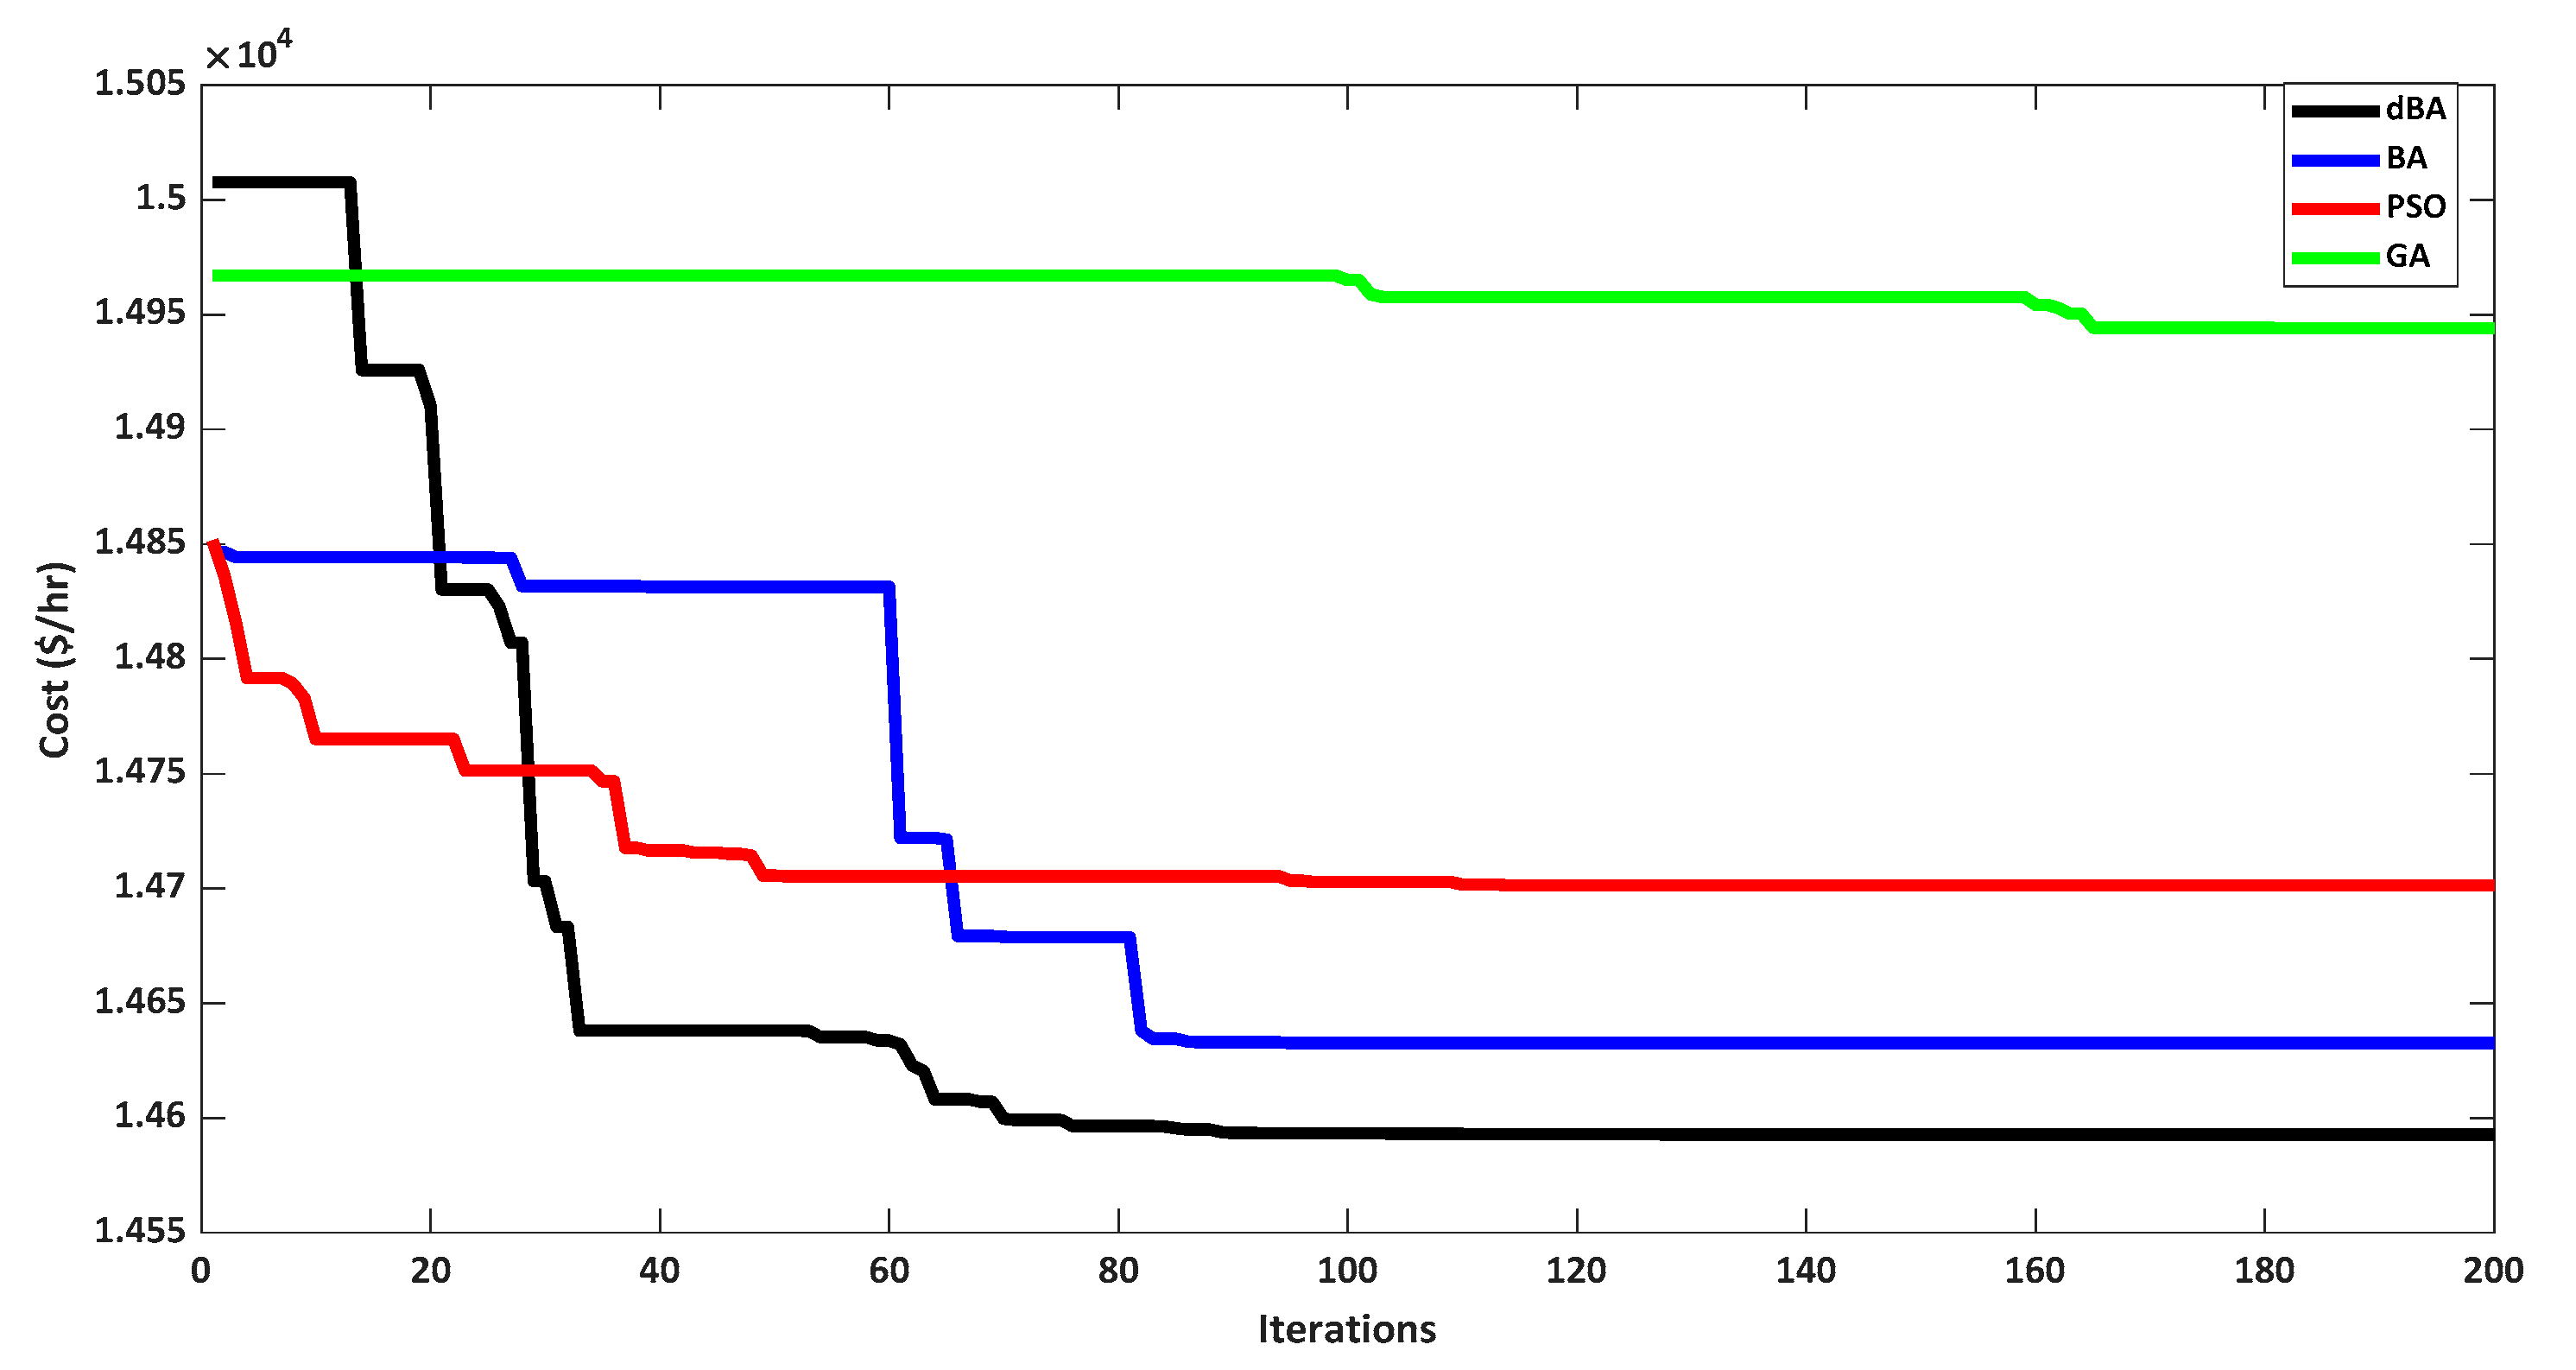
| Generator | a ($/MW2) | b ($/MW) | c ($) | Pmin (MW) | Pmax (MW) |
|---|---|---|---|---|---|
| 1 | 0.007 | 7 | 400 | 100 | 575 |
| 2 | 0.0095 | 10 | 200 | 50 | 100 |
| 3 | 0.009 | 8.5 | 220 | 50 | 140 |
| 4 | 0.009 | 11 | 200 | 50 | 100 |
| 5 | 0.008 | 10.5 | 240 | 100 | 550 |
| 6 | 0.0075 | 12 | 200 | 50 | 100 |
| 7 | 0.0068 | 10 | 180 | 100 | 410 |
| Time (h) | 1 | 2 | 3 | 4 | 5 | 6 | 7 | 8 | 9 | 10 | 11 | 12 |
| Demand (MW) | 800 | 780 | 750 | 750 | 720 | 700 | 700 | 700 | 800 | 900 | 1000 | 1200 |
| Time (h) | 13 | 14 | 15 | 16 | 17 | 18 | 19 | 20 | 21 | 22 | 23 | 24 |
| Demand (MW) | 1400 | 1500 | 1750 | 1800 | 1500 | 900 | 850 | 800 | 780 | 750 | 700 | 800 |
| t (h) | BA | dBA | ||||||||||||||
|---|---|---|---|---|---|---|---|---|---|---|---|---|---|---|---|---|
| P1 (MW) | P2 (MW) | P3 (MW) | P4 (MW) | P5 (MW) | P6 (MW) | P7 (MW) | Cost ($/h) | P1 (MW) | P2 (MW) | P3 (MW) | P4 (MW) | P5 (MW) | P6 (MW) | P7 (MW) | Cost ($/h) | |
| 1 | 310.0691 | 50.4229 | 139.3672 | 50 | 100.1412 | 50 | 100 | 9762.3 | 298.4298 | 61.5703 | 140 | 50 | 100 | 50 | 100 | 9759.8 |
| 2 | 290.9093 | 50 | 139.0909 | 50 | 100 | 50 | 100 | 9538.2 | 286.5761 | 53.9338 | 139.4902 | 50 | 100 | 50 | 100 | 9537.9 |
| 3 | 272.9545 | 50 | 127.0456 | 50 | 100 | 50 | 100 | 9210.4 | 272.0187 | 50.0043 | 127.9772 | 50 | 100 | 50 | 100 | 9210.3 |
| 4 | 274.7427 | 50 | 125.2577 | 50 | 100 | 50 | 100 | 9210.5 | 271.5529 | 50 | 128.4458 | 50.0014 | 100 | 50 | 100.0001 | 9210.3 |
| 5 | 259.4567 | 51.3485 | 108.9565 | 50.2387 | 100 | 50 | 100 | 8891 | 255.0398 | 50 | 114.96 | 50 | 100.0003 | 50 | 100 | 8889.7 |
| 6 | 245.5637 | 50 | 104.4364 | 50 | 100 | 50 | 100 | 8679.9 | 243.9639 | 50.0033 | 106.0329 | 50 | 100 | 50 | 100 | 8679.9 |
| 7 | 246.6246 | 50 | 103.3755 | 50 | 100 | 50 | 100 | 8680 | 243.7256 | 50 | 106.2745 | 50.0001 | 100 | 50 | 100 | 8679.9 |
| 8 | 238.2873 | 50 | 111.7129 | 50 | 100 | 50 | 100 | 8680.4 | 243.5853 | 50 | 106.4148 | 50 | 100 | 50 | 100 | 8679.9 |
| 9 | 296.9272 | 63.8645 | 139.2085 | 50 | 100 | 50 | 100 | 9760 | 298.3961 | 61.604 | 140 | 50 | 100 | 50 | 100 | 9759.8 |
| 10 | 358.2764 | 99.7169 | 139.9486 | 50.5802 | 100.3323 | 50.5205 | 100.6255 | 10,918 | 338.785 | 92.757 | 140 | 50.1718 | 100 | 50 | 128.2864 | 10,909 |
| 11 | 375.1164 | 98.3909 | 139.0237 | 62.0253 | 100 | 50 | 175.4441 | 12,112 | 371.9944 | 100 | 140 | 67.441 | 107.4991 | 50 | 163.0657 | 12,108 |
| 12 | 412.0067 | 99.8622 | 139.8622 | 99.8622 | 160.4408 | 78.8337 | 209.1325 | 14,631 | 426.0054 | 99.9996 | 140 | 100 | 151.3067 | 64.2512 | 218.4388 | 14,626 |
| 13 | 574.5894 | 99.4245 | 139.5894 | 96.7237 | 163.8266 | 99.4364 | 226.4103 | 17,386 | 481.1635 | 99.9997 | 140 | 100 | 203.4979 | 100 | 275.3393 | 17,292 |
| 14 | 517.2808 | 99.9756 | 139.9756 | 99.9756 | 215.7508 | 99.9756 | 327.0668 | 18,695 | 516.7083 | 99.9966 | 139.9939 | 99.9827 | 231.9789 | 100 | 311.3399 | 18,691 |
| 15 | 574.9994 | 99.9994 | 139.9994 | 99.9994 | 325.004 | 99.9994 | 409.9994 | 22,406 | 575 | 100 | 140 | 100 | 325 | 100 | 410 | 22,406 |
| 16 | 574.9815 | 99.9815 | 139.9815 | 99.9815 | 375.1116 | 99.9815 | 409.9815 | 23,212 | 575 | 100 | 140 | 100 | 375 | 100 | 410 | 23,211 |
| 17 | 509.9228 | 99.8615 | 139.8615 | 99.8615 | 255.8211 | 99.8615 | 294.8103 | 18,698 | 516.0237 | 100 | 139.9982 | 100 | 233.6462 | 99.9773 | 310.3549 | 18,691 |
| 18 | 360.6688 | 99.0931 | 139.9944 | 50.061 | 100.061 | 50.061 | 100.061 | 10,918 | 338.5833 | 92.8095 | 140 | 50.0021 | 100 | 50 | 128.6058 | 10,909 |
| 19 | 323.4386 | 68.3125 | 139.1759 | 50 | 100 | 50 | 119.0736 | 10,330 | 320.393 | 78.0468 | 140 | 50 | 100 | 50 | 111.5603 | 10,328 |
| 20 | 289.5354 | 68.0608 | 139.8835 | 50.6302 | 100.6302 | 50.6302 | 100.6302 | 9762.9 | 298.3036 | 61.6965 | 140 | 50.0001 | 100 | 50 | 100 | 9759.8 |
| 21 | 291.5612 | 50 | 138.4389 | 50 | 100 | 50 | 100 | 9538.2 | 290 | 50 | 140 | 50 | 100 | 50 | 100 | 9538.1 |
| 22 | 261.7829 | 50 | 138.2172 | 50 | 100 | 50 | 100 | 9212 | 271.6896 | 50.0002 | 128.3102 | 50 | 100 | 50.0004 | 100 | 9210.3 |
| 23 | 243.2984 | 50 | 106.7019 | 50 | 100 | 50 | 100 | 8679.9 | 244.0813 | 50 | 105.9188 | 50 | 100 | 50 | 100 | 8679.9 |
| 24 | 310.4408 | 50 | 139.5594 | 50 | 100 | 50 | 100 | 9762.2 | 298.0959 | 61.9043 | 140 | 50 | 100 | 50 | 100 | 9759.8 |
| Total Cost ($/day) | 288,673 | Total Cost ($/day) | 288,526 | |||||||||||||
| t (h) | BA | dBA | ||||||||||||||||||
|---|---|---|---|---|---|---|---|---|---|---|---|---|---|---|---|---|---|---|---|---|
| P1 (MW) | P2 (MW) | P3 (MW) | P4 (MW) | P5 (MW) | P6 (MW) | P7 (MW) | Wind (MW) | Solar (MW) | Cost ($/h) | P1 (MW) | P2 (MW) | P3 (MW) | P4 (MW) | P5 (MW) | P6 (MW) | P7 (MW) | Wind (MW) | Solar (MW) | Cost ($/h) | |
| 1 | 308.4546 | 50 | 139.8458 | 50 | 100 | 50 | 100 | 1.7 | 0 | 9742.92 | 297.5162 | 60.7842 | 139.9997 | 50.0001 | 100 | 50 | 100 | 1.7 | 0 | 9740.8 |
| 2 | 282.3185 | 52.4223 | 136.7595 | 50 | 100 | 50 | 100 | 8.5 | 0 | 9444.65 | 283.6469 | 50.0558 | 137.7975 | 50 | 100 | 50 | 100 | 8.5 | 0 | 9444.6 |
| 3 | 262.3932 | 50 | 128.3369 | 50 | 100 | 50 | 100 | 9.27 | 0 | 9110.95 | 266.8788 | 50 | 123.8513 | 50 | 100 | 50 | 100 | 9.27 | 0 | 9110.7 |
| 4 | 258.6982 | 50 | 124.6419 | 50 | 100 | 50 | 100 | 16.66 | 0 | 9031.9 | 262.9667 | 50 | 120.3733 | 50 | 100 | 50 | 100.0001 | 16.7 | 0 | 9031.7 |
| 5 | 243.8264 | 50 | 118.9539 | 50 | 100 | 50 | 100 | 7.22 | 0 | 8814.52 | 250.6062 | 50 | 112.1739 | 50 | 100 | 50 | 100 | 7.22 | 0 | 8813.7 |
| 6 | 248.2989 | 50 | 96.7612 | 50 | 100 | 50 | 100 | 4.91 | 0.03 | 8629.47 | 241.1867 | 50 | 103.8734 | 50 | 100 | 50 | 100 | 4.91 | 0.03 | 8628.6 |
| 7 | 240.6063 | 50 | 88.4639 | 50 | 100 | 50 | 100 | 14.66 | 6.27 | 8465.19 | 232.0606 | 50 | 97.0095 | 50 | 100 | 50 | 100 | 14.7 | 6.27 | 8464 |
| 8 | 217.1576 | 50 | 89.3027 | 50 | 100 | 50 | 100 | 26.56 | 17 | 8234.75 | 219.1811 | 50 | 87.279 | 50 | 100 | 50.0001 | 100 | 26.6 | 17 | 8234.7 |
| 9 | 265.3591 | 50 | 139.7113 | 50 | 100 | 50 | 100 | 20.88 | 24.1 | 9267.36 | 275.0707 | 50 | 129.997 | 50 | 100 | 50.0024 | 100 | 20.9 | 24.1 | 9266 |
| 10 | 348.4586 | 50.8649 | 139.9974 | 50.8649 | 100.8649 | 50.8649 | 100.8649 | 17.85 | 39.4 | 10,260.6 | 319.7501 | 76.1018 | 139.9973 | 50 | 100.0013 | 50.0001 | 106.93 | 17.9 | 39.4 | 10,246 |
| 11 | 374.5509 | 98.4651 | 139.6131 | 67.5442 | 101.6685 | 50 | 147.9493 | 12.8 | 7.41 | 11,864.4 | 365.1241 | 99.9767 | 140 | 63.0469 | 104.1673 | 50 | 157.4756 | 12.8 | 7.41 | 11,863 |
| 12 | 451.2102 | 98.5168 | 139.4197 | 98.5708 | 100 | 50 | 239.9829 | 18.65 | 3.65 | 14,373.3 | 418.8554 | 100 | 140 | 99.0082 | 149.2301 | 59.593 | 211.0165 | 18.7 | 3.65 | 14,339 |
| 13 | 468.1769 | 99.8158 | 139.8158 | 99.8158 | 190.3916 | 99.8158 | 255.8789 | 14.35 | 31.9 | 16,662.8 | 467.1655 | 100 | 140 | 100 | 188.8588 | 100 | 257.6867 | 14.4 | 31.9 | 16,662 |
| 14 | 574.9837 | 99.9837 | 139.9837 | 99.9837 | 216.0709 | 50.1673 | 281.6676 | 10.35 | 26.8 | 18,249.8 | 504.4502 | 100 | 140 | 100 | 222.0573 | 100 | 296.3327 | 10.4 | 26.8 | 18,166 |
| 15 | 574.9813 | 99.9813 | 139.9813 | 99.9813 | 306.7732 | 99.9813 | 409.9813 | 8.26 | 10.1 | 22,121.6 | 575 | 100 | 140 | 100 | 306.66 | 100 | 410 | 8.26 | 10.1 | 22,121 |
| 16 | 574.9981 | 99.9981 | 139.9981 | 99.9981 | 356.0023 | 99.9981 | 409.9981 | 13.71 | 5.3 | 22,900.9 | 575 | 100 | 140 | 100 | 355.99 | 100 | 410 | 13.7 | 5.3 | 22,901 |
| 17 | 574.0339 | 99.7617 | 139.9671 | 99.9671 | 204.8208 | 99.9671 | 268.4729 | 3.44 | 9.57 | 18,548.5 | 511.3355 | 100 | 140 | 99.9984 | 229.8833 | 100 | 305.7731 | 3.44 | 9.57 | 18,506 |
| 18 | 330.5927 | 97.907 | 134.6961 | 52.3771 | 100 | 50 | 130.2475 | 1.87 | 2.31 | 10,865 | 338.3721 | 91.9396 | 140 | 50.0246 | 100 | 50 | 125.4839 | 1.87 | 2.31 | 10,860 |
| 19 | 329.274 | 50.2884 | 139.9879 | 50.2884 | 100.2884 | 50.2884 | 128.8352 | 0.75 | 0 | 10,330.1 | 321.3166 | 77.8541 | 139.9876 | 50 | 100 | 50.0083 | 110.0839 | 0.75 | 0 | 10,319 |
| 20 | 310.3985 | 50 | 139.4316 | 50 | 100 | 50 | 100 | 0.17 | 0 | 9760.36 | 309.83 | 50 | 140 | 50 | 100 | 50 | 100 | 0.17 | 0 | 9760.2 |
| 21 | 284.2353 | 56.357 | 139.2578 | 50 | 100 | 50 | 100 | 0.15 | 0 | 9536.4 | 286.8948 | 52.9553 | 140 | 50 | 100 | 50 | 100 | 0.15 | 0 | 9536.3 |
| 22 | 264.029 | 51.4983 | 134.1629 | 50 | 100 | 50 | 100 | 0.31 | 0 | 9207.99 | 272.0281 | 50 | 127.662 | 50 | 100 | 50 | 100 | 0.31 | 0 | 9207 |
| 23 | 244.2126 | 50 | 104.7176 | 50 | 100 | 50 | 100 | 1.07 | 0 | 8668.77 | 243.2655 | 50 | 105.6646 | 50 | 100 | 50 | 100 | 1.07 | 0 | 8668.8 |
| 24 | 302.3865 | 57.3543 | 139.6794 | 50 | 100 | 50 | 100 | 0.58 | 0 | 9753.69 | 297.7595 | 61.6605 | 140 | 50.0002 | 100 | 50 | 100 | 0.58 | 0 | 9753.3 |
| Total Cost ($/day) | 283,846 | Total Cost ($/day) | 283,642 | |||||||||||||||||
| Algorithm | P1 (MW) | P2 (MW) | P3 (MW) | P4 (MW) | P5 (MW) | P6 (MW) | P7 (MW) | Cost ($/h) |
|---|---|---|---|---|---|---|---|---|
| GA | 495.2 | 99.9987 | 140 | 99.9905 | 454.884 | 99.978 | 409.916 | 23,422.78 |
| PSO | 575 | 100 | 140 | 100 | 375.014 | 100 | 410 | 23,211.59 |
| BA | 575 | 99.998 | 140 | 99.998 | 375.012 | 99.998 | 409.998 | 23,211.39 |
| dBA | 575 | 100 | 140 | 100 | 375 | 100 | 410 | 23,211.36 |
| Algorithm | P1 (MW) | P2 (MW) | P3 (MW) | P4 (MW) | P5 (MW) | P6 (MW) | P7 (MW) | Wind (MW) | Solar (MW) | Cost ($/h) |
|---|---|---|---|---|---|---|---|---|---|---|
| GA | 486.477 | 99.95 | 139.988 | 99.8611 | 446.64 | 99.9438 | 408.14 | 13.7 | 5.3 | 23,124.8 |
| PSO | 575 | 100 | 140 | 100 | 356 | 100 | 410 | 13.71 | 5.3 | 22,901.1 |
| BA | 574.992 | 99.99 | 139.992 | 99.992 | 356.04 | 99.992 | 409.99 | 13.71 | 5.3 | 22,901.0 |
| dBA | 575 | 100 | 140 | 100 | 355.9 | 100 | 410 | 13.71 | 5.3 | 22,899.4 |
| Generator | a ($/MW2) | b ($/MW) | c ($) | Pmin (MW) | Pmax (MW) |
|---|---|---|---|---|---|
| 1 | 0.000299 | 10.1 | 671 | 150 | 455 |
| 2 | 0.000183 | 10.2 | 574 | 150 | 455 |
| 3 | 0.001126 | 8.8 | 374 | 20 | 130 |
| 4 | 0.001126 | 8.8 | 374 | 20 | 130 |
| 5 | 0.000205 | 10.4 | 461 | 150 | 470 |
| 6 | 0.000301 | 10.1 | 630 | 135 | 460 |
| 7 | 0.000364 | 9.8 | 548 | 135 | 465 |
| 8 | 0.000338 | 11.2 | 227 | 60 | 300 |
| 9 | 0.000807 | 11.2 | 173 | 25 | 162 |
| 10 | 0.001203 | 10.7 | 175 | 25 | 160 |
| 11 | 0.003586 | 10.2 | 186 | 20 | 80 |
| 12 | 0.005513 | 9.9 | 230 | 20 | 80 |
| 13 | 0.000371 | 13.1 | 225 | 25 | 85 |
| 14 | 0.001929 | 12.1 | 309 | 15 | 55 |
| 15 | 0.004447 | 12.4 | 323 | 15 | 55 |
| Time (h) | 1 | 2 | 3 | 4 | 5 | 6 | 7 | 8 | 9 | 10 | 11 | 12 |
| Demand (MW) | 1650 | 1680 | 1680 | 1700 | 1700 | 1700 | 2000 | 2000 | 2500 | 2500 | 2700 | 2800 |
| Time (h) | 13 | 14 | 15 | 16 | 17 | 18 | 19 | 20 | 21 | 22 | 23 | 24 |
| Demand (MW) | 2900 | 3000 | 3000 | 3000 | 3000 | 2800 | 2500 | 2000 | 1800 | 1750 | 1700 | 1700 |
| t (h) | P1 (MW) | P2 (MW) | P3 (MW) | P4 (MW) | P5 (MW) | P6 (MW) | P7 (MW) | P8 (MW) | P9 (MW) | P10 (MW) | P11 (MW) | P12 (MW) | P13 (MW) | P14 (MW) | P15 (MW) | Cost ($/h) |
|---|---|---|---|---|---|---|---|---|---|---|---|---|---|---|---|---|
| 1 | 454.5173 | 150 | 129.5173 | 129.5173 | 251.9314 | 135 | 135 | 60 | 25 | 25 | 20 | 79.5173 | 25 | 15 | 15 | 22,261.66 |
| 2 | 454.8183 | 323.6984 | 129.8183 | 129.8183 | 150 | 135 | 135 | 60 | 25 | 25 | 20 | 36.8475 | 25 | 15 | 15 | 22,538.75 |
| 3 | 150 | 150 | 129.714 | 129.714 | 150 | 301.9416 | 463.6332 | 60 | 25 | 25 | 20 | 20 | 25 | 15 | 15 | 22,444.49 |
| 4 | 150 | 340.2449 | 129.9185 | 129.9185 | 150 | 459.9185 | 135 | 60 | 25 | 25 | 20 | 20 | 25 | 15 | 15 | 22,745.36 |
| 5 | 454.6776 | 150 | 129.6776 | 129.6776 | 150 | 345.9685 | 135 | 60 | 25 | 25 | 20 | 20 | 25 | 15 | 15 | 22,737.21 |
| 6 | 150.0393 | 275.836 | 129.7813 | 129.7813 | 150 | 135 | 464.7813 | 60 | 25 | 25 | 20 | 79.7813 | 25 | 15 | 15 | 22,667.74 |
| 7 | 454.603 | 371.7031 | 129.603 | 129.603 | 150 | 361.5336 | 135 | 60 | 25 | 25 | 78.4422 | 24.5125 | 25 | 15 | 15 | 25,840.65 |
| 8 | 150 | 150 | 129.8853 | 129.8853 | 469.8853 | 459.8853 | 305.4591 | 60 | 25 | 25 | 20 | 20 | 25 | 15 | 15 | 25,852.13 |
| 9 | 454.8122 | 454.8122 | 129.7939 | 129.8122 | 200.4546 | 459.6958 | 464.8122 | 60 | 25 | 25 | 20 | 20.8072 | 25 | 15 | 15 | 30,900.62 |
| 10 | 454.9989 | 454.9989 | 129.9504 | 129.9989 | 150.0139 | 459.9989 | 464.9989 | 60.0139 | 25.0139 | 25.0139 | 20.0139 | 69.9449 | 25.0139 | 15.0139 | 15.0139 | 30,896.62 |
| 11 | 454.9945 | 454.9945 | 129.9945 | 129.9945 | 469.9945 | 389.895 | 464.9945 | 60.0173 | 25.0173 | 25.0173 | 20.0173 | 20.0173 | 25.0173 | 15.0173 | 15.0173 | 33,020.56 |
| 12 | 454.7519 | 454.757 | 129.757 | 129.757 | 319.137 | 459.757 | 464.3489 | 60.0155 | 161.757 | 25.2103 | 20.4444 | 65.2619 | 25 | 15.0464 | 15 | 34,162.54 |
| 13 | 454.6133 | 454.6253 | 129.6253 | 129.3646 | 397.8806 | 459.6038 | 464.6253 | 60 | 25 | 159.616 | 44.1218 | 65.9254 | 25 | 15 | 15 | 35,155.73 |
| 14 | 454.9116 | 454.7211 | 129.9116 | 129.9116 | 469.6113 | 436.9758 | 464.9116 | 60 | 25 | 159.769 | 79.4746 | 79.8026 | 25 | 15 | 15 | 36,220.9 |
| 15 | 454.948 | 454.9247 | 129.6776 | 129.9353 | 469.9107 | 459.948 | 464.948 | 60 | 25 | 159.948 | 79.9179 | 55.8426 | 25 | 15 | 15 | 36,214.88 |
| 16 | 454.9006 | 454.9006 | 129.9006 | 129.9006 | 469.9006 | 459.9006 | 464.9006 | 60 | 25 | 97.6973 | 79.9006 | 78.2004 | 25 | 54.9006 | 15 | 36,255.24 |
| 17 | 454.9252 | 454.9252 | 129.9252 | 129.9252 | 469.9252 | 459.9252 | 464.5354 | 60 | 25.7849 | 135.312 | 79.9252 | 79.8604 | 25 | 15 | 15.032 | 36,205.23 |
| 18 | 454.979 | 425.1479 | 129.979 | 129.979 | 469.979 | 459.979 | 464.979 | 60 | 25 | 25 | 79.979 | 20 | 25 | 15 | 15 | 34,068.04 |
| 19 | 454.8777 | 454.8777 | 129.8777 | 129.8777 | 412.0411 | 135 | 464.8777 | 60 | 25 | 25 | 73.6938 | 79.8777 | 25 | 15 | 15 | 30,976.82 |
| 20 | 150 | 229.2133 | 129.9615 | 129.9615 | 150 | 459.9615 | 464.827 | 60 | 25 | 25 | 79.6877 | 41.3885 | 25 | 15 | 15 | 25,755.94 |
| 21 | 341.5044 | 244.4965 | 129.8299 | 129.7027 | 150 | 135 | 464.467 | 60 | 25 | 25 | 20 | 20 | 25 | 15 | 15 | 23,678.85 |
| 22 | 350.5488 | 454.8629 | 129.8629 | 129.8629 | 150 | 135 | 135 | 60 | 25 | 25 | 20 | 79.8629 | 25 | 15 | 15 | 23,271.42 |
| 23 | 150 | 150 | 129.6651 | 20 | 150 | 415.4029 | 464.6651 | 60 | 25 | 25 | 20 | 35.2672 | 25 | 15 | 15 | 22,796.79 |
| 24 | 150 | 275.788 | 129.8031 | 129.8031 | 150 | 135 | 464.8031 | 60 | 25 | 25 | 20 | 79.8031 | 25 | 15 | 15 | 22,667.7 |
| Total Cost ($/day) | 679,336 | |||||||||||||||
| t (h) | P1 (MW) | P2 (MW) | P3 (MW) | P4 (MW) | P5 (MW) | P6 (MW) | P7 (MW) | P8 (MW) | P9 (MW) | P10 (MW) | P11 (MW) | P12 (MW) | P13 (MW) | P14 (MW) | P15 (MW) | Cost ($/h) |
|---|---|---|---|---|---|---|---|---|---|---|---|---|---|---|---|---|
| 1 | 268.1071 | 151.8249 | 129.9992 | 130 | 150 | 135 | 465 | 60 | 25.05492 | 25 | 20 | 35.00603 | 25.00067 | 15.00716 | 15 | 22,135.66 |
| 2 | 150 | 150 | 130 | 130 | 150 | 285.9036 | 465 | 60 | 25 | 25 | 20 | 34.09638 | 25 | 15 | 15 | 22,442.49 |
| 3 | 268.191 | 185.7993 | 129.9897 | 129.9897 | 150 | 135 | 464.2456 | 60 | 25 | 25 | 20 | 31.79258 | 25 | 15 | 15 | 22,443.63 |
| 4 | 297.296 | 176.2702 | 130 | 130 | 150 | 135 | 463.4961 | 60.08577 | 25 | 25 | 20 | 32.85194 | 25 | 15 | 15.00001 | 22,649.1 |
| 5 | 258.924 | 150 | 129.9675 | 129.9787 | 150 | 206.0509 | 464.9435 | 60 | 25 | 25 | 20 | 25.13593 | 25 | 15 | 15 | 22,644.91 |
| 6 | 237.1147 | 150 | 130 | 130 | 150 | 223.4615 | 465 | 60 | 25 | 25 | 20 | 29.42383 | 25 | 15 | 15 | 22,644.3 |
| 7 | 326.3309 | 262.9082 | 130 | 129.9779 | 150 | 308.7519 | 464.6059 | 60 | 25 | 25 | 21.58769 | 40.46383 | 25.36109 | 15.02705 | 15 | 25,726.55 |
| 8 | 318.7497 | 269.8317 | 129.9986 | 130 | 150 | 331.0041 | 465 | 60.1266 | 25.05721 | 25 | 20.13303 | 20 | 25 | 15.06744 | 15.03519 | 25,726.83 |
| 9 | 454.9384 | 455 | 129.9961 | 130 | 152.9831 | 459.9996 | 465 | 60 | 25.00977 | 25 | 36.28722 | 50.78548 | 25.00027 | 15.00029 | 15 | 30,893.49 |
| 10 | 455 | 455 | 130 | 130 | 150 | 460 | 465 | 60 | 25 | 25 | 70 | 20 | 25 | 15 | 15 | 30,902.77 |
| 11 | 454.8476 | 455 | 129.9879 | 130 | 340.1686 | 459.9999 | 464.961 | 60 | 25 | 25.07322 | 20.00291 | 79.9573 | 25 | 15.00162 | 15 | 32,998.86 |
| 12 | 455 | 455 | 129.9872 | 130 | 435.471 | 460 | 465 | 60 | 25 | 25.00929 | 46.37583 | 58.16277 | 25 | 15 | 15 | 34,049.35 |
| 13 | 455 | 455 | 130 | 130 | 470 | 459.9995 | 465 | 60 | 25 | 35.02112 | 79.97935 | 80 | 25 | 15 | 15 | 35,113.62 |
| 14 | 455 | 455 | 130 | 130 | 470 | 460 | 465 | 60 | 25 | 135 | 80 | 80 | 25 | 15 | 15 | 36,204.07 |
| 15 | 455 | 455 | 130 | 130 | 470 | 460 | 465 | 60 | 25 | 135 | 80 | 80 | 25 | 15 | 15 | 36,204.07 |
| 16 | 455 | 455 | 130 | 130 | 470 | 460 | 465 | 60 | 25 | 135 | 80 | 80 | 25 | 15 | 15 | 36,204.07 |
| 17 | 455 | 455 | 130 | 130 | 470 | 459.9993 | 464.9835 | 127.5593 | 67.45966 | 25 | 79.99822 | 80 | 25 | 15 | 15 | 36,245.37 |
| 18 | 455 | 455 | 130 | 130 | 408.7914 | 460 | 465 | 60 | 25 | 25 | 51.20889 | 80 | 25 | 15 | 15 | 34,051.09 |
| 19 | 454.43 | 455 | 129.9944 | 129.9912 | 187.6798 | 458.2474 | 465 | 60 | 25.08487 | 25 | 34.54946 | 20 | 25 | 15.02435 | 15 | 30,899.38 |
| 20 | 316.3898 | 236.9526 | 129.8654 | 130 | 150 | 360.5217 | 462.9519 | 60.09335 | 25 | 25 | 20 | 28.0467 | 25 | 15 | 15.1786 | 25,726.8 |
| 21 | 258.5847 | 159.7468 | 130 | 129.9958 | 150 | 290.5911 | 465 | 60 | 25 | 25 | 20 | 31.08181 | 25 | 15 | 15 | 23,669.62 |
| 22 | 297.8829 | 226.1458 | 129.9953 | 129.9953 | 150 | 135 | 464.9858 | 60 | 25 | 25 | 21.88823 | 29.10983 | 25 | 15 | 15 | 23,162.8 |
| 23 | 320.5932 | 150 | 129.999 | 129.9718 | 150 | 135 | 464.996 | 60 | 25 | 25 | 20.00368 | 34.43637 | 25 | 15 | 15 | 22,649.47 |
| 24 | 280.0402 | 191.7499 | 130 | 129.9999 | 150 | 135 | 465 | 60 | 25 | 25 | 20 | 33.21005 | 25 | 15 | 15 | 22,648.73 |
| Total Cost ($/day) | 678,037 | |||||||||||||||
| t (h) | P1 (MW) | P2 (MW) | P3 (MW) | P4 (MW) | P5 (MW) | P6 (MW) | P7 (MW) | P8 (MW) | P9 (MW) | P10 (MW) | P11 (MW) | P12 (MW) | P13 (MW) | P14 (MW) | P15 (MW) | Wind (MW) | Solar (MW) | Cost ($/h) |
|---|---|---|---|---|---|---|---|---|---|---|---|---|---|---|---|---|---|---|
| 1 | 281.7092 | 150.074 | 129.9947 | 129.9947 | 150.074 | 135.8677 | 464.9947 | 60.07397 | 25.07397 | 25.07397 | 20.07397 | 20.07397 | 25.07397 | 15.07397 | 15.07397 | 1.7 | 0 | 22,121.09 |
| 2 | 150 | 282.339 | 129.8138 | 129.8138 | 150 | 135 | 464.8138 | 60 | 25 | 25.1258 | 20 | 44.59409 | 25 | 15 | 15 | 8.5 | 0 | 22,365.49 |
| 3 | 271.9361 | 454.6985 | 129.6985 | 129.6985 | 150 | 135 | 135 | 60 | 25 | 25 | 79.69852 | 20 | 25 | 15 | 15 | 9.27 | 0 | 22,464.14 |
| 4 | 150 | 150 | 129.8576 | 129.7729 | 150 | 458.6148 | 310.0953 | 60 | 25 | 25 | 20 | 20 | 25 | 15 | 15 | 16.66 | 0 | 22,518.04 |
| 5 | 288.1475 | 258.7675 | 129.572 | 129.7027 | 150 | 396.425 | 135 | 60 | 25 | 25 | 20 | 20 | 25 | 15.16677 | 15 | 7.22 | 0 | 22,659.36 |
| 6 | 304.2958 | 259.0841 | 129.9838 | 129.9838 | 150.0332 | 381.2783 | 135.0332 | 60.03318 | 25.03318 | 25.03318 | 20.03318 | 20.13603 | 25.03318 | 15.03318 | 15.03318 | 4.91 | 0.03 | 22,681.08 |
| 7 | 289.2473 | 150 | 129.7084 | 129.7084 | 150.1093 | 459.7084 | 464.7084 | 60.66211 | 25 | 25 | 20 | 20 | 25.22125 | 15 | 15 | 14.66 | 6.27 | 25,522.44 |
| 8 | 210.5264 | 150 | 129.4769 | 129.9911 | 150 | 459.6238 | 464.2031 | 60 | 25 | 25 | 20 | 77.64247 | 25 | 15 | 15 | 26.56 | 16.98 | 25,300.26 |
| 9 | 453.9715 | 409.3092 | 129.5264 | 129.5264 | 469.1651 | 135 | 464.5264 | 60 | 25 | 25 | 20 | 79.0455 | 25 | 15 | 15 | 20.88 | 24.05 | 30,516.55 |
| 10 | 454.9222 | 433.2828 | 129.7979 | 129.9222 | 150 | 459.9222 | 464.7754 | 60 | 25 | 25 | 20 | 35.15727 | 25 | 15 | 15 | 17.85 | 39.37 | 30,301.17 |
| 11 | 365.4471 | 454.8837 | 129.8837 | 129.8837 | 469.8837 | 459.8837 | 464.8837 | 60 | 25 | 25 | 20 | 20 | 25 | 15.04069 | 15 | 12.8 | 7.41 | 32,813.76 |
| 12 | 454.5277 | 454.5277 | 128.6792 | 129.5277 | 364.225 | 459.1589 | 464.5277 | 60 | 25 | 25 | 79.52773 | 77.99903 | 25 | 15 | 15 | 18.65 | 3.65 | 33,822.85 |
| 13 | 345.8919 | 454.7273 | 129.7273 | 129.7273 | 469.7273 | 459.7273 | 464.7273 | 60 | 25 | 159.7273 | 20 | 79.72728 | 25 | 15 | 15 | 14.35 | 31.94 | 34,697.93 |
| 14 | 454.9462 | 454.5551 | 129.9212 | 129.9462 | 469.2832 | 459.9462 | 464.9462 | 60 | 25 | 159.9088 | 20 | 79.38804 | 25 | 15 | 15 | 10.35 | 26.81 | 35,825.6 |
| 15 | 454.9977 | 454.9977 | 129.9977 | 129.9977 | 469.9977 | 459.9977 | 464.9977 | 109.917 | 25.04 | 25.67639 | 79.99768 | 79.99768 | 25.30839 | 15.7466 | 54.99303 | 8.26 | 10.08 | 36,098.75 |
| 16 | 454.7627 | 454.9994 | 129.9994 | 129.9994 | 469.7458 | 459.9267 | 464.9994 | 60.05021 | 25.05021 | 116.5125 | 79.94488 | 79.84993 | 25.05021 | 15.05021 | 15.05021 | 13.71 | 5.3 | 35,996.9 |
| 17 | 454.9999 | 454.9999 | 129.9999 | 129.9999 | 469.9999 | 459.9999 | 464.9999 | 81.0129 | 25.19556 | 159.9999 | 20.19556 | 79.99993 | 25.19556 | 15.19556 | 15.19556 | 3.44 | 9.57 | 36,096.48 |
| 18 | 454.48 | 454.9925 | 129.9925 | 129.9925 | 243.6014 | 459.9925 | 464.8602 | 60.02893 | 25.02893 | 159.9925 | 78.74649 | 79.02527 | 25.02893 | 15.02893 | 15.02893 | 1.87 | 2.31 | 34,064.69 |
| 19 | 454.9733 | 454.9733 | 129.9733 | 20.13605 | 248.3221 | 459.9733 | 464.9733 | 60.13605 | 25.13605 | 25.13605 | 79.97335 | 20.13605 | 25.13605 | 15.13605 | 15.13605 | 0.75 | 0 | 31,066.12 |
| 20 | 454.7103 | 150 | 129.7103 | 129.7103 | 150 | 315.9887 | 464.7103 | 60 | 25 | 25 | 20 | 20 | 25 | 15 | 15 | 0.17 | 0 | 25,733.86 |
| 21 | 150 | 150 | 129.4684 | 129.3103 | 150 | 459.4684 | 367.5487 | 60 | 25 | 25 | 79.05508 | 20 | 25 | 15 | 15 | 0.15 | 0 | 23,719.71 |
| 22 | 150 | 164.7137 | 129.862 | 129.4175 | 150 | 330.9085 | 464.862 | 60 | 25 | 25 | 20 | 44.92665 | 25 | 15 | 15 | 0.31 | 0 | 23,161.66 |
| 23 | 150 | 150 | 129.0845 | 129.0845 | 150 | 459.0845 | 326.6766 | 60 | 25 | 25 | 20 | 20 | 25 | 15 | 15 | 1.07 | 0 | 22,675.97 |
| 24 | 150 | 320.039 | 128.7706 | 129.8505 | 150 | 135 | 464.9429 | 60 | 25 | 25 | 20 | 35.81715 | 25 | 15 | 15 | 0.58 | 0 | 22,654.21 |
| Total Cost ($/day) | 674,878.1 | |||||||||||||||||
| t (h) | P1 (MW) | P2 (MW) | P3 (MW) | P4 (MW) | P5 (MW) | P6 (MW) | P7 (MW) | P8 (MW) | P9 (MW) | P10 (MW) | P11 (MW) | P12 (MW) | P13 (MW) | P14 (MW) | P15 (MW) | Wind (MW) | Solar (MW) | Cost ($/h) |
|---|---|---|---|---|---|---|---|---|---|---|---|---|---|---|---|---|---|---|
| 1 | 222.3254 | 150.0718 | 130 | 130 | 150.0163 | 184.9209 | 465 | 60.00281 | 25 | 25 | 20.0149 | 30.94789 | 25 | 15 | 15.00001 | 1.7 | 0 | 22,116.94 |
| 2 | 174.5542 | 150.9551 | 129.9973 | 129.9874 | 150.0258 | 259.3709 | 464.8492 | 60.00002 | 25.00404 | 25 | 20.00217 | 26.7772 | 25 | 15 | 15.01468 | 8.5 | 0 | 22,355.62 |
| 3 | 220.9976 | 150 | 130 | 130 | 150 | 209.5001 | 465 | 60.00008 | 25.01496 | 25 | 20 | 30.21716 | 25 | 15 | 15.00009 | 9.27 | 0 | 22346.12 |
| 4 | 179.6374 | 152.5915 | 130 | 129.9492 | 150.2174 | 259.4324 | 464.8455 | 60.02013 | 25.00824 | 25.00812 | 20.00537 | 31.63979 | 25.00361 | 15.00241 | 15.00241 | 16.66 | 0 | 22,476.58 |
| 5 | 210.9494 | 150 | 129.9983 | 129.988 | 150 | 241.9494 | 465 | 60 | 25.01289 | 25 | 20.7229 | 29.20571 | 25 | 15 | 15 | 7.22 | 0 | 22,572.46 |
| 6 | 228.3645 | 150.0246 | 129.9577 | 130 | 150.1062 | 223.8274 | 464.9199 | 60 | 25.00143 | 25.02728 | 20.0001 | 32.82126 | 25.00898 | 15.00074 | 15 | 4.91 | 0.03 | 22,595.21 |
| 7 | 229.6181 | 455 | 130 | 130 | 150 | 213.7353 | 465 | 60 | 25 | 25 | 20.67627 | 20 | 25 | 15 | 15.04037 | 14.66 | 6.27 | 25,525.78 |
| 8 | 318.9402 | 227.2118 | 130 | 130 | 150.1345 | 318.4998 | 463.4972 | 60.07476 | 25 | 25 | 20 | 33.03786 | 25.03043 | 15 | 15.04323 | 26.56 | 16.98 | 25,278.95 |
| 9 | 455 | 431.2419 | 130 | 130 | 150.1204 | 456.2316 | 465 | 60.02773 | 25 | 25.00001 | 24.07677 | 48.36796 | 25.00773 | 15 | 15.00527 | 20.88 | 24.05 | 30,428.2 |
| 10 | 455 | 427.6109 | 130 | 130 | 150.0329 | 459.9529 | 464.994 | 60 | 25.01043 | 25 | 20 | 40.17244 | 25 | 15.00648 | 15 | 17.85 | 39.37 | 30,300.58 |
| 11 | 455 | 455 | 130 | 129.9983 | 295.042 | 459.8914 | 465 | 60 | 25.02148 | 25.0011 | 44.83347 | 79.99943 | 25.00329 | 15 | 15 | 12.8 | 7.41 | 32,784.96 |
| 12 | 455 | 455 | 129.9996 | 130 | 387.4157 | 460 | 465 | 60 | 25 | 25 | 50.24593 | 80 | 25 | 15.02408 | 15.01524 | 18.65 | 3.65 | 33,816.95 |
| 13 | 454.9995 | 455 | 130 | 130 | 470 | 459.9999 | 465 | 60 | 25.00067 | 25.00861 | 58.27325 | 65.42811 | 25 | 15 | 15 | 14.35 | 31.94 | 34,619.02 |
| 14 | 455 | 455 | 130 | 130 | 470 | 460 | 465 | 60 | 25 | 97.84 | 80 | 80 | 25 | 15 | 15 | 10.35 | 26.81 | 35,797.41 |
| 15 | 455 | 455 | 130 | 130 | 470 | 460 | 465 | 60 | 25 | 116.66 | 80 | 80 | 25 | 15 | 15 | 8.26 | 10.08 | 36,003.64 |
| 16 | 455 | 455 | 130 | 130 | 470 | 460 | 465 | 60 | 25 | 115.99 | 80 | 80 | 25 | 15 | 15 | 13.71 | 5.3 | 35,996.28 |
| 17 | 455 | 455 | 130 | 130 | 470 | 460 | 465 | 60 | 25 | 121.99 | 80 | 80 | 25 | 15 | 15 | 3.44 | 9.57 | 36,062.2 |
| 18 | 455 | 455 | 130 | 130 | 395.0492 | 460 | 465 | 60 | 25 | 25 | 80 | 60.77082 | 25 | 15 | 15 | 1.87 | 2.31 | 34,009.18 |
| 19 | 455 | 454.8161 | 129.9994 | 130 | 150 | 460 | 465 | 60.00101 | 25 | 25 | 39.2392 | 50.19431 | 25 | 15 | 15 | 0.75 | 0 | 30,887.02 |
| 20 | 395.3524 | 150 | 130 | 130 | 150 | 358.3626 | 465 | 60 | 25 | 25.12926 | 20.50318 | 35.50864 | 25 | 15 | 15 | 0.17 | 0 | 25,728.92 |
| 21 | 150 | 251.779 | 130 | 129.9945 | 150 | 317.7931 | 464.9999 | 60 | 25 | 25.00248 | 20.28195 | 20 | 25 | 15 | 15 | 0.15 | 0 | 23,676.49 |
| 22 | 251.59 | 150.009 | 130 | 129.962 | 150 | 254.3827 | 465 | 60 | 25.03605 | 25.24237 | 20.28683 | 33.14521 | 25 | 15 | 15.05015 | 0.31 | 0 | 23,155.2 |
| 23 | 221.1774 | 150.6069 | 130 | 130 | 150 | 247.0148 | 465 | 60 | 25 | 25 | 20.13145 | 20.00069 | 25 | 15 | 15 | 1.07 | 0 | 22,635.45 |
| 24 | 150 | 318.2863 | 129.9946 | 130 | 150.0123 | 135 | 464.8988 | 60 | 25 | 25 | 20 | 36.22784 | 25.00022 | 15 | 15 | 0.58 | 0 | 22,652.52 |
| Total Cost ($/day) | 673,821.7 | |||||||||||||||||
| Algo. | P1 (MW) | P2 (MW) | P3 (MW) | P4 (MW) | P5 (MW) | P6 (MW) | P7 (MW) | P8 (MW) | P9 (MW) | P10 (MW) | P11 (MW) | P12 (MW) | P13 (MW) | P14 (MW) | P15 (MW) | Cost ($/h) |
|---|---|---|---|---|---|---|---|---|---|---|---|---|---|---|---|---|
| GA | 363.492 | 453.795 | 129.346 | 129.728 | 359.963 | 375.192 | 464.217 | 180.51 | 148.767 | 153.632 | 79.9023 | 77.2148 | 39.1577 | 27.5144 | 17.5699 | 3649 |
| PSO | 455 | 455 | 130 | 130 | 470 | 460 | 465 | 93.0009 | 162 | 25 | 20 | 80 | 25 | 15 | 15 | 36299 |
| BA | 454.98 | 454.98 | 129.98 | 129.98 | 469.98 | 459.98 | 464.98 | 60.01557 | 60.10281 | 159.98 | 20.01557 | 79.97995 | 25.01557 | 15.01557 | 15.01557 | 36242 |
| dBA | 455 | 455 | 130 | 130 | 470 | 460 | 465 | 60 | 25 | 135 | 80 | 80 | 25 | 15 | 15 | 36204 |
| Algo. | P1 (MW) | P2 (MW) | P3 (MW) | P4 (MW) | P5 (MW) | P6 (MW) | P7 (MW) | P8 (MW) | P9 (MW) | P10 (MW) | P11 (MW) | P12 (MW) | P13 (MW) | P14 (MW) | P15 (MW) | Wind (MW) | Solar (MW) | Cost ($/h) |
|---|---|---|---|---|---|---|---|---|---|---|---|---|---|---|---|---|---|---|
| GA | 359.14 | 361.427 | 129.932 | 129.952 | 388.694 | 362.319 | 390.447 | 290.997 | 150.702 | 153.982 | 78.889 | 78.993 | 55.887 | 34.555 | 15.079 | 13.71 | 5.3 | 36,491.1 |
| PSO | 455 | 455 | 130 | 130 | 470 | 460 | 465 | 60 | 25 | 75.9902 | 80 | 80 | 25 | 55 | 15 | 13.71 | 5.3 | 36,047 |
| BA | 454.91 | 454.909 | 129.909 | 129.909 | 469.909 | 459.909 | 464.909 | 60 | 25 | 116.809 | 79.909 | 79.909 | 25 | 15 | 15 | 13.71 | 5.3 | 35,996 |
| dBA | 455 | 455 | 130 | 130 | 470 | 460 | 465 | 60 | 25 | 115.99 | 80 | 80 | 25 | 15 | 15 | 13.71 | 5.3 | 35,995 |
| Unit | a ($/MW2) | b ($/MW) | c ($) | e | f | Pmin (MW) | Pmax (MW) |
|---|---|---|---|---|---|---|---|
| 1 | 0.007 | 7 | 240 | 300 | 0.031 | 100 | 500 |
| 2 | 0.0095 | 10 | 200 | 200 | 0.042 | 50 | 200 |
| 3 | 0.009 | 8.5 | 220 | 150 | 0.063 | 80 | 300 |
| 4 | 0.009 | 11 | 200 | 150 | 0.063 | 50 | 150 |
| 5 | 0.008 | 10.5 | 220 | 150 | 0.063 | 50 | 200 |
| 6 | 0.0075 | 12 | 190 | 150 | 0.063 | 50 | 120 |
| Time (h) | 1 | 2 | 3 | 4 | 5 | 6 | 7 | 8 | 9 | 10 | 11 | 12 |
| Demand (MW) | 800 | 780 | 750 | 750 | 720 | 700 | 700 | 700 | 800 | 900 | 1000 | 1200 |
| Time (h) | 13 | 14 | 15 | 16 | 17 | 18 | 19 | 20 | 21 | 22 | 23 | 24 |
| Demand (MW) | 1260 | 1263 | 1300 | 1350 | 1100 | 900 | 850 | 800 | 780 | 750 | 700 | 800 |
| t (h) | BA | dBA | ||||||||||||
|---|---|---|---|---|---|---|---|---|---|---|---|---|---|---|
| P1 (MW) | P2 (MW) | P3 (MW) | P4 (MW) | P5 (MW) | P6 (MW) | Cost ($/h) | P1 (MW) | P2 (MW) | P3 (MW) | P4 (MW) | P5 (MW) | P6 (MW) | Cost ($/h) | |
| 1 | 304.0977 | 199.8699 | 145.6583 | 50.1247 | 50.1247 | 50.1247 | 9738.751 | 303.1211 | 50 | 197.1456 | 50 | 149.7333 | 50 | 9664.668 |
| 2 | 302.3879 | 50 | 277.6122 | 50 | 50 | 50 | 9360.333 | 400.2669 | 50 | 179.7331 | 50 | 50 | 50 | 9306.703 |
| 3 | 403.7476 | 50.0779 | 145.9411 | 50.0779 | 50.0779 | 50.0779 | 9065.843 | 302.6834 | 117.5835 | 80 | 99.8666 | 99.8666 | 50 | 9070.008 |
| 4 | 403.8278 | 116.1724 | 80 | 50 | 50 | 50 | 9074.849 | 404.0251 | 50 | 145.9749 | 50 | 50 | 50 | 9060.803 |
| 5 | 302.8308 | 50 | 80 | 50 | 187.1696 | 50 | 8837.094 | 302.6834 | 124.7998 | 142.5168 | 50 | 50 | 50 | 8663.793 |
| 6 | 404.1376 | 50 | 95.8625 | 50 | 50 | 50 | 8527.005 | 404.0251 | 65.9749 | 80 | 50 | 50 | 50 | 8540.125 |
| 7 | 403.6802 | 50 | 80 | 66.3199 | 50 | 50 | 8562.329 | 302.6834 | 50 | 197.3166 | 50 | 50 | 50 | 8451.905 |
| 8 | 304.9113 | 50 | 195.0889 | 50 | 50 | 50 | 8460.184 | 302.6834 | 50 | 179.7331 | 50 | 67.5835 | 50 | 8443.944 |
| 9 | 404.0628 | 50.0696 | 195.503 | 50.2274 | 50.0696 | 50.0696 | 9642.309 | 302.6834 | 117.717 | 179.7331 | 50 | 99.8666 | 50 | 9535.645 |
| 10 | 302.0052 | 198.8671 | 180.2607 | 50 | 50 | 118.8671 | 11,018.49 | 302.6834 | 124.7998 | 179.7331 | 50 | 192.7837 | 50 | 10,819.79 |
| 11 | 298.5139 | 119.4949 | 279.0726 | 50 | 155.4834 | 97.4355 | 12,188.55 | 302.6791 | 124.7997 | 272.9238 | 99.8665 | 99.8665 | 99.8643 | 12,066.25 |
| 12 | 405.8937 | 196.2599 | 279.4071 | 116.9151 | 150.0368 | 51.4876 | 14,667.56 | 404.0251 | 200 | 229.5997 | 116.7756 | 149.7331 | 99.8666 | 14,613.49 |
| 13 | 405.654 | 198.2898 | 257.4718 | 149.9055 | 198.6867 | 50 | 15,458.83 | 404.0251 | 199.5997 | 229.5997 | 149.7331 | 177.176 | 99.8666 | 15,423 |
| 14 | 499.7773 | 199.4551 | 264.276 | 50 | 199.4917 | 50 | 15,545.15 | 404.0251 | 180.176 | 229.5997 | 149.7331 | 199.5997 | 99.8666 | 15,459.25 |
| 15 | 499.9861 | 121.895 | 229.7232 | 149.6276 | 199.9861 | 98.782 | 15,923.5 | 496.4093 | 124.7986 | 279.4612 | 149.7312 | 149.7331 | 99.8665 | 15,899.96 |
| 16 | 499.7221 | 199.5299 | 251.3507 | 149.8015 | 199.596 | 50 | 16,678.19 | 500 | 199.5997 | 251.0676 | 99.8666 | 199.5997 | 99.8666 | 16,668 |
| 17 | 410.8341 | 199.6708 | 229.0246 | 50.0123 | 111.3209 | 99.1373 | 13,400.56 | 404.0303 | 199.5999 | 246.6364 | 99.8667 | 50 | 99.8667 | 13,397.62 |
| 18 | 302.8311 | 125.9796 | 222.1654 | 149.0241 | 50 | 50 | 10,863.54 | 302.6834 | 117.9839 | 229.5997 | 50 | 149.7331 | 50 | 10,767.51 |
| 19 | 495.3723 | 124.6277 | 80 | 50 | 50 | 50 | 10,415.96 | 404.0251 | 116.2418 | 179.7331 | 50 | 50 | 50 | 10,156.68 |
| 20 | 404.015 | 50.1457 | 195.4023 | 50.1457 | 50.1457 | 50.1457 | 9642.712 | 302.6834 | 124.7998 | 179.7331 | 50 | 50 | 92.7837 | 9604.737 |
| 21 | 302.2643 | 50 | 129.2625 | 50 | 198.4738 | 50 | 9408.851 | 400.2669 | 50 | 179.7331 | 50 | 50 | 50 | 9306.703 |
| 22 | 404.6521 | 50 | 145.348 | 50 | 50 | 50 | 9064.374 | 302.6834 | 67.717 | 229.5997 | 50 | 50 | 50 | 9048.594 |
| 23 | 404.2485 | 50 | 80 | 50 | 65.7516 | 50 | 8548.91 | 302.6834 | 67.5835 | 80 | 149.7331 | 50 | 50 | 8634.162 |
| 24 | 403.986 | 50 | 196.0141 | 50 | 50 | 50 | 9640.874 | 403.9045 | 116.2324 | 129.8639 | 50 | 50 | 50 | 9593.417 |
| Total Cost ($/day) | 263,734.7 | Total Cost ($/day) | 262,196.7 | |||||||||||
| t (h) | BA | dBA | ||||||||||||||||
|---|---|---|---|---|---|---|---|---|---|---|---|---|---|---|---|---|---|---|
| P1 (MW) | P2 (MW) | P3 (MW) | P4 (MW) | P5 (MW) | P6 (MW) | Wind (MW) | Solar (MW) | Cost | P1 (MW) | P2 (MW) | P3 (MW) | P4 (MW) | P5 (MW) | P6 (MW) | Wind (MW) | Solar (MW) | Cost ($/h) | |
| 1 | 407.261 | 50 | 191.0391 | 50 | 50 | 50 | 1.7 | 0 | 9623.146 | 302.6924 | 50 | 229.6642 | 50 | 115.9815 | 50 | 302.6924 | 0 | 9626.532 |
| 2 | 403.9725 | 50 | 80 | 137.5276 | 50 | 50 | 8.5 | 0 | 9454.004 | 216.713 | 124.8317 | 179.7337 | 50.3936 | 149.8281 | 50.0001 | 216.713 | 0 | 9422.702 |
| 3 | 407.4166 | 52.8849 | 80 | 100.4289 | 50 | 50 | 9.27 | 0 | 8997.98 | 302.1017 | 109.632 | 179.253 | 50 | 50 | 50 | 302.1017 | 0 | 8912.984 |
| 4 | 302.8392 | 50 | 229.3799 | 51.1211 | 50 | 50 | 16.7 | 0 | 8743.5 | 302.8251 | 50 | 130.7264 | 99.9077 | 99.8885 | 50 | 302.8251 | 0 | 8767.597 |
| 5 | 301.2707 | 50 | 211.5096 | 50 | 50 | 50 | 7.22 | 0 | 8625.025 | 302.6834 | 50 | 80 | 80.3635 | 149.7331 | 50 | 302.6834 | 0 | 8746.108 |
| 6 | 309.4563 | 50 | 185.6037 | 50 | 50 | 50 | 4.91 | 0.03 | 8371.869 | 302.6977 | 61.0559 | 179.8242 | 50.0208 | 50.0004 | 51.4948 | 302.6977 | 0.03 | 8357.135 |
| 7 | 399.07 | 50 | 80 | 50 | 50 | 50 | 14.7 | 6.27 | 8222.705 | 302.6795 | 50 | 176.3905 | 50 | 50 | 50 | 302.6795 | 6.27 | 8101.709 |
| 8 | 303.8568 | 122.6032 | 80 | 50 | 50 | 50 | 26.6 | 17 | 7916.233 | 226.7368 | 50 | 129.9616 | 99.8799 | 99.8826 | 50 | 226.7368 | 17 | 8147.866 |
| 9 | 300.4229 | 127.362 | 177.1759 | 50.0366 | 50.0366 | 50.0366 | 20.9 | 24.1 | 9027.041 | 302.6734 | 50.1159 | 129.9708 | 99.9166 | 99.5375 | 72.8991 | 302.6734 | 24.1 | 9195.099 |
| 10 | 404.5675 | 50 | 232.997 | 55.2156 | 50 | 50 | 17.9 | 39.4 | 10,125.3 | 404.0079 | 58.2945 | 179.8913 | 99.9727 | 50.5936 | 50.0207 | 404.0079 | 39.4 | 10,114.19 |
| 11 | 405.3966 | 130.018 | 185.9864 | 103.5525 | 50.1832 | 104.6533 | 12.8 | 7.41 | 11,927.35 | 404.0191 | 50 | 179.7296 | 146.318 | 149.7246 | 50 | 404.0191 | 7.41 | 11,788.42 |
| 12 | 402.9712 | 199.5415 | 276.0535 | 96.2798 | 152.7847 | 50.0694 | 18.7 | 3.65 | 14,292.73 | 404.4885 | 124.7998 | 279.4668 | 119.2786 | 149.8399 | 99.8314 | 404.4885 | 3.65 | 14,334.4 |
| 13 | 499.4858 | 189.1041 | 227.7647 | 147.7838 | 99.5717 | 50 | 14.4 | 31.9 | 14,891.31 | 404.1383 | 130.5086 | 229.6849 | 149.6973 | 199.6692 | 100.0118 | 404.1383 | 31.9 | 14,727.89 |
| 14 | 403.9604 | 196.115 | 278.8123 | 50 | 199.2537 | 97.6997 | 10.4 | 26.8 | 14,922.88 | 404.0251 | 193.019 | 229.563 | 149.7223 | 199.536 | 50 | 404.0251 | 26.8 | 14,888.17 |
| 15 | 499.9823 | 50.364 | 279.7122 | 149.9823 | 199.9823 | 101.637 | 8.26 | 10.1 | 15,777.14 | 500 | 124.7999 | 279.4662 | 149.732 | 149.7337 | 77.9305 | 500 | 10.1 | 15,773.39 |
| 16 | 499.9947 | 199.48 | 280.3615 | 100.7151 | 199.9947 | 50.446 | 13.7 | 5.3 | 16,302.84 | 500 | 199.8978 | 279.5025 | 149.999 | 150.4317 | 51.1593 | 500 | 5.3 | 16,297.56 |
| 17 | 404.8324 | 199.9615 | 280.2751 | 50.2983 | 50.2983 | 101.3246 | 3.44 | 9.57 | 13,175.66 | 404.0315 | 124.5384 | 229.5879 | 99.859 | 129.2 | 99.7795 | 404.0315 | 9.57 | 13,158.34 |
| 18 | 301.0121 | 198.385 | 178.1683 | 50 | 50 | 118.2546 | 1.87 | 2.31 | 10,989.48 | 308.9345 | 57.3585 | 229.7199 | 50.0997 | 149.8421 | 99.8655 | 308.9345 | 2.31 | 10,855.5 |
| 19 | 303.5578 | 50 | 195.8985 | 50 | 199.7937 | 50 | 0.75 | 0 | 10,321.21 | 302.6831 | 121.8288 | 129.8605 | 98.6726 | 99.8539 | 96.3515 | 302.6831 | 0 | 10,242.29 |
| 20 | 303.4517 | 50.0205 | 279.1827 | 50 | 67.1753 | 50 | 0.17 | 0 | 9713.297 | 204.3773 | 50.1842 | 279.4667 | 66.0672 | 99.8678 | 99.8667 | 204.3773 | 0 | 9922.678 |
| 21 | 302.3867 | 50.3536 | 176.8755 | 149.5274 | 50.3536 | 50.3536 | 0.15 | 0 | 9399.814 | 302.6804 | 50 | 179.7224 | 97.5928 | 99.854 | 50.0005 | 302.6804 | 0 | 9300.974 |
| 22 | 405.7363 | 50.8019 | 80.8019 | 51.3261 | 109.8055 | 51.2187 | 0.31 | 0 | 9155.692 | 302.6833 | 117.311 | 80.0002 | 99.8299 | 99.8656 | 50 | 302.6833 | 0 | 9069.648 |
| 23 | 404.8733 | 64.0576 | 80 | 50 | 50 | 50 | 1.07 | 0 | 8525.123 | 302.6835 | 50.0002 | 146.3776 | 99.8665 | 50 | 50.0022 | 302.6835 | 0 | 8473.289 |
| 24 | 302.5694 | 50 | 232.2333 | 50 | 50 | 114.6174 | 0.58 | 0 | 9750.315 | 403.9456 | 115.6947 | 80 | 99.8031 | 50 | 50 | 403.9456 | 0 | 9689.647 |
| Total Cost ($/day) | 258,251.6 | Total Cost ($/day) | 257,914.1 | |||||||||||||||
| Unit | dBA | EBA [26] | BA | PSO | GA |
|---|---|---|---|---|---|
| 1 | 404.0243 | 404.0251 | 403.8001 | 500 | 402.7638 |
| 2 | 199.5995 | 199.5997 | 199.7978 | 200 | 186.9464 |
| 3 | 260.0438 | 279.4662 | 224.1185 | 229.4894 | 279.9828 |
| 4 | 149.7328 | 149.7331 | 148.2026 | 150 | 99.8815 |
| 5 | 149.7333 | 180.1760 | 198.3771 | 133.5109 | 188.7443 |
| 6 | 99.8664 | 50 | 88.70405 | 50 | 104.681 |
| PGTOTAL (MW) | 1263 | 1263 | 1263 | 1263 | 1263 |
| Cost ($/h) | 15,448.9331 | 15,453.8841 | 15,498.9328 | 15,524.9449 | 15,563.0527 |
| Unit | dBA | BA | PSO | GA |
|---|---|---|---|---|
| 1 | 404.0152 | 402.1131 | 500 | 499.9096 |
| 2 | 124.3873 | 125.9102 | 126.6186 | 147.8697 |
| 3 | 229.5998 | 280.6446 | 229.5035 | 229.9327 |
| 4 | 149.2019 | 149.4743 | 50 | 101.3156 |
| 5 | 198.8925 | 197.6381 | 200 | 149.7285 |
| 6 | 99.6837 | 50 | 99.6575 | 77.02417 |
| Wind | 17.85 | 17.85 | 17.85 | 17.85 |
| Solar PV | 39.37 | 39.37 | 39.37 | 39.37 |
| PGTOTAL (MW) | 1263 | 1263 | 1263 | 1263 |
| Cost ($/h) | 14,592.6446 | 14,632.51 | 14,698.722 | 14,944.389 |
| Generator | a ($/MW2) | b ($/MW) | c ($) | Pmin (MW) | Pmax (MW) |
|---|---|---|---|---|---|
| 1 | 0.2162 | 42.5118 | 4088.5375 | 23 | 92 |
| 2 | 0.4108 | 20.5021 | 4547.8075 | 23 | 92 |
| 3 | 0.0562 | 32.9483 | 4601.9649 | 47.25 | 189 |
| 4 | 0.1266 | 22.2655 | 4316.1074 | 47.25 | 189 |
| 5 | 0.6210 | 50.6244 | 3707.7500 | 10.25 | 41 |
| 6 | 0.1255 | 69.7050 | 3459.6950 | 10.25 | 41 |
| 7 | 3.6454 | 370.6642 | 9045.7750 | 23 | 95 |
| 8 | 0.3981 | 31.9013 | 1124.9075 | 23 | 95 |
| 9 | 2.3185 | 484.7006 | 8549.5500 | 23 | 95 |
| 10 | 0.1142 | 31.8112 | 4486.6174 | 41.25 | 165 |
| Generator | dBA | BA | GA | PSO [51] | MIW-PSO [51] |
|---|---|---|---|---|---|
| 1 | 35.84 | 23 | 42.469 | 38.63 | 36.34 |
| 2 | 44.47 | 52.51 | 54.964 | 38.94 | 46.58 |
| 3 | 189 | 185.97 | 69.765 | 178 | 189 |
| 4 | 138.40 | 150.56 | 73.755 | 142.20 | 139.16 |
| 5 | 10.25 | 10.25 | 32.788 | 13.43 | 11.06 |
| 6 | 10.25 | 10.25 | 37.772 | 13.42 | 10.25 |
| 7 | 23 | 23 | 23.009 | 29 | 23 |
| 8 | 31.62 | 23 | 93.591 | 26.84 | 29.90 |
| 9 | 23 | 23 | 23.032 | 29 | 23 |
| 10 | 110.17 | 114.47 | 164.854 | 106.54 | 107.71 |
| PGTOTAL (MW) | 616 | 616 | 616 | 616 | 616 |
| Cost ($/h) | 95,633.00 | 95,745.54 | 100,207.15 | 95,840.57 | 95,835.53 |
Publisher’s Note: MDPI stays neutral with regard to jurisdictional claims in published maps and institutional affiliations. |
© 2020 by the authors. Licensee MDPI, Basel, Switzerland. This article is an open access article distributed under the terms and conditions of the Creative Commons Attribution (CC BY) license (http://creativecommons.org/licenses/by/4.0/).
Share and Cite
Tariq, F.; Alelyani, S.; Abbas, G.; Qahmash, A.; Hussain, M.R. Solving Renewables-Integrated Economic Load Dispatch Problem by Variant of Metaheuristic Bat-Inspired Algorithm. Energies 2020, 13, 6225. https://doi.org/10.3390/en13236225
Tariq F, Alelyani S, Abbas G, Qahmash A, Hussain MR. Solving Renewables-Integrated Economic Load Dispatch Problem by Variant of Metaheuristic Bat-Inspired Algorithm. Energies. 2020; 13(23):6225. https://doi.org/10.3390/en13236225
Chicago/Turabian StyleTariq, Faisal, Salem Alelyani, Ghulam Abbas, Ayman Qahmash, and Mohammad Rashid Hussain. 2020. "Solving Renewables-Integrated Economic Load Dispatch Problem by Variant of Metaheuristic Bat-Inspired Algorithm" Energies 13, no. 23: 6225. https://doi.org/10.3390/en13236225
APA StyleTariq, F., Alelyani, S., Abbas, G., Qahmash, A., & Hussain, M. R. (2020). Solving Renewables-Integrated Economic Load Dispatch Problem by Variant of Metaheuristic Bat-Inspired Algorithm. Energies, 13(23), 6225. https://doi.org/10.3390/en13236225


