Estimation of Battery Separator Area, Cell Thickness and Diffusion Coefficient Based on Non-Ideal Liquid-Phase Diffusion Modeling


Abstract
1. Introduction
1.1. Experimental Investigations
- direct measurements that basically require the cell to be dismantled and special cell preparations include scanning electron microscopy (SEM), X-ray diffraction (XRD), transmission electron microscopy (TEM), X-ray photoelectron spectroscopy (XPS), nuclear magnetic resonance spectroscopy (NMR) [16], etc.
- indirect measurements sometimes addressed as dynamic methods include electrochemical impedance spectroscopy (EIS), the potentiostatic intermittent titration technique (PITT), the galvanostatic intermittent titration technique (GITT), galvanometry, potentiometry, chronoamperometry, etc.
1.2. Modeling and Parameter Identification
2. Materials and Methods
3. Methodology
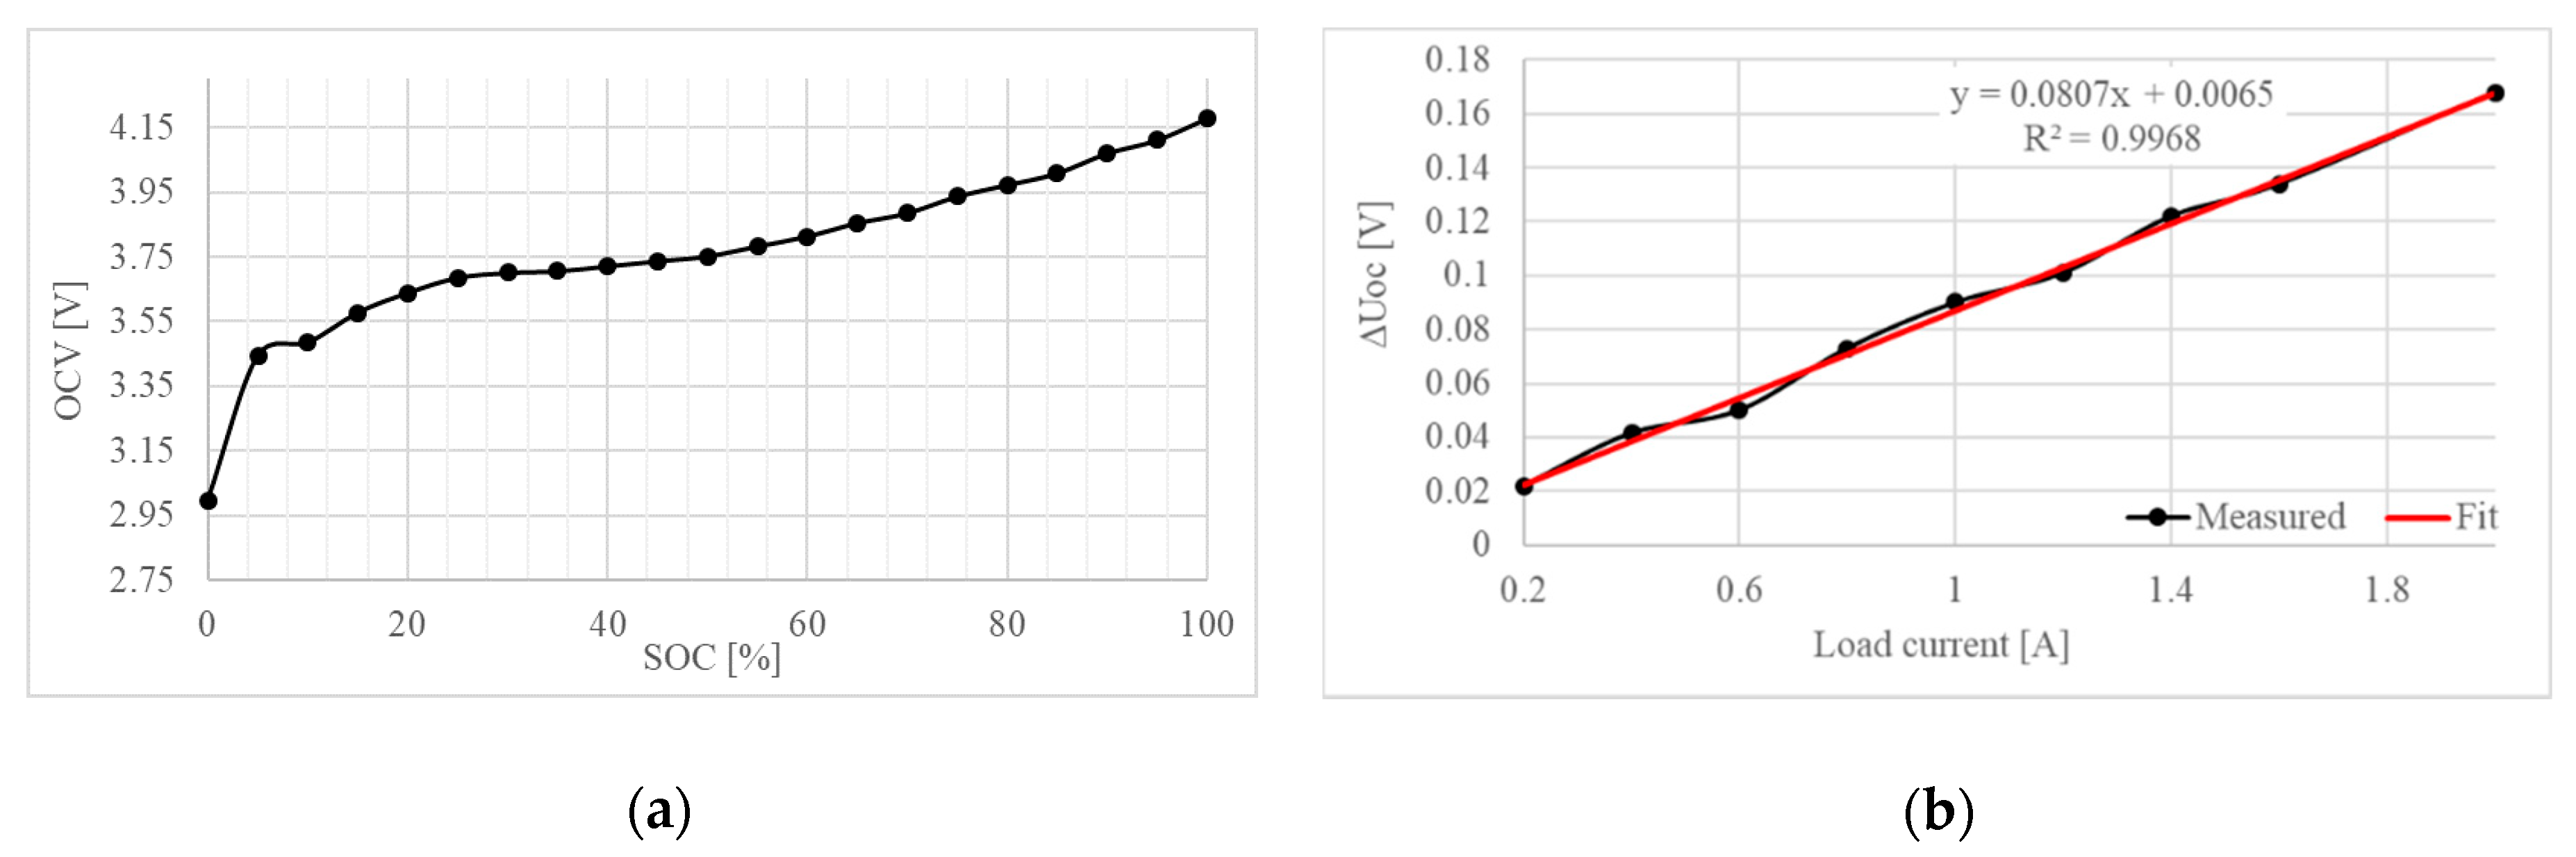
3.1. Characteristic Cell Model
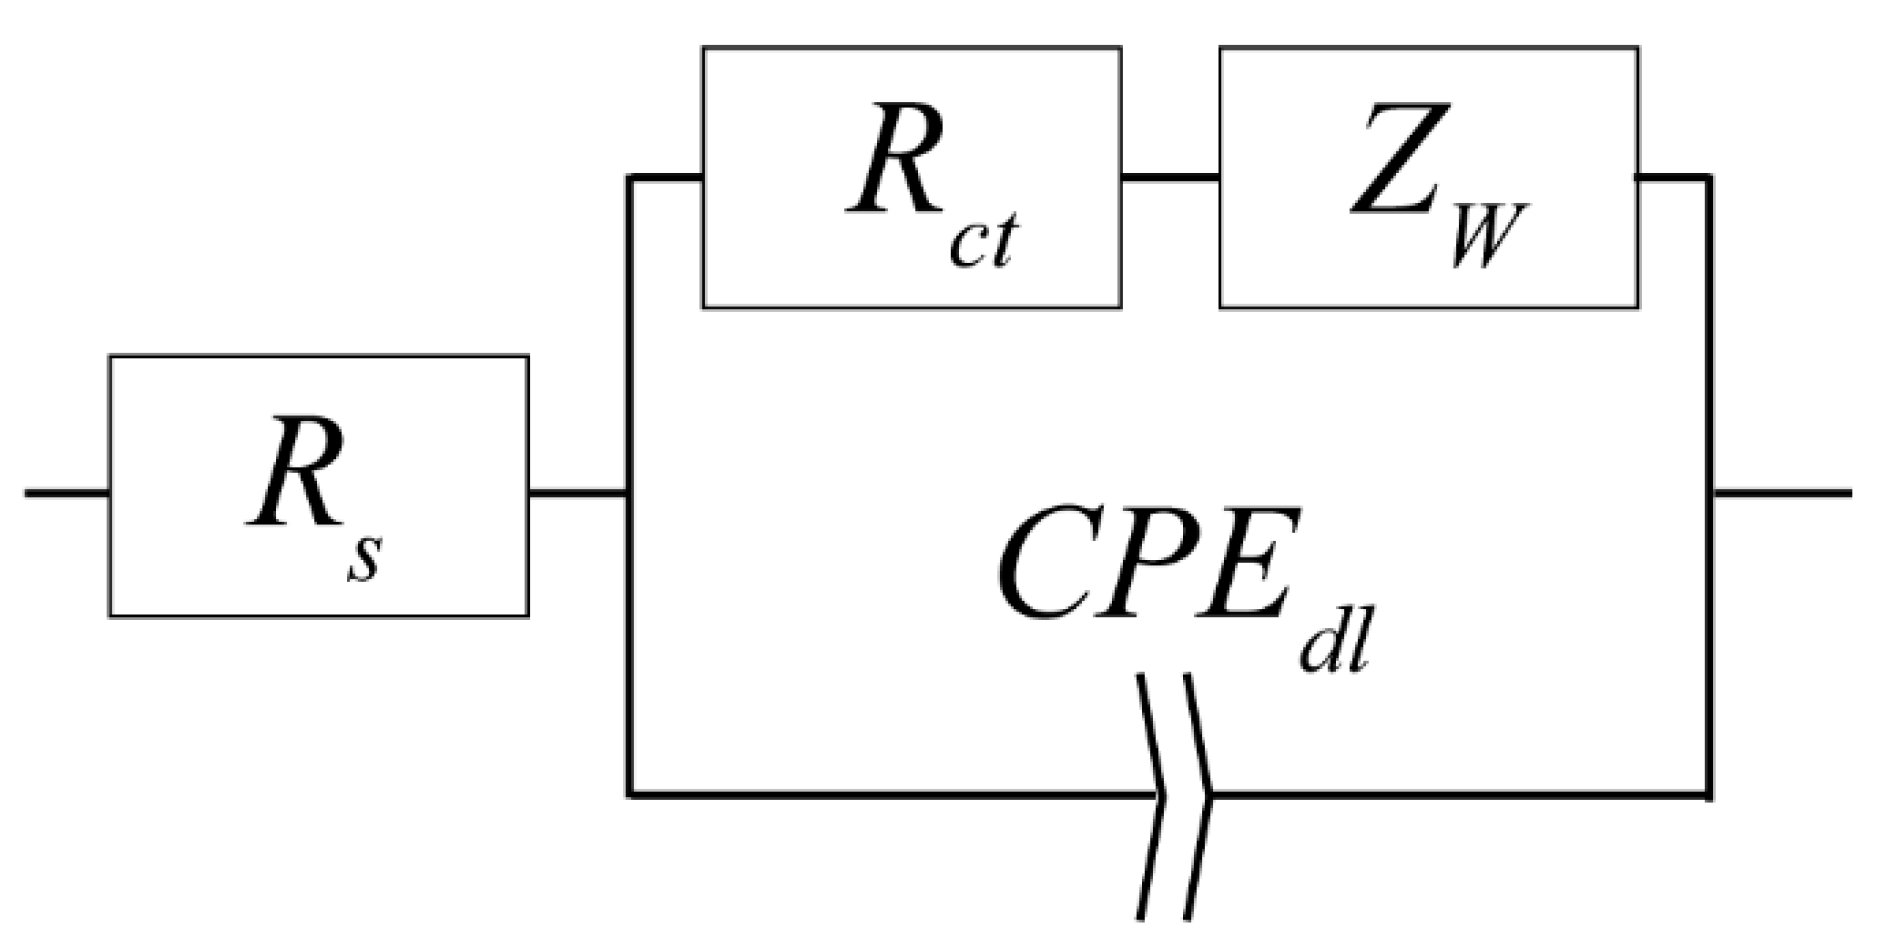
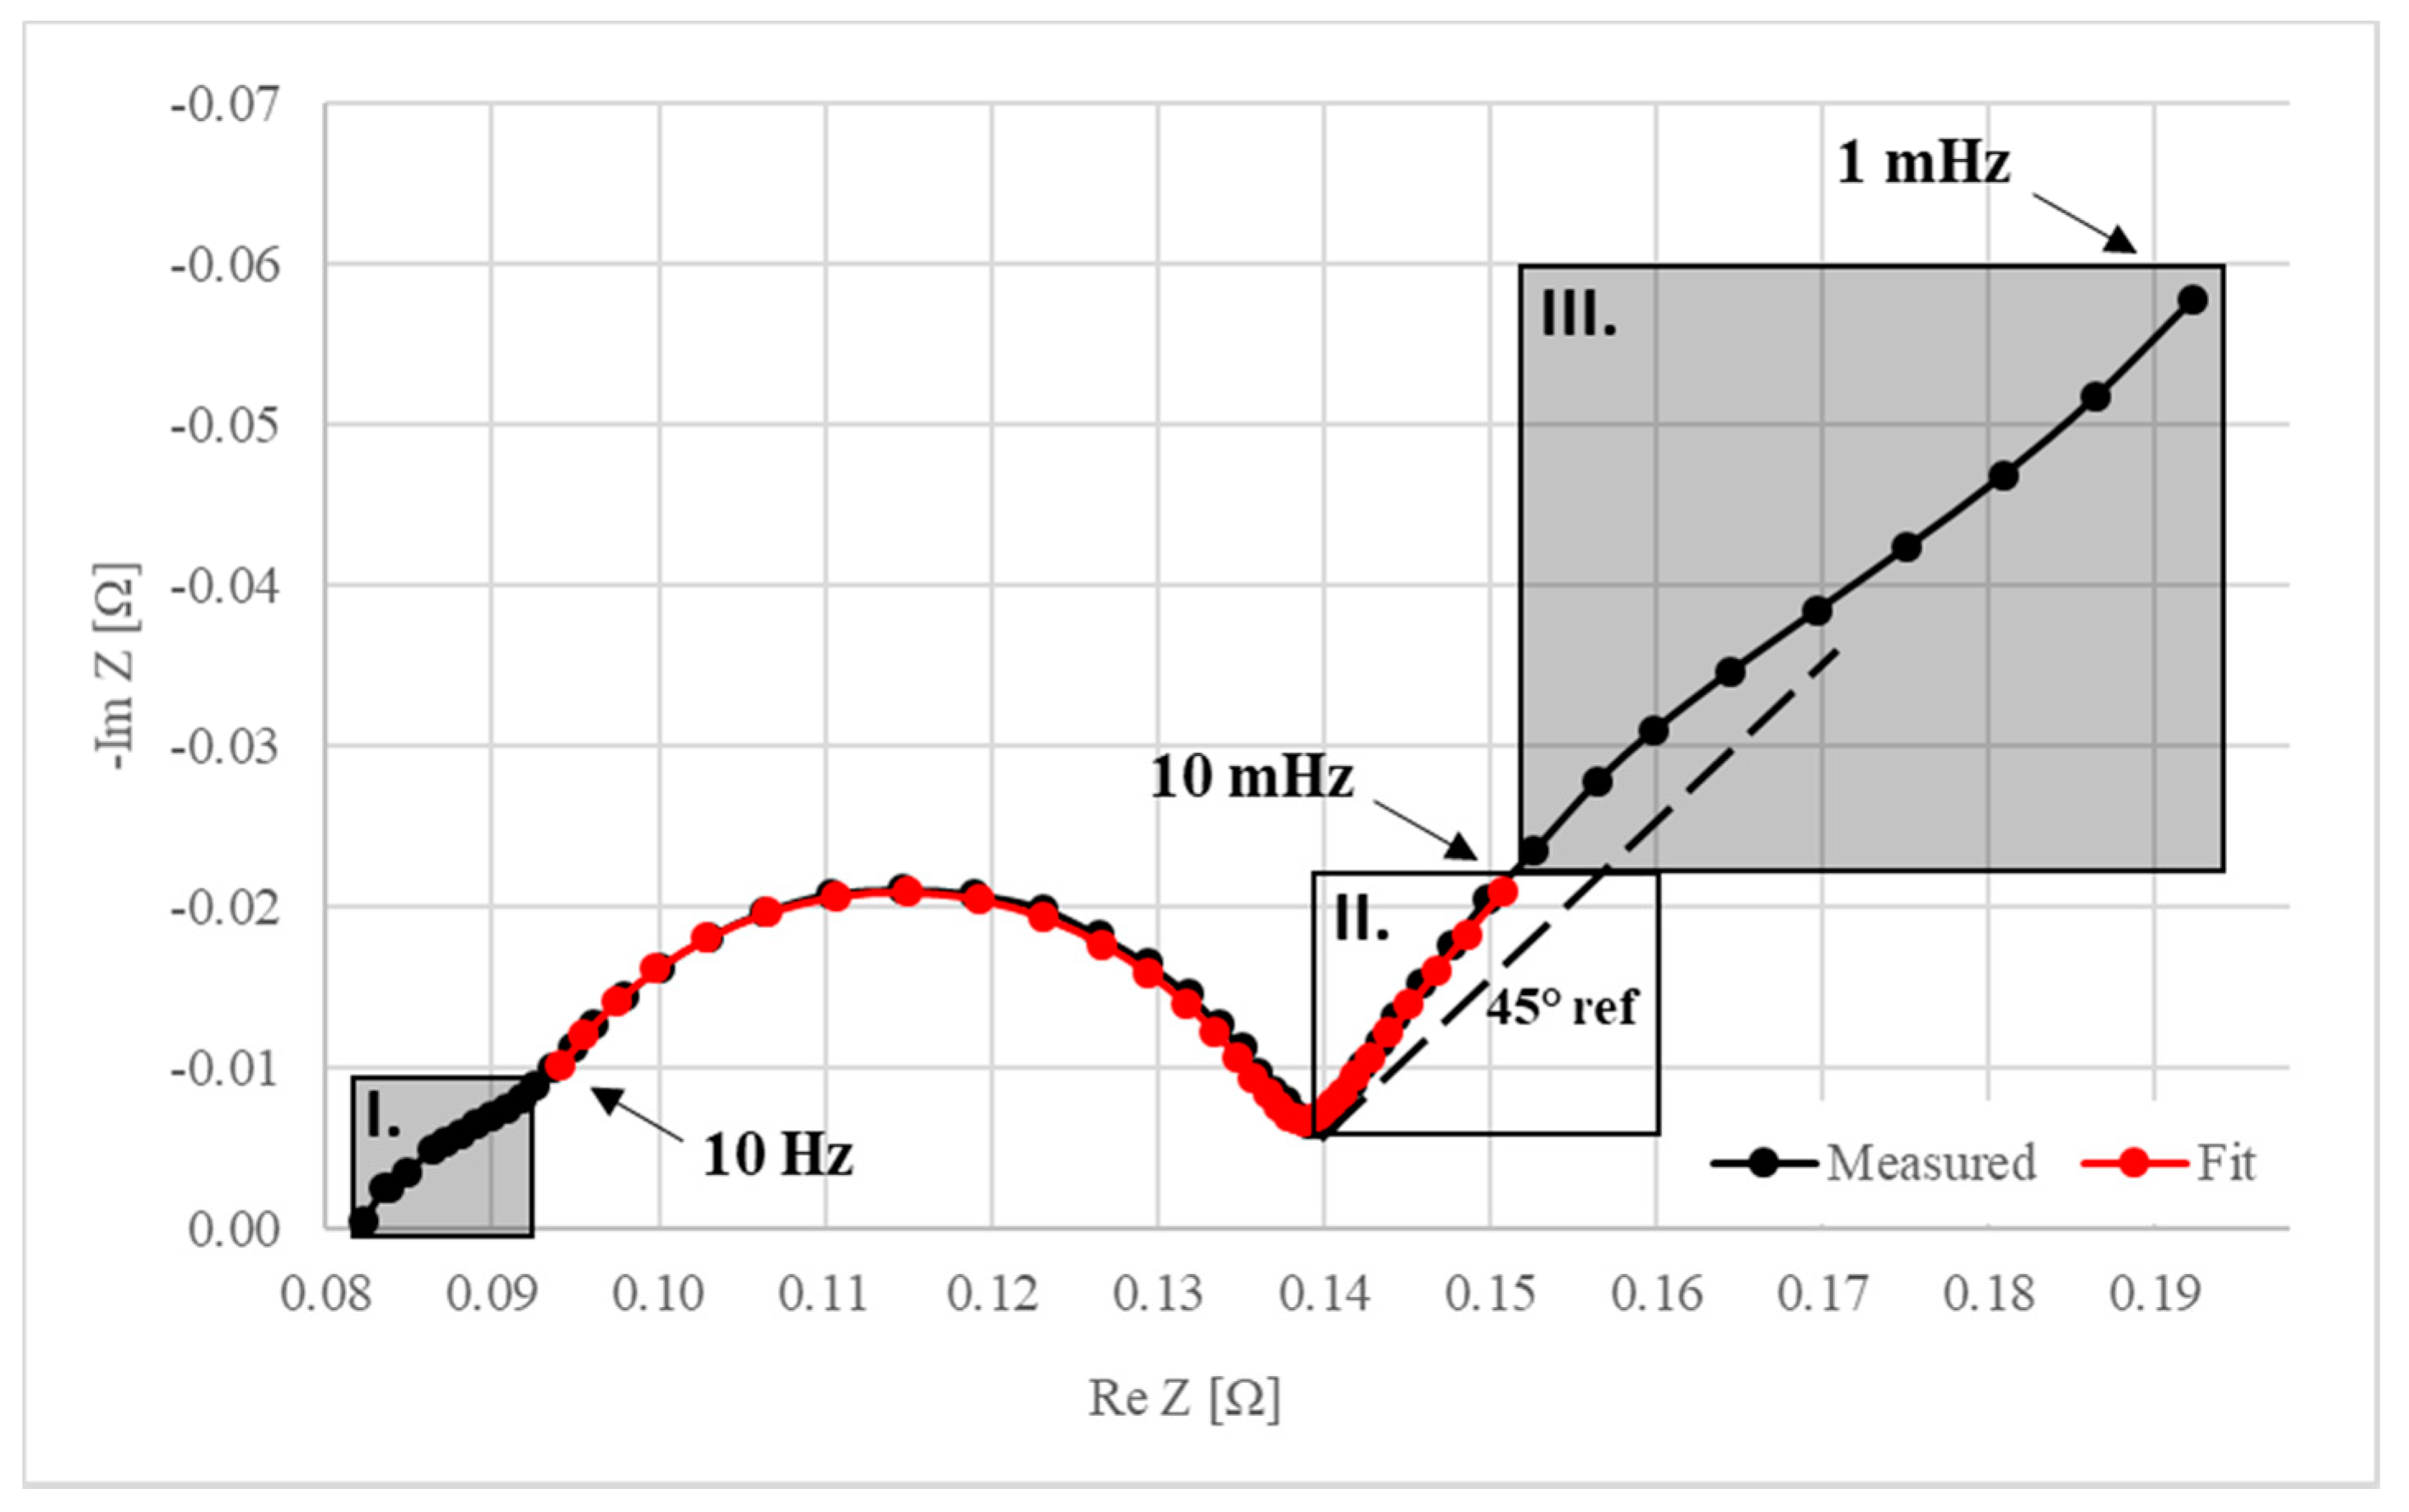
3.2. Extended Randles Equivalent Circuit Model
4. Results
5. Discussion
6. Conclusions
Author Contributions
Funding
Acknowledgments
Conflicts of Interest
Abbreviations
| Parameter Name | Symbol | Unit |
| Nominal capacity | Q | As |
| Molar mass of Li-ion | MLi | g/mole |
| Utilizable amount of Li-ion in the given electrode | - | |
| Cell load current | A | |
| Maximum Li concentration in cathode | ccat,max | mole/m3 |
| Maximum Li concentration in anode | can,max | mole/m3 |
| Li concentration at the electrode surface | csurf | mole/m3 |
| Initial salt concentration in the solution | mole/m3 | |
| Amount of electrons participating | z | - |
| Volume fraction of liquid phase in the separator | - | |
| Volume fraction of liquid phase in the cathode | - | |
| Volume fraction of liquid phase in the anode | - | |
| Volume fraction of active material in the cathode | - | |
| Volume fraction of active material in the anode | - | |
| Particle radius in the cathode | ||
| Particle radius in the anode | ||
| Bruggeman-coefficient | - | |
| Electrolyte conductivity | S/m | |
| Effective electrolyte conductivity | S/m | |
| Transference number | - | |
| Absolute temperature | T | K |
| Universal gas constant | R | |
| Faraday-constant | F | |
| Electromotive force | ||
| Electric potential | ||
| Initial electric potential | ||
| Li diffusion coefficient in the electrolyte | ||
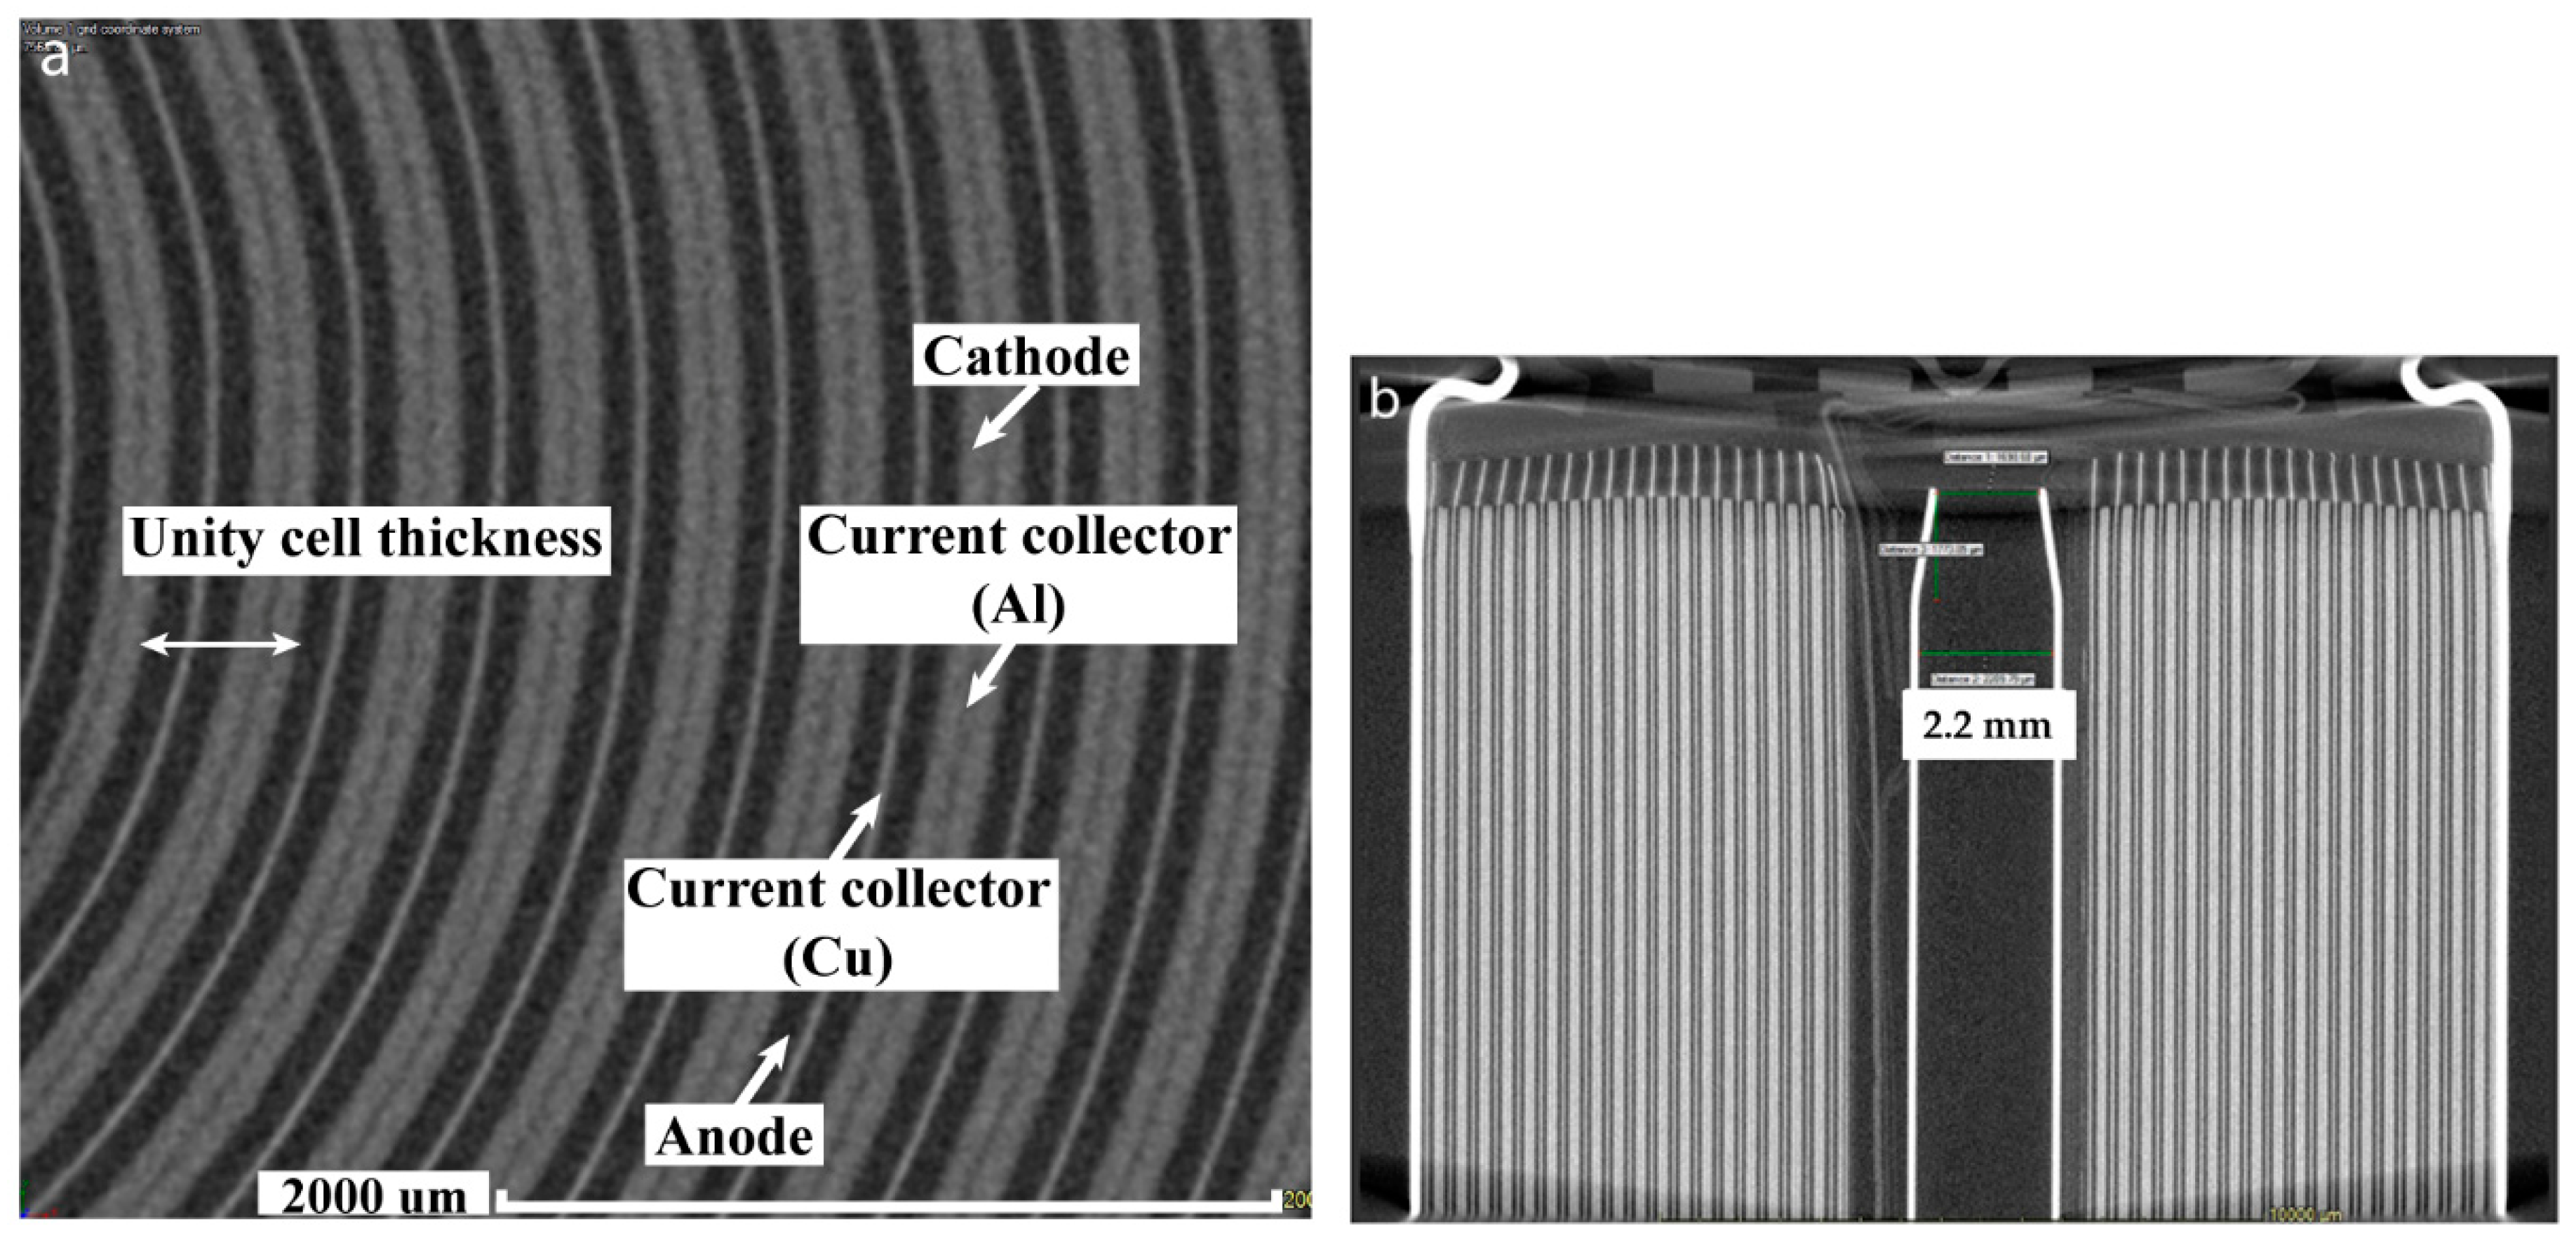
| Unity cell thickness | ||
| Solid-phase diffusion coefficient of Li | ||
| Solid phase concentration | ||
| Effective diffusion coefficient | ||
| Effective thickness | ||
| Separator area | ||
| Exchange current density | ||
| Amount of Li | mole | |
| Cathodic reaction rate constant | ||
| Anodic reaction rate constant | ||
| Cathode active surface area | ||
| Anode active surface area | ||
| Cathode thickness | Lcat | |
| Anode thickness | Lan | |
| Separator thickness | Lsep | |
| Diffusion coefficient inside the electrode | ||
| Volume of the solid matrix in the given electrode | ||
| Volume of liquid in the given electrode | ||
| Total volume of the given electrode | ||
| Specific surface area of the given electrode | a | 1/m |
| Unwrapped length of the electrodes | ||
| Number of turns of jelly-roll | N | - |
| Inner diameter of the battery can | d | mm |
| Height of the electrodes | h | |
| Layer thickness of a unity cell sandwich | l | |
| Cell serial resistance | ||
| Charge transfer resistance | ||
| CPE to model double-layer effect | F | |
| Excitation angular frequency | ||
| Dispersion parameter | - | |
| Diffusion time constant of Warburg element | s | |
| Warburg diffusion impedance | ||
| Warburg-coefficient | Ωm2/s0.6868 | |
| Real part of Warburg-coefficient | Ωm2/s0.6868 | |
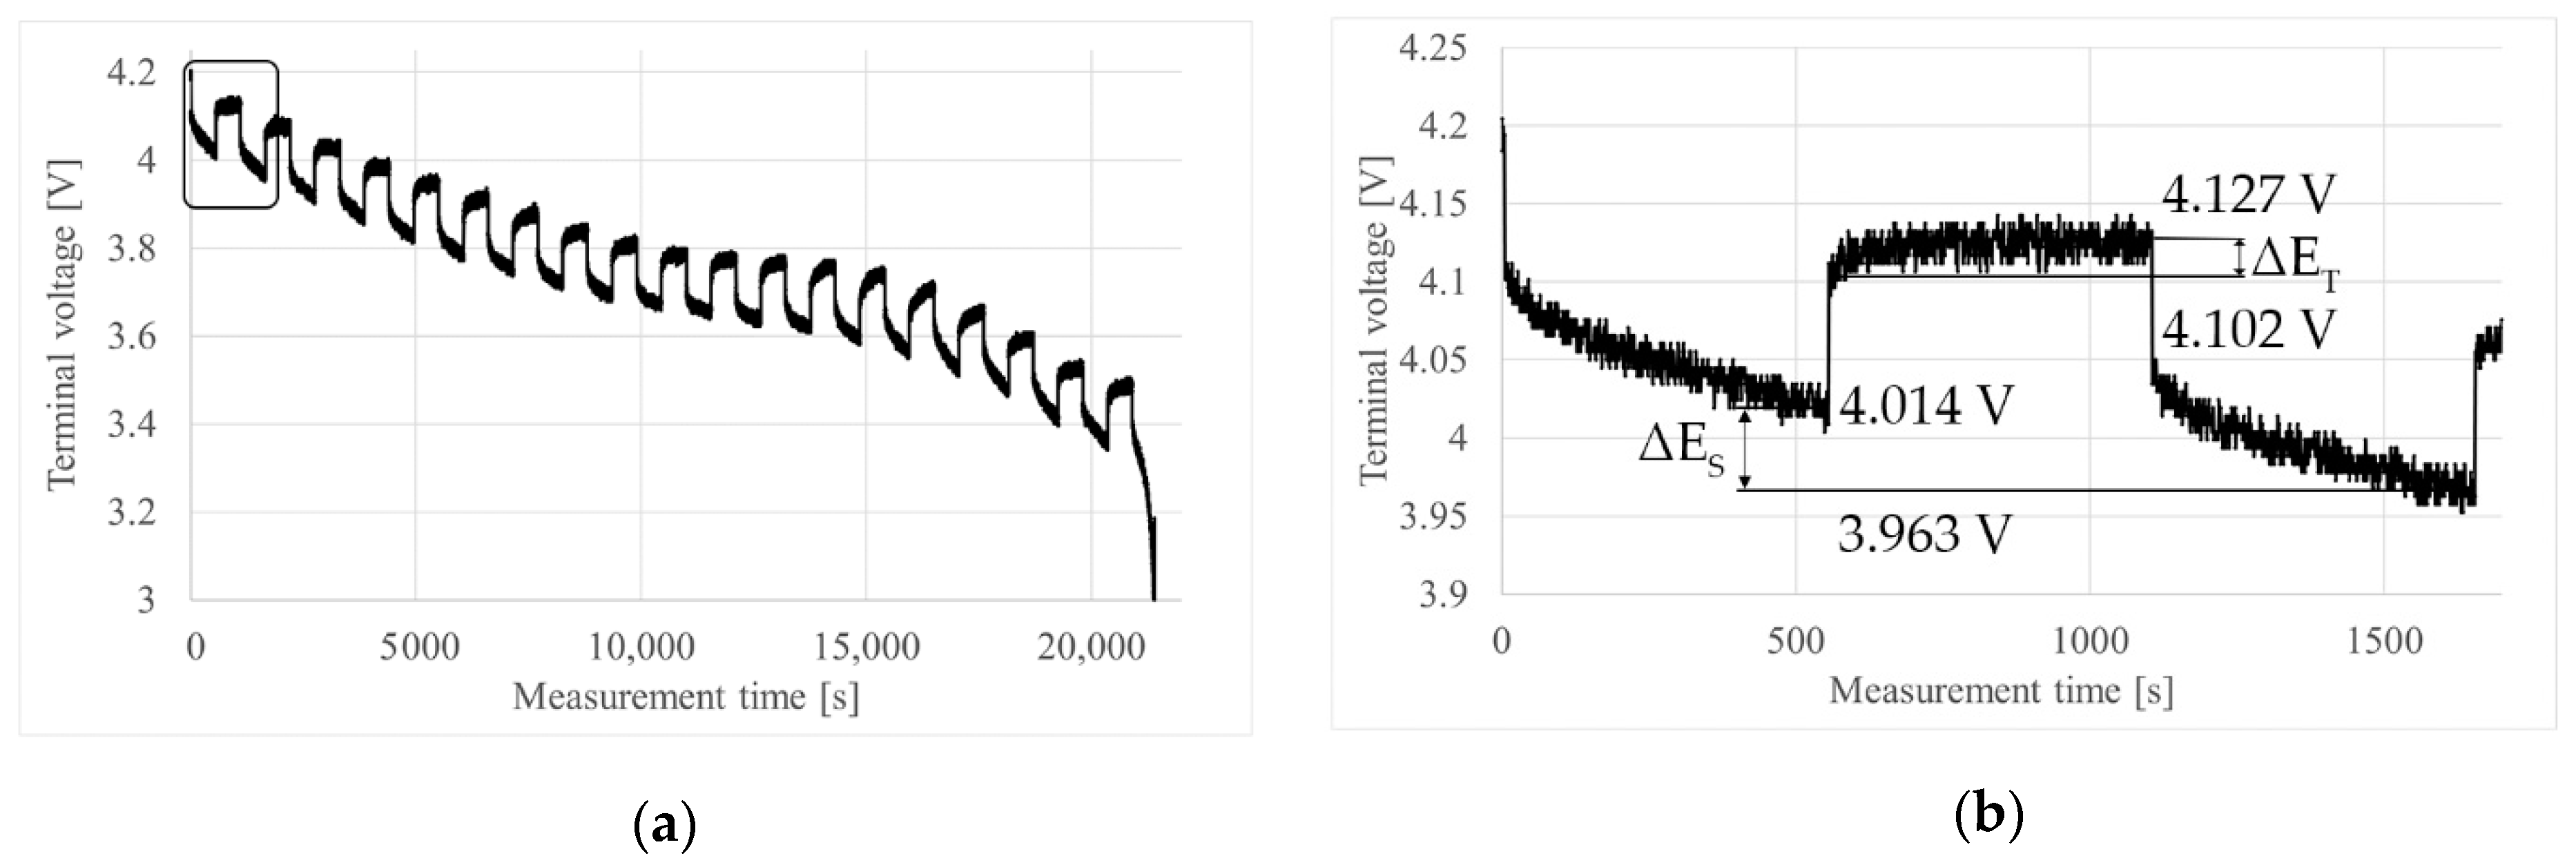
| Interruption time interval | s | |
| Relaxation voltage difference (in GITT) | ||
| Discharge voltage difference (in GITT) |
References
- Redondo-Iglesias, E.; Venet, P.; Pelissier, S. Efficiency Degradation Model of Lithium-Ion Batteries for Electric Vehicles. IEEE Trans. Ind. Appl. 2019, 55, 1932–1940. [Google Scholar] [CrossRef]
- Klass, V. Battery Health Estimation in Electric Vehicles; KTH Royal Institute of Technology: Stockholm, Sweden, 2015. [Google Scholar]
- Hoffmann, L.; Grathwol, J.K.; Haselrieder, W.; Leithoff, R.; Jansen, T.; Dilger, K.; Dröder, K.; Kwade, A.; Kurrat, M. Capacity Distribution of Large Lithium-Ion Battery Pouch Cells in Context with Pilot Production Processes. Energy Technol. 2020, 8, 8. [Google Scholar] [CrossRef]
- Doyle, M.; Newman, J.; Gozdz, A.S.; Schmutz, C.N.; Tarascon, J.M. Comparison of modeling predictions with experimental data from plastic lithium ion cells. J. Electrochem. Soc. 1996, 143, 1890–1903. [Google Scholar] [CrossRef]
- Ekström, H.; Lindbergh, G. A model for predicting capacity fade due to SEI formation in a commercial graphite/LiFePO4 cell. J. Electrochem. Soc. 2015, 162, A1003–A1007. [Google Scholar] [CrossRef]
- Ramadass, P.; Haran, B.; White, R.; Popov, B.N. Mathematical modeling of the capacity fade of Li-ion cells. J. Power Sources 2003, 123, 230–240. [Google Scholar] [CrossRef]
- Ramadass, P.; Haran, B.; Gomadam, P.M.; White, R.; Popov, B.N. Development of First Principles Capacity Fade Model for Li-Ion Cells. J. Electrochem. Soc. 2004, 151, 196–203. [Google Scholar] [CrossRef]
- Safari, M.; Morcrette, M.; Teyssot, A.; Delacourt, C. Multimodal physics-based aging model for life prediction of Li-Ion batteries. J. Electrochem. Soc. 2009, 156. [Google Scholar] [CrossRef]
- Ning, G.; White, R.E.; Popov, B.N. A generalized cycle life model of rechargeable Li-ion batteries. Electrochim. Acta 2006, 51, 2012–2022. [Google Scholar] [CrossRef]
- Warner, J. The Handbook of Li-ion Battery Pack Design (Chemistry, Components, Types, Terminology); Elsevier: Amsterdam, The Netherlands, 2015; ISBN 9780128014561. [Google Scholar]
- Fink, C.; Kaltenegger, B. Electrothermal and Electrochemical Modeling of Lithium-ion Batteries: 3D Simulation with Experimental Validation. ECS Trans. 2014, 61, 105–124. [Google Scholar] [CrossRef]
- Jin, N.; Danilov, D.L.; Van den Hof, P.M.J.; Donkers, M.C.F. Parameter estimation of an electrochemistry-based lithium-ion battery model using a two-step procedure and a parameter sensitivity analysis. Int. J. Energy Res. 2018, 42, 2417–2430. [Google Scholar] [CrossRef]
- Krewer, U.; Röder, F.; Harinath, E.; Braatz, R.D.; Bedürftig, B.; Findeisen, R. Review—Dynamic models of Li-Ion batteries for diagnosis and operation: A review and perspective. J. Electrochem. Soc. 2018, 165, A3656–A3673. [Google Scholar] [CrossRef]
- Trembacki, B.L.; Vadakkepatt, A.; Roberts, S.A.; Murthy, J.Y. Volume-averaged electrochemical performance modeling of 3D interpenetrating battery electrode architectures. J. Electrochem. Soc. 2020, 167. [Google Scholar] [CrossRef]
- Lin, C.; Tang, A.; Wang, W. A Review of SOH Estimation Methods in Lithium-ion Batteries for Electric Vehicle Applications. Energy Procedia 2015, 75, 1920–1925. [Google Scholar] [CrossRef]
- Wu, J.; Fenech, M.; Webster, R.I.; Tilley, R.; Sharma, N. Electron microscopy and its role in advanced lithium-ion battery research. Sustain. Energy Fuels 2019, 3, 1623–1646. [Google Scholar] [CrossRef]
- Pietsch, P.; Wood, V. X-Ray Tomography for Lithium Ion Battery Research: A Practical Guide. Annu. Rev. Mater. Res. 2017, 47, 451–479. [Google Scholar] [CrossRef]
- Matadi, B.P.; Geniès, S.; Delaille, A.; Chabrol, C.; De Vito, E.; Bardet, M.; Martin, J.F.; Daniel, L.; Bultel, Y. Irreversible capacity loss of Li-ion batteries cycled at low temperature due to an untypical layer hindering Li diffusion into graphite electrode. J. Electrochem. Soc. 2017, 164, A2374–A2389. [Google Scholar] [CrossRef]
- Simari, C.; Lufrano, E.; Coppola, L.; Nicotera, I. Composite gel polymer electrolytes based on organo-modified nanoclays: Investigation on lithium-ion transport and mechanical properties. Membranes 2018, 8, 69. [Google Scholar] [CrossRef]
- Pecher, O.; Carretero-Gonzalez, J.; Griffith, K.J.; Grey, C.P. Materials’ methods: NMR in battery research. Chem. Mater. 2017, 29, 213–242. [Google Scholar] [CrossRef]
- Ramadesigan, V.; Chen, K.; Burns, N.A.; Boovaragavan, V.; Braatz, R.D.; Subramanian, V.R. Parameter estimation and capacity fade analysis of lithium-ion batteries using reformulated models. J. Electrochem. Soc. 2011, 158, 1048–1054. [Google Scholar] [CrossRef]
- Chen, L.; Xu, R.; Rao, W.; Li, H.; Wang, Y.P.; Yang, T.; Jiang, H. Bin Electrochemical model parameter identification of lithium-ion battery with temperature and current dependence. Int. J. Electrochem. Sci. 2019, 14, 4124–4143. [Google Scholar] [CrossRef]
- Muenzel, V.; Hollenkamp, A.F.; Bhatt, A.I.; De Hoog, J.; Brazil, M.; Thomas, D.A.; Mareels, I. A comparative testing study of commercial 18650-format lithium-ion battery cells. J. Electrochem. Soc. 2015, 162, A1592–A1600. [Google Scholar] [CrossRef]
- Zhang, L.; Wang, L.; Lyu, C.; Li, J.; Zheng, J. Non-destructive analysis of degradation mechanisms in cycle-aged graphite/LiCoO2 batteries. Energies 2014, 7, 6282–6305. [Google Scholar] [CrossRef]
- Murbach, M.D.; Schwartz, D.T. Analysis of li-ion battery electrochemical impedance spectroscopy data: An easy-to-implement approach for physics-based parameter estimation using an open-source tool. J. Electrochem. Soc. 2018, 165, A297–A304. [Google Scholar] [CrossRef]
- Pizarro-Carmona, V.; Cortés-Carmona, M.; Palma-Behnke, R.; Calderón-Muñoz, W.; Orchard, M.E.; Estévez, P.A. An optimized impedance model for the estimation of the state-of-charge of a Li-ion cell: The case of a LiFePO 4 (ANR26650). Energies 2019, 12, 681. [Google Scholar] [CrossRef]
- Meyers, J.P.; Doyle, M.; Darling, R.M.; Newman, J. Impedance response of a porous electrode composed of intercalation particles. J. Electrochem. Soc. 2000, 147, 2930–2940. [Google Scholar] [CrossRef]
- Santhanagopalan, S.; Guo, Q.; White, R.E. Parameter estimation and model discrimination for a lithium-ion cell. J. Electrochem. Soc. 2007, 154, 198–206. [Google Scholar] [CrossRef]
- Li, S.E.; Wang, B.; Peng, H.; Hu, X. An electrochemistry-based impedance model for lithium-ion batteries. J. Power Sources 2014, 258, 9–18. [Google Scholar] [CrossRef]
- Qu, D. The study of the proton diffusion process in the porous MnO2 electrode. Electrochim. Acta 2004, 49, 657–665. [Google Scholar] [CrossRef]
- Birkl, C.R.; Howey, D.A. Model identification and parameter estimation for LiFePO4 batteries. IET Conf. Publ. 2013, 2013, 1–6. [Google Scholar]
- Nguyen, T.Q.; Breitkopf, C. Determination of diffusion coefficients using impedance spectroscopy data. J. Electrochem. Soc. 2018, 165, E826–E831. [Google Scholar] [CrossRef]
- Jokar, A.; Rajabloo, B.; Désilets, M.; Lacroix, M. An inverse method for estimating the electrochemical parameters of lithium-ion batteries I. Methodology. J. Electrochem. Soc. 2016, 163, A2876–A2886. [Google Scholar] [CrossRef]
- Wang, L.; Zhao, J.; He, X.; Gao, J.; Li, J.; Wan, C.; Jiang, C. Electrochemical Impedance Spectroscopy (EIS) study of LiNi 1/3Co 1/3Mn 1/3O 2 for Li-ion batteries. Int. J. Electrochem. Sci. 2012, 7, 345–353. [Google Scholar]
- Ebner, M.; Wood, V. Tool for tortuosity estimation in lithium ion battery porous electrodes. J. Electrochem. Soc. 2015, 162, A3064–A3070. [Google Scholar] [CrossRef]
- Mastali, M.; Farkhondeh, M.; Farhad, S.; Fraser, R.A.; Fowler, M. Electrochemical modeling of commercial LiFePO4 and graphite electrodes: Kinetic and transport properties and their temperature dependence. J. Electrochem. Soc. 2016, 163, A2803–A2816. [Google Scholar] [CrossRef]
- Safari, M.; Delacourt, C. Modeling of a Commercial Graphite/LiFePO4 Cell. J. Electrochem. Soc. 2011, 158, A562–A571. [Google Scholar] [CrossRef]
- Cooper, S.J.; Bertei, A.; Finegan, D.P.; Brandon, N.P. Simulated impedance of diffusion in porous media. Electrochim. Acta 2017, 251, 681–689. [Google Scholar] [CrossRef]
- Sapoval, B.; Chazalviel, J.-N.; Peyrière, J. Electrical response of fractal and porous interfaces. Phys. Rev. A 1988, 38, 5867–5887. [Google Scholar] [CrossRef]
- Zou, C.; Zhang, L.; Hu, X.; Wang, Z.; Wik, T.; Pecht, M. A review of fractional-order techniques applied to lithium-ion batteries, lead-acid batteries, and supercapacitors. J. Power Sources 2018, 390, 286–296. [Google Scholar] [CrossRef]
- Song, J.; Bazant, M.Z. Effects of Nanoparticle Geometry and Size Distribution on Diffusion Impedance of Battery Electrodes. J. Electrochem. Soc. 2013, 160, A15–A24. [Google Scholar] [CrossRef]
- Levi, M.D.; Aurbach, D. Impedance of a single intercalation particle and of non-homogeneous, multilayered porous composite electrodes for Li-ion batteries. J. Phys. Chem. B 2004, 108, 11693–11703. [Google Scholar] [CrossRef]
- Baker, D.R.; Verbrugge, M.W. Intercalate Diffusion in Multiphase Electrode Materials and Application to Lithiated Graphite. J. Electrochem. Soc. 2012, 159, A1341–A1350. [Google Scholar] [CrossRef]
- Guo, Q.; Subramanian, V.R.; Weidner, J.W.; White, R.E. Estimation of Diffusion Coefficient of Lithium in Carbon Using AC Impedance Technique. J. Electrochem. Soc. 2002, 149, A307–A318. [Google Scholar] [CrossRef][Green Version]
- Cabañero, M.A.; Boaretto, N.; Röder, M.; Müller, J.; Kallo, J.; Latz, A. Direct Determination of Diffusion Coefficients in Commercial Li-Ion Batteries. J. Electrochem. Soc. 2018, 165, A847–A855. [Google Scholar] [CrossRef]
- Dong, T.K.; Kirchev, A.; Mattera, F.; Kowal, J.; Bultel, Y. Dynamic Modeling of Li-Ion Batteries Using an Equivalent Electrical Circuit. J. Electrochem. Soc. 2011, 158, A326. [Google Scholar] [CrossRef]
- Huang, J. Diffusion impedance of electroactive materials, electrolytic solutions and porous electrodes: Warburg impedance and beyond. Electrochim. Acta 2018, 281, 170–188. [Google Scholar] [CrossRef]
- Guha, A.; Patra, A. Online Estimation of the Electrochemical Impedance Spectrum and Remaining Useful Life of Lithium-Ion Batteries. IEEE Trans. Instrum. Meas. 2018, 67, 1836–1849. [Google Scholar] [CrossRef]
- Quanchao, Z.; Shoudong, X.; Xiangyun, Q.; Yongli, C.; Liang, F.; Shigang, S. Diagnosis of electrochemical impedance spectroscopy in lithium ion batteries. In Lithium Ion Batteries—New Developments; Belharouak, D.I., Ed.; InTech: London, UK, 2012; pp. 190–226. ISBN 978-953-51-0077-5. [Google Scholar]
- Scipioni, R.; Jørgensen, P.S.; Graves, C.; Hjelm, J.; Jensen, S.H. A Physically-Based Equivalent Circuit Model for the Impedance of a LiFePO 4 /Graphite 26650 Cylindrical Cell. J. Electrochem. Soc. 2017, 164, A2017–A2030. [Google Scholar] [CrossRef]
- Park, S.; Kato, D.; Gima, Z.; Klein, R.; Moura, S. Optimal Experimental Design for Parameterization of an Electrochemical Lithium-Ion Battery Model. J. Electrochem. Soc. 2018, 165, A1309–A1323. [Google Scholar] [CrossRef]
- Somerville, L.; Ferrari, S.; Lain, M.J.; McGordon, A.; Jennings, P.; Bhagat, R. An in-situ reference electrode insertion method for commercial 18650-type cells. Batteries 2018, 4, 18. [Google Scholar] [CrossRef]
- Carelli, S.; Quarti, M.; Yagci, M.C.; Bessler, W.G. Modeling and experimental validation of a high-power lithium-ion pouch cell with LCO/NCA blend cathode. J. Electrochem. Soc. 2019, 166, A2990–A3003. [Google Scholar] [CrossRef]
- Msesupplies NMC111 Datasheet. Available online: https://www.msesupplies.com/products/lithium-nickel-manganese-cobalt-oxide-linimncoo2-powder-ni-co-mn-1-1-1-500g-bag-lnmco-111-500?variant=7141062212 (accessed on 16 May 2020).
- Deimede, V.; Elmasides, C. Separators for Lithium-Ion Batteries: A Review on the Production Processes and Recent Developments. Energy Technol. 2015, 3, 453–468. [Google Scholar] [CrossRef]
- Tiedemann, W.; Newman, J. Maximum Effective Capacity in an Ohmically Limited Porous Electrode. J. Electrochem. Soc. 1975, 122, 1482–1485. [Google Scholar] [CrossRef]
- Aurbach, D.; Talyosef, Y.; Markovsky, B.; Markevich, E.; Zinigrad, E.; Asraf, L.; Gnanaraj, J.S.; Kim, H.J. Design of electrolyte solutions for Li and Li-ion batteries: A review. Electrochim. Acta 2004, 50, 247–254. [Google Scholar] [CrossRef]
- Valøen, L.O.; Reimers, J.N. Transport Properties of LiPF6-Based Li-Ion Battery Electrolytes. J. Electrochem. Soc. 2005, 152, A882. [Google Scholar] [CrossRef]
- Huang, J.; Ge, H.; Li, Z.; Zhang, J. An Agglomerate Model for the Impedance of Secondary Particle in Lithium-Ion Battery Electrode. J. Electrochem. Soc. 2014, 161, E3202–E3215. [Google Scholar] [CrossRef]
- Huang, J.; Li, Z.; Zhang, J.; Song, S.; Lou, Z.; Wu, N. An Analytical Three-Scale Impedance Model for Porous Electrode with Agglomerates in Lithium-Ion Batteries. J. Electrochem. Soc. 2015, 162, A585–A595. [Google Scholar] [CrossRef]
- Franceschetti, D.R.; Macdonald, J.R. Diffusion of neutral and charged species under small-signal a.c. conditions. J. Electroanal. Chem. 1979, 101, 307–316. [Google Scholar] [CrossRef]
- Lelidis, I.; Ross Macdonald, J.; Barbero, G. Poisson-Nernst-Planck model with Chang-Jaffe, diffusion, and ohmic boundary conditions. J. Phys. D Appl. Phys. 2016, 49, 25503. [Google Scholar] [CrossRef]
- Jacobsen, T.; West, K. Diffusion impedance in planar, cylindrical and spherical symmetry. Electrochim. Acta 1995, 40, 255–262. [Google Scholar] [CrossRef]
- Bisquert, J.; Garcia-Belmonte, G.; Bueno, P.; Longo, E.; Bulhões, L.O.S. Impedance of constant phase element (CPE)-blocked diffusion in film electrodes. J. Electroanal. Chem. 1998, 452, 229–234. [Google Scholar] [CrossRef]
- Wang, J.C. Realizations of Generalized Warburg Impedance with RC Ladder Networks and Transmission Lines. J. Electrochem. Soc. 1987, 134, 1915–1920. [Google Scholar] [CrossRef]
- Mark, E.; Orazem, B.T. Electrochemical Impedance Spectroscopy; John Wiley Sons Inc.: Hoboken, NJ, USA, 2008. [Google Scholar]
- Bard, A.J.; Faulkner, L.R. Electrochemical Methods—Fundamentals and Applications, 2nd ed.; John Wiley & Sons: Hoboken, NJ, USA, 2001; ISBN 0-471-04372-9. [Google Scholar]
- Ravikumar, B.; Mynam, M.; Rai, B. Effect of Salt Concentration on Properties of Lithium Ion Battery Electrolytes: A Molecular Dynamics Study. J. Phys. Chem. C 2018, 122, 8173–8181. [Google Scholar] [CrossRef]
- Lindberg, J.; Lundgren, H.; Behm, M.; Lindbergh, G. Benchmarking of electrolyte mass transport in next generation lithium batteries. J. Electrochem. Sci. Eng. 2017, 7, 213–221. [Google Scholar] [CrossRef]
- Newman, J.; Alyea, K.E.T. Electrochemical Systems, 3th ed.; John Wiley & Sons: Hoboken, NJ, USA, 2004; ISBN 0-471-47756-7. [Google Scholar]
- Weppner, W. Determination of the Kinetic Parameters of Mixed-Conducting Electrodes and Application to the System Li3Sb. J. Electrochem. Soc. 1977, 124, 1569. [Google Scholar] [CrossRef]
- Choi, W.; Shin, H.-C.; Kim, J.M.; Choi, J.-Y.; Yoon, W.-S. Modeling and Applications of Electrochemical Impedance Spectroscopy (EIS) for Lithium-ion Batteries. J. Electrochem. Sci. Technol. 2020, 11, 1–13. [Google Scholar] [CrossRef]
- Verma, A.; Smith, K.; Santhanagopalan, S.; Abraham, D.; Yao, K.P.; Mukherjee, P.P. Galvanostatic Intermittent Titration and Performance Based Analysis of LiNi 0.5 Co 0.2 Mn 0.3 O 2 Cathode. J. Electrochem. Soc. 2017, 164, A3380–A3392. [Google Scholar] [CrossRef]
- Fu, R.; Zhou, X.; Fan, H.; Blaisdell, D.; Jagadale, A.; Zhang, X.; Xiong, R. Comparison of lithium-ion anode materials using an experimentally verified physics-based electrochemical model. Energies 2017, 10, 2174. [Google Scholar] [CrossRef]
- Xu, M.; Wang, X. Electrode thickness correlated parameters estimation for a Li-ion NMC battery electrochemical model. ECS Trans. 2017, 77, 491–507. [Google Scholar] [CrossRef]
- Taslimi Taleghani, S.; Marcos, B.; Lantagne, G. Modeling and simulation of a commercial graphite–LiFePO4 cell in a full range of C-rates. J. Appl. Electrochem. 2018, 48, 1389–1400. [Google Scholar] [CrossRef]
- Lee, S.I.; Jung, U.H.; Kim, Y.S.; Kim, M.H.; Ahn, D.J.; Chun, H.S. A study of electrochemical kinetics of lithium ion in organic electrolytes. Korean J. Chem. Eng. 2002, 19, 638–644. [Google Scholar] [CrossRef]
- Tsai, P.C.; Wen, B.; Wolfman, M.; Choe, M.J.; Pan, M.S.; Su, L.; Thornton, K.; Cabana, J.; Chiang, Y.M. Single-particle measurements of electrochemical kinetics in NMC and NCA cathodes for Li-ion batteries. Energy Environ. Sci. 2018, 11, 860–871. [Google Scholar] [CrossRef]


| Parameter | Sign |
|---|---|
| Li diffusion coefficient in the electrolyte | |
| Unity cell thickness | |
| Cross-sectional area of the separator | |
| Exchange current density | |
| Reaction rate constant | |
| Diffusion coefficient of the solid electrode |
| Parameter | Value | Unit |
|---|---|---|
| Rs | 0.0764 | Ω |
| Rct | 0.0470 | Ω |
| 2.07 | F | |
| 0.8870 | − | |
| 0.6868 | − | |
| 359 | s | |
| 0.0014 | Ωm2/s0.6868 |
| Parameter | Value | Unit | Source |
|---|---|---|---|
| Q | 9360 | As | [54] |
| MLi | 6.941 | g/mole | [54] |
| 0.95 | − | [74] | |
| 0.99 | − | [74] | |
| ccat,max | 49,000 | mole/m3 | [75] |
| can,max | 31,507 | mole/m3 | [76] |
| 1000 | mole/m3 | [58] | |
| z | 1 | − | |
| 22.5 | [55] | ||
| 0.40 | − | [56] | |
| 0.35 | − | [53] | |
| 0.45 | − | ||
| 0.15 | − | ||
| 0.04 | − | ||
| 0.50 | − | ||
| 0.51 | − | ||
| 5 | |||
| 10 | |||
| 1.5 | − | ||
| 0.87 | S/m | ||
| 0.363 | − | [58] | |
| T | 295 | K | measured |
| 1.34 × 10⁻⁷ | Equation (8) | ||
| 1365 | Equation (12) | ||
| 0.08 | Equation (13) | ||
| 0.54 | Equation (14) | ||
| 0.097 | mole | Equation (15) | |
| 2.070 × 10⁻⁶ | Equation (16) | ||
| 3.095 × 10⁻⁶ | Equation (16) | ||
| 4.147 × 10⁻⁶ | Equation (17) | ||
| 6.282 × 10⁻⁶ | Equation (17) | ||
| 1.24 | Equation (18) | ||
| 0.47 | Equation (18) | ||
| Lcat/2 | 51.8 | Equation (19) | |
| Lan/2 | 78.5 | Equation (19) | |
| 4.594 × 10⁻¹¹ | Equation (20) | ||
| 1.890 × 10⁻¹⁰ | Equation (20) | ||
| 6.90 × 10⁻¹⁴ | Equation (21) | ||
| (by GITT) | 2.790 × 10⁻¹³ | Equation (21) |
| Parameter | Calculated | Measured by CT | Relative Error |
|---|---|---|---|
| (m2) | 0.08 | 0.068 | 18% |
| (µm) | 1365 | 1496 | 9% |
| (µm) | 51.8 | 80 | 35% |
| (µm) | 78.5 | 80 | 2% |
| (µm) | 22.5 (assumed) | 28 | 20% |
| (µm) | − | 40 | − |
| (µm) | − | 40 | − |
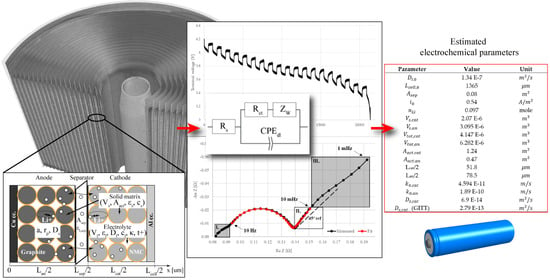
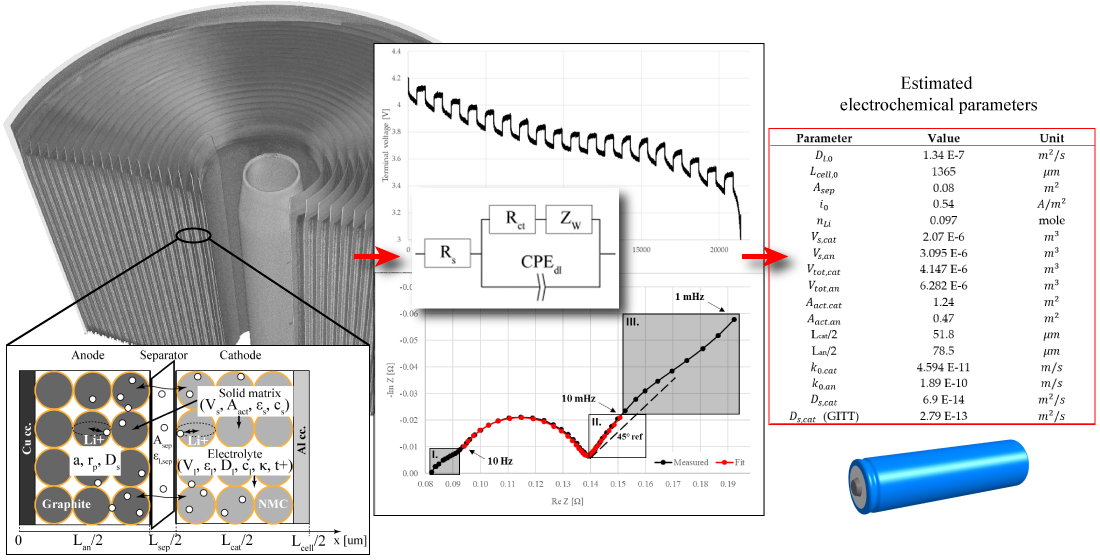
| Parameter | Value | Unit |
|---|---|---|
| 1.34 × 10⁻⁷ | ||
| 1365 | ||
| 0.08 | ||
| 0.54 | ||
| 0.097 | mole | |
| 2.07 × 10⁻⁶ | ||
| 3.095 × 10⁻⁶ | ||
| 4.147 × 10⁻⁶ | ||
| 6.282 × 10⁻⁶ | ||
| 1.24 | ||
| 0.47 | ||
| Lcat/2 | 51.8 | |
| Lan/2 | 78.5 | |
| 4.594 × 10⁻¹¹ | ||
| 1.89 × 10⁻¹⁰ | ||
| 6.9 × 10⁻¹⁴ | ||
| (GITT) | 2.79 × 10⁻¹³ |
Publisher’s Note: MDPI stays neutral with regard to jurisdictional claims in published maps and institutional affiliations. |
© 2020 by the authors. Licensee MDPI, Basel, Switzerland. This article is an open access article distributed under the terms and conditions of the Creative Commons Attribution (CC BY) license (http://creativecommons.org/licenses/by/4.0/).
Share and Cite
Csomós, B.; Fodor, D.; Vajda, I. Estimation of Battery Separator Area, Cell Thickness and Diffusion Coefficient Based on Non-Ideal Liquid-Phase Diffusion Modeling. Energies 2020, 13, 6238. https://doi.org/10.3390/en13236238
Csomós B, Fodor D, Vajda I. Estimation of Battery Separator Area, Cell Thickness and Diffusion Coefficient Based on Non-Ideal Liquid-Phase Diffusion Modeling. Energies. 2020; 13(23):6238. https://doi.org/10.3390/en13236238
Chicago/Turabian StyleCsomós, Bence, Dénes Fodor, and István Vajda. 2020. "Estimation of Battery Separator Area, Cell Thickness and Diffusion Coefficient Based on Non-Ideal Liquid-Phase Diffusion Modeling" Energies 13, no. 23: 6238. https://doi.org/10.3390/en13236238
APA StyleCsomós, B., Fodor, D., & Vajda, I. (2020). Estimation of Battery Separator Area, Cell Thickness and Diffusion Coefficient Based on Non-Ideal Liquid-Phase Diffusion Modeling. Energies, 13(23), 6238. https://doi.org/10.3390/en13236238