Article

Automatic Crack Segmentation for UAV-Assisted Bridge Inspection

by
Yonas Zewdu Ayele
1,*,
Mostafa Aliyari
1,
David Griffiths
2 and
Enrique Lopez Droguett
3
1
Faculty of Engineering, Østfold University College, 1671 Fredrikstad, Norway
2
Department of Civil, Environmental and Geomatic Engineering, Faculty of Engineering, University College London, London WC1E 6BT, UK
3
Department of Mechanical Engineering, Faculty of Physical and Mathematical Sciences, University of Chile, Santiago 850, Chile
*
Author to whom correspondence should be addressed.
Energies 2020, 13(23), 6250; https://doi.org/10.3390/en13236250
Submission received: 29 October 2020 / Revised: 16 November 2020 / Accepted: 23 November 2020 / Published: 27 November 2020
(This article belongs to the Special Issue Critical Infrastructure Resilience Assessment and Management)

Abstract

:
Bridges are a critical piece of infrastructure in the network of road and rail transport system. Many of the bridges in Norway (in Europe) are at the end of their lifespan, therefore regular inspection and maintenance are critical to ensure the safety of their operations. However, the traditional inspection procedures and resources required are so time consuming and costly that there exists a significant maintenance backlog. The central thrust of this paper is to demonstrate the significant benefits of adapting a Unmanned Aerial Vehicle (UAV)-assisted inspection to reduce the time and costs of bridge inspection and established the research needs associated with the processing of the (big) data produced by such autonomous technologies. In this regard, a methodology is proposed for analysing the bridge damage that comprises three key stages, (i) data collection and model training, where one performs experiments and trials to perfect drone flights for inspection using case study bridges to inform and provide necessary (big) data for the second key stage, (ii) 3D construction, where one built 3D models that offer a permanent record of element geometry for each bridge asset, which could be used for navigation and control purposes, (iii) damage identification and analysis, where deep learning-based data analytics and modelling are applied for processing and analysing UAV image data and to perform bridge damage performance assessment. The proposed methodology is exemplified via UAV-assisted inspection of Skodsberg bridge, a 140 m prestressed concrete bridge, in the Viken county in eastern Norway.

1. Introduction

In the past decade, Europe, North America and South America suffered more than 50 bridge collapses due to deterioration-related issues, such as fatigue fracture and aging of materials, which culminated in more than 150 fatalities and close to 20 billion USD in overall losses, during which more than a million people were affected. This deterioration process significantly increases due to aging and structural degradation, which can, over time, alter the structural performance and functionality of a bridge [1]. The other key issue that affects bridge performance is inefficient maintenance, which is usually aggravated by technical and economic limitations associated with inspections. The conventional bridge inspection procedures rely on physical site visits and the visual inspection for severe and observable damages, which are related to factors such as scouring, corrosion, fatigue and deterioration of materials [2]. However, it is demanding to detect most of these factors solely based on human vision, such as fracture or cracks in main beams without easy access from the surface, among others [3]. Furthermore, the interaction of these factors, their dependence on various variables, and their negative synergy effect on performance of the bridge, are hard to be detected and assessed by the conventional inspection procedures, see e.g., Okasha and Frangopol [4], Phares et al. [5], and Liu et al. [6]. This means that the current damage and fatigue detection procedures produce inspection and monitoring tools which are non-resilient and are not capable of coping with the ever-changing social and economic needs. This eventually leads to aesthetic, functional, or structural problems, or in the worst-case scenario, bridge failures.
The most recent bridge failure example in Europe is the catastrophic collapse of the Morandi Bridge, in the northwest Italian city of Genoa, in august 2018, with a death toll of 43 [7]. According to experts, the Morandi Bridge had been suffering from deterioration (degradation) and was under maintenance at the time of collapse. Furthermore, in the US, in the past decade, there were two deadly bridge collapses: Minneapolis I-35W bridge in 2007 and I-10 Bridge in July 2015 [8]. Moreover, the problem is also prominent in the South America. For instance, in Chile, in the past 15 years, there were two catastrophic collapses, Loncomilla Bridge in November 2004, and the Pitrufquén-Rio Tolten Railway Bridge in August 2016. The Rio Tolten railway bridge collapse resulted in catastrophic environmental damage after a freight train plunged into a river; the train had been carrying chemicals, which spilled into the water.
Typically, the consequences of catastrophic bridge collapses are twofold. Firstly, restrictions on the availability of these infrastructures may lead to intense traffic interferences on the surrounding road network resulting in negative effects on the road user, high economic follow-up costs, and negative environmental impacts [9]. For instance, the I-35W Mississippi River bridge collapse significantly impacted road-users and the Minnesota economy. The Minnesota Department of Transportation (Mn/DOT) [10] study concluded that road-user costs would total $400,000 per day due to the unavailability of the river crossing. In addition to the road user cost study, further analysis by the Mn/DOT estimate that the economic impact—or loss to Minnesota’s economy—at about $17 million in 2007 and $43 million in 2008. Secondly, the loss of lives due to catastrophic bridge collapses usually hurt the company’s public image, leading to unfavourable public opinion.
Unmanned Aerial Vehicles (UAV), commonly referred to as drones, technology has found its way into a number of civilian applications in the last 20 years, predominantly due to lower cost and tangible scientific improvements, see e.g., Zink and Lovelace [11], Duque et al. [12], Dorafshan et al. [13], and Gillins et al. [14]. In its application to structural bridge inspection, drones provide two main functions. The first, being the most common, detects damage through visual sensors. The 2D imagery data can be used to quickly establish a basic knowledge of the structure’s condition and is usually the first port of call. The second reconstructs 3D models to provide a permanent record of the geometry of each bridge asset, which could be used for navigation and control purposes. The addition of 3D capabilities to bridge management allows navigation through a complex structure, providing visual identification of the area of concern rather than solely relying on reference names or numbers.
In addition, a 3D model can be employed for detecting damages in any components of the bridge structures by integrating with damage detection and structural component recognition techniques. Furthermore, image or point-cloud-based 3D models are key enablers of autonomous bridge inspections. In general, the 3D models can either be constructed through passive sensor techniques such as image-based photogrammetry, or active sensor techniques such as laser scanning. Structure from Motion (SfM) and Multi-View Stereo (MVS) are vision-based techniques that can be used to generate point clouds of a structure, see e.g., [15,16]. Moreover, collecting images with UAV enables us to have georeferenced 3D model, thus calculating the dimensions and location of the damage would be less challenging, see e.g., Jung et al. [17]. Furthermore, equipping UAVs with a broad range of sensors and cameras (e.g., thermal, LiDAR (Light Detection and Ranging), and infrared cameras) is a great advantage that will pave the way toward autonomous navigation and inspections; see e.g., [18,19,20,21,22]. For instance, Scott et al. [23] have proposed a work based on fiber Bragg grating (FBG) sensors to monitor railway bridges and for damage detection in railways.
It is not so long since neural networks entered the field of damage (object) detection; and, it is gaining the momentum to be one of the key methods [24]. Object detection algorithms are evolved from simple image classification to multiple object detection and localization including Region Based Convolutional Neural Networks (R-CNN) [25], Fast R-CNN [26], Faster R-CNN [27], You only look once (YOLO) [28], SSD [29], and Mask R-CNN [30]. In addition, the Generative Adversarial Networks (GAN) are recently started to be used for object detection, see e.g., [31,32]. However, the lack of labelled data makes it difficult to generalize training models across a wide variety of structures like bridges. Therefore, these algorithms for the failure detection of civil infrastructures are limited to specific cases and there are no such rich image databases in the failure detection of civil infrastructures; see e.g., [33,34,35,36]. For instance, Mandal et al. [36] proposed an automated pavement distress analysis system based on the YOLO v2 deep learning framework.
Although enormous efforts have been done to secure efficiency in bridge inspection systems, see e.g., Huston et al. [37], Chen et al. [38], Seo et al. [39], Seo et al. [40], Ayele and Droguett [8], and Belcastro et al. [41], still there exist challenges in bridge inspection and maintenance. To tackle the problems and improve the existing bridge management practices, a new knowledge with proactive methods and tools is needed. In this connection, in this paper, UAV-assisted bridge inspection methodology is proposed for improving inspection accuracy and pinpointing defects (such as cracks in steel elements, fractures in concrete elements, etc.) early on. This eventually helps to monitor high risk bridge elements and reduce failure rates. The applicability of state-of-the-art deep learning techniques, such as Convolutional Neural Networks (CNN) for the automatic per-pixel segmentation of cracks on the structure surface, are assessed. Using post processing image analysis techniques such as OpenCV, Agisoft, SfM, Mask R-CNN, individual cracks are extracted and automatic per crack measurements including width, length, perimeter and area computations are performed.
The rest of the paper is organized as follows: Section 2 presents the proposed methodology for the inspection of bridges via the use of automated UAV image processing for damage detection and performance analysis. Section 3 depicts the case study that describes the investigative methods and results for UAV-assisted inspection of Skodsberg bridge, a 140 m prestressed concrete bridge, in the Viken county in eastern Norway. Section 4 provides a discussion of the results of the study. Concluding remarks and future work suggestions are depicted in Section 5.

2. Proposed Methodology

The proposed methodology is an integrated set of UAV-assisted inspection and automatic damage identification process. Figure 1 illustrates specific stages that are experimental, and a data driven modelling approach to deliver practical and economically viable UAV-assisted bridge inspection. The methodology comprises three key stages, (i) data collection and model training, where one performs experiments and trials to perfect drone flights for inspection using case study bridges to inform and provide necessary (big) data for the second key step, (ii) 3D photogrammetry/construction, where one built 3D models that offer a permanent record of geometry for each bridge asset, which could be used for navigation and control purposes, (iii) crack identification and segmentation, where deep learning-based data analytics and modelling are applied for processing and analysing drone image data and to perform damage assessment.

2.1. Stage 1: Data Collection and Model Training

The major task of this stage is to test, trial and perfect drone flights for the inspection of case study bridges that provides data for all the other steps. As such, a core requirement is the collection of multiple overlapping images of the bridge elements. This allows for the use of Structure from Motion (SfM), where both the exterior orientations of the cameras and the geometry of the bridge elements can be computed simultaneously. In practise, to achieve this during a drone flight, images should be taken at regular intervals to ensure consistent overlap with enough redundancy for the reliable measurement of the bridge elements’ geometry.
Thereafter, data labelling should be carried out. Labelling typically takes a set of unlabelled drone data and augments each piece of that unlabelled data with meaningful semantic tags. For instance, labels might indicate whether a drone photo contains a crack or not. In principle, in bridge inspections, cracks are one of the failure modes that should be labelled at high precision to train an automatic crack detection and segmentation model. Labelling can be done by using various methods depending on the purpose. For classification, a simple single label is given to the entire image (i.e., crack/no crack), and for detection each image contains bounding box coordinates for all objects in the image.
Afterwards, the size of the cracks can be estimated by creating bounding boxes. This can be achieved, for example, by developing an automated Python script from Portable Network Graphics (PNG) masks as well as tracing and extracting the contours and bounding box extents. Note that PNG is a raster-graphics file-format that supports lossless data compression.

2.2. Stage 2: 3D Construction—Photogrammetry

3D models offer a permanent record of geometry for each bridge asset, which could be used for navigation and control purposes. The addition of 3D capabilities to bridge management allows navigation through a complex structure, providing visual identification of the area of concern rather than solely relying on reference names or numbers. The key task of this stage is thus to compute an orthomosaic of the bridge elements geometry. Put simply, an orthomosaic is a mosaic of all images which have been orthorectified (i.e., perspective removed). In this regard, initial geometry reconstruction and camera position estimation should be carried outs by using various techniques, such as using Agisoft MetaShapes, see Agisoft LLC [42]. Agisoft Metashape is a stand-alone software product that performs photogrammetric processing of digital images and generates 3D spatial data to be used in various applications.
Once a course model of the bridge elements geometry has been calculated, dense image matching can be employed to compute a dense point cloud of the entire bridge element geometry. In this paper, we suggest that all images should be combined into a single composite image. The key purpose of dense point matching is capturing fine grained bridge elements geometry. The resolution is vital here; hence, one has to employ a high resolution such as up to sub pixel over multiple views. In addition, the accuracy heavily depends on bundle adjustment. Dense matching can be used as a refinement for measurement accuracy and does improve Digital Surface Model (DSM) quality and therefore the resulting orthomosiac. DSM represents the bridge surface and includes all elements and objects on it.
Orthorectification is our final product from Stage 2. Orthomosaic, as mentioned above, is a single continuous image of the whole bridge element geometry with no redundancy or perspective (i.e., every pixel orthogonal to the height plane). This has two benefits; firstly, we remove redundancy of overlapping images for an automatic crack segmentation model, which can lead to potential conflicts. Secondly, the orthomosaic uses the georeferenced 3D point cloud and is therefore georeferenced itself, which means that features located on the orthomosaic have meaningful geospatial coordinates. To compute an orthomosaic, a continuous height surface of the scene is required. As a point cloud consists of discrete observations, we first rasterize the dense point cloud by computing a DSM. This allows every pixel to sample a height value and compute the perspective displacement; for a more detailed example of a typical SfM methodology, see e.g., Westoby et al. [16].

2.3. Stage 3: Damage Identification Model

Once the bridge surface images along a predetermined trajectory are collected, raw images will be cropped. Then, damage regions such as cracks will be labelled on cropped images to create the damage (crack) dataset, and then in this stage, effective deep network convolution architectures, specifically with the geometry of crack segmentation in mind, should be designed for the automatic per-pixel segmentation of cracks. Thereafter, the deep convolution network can be trained, validated and tested using the crack dataset. In this connection, in the illustrative case study, we have developed a deep network convolution architecture and conducted a number of training experiments to fit the best convolution architectures for analyzing specific drone images and scenarios.

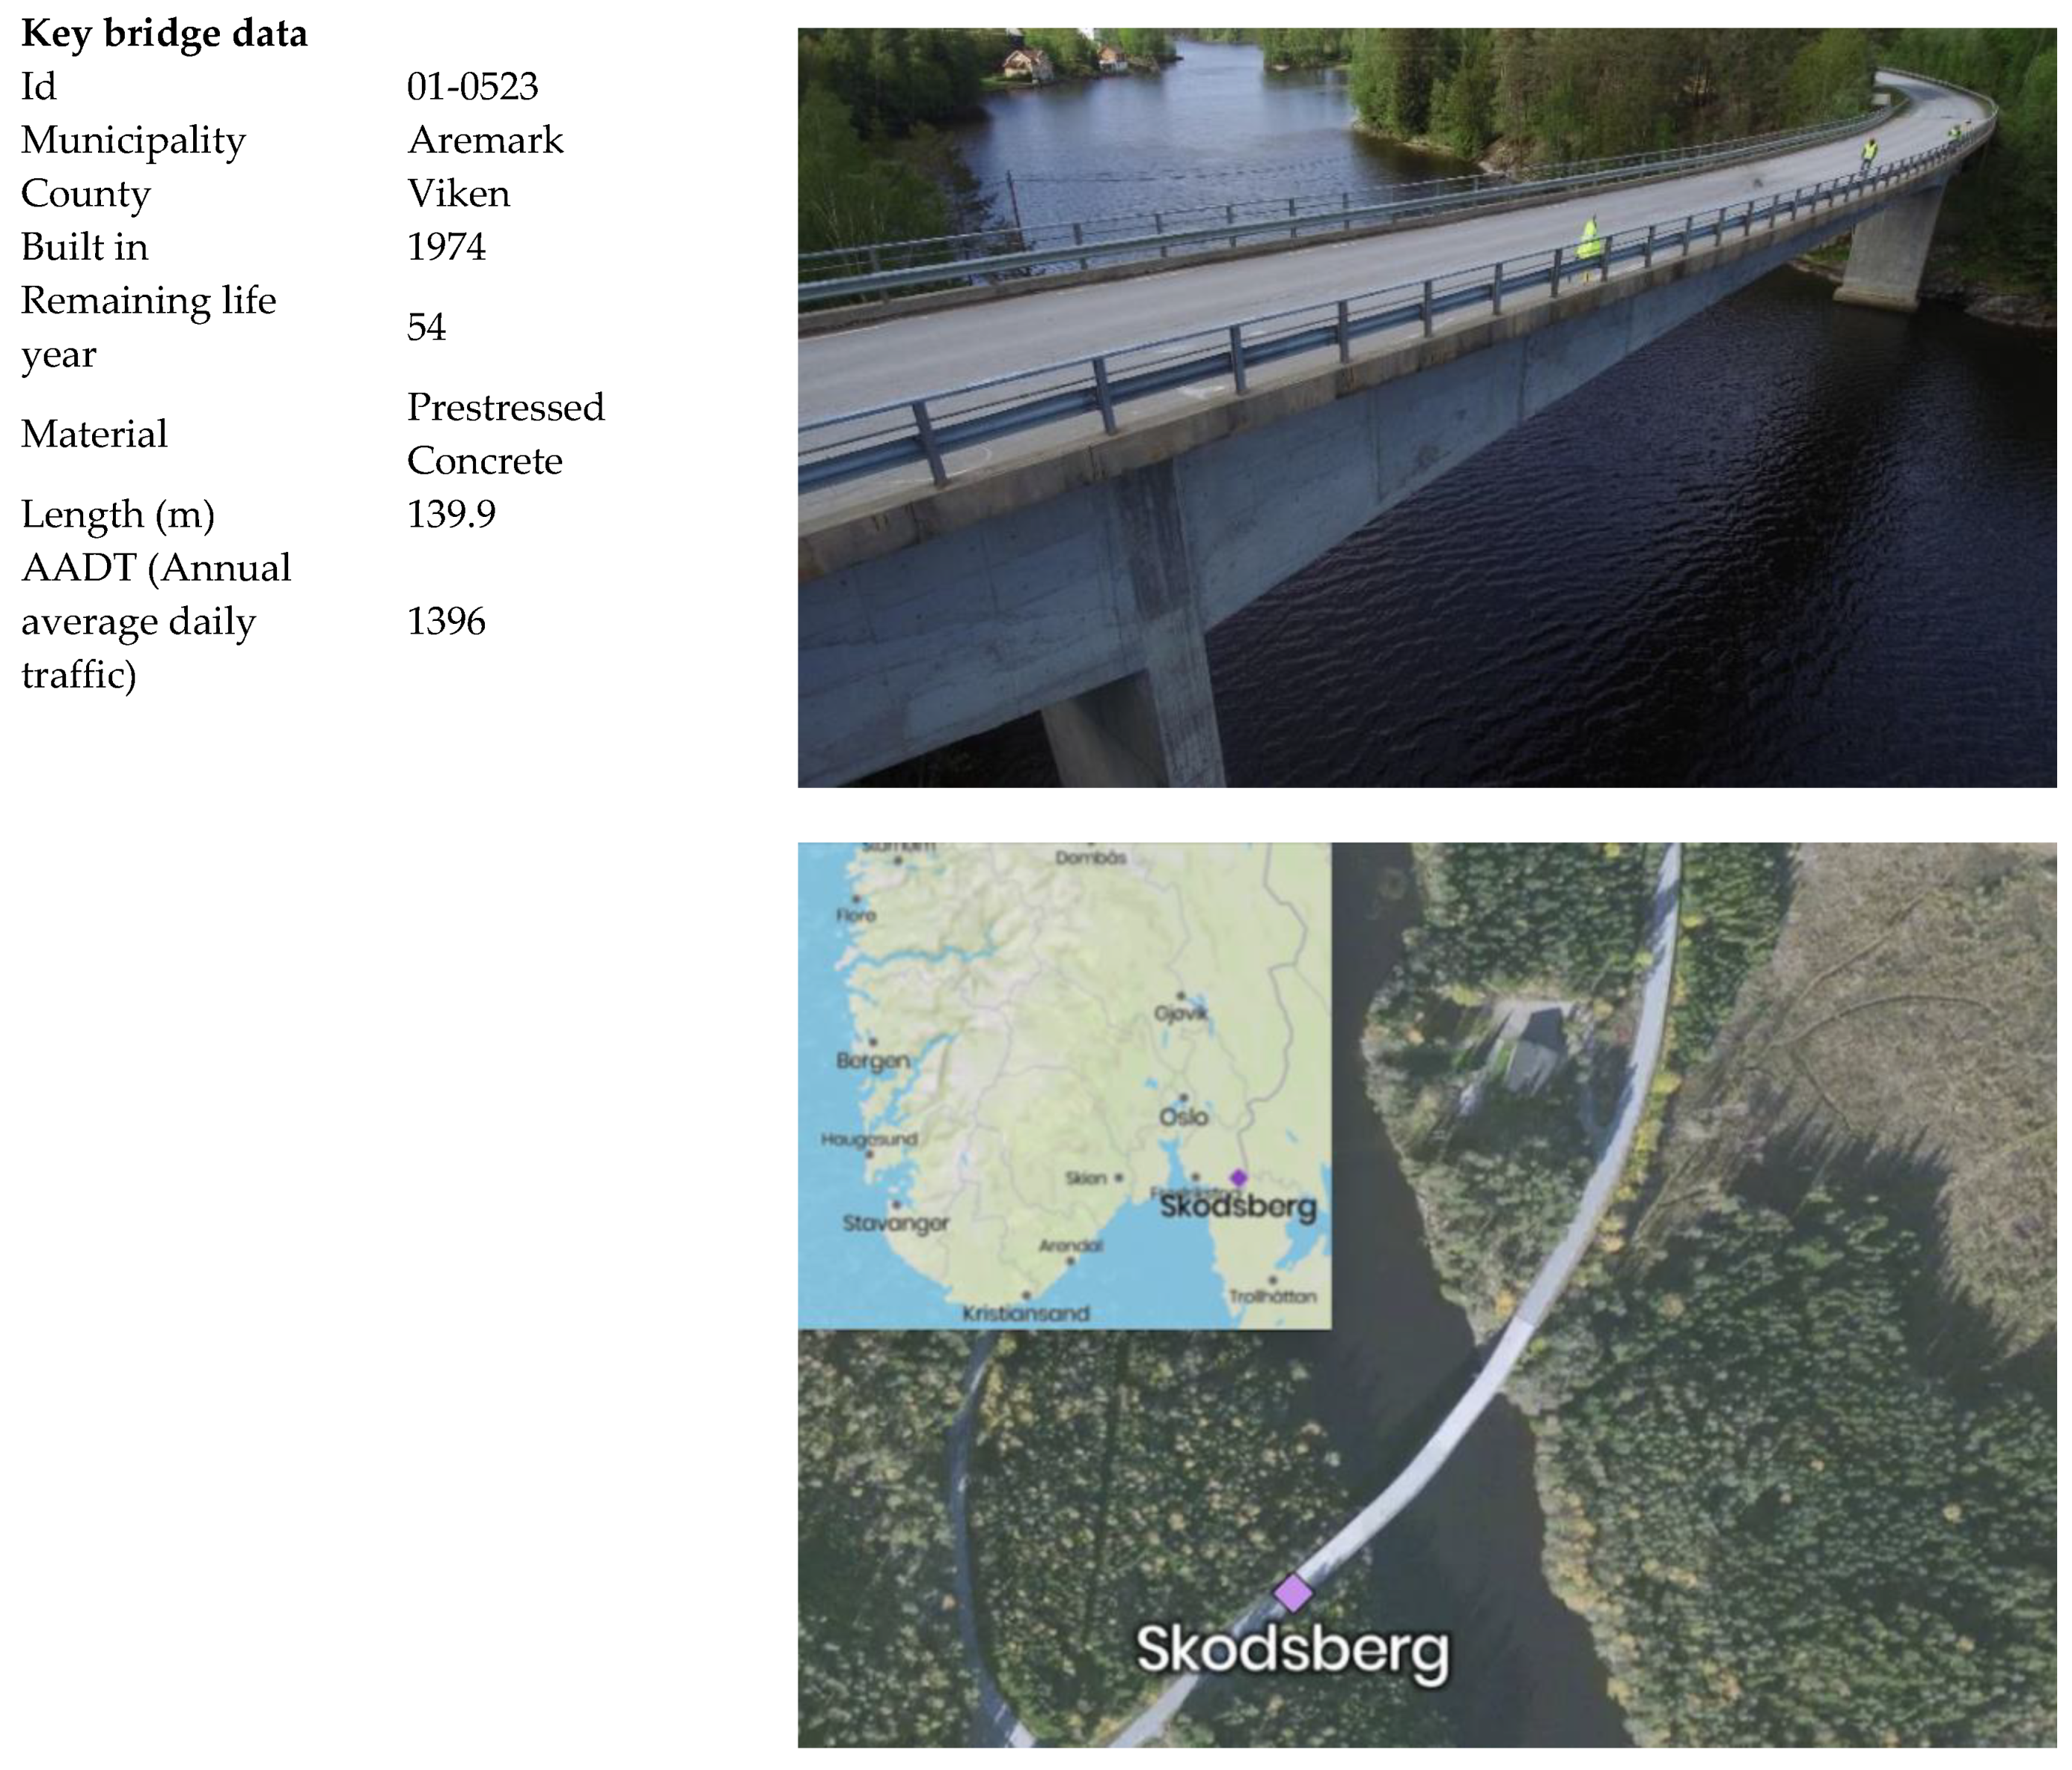
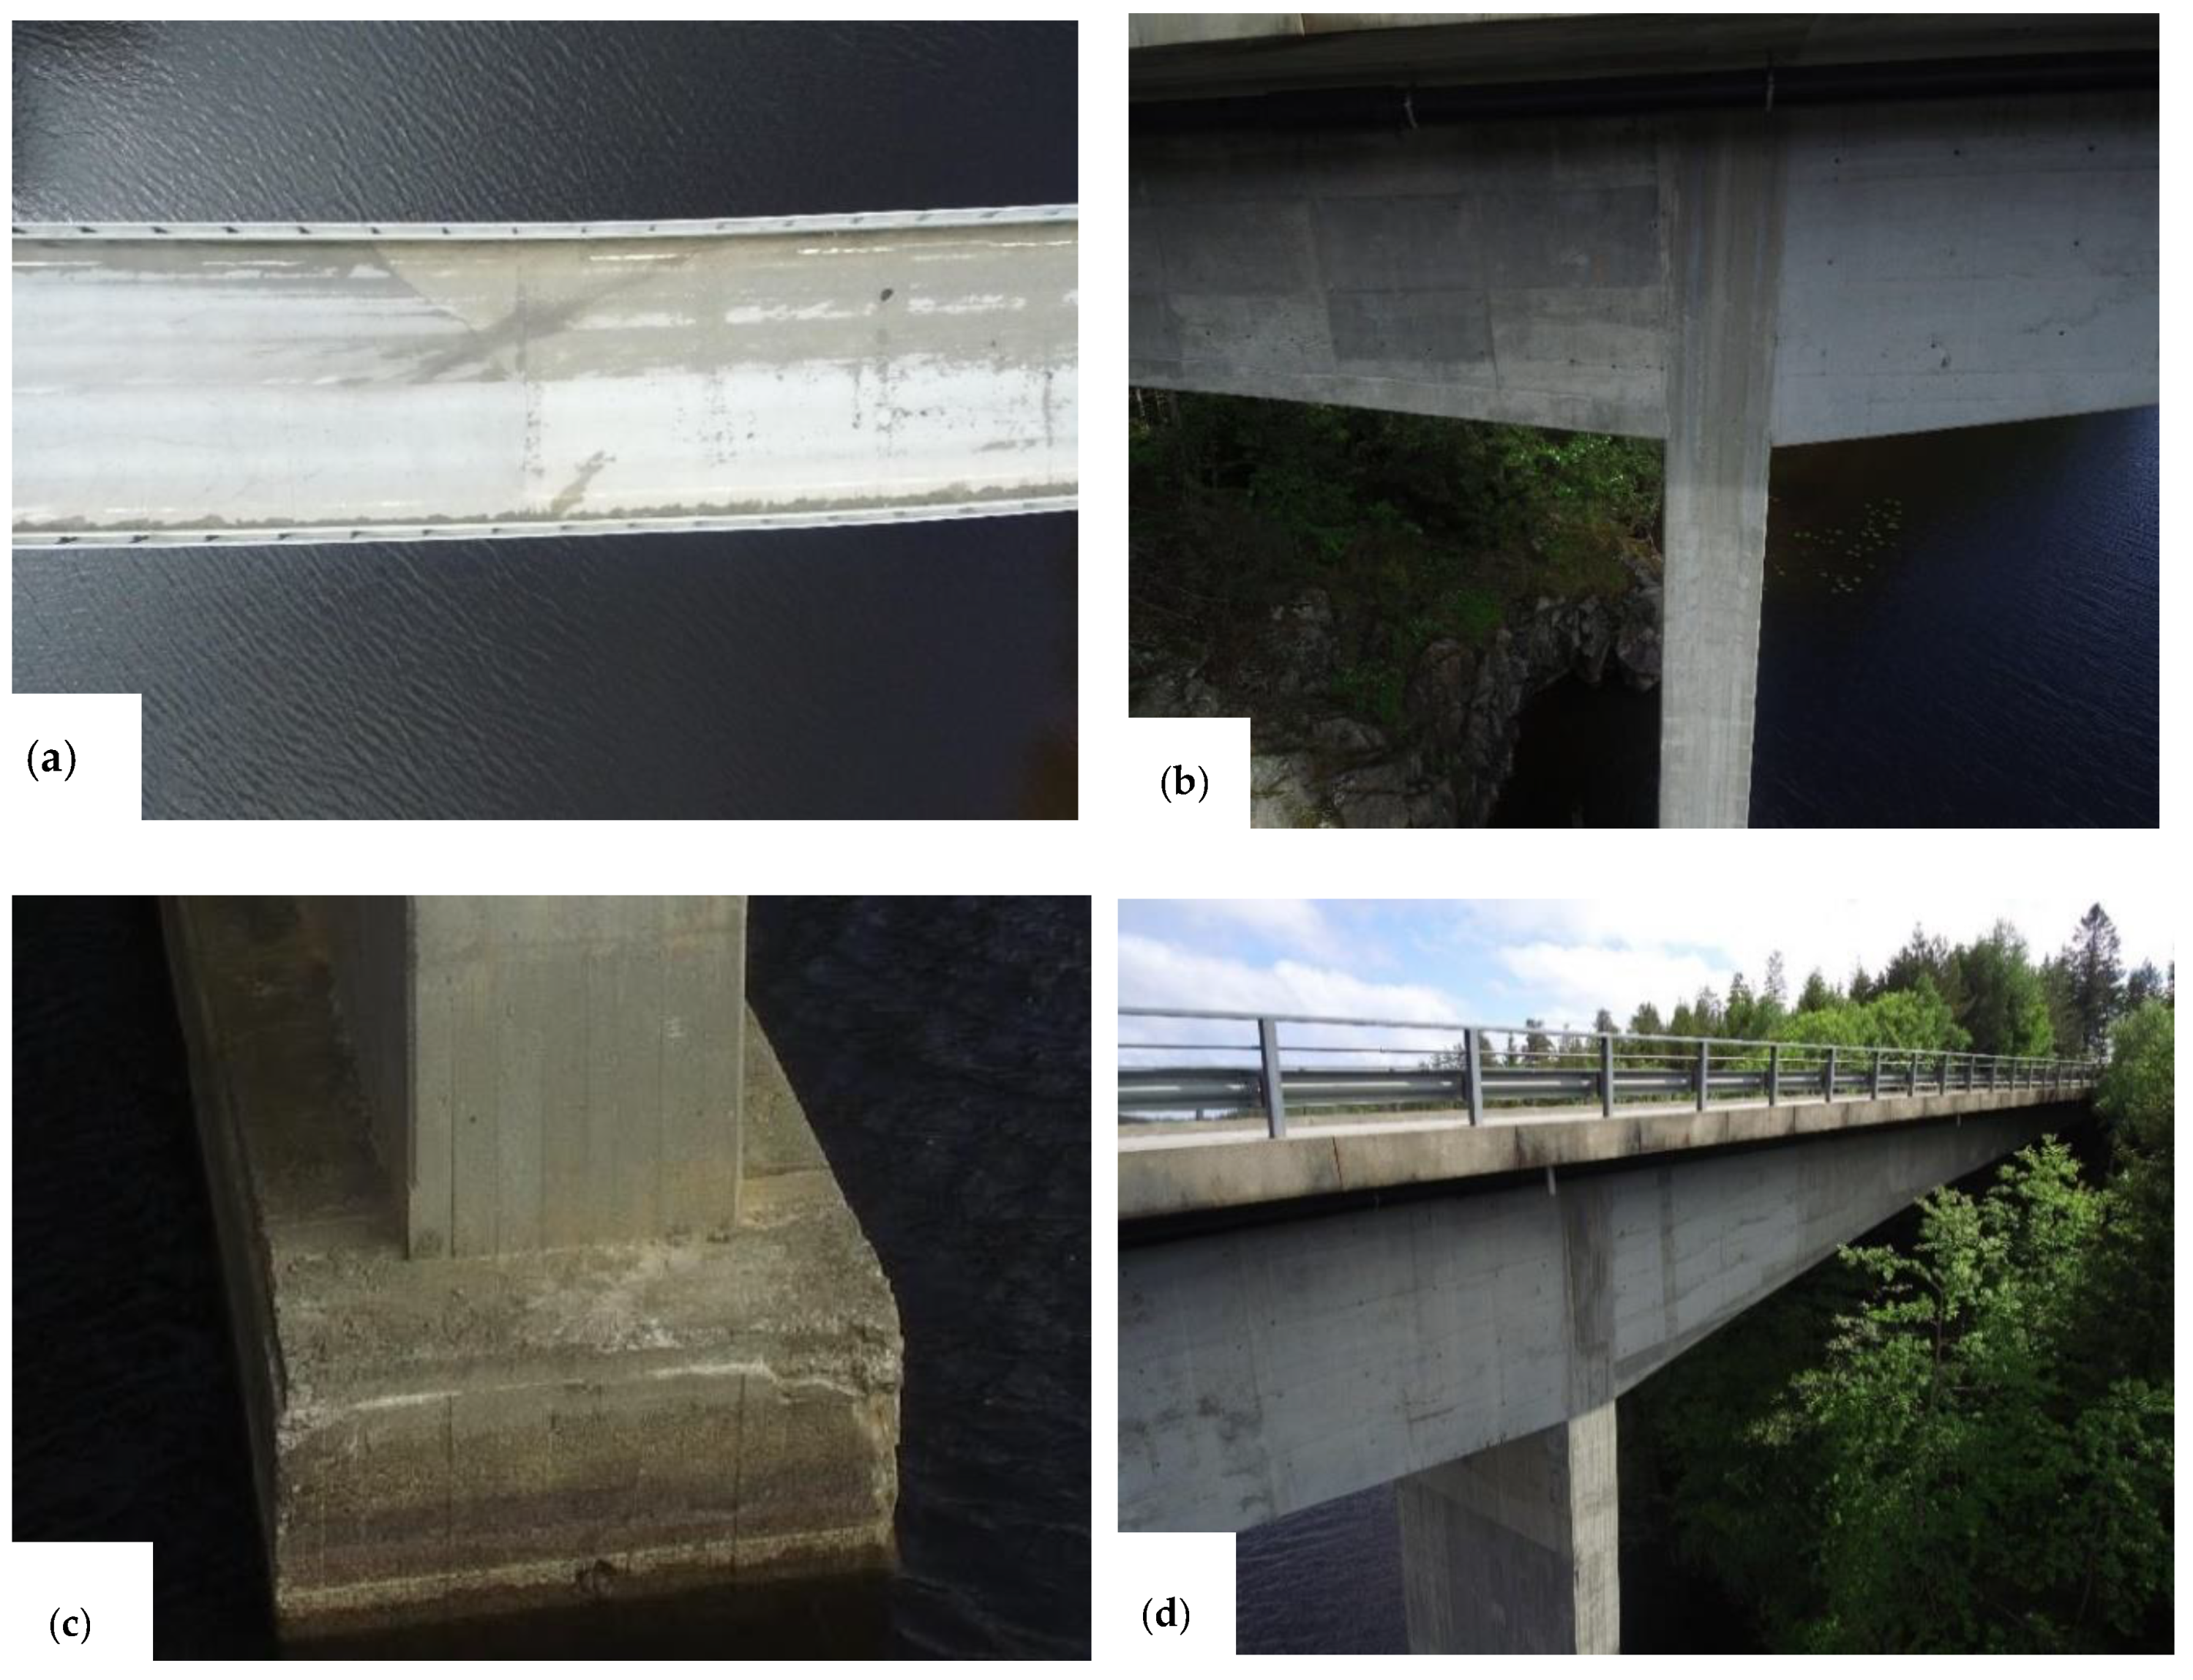
3. An Illustrative Case Study—UAV-Assisted Inspection of Skodsberg Bridge, Norway

The proposed methodology is exemplified via a drone-assisted inspection of Skodsberg bridge, a 140 m prestressed concrete bridge, in the Viken county in eastern Norway. The location, structure description, access methods, investigation methods, site specific safety analysis and imagery results are discussed. Skodsberg bridge is a 2-lane vehicular bridge, situated nearby Aremark, Viken county, Eastern Norway. Figure 2 depicts the overall view of the bridge and its key data. It is located at Latitude: 59.2063° or 59°12′22.6″ N, Longitude: 11.6932° or 11°41′35.4″ E, with Elevation: 115 m (377 feet).

3.1. Data Collection

DJI Matrice 100 drone (Shenzhen Dajiang Baiwang Technology Co., Ltd., Shenzhen, China) with Zenmuse Z3 (Shenzhen Dajiang Baiwang Technology Co., Ltd., Shenzhen, China) aerial zoom cameras with 7X zoom capacity are used for carrying out the drone-assisted inspection. This particular drone was chosen based upon distinctive features such as flight time, camera resolution, video resolution, and others. Autonomous control has been tested and trialled by using Z3 cameras and sensors which can help the drone to autonomously avoid obstacles or simply hold altitude in a GPS-denied environment. Other equipment used includes DJI remote controllers, landing platform, GPS antenna and handheld, total stations, tripods, spare batteries, blades; I-pad and connection wires to drone remotes; safety helmets, safety boots and reflective jackets, and tapes and markers. Figure 3 depicted tools and equipment used during drone-assisted inspection.
Before the drone flight, 2 tripod markers were set up at the middle of the bridge as fixed markers. These markers were used as reference points for drone flights. Thereafter, the flying of the drone is commenced. During the inspection period, the weather was cloudy to start with and ended sunny. These varying light levels can be an issue for the 3D construction of the bridge. This issue was managed by fixing the histogram level on the DJI Matrice 100 app. It was decided to fly the drone across and move along the bridge from one end to the other. This has allowed us to collect high-resolution images and videos. Thereafter, the bridge column photos were taken from both sides and with the bridge supports allowing sufficient height, and we therefore managed to fly the drone underneath the bridge. Once the drone flight is done, some additional total station recordings for the bridge side was taken. This is used as an input to the 3D construction. Figure 4 illustrates the level of details obtained from the drone-based imaging for Skodsberg bridge.

3.2. Model Training

Damages (cracks) need to be labelled with high precision to train the developed crack segmentation model (see Section 3.4). Once the bridge surface images along a predetermined trajectory are collected, raw images are cropped. Then, crack regions are labelled on cropped images to create the crack dataset (see Figure 5), and effective network architectures specifically with the geometry of crack segmentation in mind were designed for the automatic per-pixel segmentation of cracks, see Supplementary Material, Appendix I. Thereafter, per-pixel image segmentation is carried out; as such, we require a full per-pixel mask where each pixel value denotes the pixels semantic label. In this regard, we have achieved this by using the popular open-source GNU Image Manipulation Program (GIMP) and LabelImg. GIMP is an open-source paint tool; LabelImg, on the other hand, is a purpose made graphical image annotation tool and label object bounding boxes in images, see Supplementary Material, Appendix II. The results are obtained in binary mask (i.e., Crack = 255 and background = 0). We have also employed a simple active learning approach for labelling. An active learning approach starts with the same data collection effort as a supervised learning approach. However, instead of naively labelling all drone images, a more specific strategy is employed. First, a small sample of images are manually labelled and a modern supervised deep learning architecture is developed, trained, validated and tested using the crack dataset; refer to the Supplementary Material, Appendix I. A number of training experiments are conducted to fit the best deep learning techniques for analysing specific UAV images and scenarios. A multimodal dataset, combining results from a UAV-data collection, is used to provide training data. To train the network within reasonable time and other resources for processing the UAV data, NVIDIA Titan V Volta hardware has been used. In addition, a multi-core NVIDIA platform with AI processors, which is the RX/RS 2000 series, CyberpowerPC SLC8780CPG and nVidia GeForce GTX are also employed.
Thereafter, the entire unlabelled drone dataset is then passed through this trained network, see Supplementary Material, Appendix I. The network can then report the images it classified with the least confidence, and therefore, the highest uncertainty. These images with the lowest confidence are manually labelled and the model incrementally retrained. By repeating this process, the network can achieve optimum performance with up to 90% less manually labelled data, reducing labelling costs by the same percentage. Figure 5 depicts the labelling process of the Skodsberg Bridge top view and pillars.
Thereafter, for estimating the size of the cracks, we have created bounding boxes by employing the developed automated Python script from PNG masks; see Appendix II in the supplemental file. The contours and bounding box extents are traced. Later, tfrecords, which are TensorFlow data formats have been created, since tfrecords are required for an automatic crack detection model. Tfrecords are efficient when serialized and binary format for loading large datasets and easy transfer and access. Since one collects a huge quantity of data during drone-assisted inspection, employing a serialized and binary format has a significant impact on reducing the model training time. In addition, tfrecords allows the storage of sequence data, for instance a time series or word encodings, in a way that allows for a very efficient and convenient import of this type of data. Figure 6 depicts the process of extracting the bounding box from the drone photo, which is supported by the tracing of contours.

3.3. D Construction—Orthorectification

The bundle adjustment for Skodsberg bridge is calculated using the Agisoft MetaShapes (Agisoft LLC, St. Petersburg, Russia) bundle adjustment algorithm. Bundle adjustment is one of photogrammetric operations that is used to solve the inner and outer orientation of each camera, reconstructing their spatial position/orientation to each other. The performance and accuracy are, in general, dependent on image acquisition. That means that better images with good overlap led to high accuracy reconstruction. In this regard, we have taken the image with 60−70% overlap. The initial process of bundle adjustment takes 2D drone images, and outputs a 3D sparse point cloud of the scene and exterior orientations of the cameras, which enables scale for measurements. Thereafter, we have carried out dense point matching by using Agisoft to capture fine grained bridge element geometry. A resolution of up to sub pixel over multiple views and dense matching to create continuous mesh surfaces were employed. Figure 7 illustrates the bundle adjustment and dense matching process.
Afterwards, Digital Surface Models (DSM) by orthorectification of images were created. While generating DSM, relief displacement or height distortion, which is the shift in bridge elements or an object’s image position caused by its elevation above a particular datum, can occur. To remove relief displacement, orthomosiac maps have been employed to DSM. The DSM then provides the resulting pixel size, and therefore image scale. Furthermore, orthorectification of the whole bridge element geometry is generated, which is a single continuous image of the whole scene, with no redundancy or perspective; refer to Supplementary Material Appendix III for python script of orthorectification process. That means every pixel is orthogonal to the height plane. We have stored the orthomosaic as a Tagged Image File Format (Tiff) file where each pixel has an associated pixel size in real world scale (i.e., centimetres). Other information includes bounding extent (in real world coordinates), coordinate system, datum and ellipsoid. Figure 8 depicts the DSM and orthomosiac output for Skodsberg bridge.

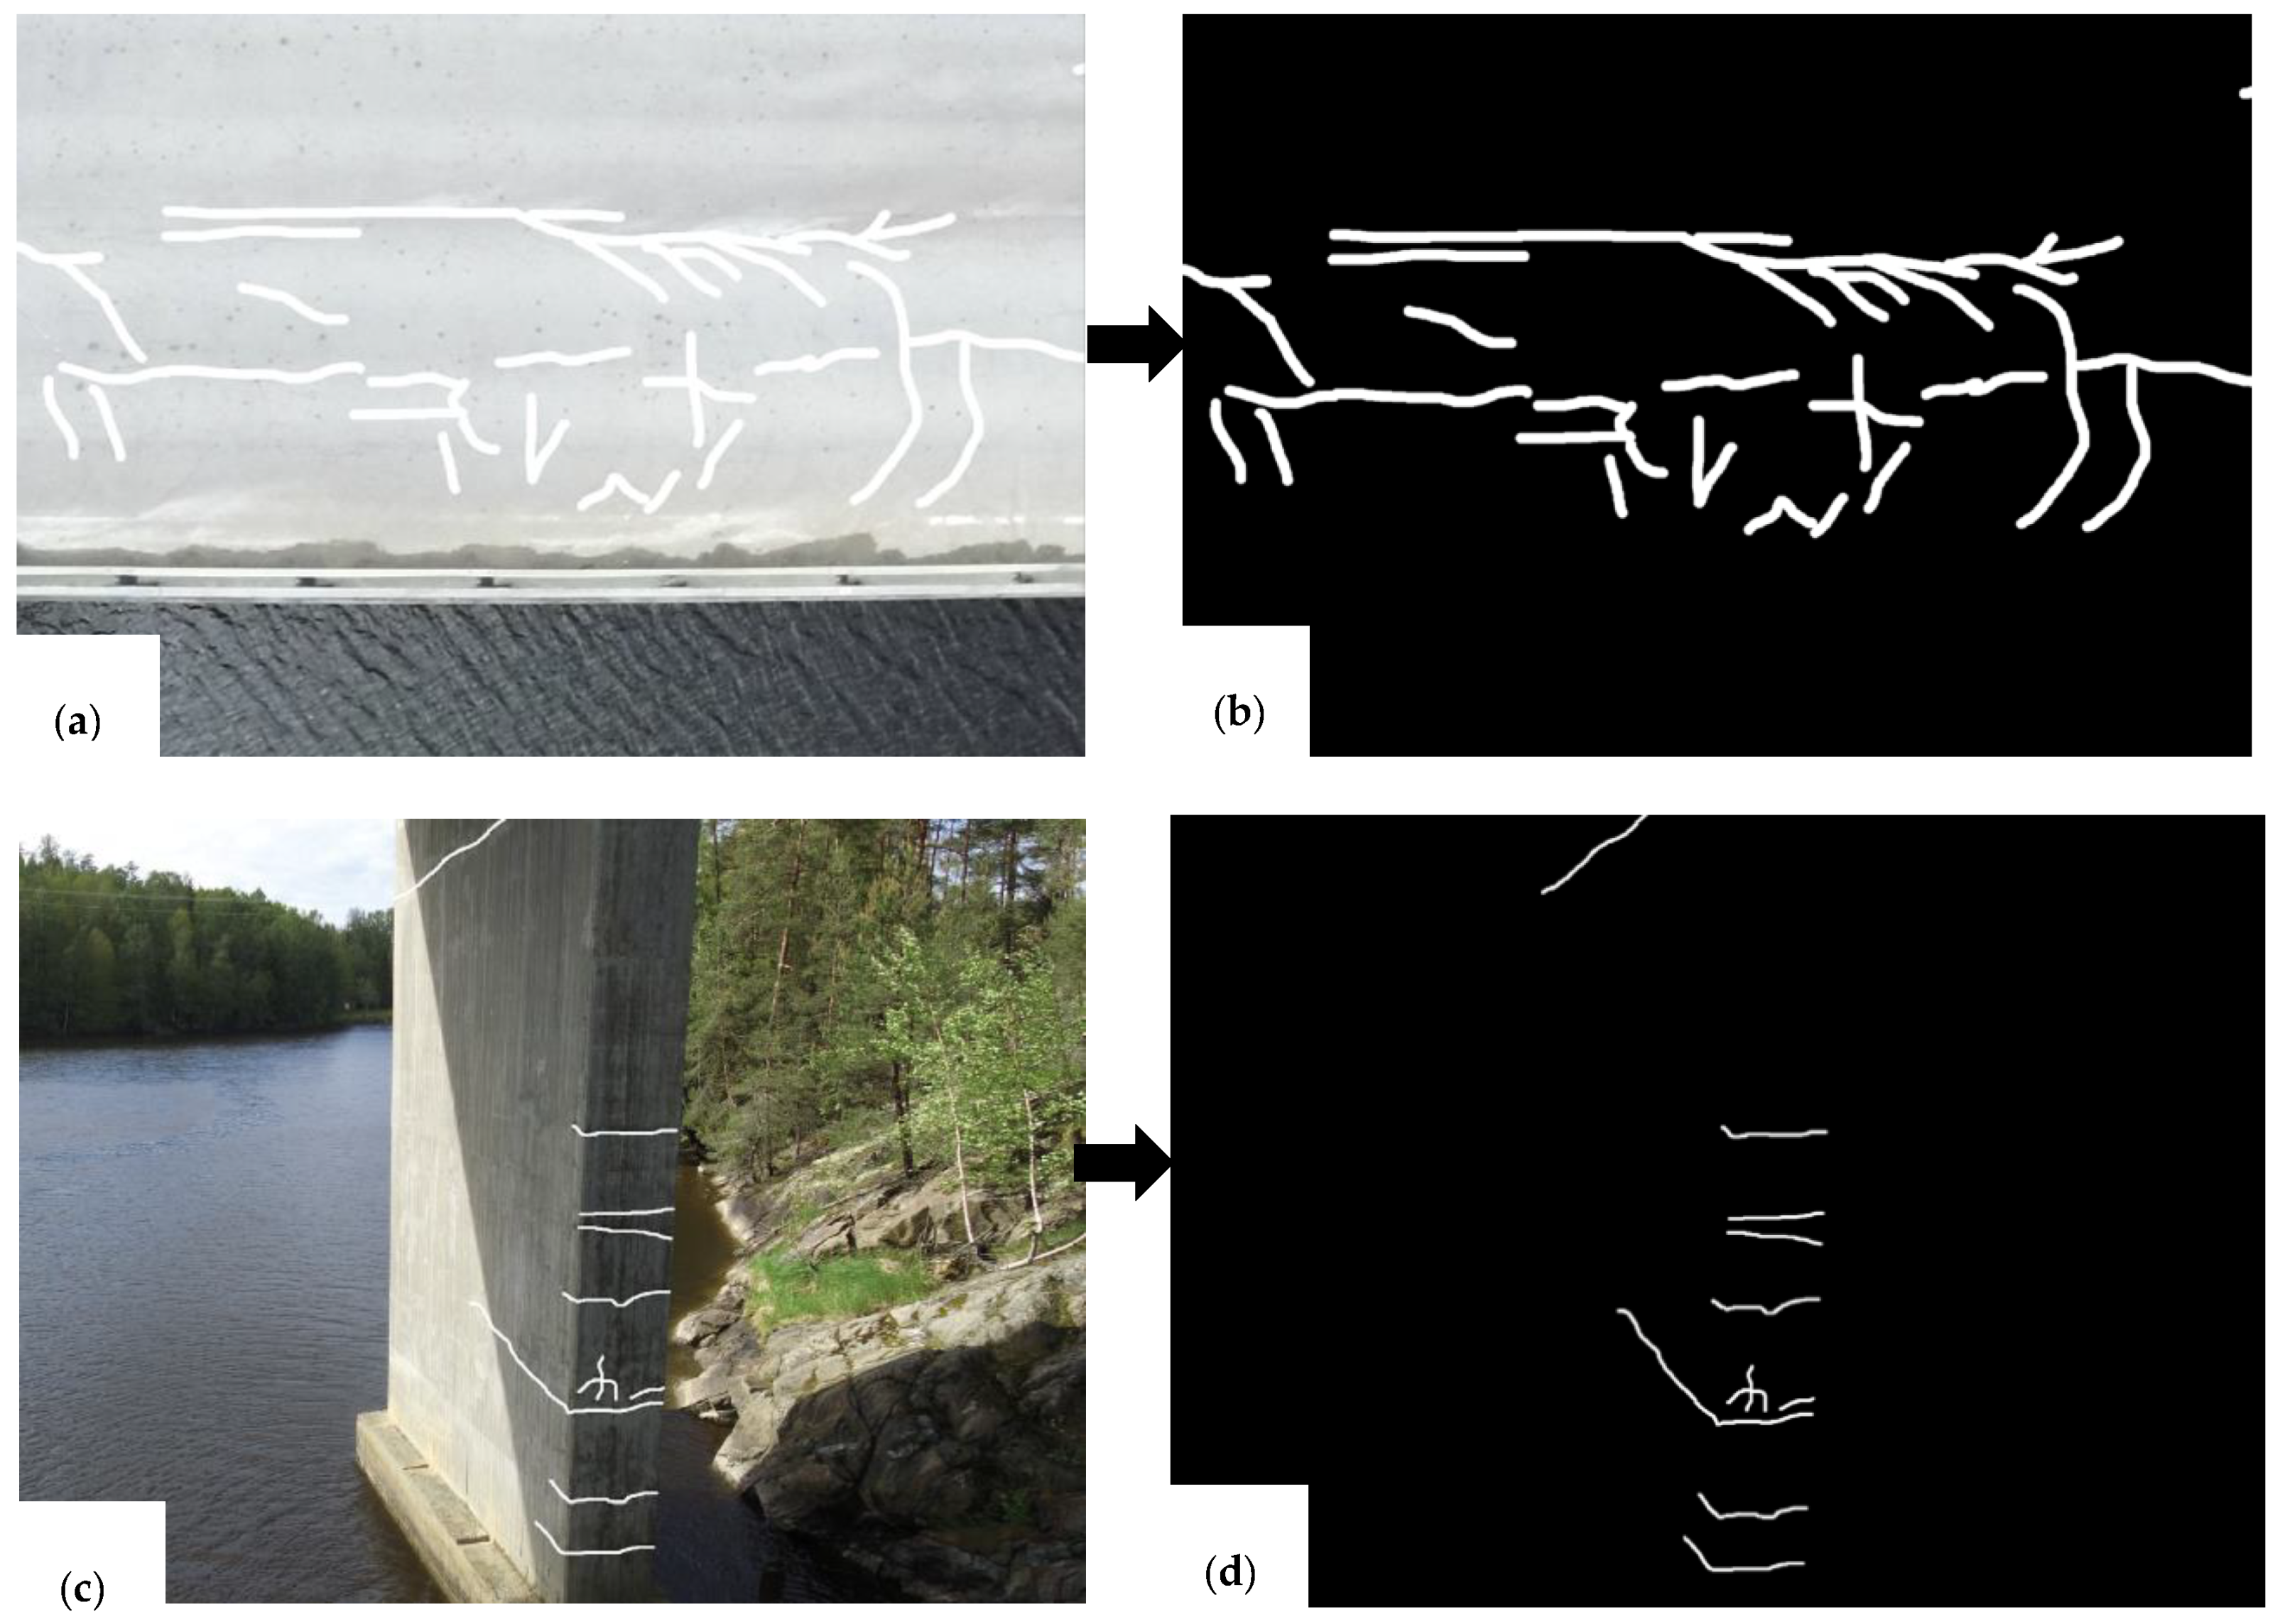
3.4. Crack Segmentation

The central thrust of this stage is detecting and segmenting cracks at the bridges’ element level. In this regard, we have designed Mask R-CNN, which is an effective deep network convolution architecture specifically with the geometry of crack segmentation in mind for the automatic per-pixel segmentation of cracks; refer to Supplementary Material Appendix I. The developed Mask R-CNN is a custom model/software designed for geospatial crack detection and segmentation and, currently, an early development proof of concept. As mentioned above, to train the network within reasonable time and other resources for processing the UAV data, we used NVIDIA Titan V Volta hardware, we also employed a multi-core NVIDIA platform with AI processors like the RX/RS 2000 series and CyberpowerPC SLC8780CPG, nVidia GeForce GTX. For any drone image input, a typical crack detection and segmentation, based on Mask R-CNN, includes:
  • Class labelling and creating the bounding box coordinates, and then returns the object mask. Resulting masks passed though the crack statistics analysis script; see Appendix II in the supplemental file. The statistics have been calculated by using OpenCV image processing library. We have utilized contour approximations for extracting individual cracks from the predicted binary mask. Then, the contour perimeter and area directly on vector points were calculated. For estimating the length and width of the crack, the Euclidean distance from corners (a1, b1) and (a1, c1) is calculated. The maximum distance, i.e., MAX ((a1, b1), (a1, c1)) is assumed to be the length and the minimum assumed to be the width. This type of approximation is more accurate with the increase of linearity of the crack. Figure 9 demonstrates the process of estimation of cracks length and width using Euclidean distance.
  • Loading in orthomosaic (output from Stage 2), tiling the orthomosiac into predefined sizes which should remain consistent across the entire dataset; see Appendix III in the supplemental file for orthomosaic analysis script.
  • Thereafter, each tile is passed into the trained crack segmentation Mask RCNN network.
  • Finally, results are saved, including: location (real world coordinates), length, width, area, perimeter, classification score by generating XMLs. XMLs are simple scripts, for performing return location and size of all cracks with certain classification scores-based standards, such as Norwegian Public Roads Administration Handbook V441-Inspection Handbook for Bridges. Figure 10 displays the Graphical User Interface (GUI) outline of the crack segmentation Mask RCNN analysis for one of the drone images of Skodsberg bridge.
The crack segmentation Mask RCNN calculates the length and width of the crack based on the Euclidean distance measurement principle, and the results (Figure 10) show that the approximation is therefore more accurate the more linear the crack is. For instance, the measurement for crack id:004 is of high accuracy; however, the accuracy of the values for crack id:002 is lower since it somehow exaggerates the width of the crack.

4. Result Discussion

The developed novel deep learning crack segmentation model/toolkit is proved to be beneficial for UAV-assisted inspection of bridges. In this regard, UAVs equipped with video cameras were employed as a core of an emerging inspection ecosystem in the above illustrated case study, which also includes post-processing elements such as photogrammetry (taking measurements from photographs and video images) and 3D imagery. The 2D imagery data can be used to quickly establish a basic knowledge of the bridge condition and is usually the first port of call. The developed model/toolkit is designed specifically with the geometry of crack segmentation in mind for the automatic per-pixel segmentation of cracks measurements including width, length, perimeter and area computations.
The findings are as follows:
  • A practical methodology from data collection to automated bridge crack segmentation Mask RCNN model/toolkit is demonstrated.
  • From the case study, it is deduced that for the model labelling aspect, the network can achieve optimum performance with up to 90% less manually labelled data, reducing labelling costs by the same percentage.
  • From the case study, it is inferred that using UAV-assisted bridge inspections coupled with automated crack detection, threats (such as cracks in steel elements, fractures in concrete elements, etc.) can be pinpointed early, high risk bridge elements can be monitored, and failure rates can be reduced.
  • By employing the developed model/toolkit, which is a deep Mask RCNN, it was achieving up to 90% accuracy in distinguishing threats and anomalies.
  • Crack segmentation Mask RCNN viewer provides a simple proof of concept visualization and processing tool for automated bridge crack segmentation and analysis
  • It is demonstrated how an online system can be deployed wherein the user requires no programming experience or knowledge of the underlying algorithms.
  • It is demonstrated that the 3D model of bridge can be used as base line for maintenance and asset management purposes. The addition of 3D capabilities to bridge management allows navigation through a complex structure, providing visual identification of the area of concern rather than solely relying on reference names or numbers.

5. Concluding Remarks and Future Work Suggestions

This work introduced an automatic crack segmentation methodology for the inspection of bridges via the use of segmentation of images obtained from UAVs. The proposed crack segmentation Mask RCNN detects, locates and quantifies cracks and fractures to a level likely to be impossible for a human inspector, and remove much of the uncertainty and prejudice associated with an inspector’s personal judgment of the severity of the structural damage. The developed crack segmentation Mask RCNN model/toolkit is custom software designed for geospatial defect detection and it is currently an early development proof of concept. Therefore, the results from the case study should be interpreted in light of the current state of knowledge about crack segmentation models. Moreover, the resulting crack measurement values from the illustrative case study analysis should be updated as new data becomes available, preferably by performing a domain specific road and bridge images data collection and thereby gradually supplanting the developed Mask RCNN model. The proposed pipeline also has the capability to adapt and capture the advantages of UAVs and can be generalized for failure detection in infrastructures such as railways and overhead power grids.
Our intent is not to provide generalized advice on whether UAV-assisted bridge inspection should replace the conventional inspection or not, since these prescriptions will be particular and heterogeneous to types of bridges and accompanying drone-related rules and regulations. Rather, the intent is to highlight the fact that UAV-assisted bridge inspection has a huge potential in the years to come. Our conclusion is that proper using of drones as a key part of bridge inspection and will result in more efficient inspection operations and improved safety.

Future Work Suggestion

Crack segmentation models such as Mask RCNN require very large datasets before generalization is achieved. Such a project would require domain specific road and bridge images to be collected. The next step could be developing a novel deep/machine Generative model to predict fatigue crack propagation. Deep learning techniques can be also utilized to identify relevant variables that influence the direction and rate of the fatigue crack propagation. The other future plan is, with cooperation with road and railway industries, to take a first step towards fully autonomous inspections by coupling the proposed model/toolkit. Finally, the proposed crack segmentation model can be generalized to other defects such as corrosion and structural damage.

Supplementary Materials

The following are available online at https://www.mdpi.com/1996-1073/13/23/6250/s1. Some or all data, models, or code that support the findings of this study are available from the corresponding author upon reasonable request.

Author Contributions

Conceptualization, Y.Z.A. and D.G.; methodology, Y.Z.A.; software, validation, formal analysis, investigation, D.G. and Y.Z.A.; writing—original draft preparation, Y.Z.A. and M.A.; writing—review and editing, Y.Z.A., M.A., D.G. and E.L.D.; visualization Y.Z.A., M.A. and E.L.D.; supervision, Y.Z.A. and E.L.D.; project administration, Y.Z.A.; funding acquisition, Y.Z.A. All authors have read and agreed to the published version of the manuscript.

Funding

This research was funded by The Regionale Forskningsfond Oslofjordsfondet Norway through the safeBRIDGE project, grant number 296349.

Acknowledgments

The work has been partially funded by The Regionale Forskningsfond Oslofjordsfondet Norway through the safeBRIDGE project—Development of Models and Algorithms for Resilience Assessment of Bridges based on Monitoring, Diagnosis and Prognosis of Damage via the use and Integration of Vibration Signals and UAV (drone)–based image segmentation facilitated at Østfold University College. The financial support was gratefully acknowledged.

Conflicts of Interest

The authors declare no conflict of interest.

References

  1. Barabadi, A.; Ayele, Y.Z. Post-disaster infrastructure recovery: Prediction of recovery rate using historical data. Reliab. Eng. Syst. Saf. 2018, 169, 209–223. [Google Scholar] [CrossRef]
  2. Biondini, F.; Frangopol, D.M. Life-cycle performance of deteriorating structural systems under uncertainty. J. Struct. Eng. 2016, 142, F4016001. [Google Scholar] [CrossRef]
  3. Wells, J.; Lovelace, B. Improving the Quality of Bridge Inspections Using Unmanned Aircraft Systems (UAS); Minnesota Department of Transportation: St. Paul, MN, USA, 2018. [Google Scholar]
  4. Okasha, N.M.; Frangopol, D.M. Integration of structural health monitoring in a system performance based life-cycle bridge management framework. Struct. Infrastruct. Eng. 2012, 8, 999–1016. [Google Scholar]
  5. Phares, B.M.; Rolander, D.D.; Graybeal, B.A.; Washer, G.A. Reliability of visual bridge inspection. Public Roads 2001, 64, 22–29. [Google Scholar]
  6. Liu, M.; Frangopol, D.M.; Kim, S. Bridge system performance assessment from structural health monitoring: A case study. J. Struct. Eng. 2009, 135, 733–742. [Google Scholar] [CrossRef]
  7. Ayele, Y.Z. Drones for inspecting aging bridges. In Proceedings of the International Conference on Natural Hazards and Infrastructure, Chania, Crete Island, Greece, 23–26 June 2019. ISSN 2623-4513. [Google Scholar]
  8. Ayele, Y.Z.; Droguett, E.L. Application of UAVs for bridge inspection and resilience assessment. In Proceedings of the 29th European Safety and Reliability Conference, Hannover, Germany, 22–26 September 2019; Beer, M., Zio, E., Eds.; Research Publishing: Singapore, 2019. [Google Scholar]
  9. Heimbecher, F.; Kaundinya, I. Protection of vulnerable infrastructures in a road transport network. In Proceedings of the TRA Conference, Brussels, Belgium, 7–10 June 2010. [Google Scholar]
  10. Minnesota Department of Transportation. Economic Impacts of the I-35W Bridge Collapse. Available online: http://www.dot.state.mn.us/i35wbridge/rebuild/pdfs/economic-impacts-from-deed.pdf (accessed on 20 September 2019).
  11. Zink, J.; Lovelace, B. Unmanned Aerial Vehicle Bridge Inspection Demonstration Project; Minnesota Department of Transportation: St. Paul, MN, USA, 2015. [Google Scholar]
  12. Duque, L.; Seo, J.; Wacker, J. Synthesis of unmanned aerial vehicle applications for infrastructures. J. Perform. Constr. Facil. 2018, 32, 04018046. [Google Scholar] [CrossRef]
  13. Dorafshan, S.; Thomas, R.J.; Maguire, M. Fatigue crack detection using unmanned aerial systems in fracture critical inspection of steel bridges. J. Bridge Eng. 2018, 23, 04018078. [Google Scholar] [CrossRef]
  14. Gillins, M.N.; Gillins, D.T.; Parrish, C. Cost-effective bridge safety inspections using unmanned aircraft systems (UAS). Geotech. Struct. Eng. Congr. 2016, 2016, 1931–1940. [Google Scholar]
  15. Seitz, S.M.; Curless, B.; Diebel, J.; Scharstein, D.; Szeliski, R. A comparison and evaluation of multi-view stereo reconstruction algorithms. In Proceedings of the 2006 IEEE Computer Society Conference on Computer Vision and Pattern Recognition (CVPR’06), New York, NY, USA, 17–22 June 2006; IEEE: New York, NY, USA, 2006; Volume 1, pp. 519–528. [Google Scholar]
  16. Westoby, M.J.; Brasington, J.; Glasser, N.F.; Hambrey, M.J.; Reynolds, J.M. ‘Structure-from-Motion’ photogrammetry: A low-cost, effective tool for geoscience applications. Geomorphology 2012, 179, 300–314. [Google Scholar] [CrossRef] [Green Version]
  17. Jung, H.-J.; Lee, J.-H.; Yoon, S.; Kim, I.-H. Bridge inspection and condition assessment using unmanned aerial vehicles (UAVs): Major challenges and solutions from a practical perspective. Smart Struct. Syst. 2019, 24, 669–681. [Google Scholar]
  18. Song, Y.; Liu, Z.; Rxnnquist, A.; Navik, P.; Liu, Z. Contact wire irregularity stochastics and effect on high-speed railway pantograph-catenary interactions. IEEE Trans. Instrum. Meas. 2020, 69, 8196–8206. [Google Scholar]
  19. Bolourian, N.; Soltani, M.; Albahria, A.; Hammad, A. High level framework for bridge inspection using LiDAR-equipped UAV. In ISARC, Proceedings of the International Symposium on Automation and Robotics in Construction, Taipei, Taiwan, 28 June–1 July 2017; IAARC Publications Curran Associates, Inc.: New York, NY, USA, 2017; p. 34. [Google Scholar]
  20. Lovelace, B.; Zink, J. Unmanned aerial vehicle bridge inspection demonstration project. Res. Proj. Final Rep. 2015, 40, 1–214. [Google Scholar]
  21. Mader, D.; Blaskow, R.; Westfeld, P.; Weller, C. Potential of UAV-based laser scanner and multispectral camera data in building inspection. In Proceedings of the International Archives of the Photogrammetry, Remote Sensing & Spatial Information Sciences, Prague, Czech Republic, 12–19 July 2016; Volume 41. [Google Scholar]
  22. Iwnicki, S. Handbook of Railway Vehicle Dynamics; CRC Press: Boca Raton, FL, USA, 2006. [Google Scholar]
  23. Scott, R.H.; Banerji, P.; Chikermane, S.; Srinivasan, S.; Basheer, P.M.; Surre, F.; Sun, T.; Grattan, K.T. Commissioning and evaluation of a fiber-optic sensor system for bridge monitoring. IEEE Sens. J. 2013, 13, 2555–2562. [Google Scholar] [CrossRef] [Green Version]
  24. Krizhevsky, A.; Sutskever, I.; Hinton, G.E. Imagenet classification with deep convolutional neural networks. Commun. ACM 2017, 60, 84–90. [Google Scholar] [CrossRef]
  25. Girshick, R.; Donahue, J.; Darrell, T.; Malik, J. Rich feature hierarchies for accurate object detection and semantic segmentation. In Proceedings of the IEEE Conference on Computer Vision and Pattern Recognition, Columbus, OH, USA, 23–28 June 2014; pp. 580–587. [Google Scholar]
  26. Girshick, R. Fast r-cnn. In Proceedings of the IEEE International Conference on Computer Vision, Santiago, Chile, 7–13 December 2015; pp. 1440–1448. [Google Scholar]
  27. Ren, S.; He, K.; Girshick, R.; Sun, J. Faster r-cnn: Towards real-time object detection with region proposal networks. In Proceedings of the Advances in Neural Information Processing Systems, Montreal, QC, Canada, 7–12 December 2015; pp. 91–99. [Google Scholar]
  28. Redmon, J.; Divvala, S.; Girshick, R.; Farhadi, A. You only look once: Unified, real-time object detection. In Proceedings of the IEEE Conference on Computer Vision and Pattern Recognition, Las Vegas, NV, USA, 27–30 June 2016; pp. 779–788. [Google Scholar]
  29. Liu, W.; Anguelov, D.; Erhan, D.; Szegedy, C.; Reed, S.; Fu, C.Y.; Berg, A.C. Ssd: Single shot multibox detector. In European Conference on Computer Vision; Springer: Cham, Switzerland, 2016; pp. 21–37. [Google Scholar]
  30. He, K.; Gkioxari, G.; Dollár, P.; Girshick, R. Mask r-cnn. In Proceedings of the IEEE International Conference on Computer Vision, Venice, Italy, 22–29 October 2017; pp. 2961–2969. [Google Scholar]
  31. Li, J.; Liang, X.; Wei, Y.; Xu, T.; Feng, J.; Yan, S. Perceptual generative adversarial networks for small object detection. In Proceedings of the IEEE Conference on Computer Vision and Pattern Recognition, Honolulu, HI, USA, 21–26 July 2017; pp. 1222–1230. [Google Scholar]
  32. Bai, Y.; Zhang, Y.; Ding, M.; Ghanem, B. Sod-mtgan: Small object detection via multi-task generative adversarial network. In Proceedings of the European Conference on Computer Vision (ECCV), Munich, Germany, 8–14 September 2018; pp. 206–221. [Google Scholar]
  33. Cha, Y.J.; Choi, W.; Büyüköztürk, O. Deep learning-based crack damage detection using convolutional neural networks. Comput. Aided Civ. Infrastruct. Eng. 2017, 32, 361–378. [Google Scholar] [CrossRef]
  34. Kim, B.; Cho, S. Automated vision-based detection of cracks on concrete surfaces using a deep learning technique. Sensors 2018, 18, 3452. [Google Scholar] [CrossRef] [PubMed] [Green Version]
  35. Atha, D.J.; Jahanshahi, M.R. Evaluation of deep learning approaches based on convolutional neural networks for corrosion detection. Struct. Health Monit. 2018, 17, 1110–1128. [Google Scholar] [CrossRef]
  36. Mandal, V.; Uong, L.; Adu-Gyamfi, Y. Automated road crack detection using deep convolutional neural networks. In Proceedings of the 2018 IEEE International Conference on Big Data (Big Data), Seattle, WA, USA, 10–13 December 2018; pp. 5212–5215. [Google Scholar]
  37. Huston, D.; Cui, J.; Burns, D.; Hurley, D. Concrete bridge deck condition assessment with automated multisensor techniques. Struct. Infrastruct. Eng. 2011, 7, 613–623. [Google Scholar] [CrossRef]
  38. Chen, S.; Laefer, D.F.; Mangina, E.; Zolanvari, S.I.; Byrne, J. UAV bridge inspection through evaluated 3D reconstructions. J. Bridge Eng. 2019, 24, 05019001. [Google Scholar] [CrossRef] [Green Version]
  39. Seo, J.; Duque, L.; Wacker, J. Drone-enabled bridge inspection methodology and application. Autom. Constr. 2018, 94, 112–126. [Google Scholar] [CrossRef]
  40. Seo, J.; Wacker, J.P.; Duque, L. Evaluating the use of Drones for Timber Bridge Inspection; Gen. Tech. Rep. FPL-GTR-258; US Department of Agriculture, Forest Service, Forest Products Laboratory: Madison, WI, USA, 2018; Volume 258, pp. 1–152.
  41. Belcastro, C.M.; Newman, R.L.; Evans, J.; Klyde, D.H.; Barr, L.C.; Ancel, E. Hazards identification and analysis for unmanned aircraft system operations. In Proceedings of the 17th AIAA Aviation Technology, Integration, and Operations Conference, Denver, CO, USA, 5–9 June 2017; p. 3269. [Google Scholar]
  42. Agisoft, L.L.C. Metashape—Photogrammetric Processing of Digital Images and 3D Spatial Data Generation. Available online: https://www.agisoft.com (accessed on 20 July 2019).
Figure 1. Proposed methodology for inspection assessment via the use of Unmanned Aerial Vehicles (UAV) image segmentation.
Energies 13 06250 g001
Figure 2. Skodsberg Bridge overall view and key bridge data.
Energies 13 06250 g002
Figure 3. Tools and equipment used during drone-assisted inspection.
Energies 13 06250 g003
Figure 4. (a) Top view of Skodsberg bridge. (b) drone image of detail near top deck and footing. (c) drone image of concrete deterioration. (d) Unmanned Aerial Vehicle (UAV) photo detail near the top deck and footing.
Energies 13 06250 g004
Figure 5. (a) drone image of Skodsberg Bridge top view. (b) labelled image top view. (c) drone image of Skodsberg bridge supporting. (d) labelled image bridge supporting.
Energies 13 06250 g005
Figure 6. (a) drone image of Skodsberg bridge supporting, (b) tracing of contours, (c) extracting bounding box, (d) drone image of Skodsberg bridge deck, (e) bridge deck tracing of contours, (f) bridge deck extracting bounding box.
Energies 13 06250 g006
Figure 7. (a) Bundle adjustment for Skodsberg Bridge, (b) Skodsberg Bridge dense matching.
Energies 13 06250 g007
Figure 8. (a) Digital Surface Model (DSM) and (b) Orthomosiac output for Skodsberg Bridge.
Energies 13 06250 g008
Figure 9. (a) drone image. (b) data labelling. (c) cracks length and width estimation.
Energies 13 06250 g009
Figure 10. Graphical User Interface (GUI) outline of the crack segmentation Mask RCNN analysis for one of the drone images of Skodsberg bridge.
Energies 13 06250 g010
Publisher’s Note: MDPI stays neutral with regard to jurisdictional claims in published maps and institutional affiliations.

