Review

Smart Water Technology for Efficient Water Resource Management: A Review

by
Aditya Dinesh Gupta
1,
Prerna Pandey
2,
Andrés Feijóo
3,
Zaher Mundher Yaseen
4 and
Neeraj Dhanraj Bokde
5,*
1
Department of Electronics and Telecommunication Engineering, College of Engineering Pune, Pune 411005, India
2
Department of Civil Engineering, Visvesvaraya National Institute of Technology, Nagpur 440010, India
3
Departamento de Enxeñería Eléctrica-Universidade de Vigo, Campus de Lagoas-Marcosende, 36310 Vigo, Spain
4
Sustainable Developments in Civil Engineering Research Group Faculty of Civil Engineering, Ton Duc Thang University, Ho Chi Minh City 758307, Vietnam
5
Department of Engineering—Renewable Energy and Thermodynamics, Aarhus University, 8000 Aarhus, Denmark
*
Author to whom correspondence should be addressed.
Energies 2020, 13(23), 6268; https://doi.org/10.3390/en13236268
Submission received: 18 October 2020 / Revised: 18 November 2020 / Accepted: 25 November 2020 / Published: 27 November 2020
(This article belongs to the Special Issue Data Driven Approaches for Environmental Sustainability)

Abstract

:
According to the United Nation’s World Water Development Report, by 2050 more than 50% of the world’s population will be under high water scarcity. To avoid water stress, water resources are needed to be managed more securely. Smart water technology (SWT) has evolved for proper management and saving of water resources. Smart water system (SWS) uses sensor, information, and communication technology (ICT) to provide real-time monitoring of data such as pressure, water ow, water quality, moisture, etc. with the capability to detect any abnormalities such as non-revenue water (NRW) losses, water contamination in the water distribution system (WDS). It makes water and energy utilization more efficient in the water treatment plant and agriculture. In addition, the standardization of data format i.e., use of Water Mark UP language 2.0 has made data exchange easier for between different water authorities. This review research exhibits the current state-of-the-art of the on-going SWT along with present challenges and future scope on the mentioned technologies. A conclusion is drawn that smart technologies can lead to better water resource management, which can lead to the reduction of water scarcity worldwide. High implementation cost may act as a barrier to the implementation of SWT in developing countries, whereas data security and its reliability along with system ability to give accurate results are some of the key challenges in its field implementation.

1. Introduction

Water and sanitation were declared as basic human needs by the United Nations (UN) in 2012 [1]. In the current scenario, 786 million people do not have access to clean drinking water [2]. Events like floods, climate change, and water pollution make freshwater scarcer. According to the World Bank database, 44 developed countries have non-revenue water (NRW) losses of 35% [3,4]. Because of these losses, extra water has to be pumped [5]. Efficient water management has become a major issue for many countries and water industries. Using ICT, researchers are coming up with self-learning systems known as Smart water system (SWS), having the capability to manage water more efficiently [6,7].
In addition, the SWS is suggested as one way to tackle some issues related to climate change by improving the ecosystem by reducing the water footprint [8]. Several research articles and textbooks [9,10,11,12,13,14,15] have given attention to the water loss management techniques such as infrastructural and non-infrastructural pressure management, leakage assessment and their control by identifying leakages, smart metering, etc. for water distribution systems (WDS) [16]. Sensege [17] has given an evaluation regarding different present sensor technologies for smart farming highlighting their capabilities of providing better revenue to the farmers by suggesting crop best suitable for their field on the basis of environmental analysis. At the same time reducing the water foot print by predicting efficient watering timing. River waters and other water bodies are important parts of the ecosystem and the main source of water supply for cities. Hence, their quality needs to be monitored assuring contamination-free water to the consumers and protecting the ecosystem. Smart sensor technologies [18] are capable of protecting water bodies by monitoring their contamination, toxic content check, oxygen content, etc. The system provides alarm in case of any suspicious findings. Water from river is usually treated in water treatment plants before supplying it to the end users. Hence, the role of water treatment plants is equally important. Hence, for unstoppable supply of water to the society efficient of management of these water infrastructures are required [19,20]. Smart water technologies provide better management by proving efficient water quality monitoring, helps in managing labor, etc. [21,22]. Previously presented reviews were more focused on smart water techniques on an individual field, rather than towards overall water management techniques. This paper provides a review on present SWT for water management, along with future challenges and scope of research. Based upon the state of the art technologies and their available case studies on SWM across the world, more than 100 reputed publications have been referred to understand the role of SWT for better water management to reduce water footprints and their capability to save ecosystem.
This review study is an extension survey for the selective literature review [23] of leakage management techniques in water distribution system, which described leakage management-related techniques (leakage modeling, different leakage assessment techniques, pressure management, smart water techniques for pipeline burst detection and localization, pump scheduling). These topics are related to water distribution systems i.e., water networks. However, providing quality water to end users is not only a better water distribution system in the city but it requires contamination-free river water resources and efficient water treatment plants. Hence, researchers working in the field of smart water management for smart cities should posses some knowledge of different smart water technologies available for water treatment plants and water body monitoring etc. This article reviews different smart water techniques dedicated to leakage management of water distribution systems, water treatment plants, smart farming, water bodies monitoring, energy harvesting for sensors, the role of smart metering etc. The topics discussed in this paper are organized as shown in Figure 1.
The purpose of this review article is to highlight the recent smart water technologies in different fields utilizing real-life case studies. Some of the objectives of this review article are as follows:
  • To give a review of different smart water technologies.
  • To make a comparison between different available smart water techniques utilized in different parts of the world.
  • To identify and highlight the benefits observed in utilizing smart technologies such as a reduction in water loss, energy, and waste management, better revenue in farming, etc.
  • To identify the key challenges such as high cost, cyber attacks, data standardization, etc. that need to be addressed in the future by the researchers.
  • To mention the political and social constraints in implementing smart technologies.
  • To mention the solution to remove the political–social constraints.
The paper is arranged in the following manner: Section 2 gives information on SWS for WDS. Section 3, Section 4 and Section 5 present smart water technology for agriculture, water body monitoring, and water treatment plants. The smart metering concept is discussed in Section 6. Section 7 throws light on the standardization of the hydro-meteorological data format. The conclusion is drawn out in Section 8. The list of abbreviations used in the paper are defined in Table 1.

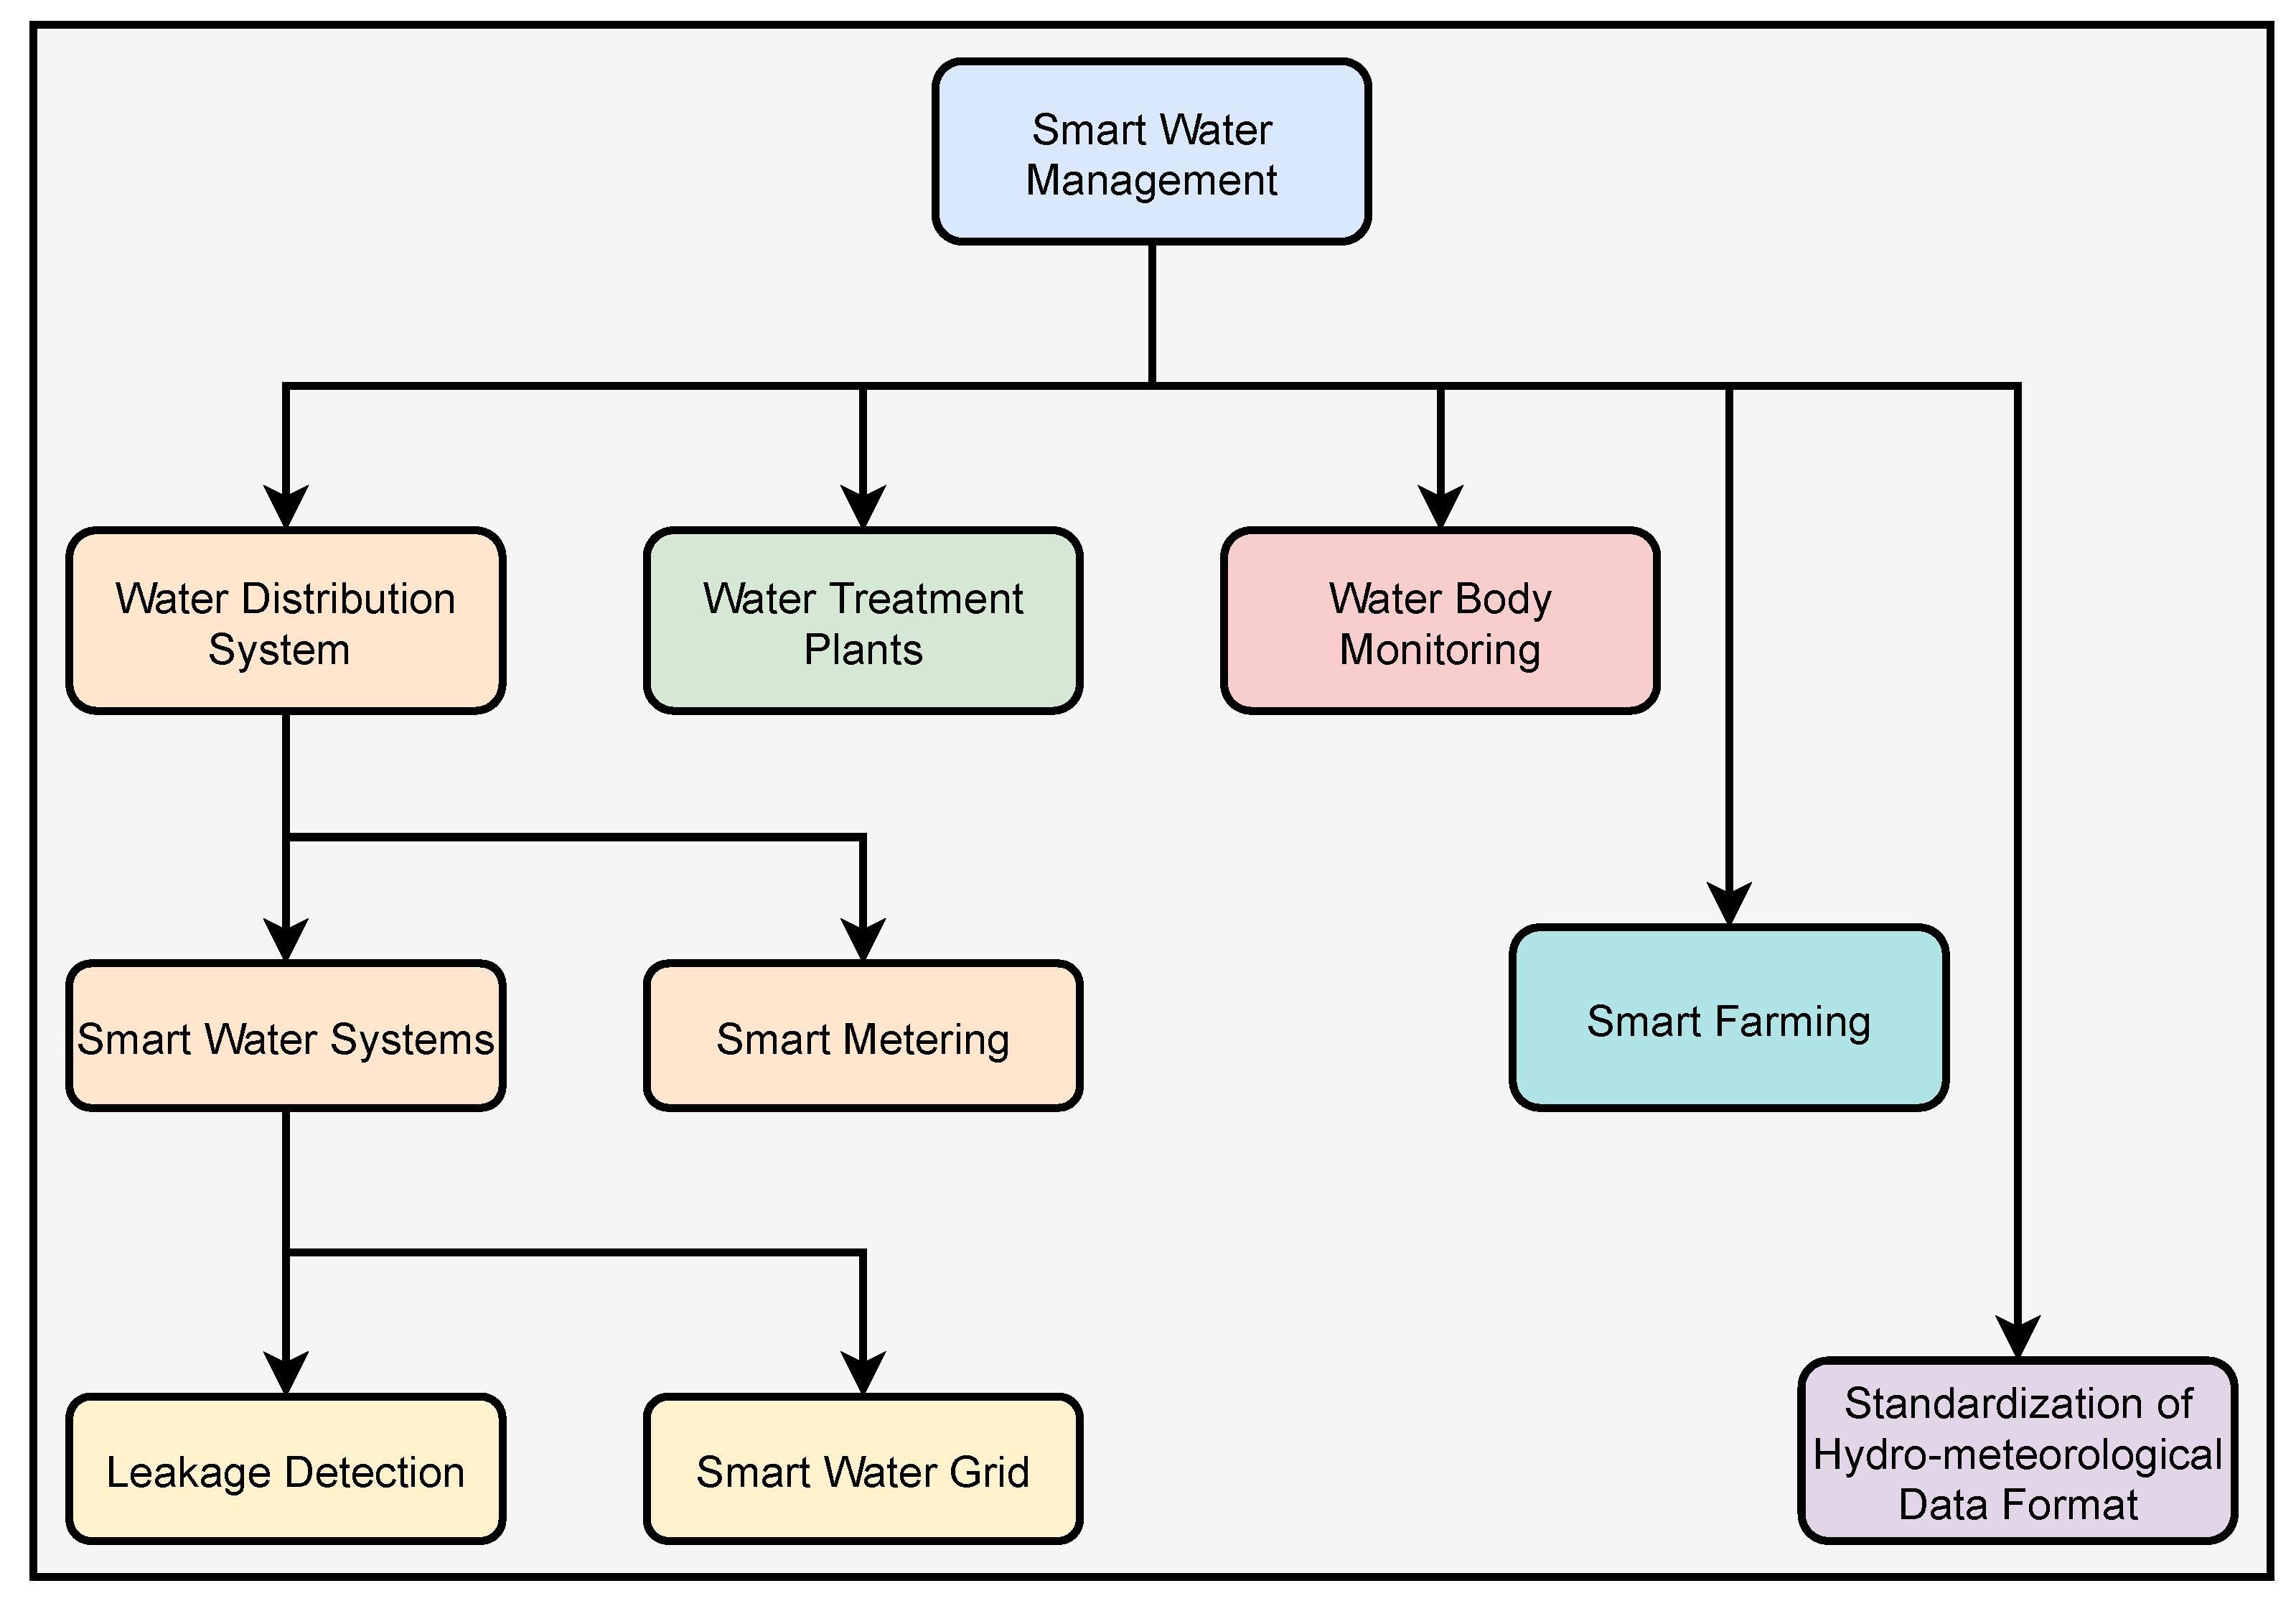
2. Smart Water Systems for Water Distribution System

According to a report by the World Bank, every year, 45 billion cubic meters of water are lost, which costs around US$ 14 billion [15]. Water is lost due to poor connections, leakages from pipes, faulty metering, unauthorized connections, etc. NRW for any district metering area (DMA) can be calculated using Top-down and Bottom-up approaches [24,25,26]. Data reliability, unavailability of data, and high costs are the drawbacks of these techniques.

2.1. Leakage Detection

Leakages are the main sources of NRW losses, which highly depend on pressure and water consumption [26], and increase water contamination. Acoustic sensors are old and commonly used methods for leakage detection in WDS [27]. Ground-penetrating radar [28], infrared thermography [11], and electromagnetic sensors are other developed techniques available for leakage detection. These techniques suffer from a limited surveying range for leakage detection. With recent advances in science and technology, researchers are coming up with SWT having the capability to automatically detect and locate the burst event. Some of the the commonly used sensors and their applications in smart cities are explained in Figure 2.
This section discusses different smart techniques (such as transient analysis of pressure signal, online monitoring, etc.) present for detecting leakages and burst events in the pipeline network. In the end, different smart techniques available for minimizing leakages through pressure management are discussed followed by a case study on the SWG of Singapore. Sensor technology provides real-time monitoring of water infrastructures [29]. Measured data taken from these sensors, when combined with efficient data processing techniques, enable better management and response in case of infrastructure failure. In the UK [30], a decision support system (DSS) is installed, to improve the operations of the water supply system, under the Neptune Project Research Consortium. Flow and pressure sensors data have been analyzed for leakage identification, pump scheduling and to investigate steady and dynamic properties of the system under Pressure Relief Valves (PRV) control. Leakage assessment is performed in the Lisbon water supply system using the Bottom-up approach [31]. Flow meters and pressure transducers are installed at some predefined points for data measurements. The location of leakages is identified using acoustic sensors. This has resulted in a 40% reduction of water losses, causing a total saving of €63,500. Research institutes are coming up with a future prototype of smart water networks for leakage detection and its control. A smart water network [32] is installed at Graz University. Magnetic valves along with flow and pressure sensors were installed to identify leakages in the networks. Experiments under more complex networks are desired to make such a prototype more practically implementable in WDS. Other smart water techniques for leakage detection, by monitoring abrupt changes using flow and pressure sensors, were presented in [33,34]. Inverse transient analysis (ITA) [35] and frequency analysis [36] of the pressure signal (collected from pressure sensors) have grabbed the attention of researchers in the recent past for leakage detection in the pipeline system.
Gupta and Kulat [37] have used Wavelet and Cumulative Sum (CUSUM) analysis on the transient pressure signal collected from the sensor network for automatic detection of burst events in the pipeline. The system is tested for a small pipeline testbed. It is observed that using wavelet analysis alone is not sufficient for the detection of burst events. Although CUSUM alone can detect the abnormalities observed in pressure signal, pinpointing the exact time of abnormality is not possible. Table 2 discusses some of the real-world case studies and their drawbacks.
Other leakage identification techniques such as the transient damping method (TDM) [41] and impulse response analysis (IRA) [42] are limited to simple pipeline architecture. Field implementation and verification of these techniques are shown to be still lacking. Leakage detection and assessment can be performed by calculating the difference between measured and predicted hydraulic parameters [43]. Similarly, Ye et al. [44] proposed a Kalman filter based prediction algorithm for prediction of hydraulic parameters of WDS at North England. The proposed methodology is computationally simple and requires a smaller amount of data, compared to the artificial neural network (ANN) based techniques [45]. This technique has been successfully applied for detecting small leakages and small abrupt changes. Gupta et al. [46] have shown how the water flow data collected from flow sensors of water tanks can be utilized to find out the optimum tank water level. Optimal tank water level helps minimize the excess pipeline pressure in the water network, which leads to leakage reduction in the water networks. Other prediction algorithms such as autoregressive integrated moving average (ARIMA) [47] and Pattern sequence-based forecasting (PSF) [48,49] can be used in the future, for further improvement in prediction modeling.
It is equally important to identify commercial losses. The water industry [50] known as Smart water came up with a smart device, capable of providing information regarding the water level of installed house tanks, on the smartphone. Water losses occurring inside the homes (for example leak through sanitation, etc.) can be easily identified using this device. A similar study is performed to identify leakages in the large water tanks of the society by analyzing the difference in the actual water utilized by consumes (using smart meters) and the total water flow from the tanks [51]. A SWS [40] can replace older DMA leak assessment and detection techniques for the identification of pipeline bursting events. SWT performs analysis on collected sensors data to detect pipeline leakages, which reduces water losses. Water, which gets lost earlier due to physical and commercial losses, can serve many people deprived of water scarcity. This can lead to reducing water scarcity worldwide. The localization of burst events reduces the cost required for pipeline maintenance. More techniques are needed to be developed to identify small leakages and commercial losses present in the network. Exact pinpointing of burst location can be seen as future work.
Excess pipeline pressure reduction controls the leakages in the WDS [52]. Sensus [53] has come up with a smart water solution for water utility and monitoring. Different sensors such as pressure, flow and water quality sensor have been deployed in water infrastructure for online monitoring and analysis of these hydraulic parameters for leakage detection and thus the system reduces water losses. Pump scheduling is decided according to demand variations observed on the analysis of measured data. Pressure monitoring and pump scheduling helps perform pressure management of WDS, and thus reduces the bursting probability of the aging pipeline. Hence, a reduction in the cost of pipeline maintenance is observed. This system can lead to global savings of US $ 12.5 billion if adopted worldwide. Software controlled [54] advanced pump scheduling system has been installed in Poznan. The bursting of pipeline depends upon the pressure of water. Using OPIR software, pressure-demand is predicted. It works on a self-learning algorithm from past databases. Demand for the next 48 h is forecasted, and water is supplied according to the predicted demand. Pressure reducing valves (PRV) (NGE9001) are installed at different points to control the pipeline pressure, based on the required demand. This pressure reduction technique reduces the bursting probability of pipeline and thus reduces water loss by 21%. This causes a reduction in energy usage by €21,500 annually. Di et al. [55] presented an Ant algorithm for improving the water network. Remote-controlled valves have been suggested for controlling leakages in WDS using pressure management. Sensor technology performs demand prediction which helps perform pressure management, thus reduces excess pressure present in WDS. This avoids the bursting of the pipeline. Pump scheduling helps reduce water losses and energy consumption. The high implementation cost of the sensor network can be seen as a drawback. Due to high sensor cost it can be deployed in limited numbers only. Hence, efficient sensor placement is required in order to get maximum of meaningful data [56]. Shahra and Wu [57] have shown the usage of an evolutionary algorithm (EA). The study uses virtual water contamination scenarios in different locations to identifies the locations of sensors placement. Incorrect data may cause unappropriated prediction, making WDS pressure inefficient for providing efficient services.

2.2. Smart Water Grid
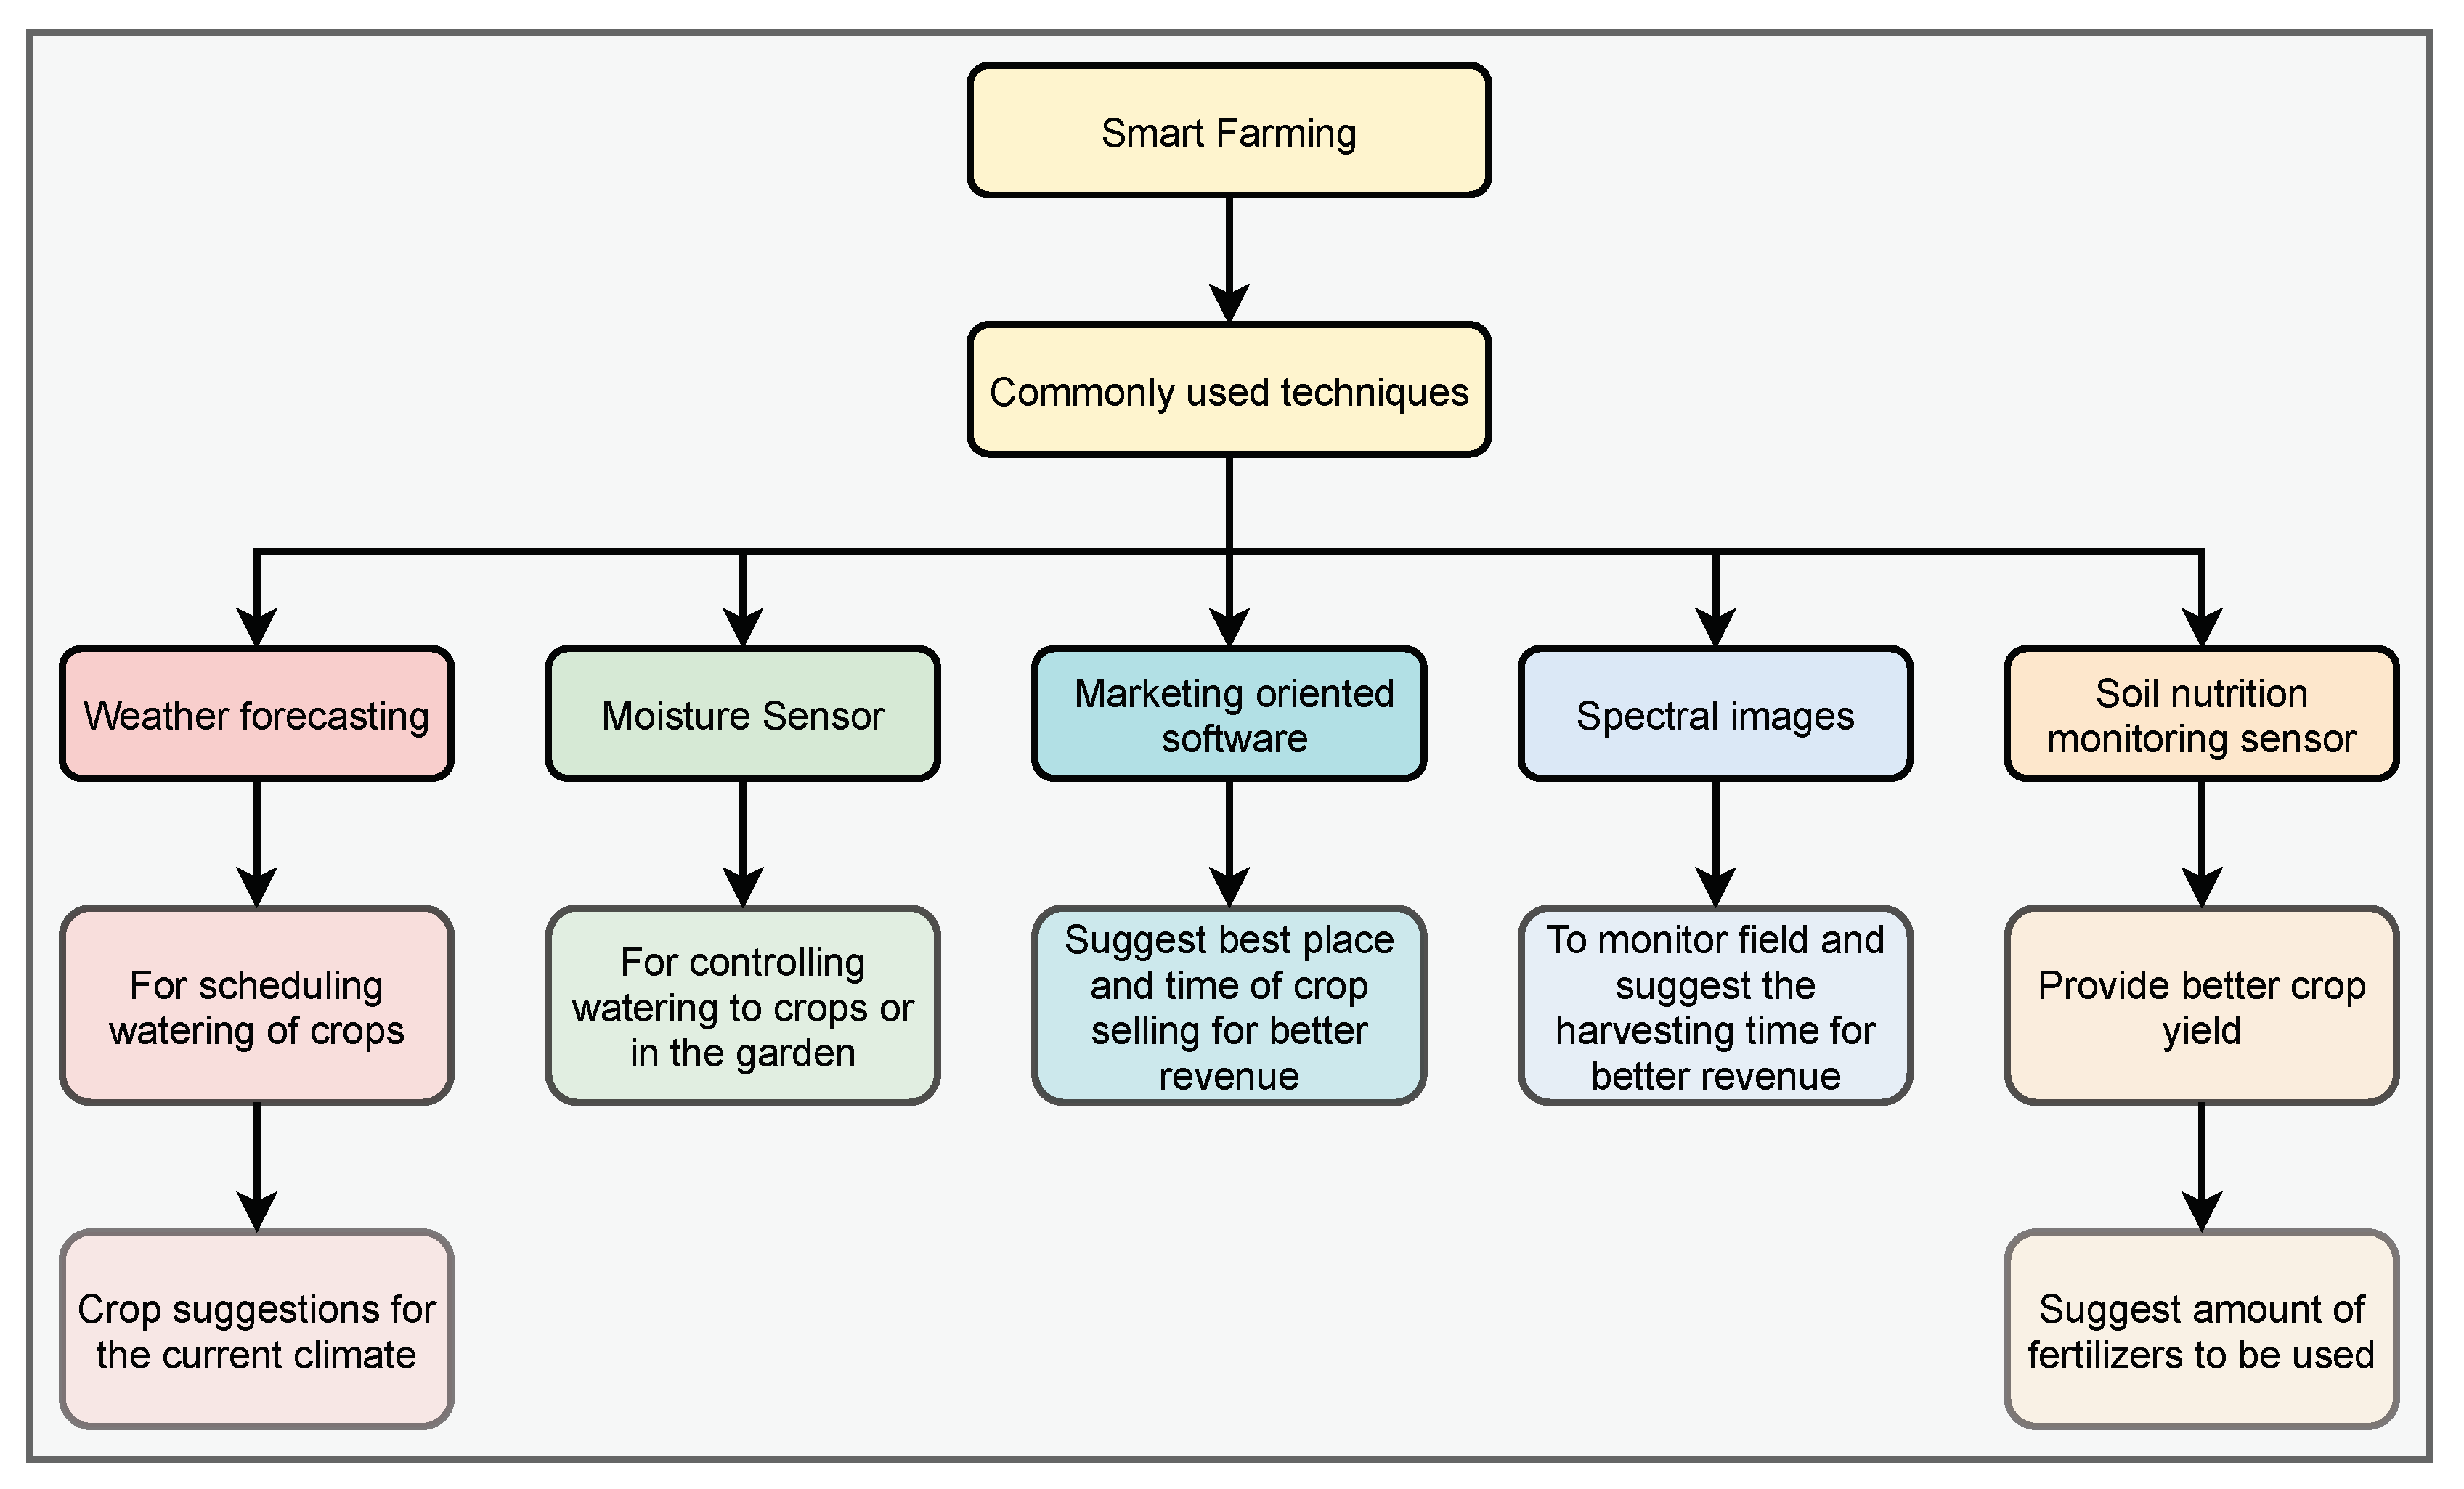
The implementation of SWT is a costly affair [58]. The government can involve the public sector in the development of smart infrastructures in the cities. This will improve the quality of service. In Singapore, the government in collaboration with a private firm known as Water-Wise has taken an initiative to reduce water losses by 50%. Pressure, water flow, pH, and Oxidation-reduction potential (ORP) sensor have been installed to form a smart water grid network [59] as shown in Figure 3.
Water-Wise uses integrated data and electronic alerts system (IDEAS) for water quality assessment, leakage identification, and pressure measurement. The decision support tools module (DSTM) is installed for demand prediction using flow meters to perform pump scheduling optimal operation. Demand predictions allow efficient management of water demand [60]. Transient pressure analysis using wavelets is performed for the detection of burst events. The system is successfully tested for pipeline burst events varying from 7 1 s to 3 1 s .
Classification of burst events from other hydraulic operations such as the closing of valves, pump operation, etc., are some of the observed challenges and concluded as future work. Singapore smart water network [61] does not reduce commercial water losses. Implementations of smart meters have successfully helped in reducing commercial losses in Australia [62] and Kennebec Water District (KWD), USA [63] by creating awareness among the users regarding excess consumptions. Similarly, implementations of smart meters in Singapore will also help in reducing commercial water losses and thus can be seen as future work. Similar smart water monitoring protypes for smart city water monitoring known as Low-Power Wide Area Network (LPWAN) technology is proposed in [64]. The proposed techniques are theoretically well defined but need to be tested on actual cites to identify actual changes.
In many cases, building infrastructure requires high loans at higher interest rates and paying them for a longer period is an important issue. This withdraws the interest of many private firms from investing in pipeline infrastructure. Loans can be provided to water utilities at the lower interest rate for developing water infrastructure. In the USA [65], the United States Environmental Protection Agency (USEPA) has started the Water Infrastructure Finance and Innovation Act (WIFIA) program under which private firms receive loans at a lower rate of interest, for a longer period for developing water infrastructure. This will help to accelerate investment in water infrastructure.

3. Smart Farming

To satisfy the demand of a growing population, it is expected to enhance the crop production by 70%, by 2050 [66]. This indicates an increase in water demands for this additional cultivation of crops. Optimum timing and supply of water and fertilizers are required for the efficient growth of crops. By adopting smart irrigation, water consumption can be reduced. Some of the smart faming technology and their applications can be understand from Figure 4.
Real-time information helps to protect the field from lateral damage. IBM Inc. [67] came up with a smart sensor for smart farming to reduce water usage and to give better revenue at the end. These tools analyze weather, soil qualities such as moisture and humidity content and suggests the crops that can be grown at a given location along with their harvesting time. They provide answers regarding the time and place of selling those crops to earn better revenue. By adopting this smart farming technology, yield can be increased by 8.5%, with a reduction in fuel and water consumption. Dacom [68] in the Netherlands comes up with smart farming devices, that use weather stations, GPS, and moisture sensors to provide information about soil moisture, humidity, etc. The farmer can record water quantity consumed by crops each day. Sensing and supplying only required water to crops helps in saving 20% of the water in the field. The sensor network consumes high energy [69]. Providing electricity to a rural area is itself a challenging task in developing countries such as India, Bangladesh, etc. This makes the deployment of a sensor network to be extremely challenging in such an area. Hence, there is a need for sensor technology that does not consume energy from foreign sources [70]. Edyn garden sensor [71], as shown in Figure 5 is a portable sensor that works fed by solar energy. These sensors can be directly placed in soil. They record humidity, moisture, soil nutrition, and temperature. Depending on the collected data, the sensor will suggest the crops, which are suitable to grow in the field. This sensor communicates with mobile phones and provides information regarding field data. Based on the weather forecast and moisture content in the soil, the Edyn valve sensor can control the time of watering and the time of harvesting of crops. Alerts are sent on mobile if any abrupt changes are observed in the field. Optimized scheduling of water in the gardens will result in a reduction of water and energy consumption.
Abbas et al. [72] have proposed a moisture sensor-based smart garden, in which data is sent to the central location via a radio module. Depending upon the moisture content in the soil, the scheduling of water to plants is decided. This will result in a reduction in water consumption for gardening. Smart farming allows efficient scheduling of fertilizers to crops, which helps in saving agricultural land from lateral damage. Efficient water scheduling in the agricultural field reduces water consumption by 20%. Information regarding the harvesting of crops leads to a better quality of crops, with better revenue generation from them.
Even though there are various smart farming techniques that are available still very less adaption of such technologies are observed [73]. Table 3 shows the comparative study on farmers response on adaptation of smart farming technology. The main reason for dissatisfaction is due to non-accurate predicted weather information. Whereas it is also observed that some of the farmers and not willing to share their field data due to unavailability of legal rules against such field data sharing [74]. This unavailability of data makes it harder for smart farming software to produce accurate results. Some filed surveys can be performed by researchers in order to identify the slow adaption of such useful technologies by farmers. Standardized software for smart farming can be seen as near-future work [75]. Unavailability of wireless, broadband coverage, and energy in a rural area along with the high cost of these devices makes it harder for field implementation in developing countries. Some of the challenges and opportunities related with data security of smart farming against cyber attacks are discussed by Gupta et al. [76].

4. Water Body Monitoring

River water characteristics such as pH value, toxic content, dissolved oxygen, etc. are needed to be tracked down. Floating sensors can be deployed to monitor the water body and their parameters such as temperature, salinity, freshness, contamination, etc. These devices can generate an early alarm during events such as floods, water contamination, increasing toxic content, etc. Skinner et al. [80] have performed temperature monitoring of large water bodies such as rivers, lakes, etc., using hundreds of temperature sensors placed in water bodies, and temperature variations with respect to depth are studied. A noticeable temperature variation of 0.58 C has been observed at a variable depth. The University of California in Berkeley [18,81] came up with a Generation 3 drifter floating sensor to check the salinity of San Joaquin river. This sensor network consists of pressure, salinity sensor, and GPS for communication, as shown in Figure 6. The sensors continuously send the data regarding speed and direction of water flow to the central station, where analysis is performed on collected data to generate the required information. The implementation of sensor technology has shown efficient results for saving aquatic ecosystems by monitoring toxic content. Van et al. [82] have shown usage of ToxProtect sensors for detection of toxic substances present in water bodies such as cyanide but are unable to detect Fluorocetate, which is a kind of super-toxic material, having probable oral lethal dose in humans is less than 5 mg/kg (7 drops) and requiring high maintenance. Zurita et al. [83] have shown the usage of TOXcontrol sensors to monitor the microbiological population present in the water bodies. Measurement of chlorophyll concentration is one way to evaluate the marine ecosystem.
Contamination Identification and Level Monitoring Electronic Display Systems (CILM-EDS) is a prototype developed for central monitoring of water contamination of large water bodies using water imaging. Any suspension contamination is identified and is reported in the central display too [84]. The prototype is still under trials but have shown promising results in identifying the water contamination. Similar prototyping for monitoring water body temperature, pH and dissolve value of small water bodies such as lakes ponds etc is proposed [85]. The devices use solar panel for providing energy harvesting solution for sensors. The results can be monitored via mobile phones as well.
A sensor network [86] of standard ISU/IEC/IEEE 2145 is installed for evaluating water quality at the Apulla region, by monitoring chlorophyll content on the river surface. DSS is used here to take decisions on critical environmental issues. Similar case studies for monitoring of water bodies have been discussed in Murray et al. [87]. Some of the researchers around the world are developing different prototypes. Table 4 highlights some of the similar prototypes proposed in resent scenario.
Sensor technology has made the study of the aquatic ecosystems faster and easier. Storey et al. [88] presented a review on present online water quality monitoring technology in the USA and UK, for monitoring of water bodies such as a rivers, lakes, etc. Maintenance, high-cost device, sensors life (battery) in water, data reliability, and protection from physical damage, can act as challenging issues. Field implementation of such sensor technology needs to be motivated in near future.

5. Smart Water Technology for Water Treatment Plants

Water treatment plant (WTP) is an important infrastructure that provides clean water supply to the locality. To maintain the purity of water, real-time surveillance is required. With the increase in the development of ICT, online monitoring of water quality is possible. It also optimizes the device utilization with real-time alarming by detecting any abrupt changes such as water leakages and its contamination. This smart system provides a solution for efficient management of labourers, which is required for faster pipeline repairing operation.
Different smart water technologies have been provided by the leading industry for better management of water treatment plants. Table 5 highlights some of the technology provided by the world leading industries.
Schneider [22] provided a solution for maintaining water infrastructure by monitoring the quality of water using sensor technology. Additionally, it reduced water losses by detecting pipeline leakages. This saves electricity which is required for pumping and filtering of extra water which lost earlier, thus can reduce carbon footprint and electric bills by 20% and 15%, respectively. It helps manage labours by providing real-time field monitoring in WTP using cameras, thus increases the working efficiency of labors by 25%. IBM and District of Columbia Water and Sewer Authority (DCWASA) [89] work on issues related to the aging water and sewer infrastructure. The software solves issues related to valves, pipeline maintenance, and public fire hazards by providing a real-time mapping application. The system identifies the location in WDS, where maintenance is required. Automated meters installed in WDS have helped reduce water bills. This makes pipeline management faster, easier, and helps in reducing the required manpower. Siemens [90] introduced SIWA sewer, used to regulate wastewater flow by providing even load distribution on the sewage treatment plant. It also provides water quality monitoring with leakage detection in WDS. Combined sewers overflow (CSO) [91] causes pollution in nearby rivers. Schneider came up with a smart system for monitoring of waste and stormwater. Weather prediction is used to identify how much the drainage system can be affected by rainfall, floods (if any), etc. This helps in diluting the stormwater effect and saves sewage infrastructure. All the water waste management industries require high electricity consumption for operation; hence, increases carbon footprint. Using network modeling [22], electricity demand can be reduced by 15%.
Energy harvesting technology needs to be applied to reduce electricity consumption and carbon footprint. Reducing carbon footprint will help in improving the environment. OR waste treatment plant [92] in the city of Gresham, USA generates greater or equal energy used by plants. In 2015, solar panels and biogas generators were installed. The 92% of electricity is generated from biogas and the rest from solar panels, causing the saving of US $500,000 which was earlier invested in paying electricity bills. SWS for WTP provides water quality monitoring, leakage detection and reduces pollution by performing even load distribution on sewage treatment plants. It also increases work efficiency by providing real-time monitoring of workers. WTP consumes high energy; hence, the usage of renewable energy for WTP needs to be motivated. Data analysis from SWS also had a secondary application. Based on the wastewater analysis, China is trying to find out the drug usage in society [93]. They are working towards building a system that will analyze the drug content and based upon the waste locality and the users living near the area it is possible to track the potential drug user.

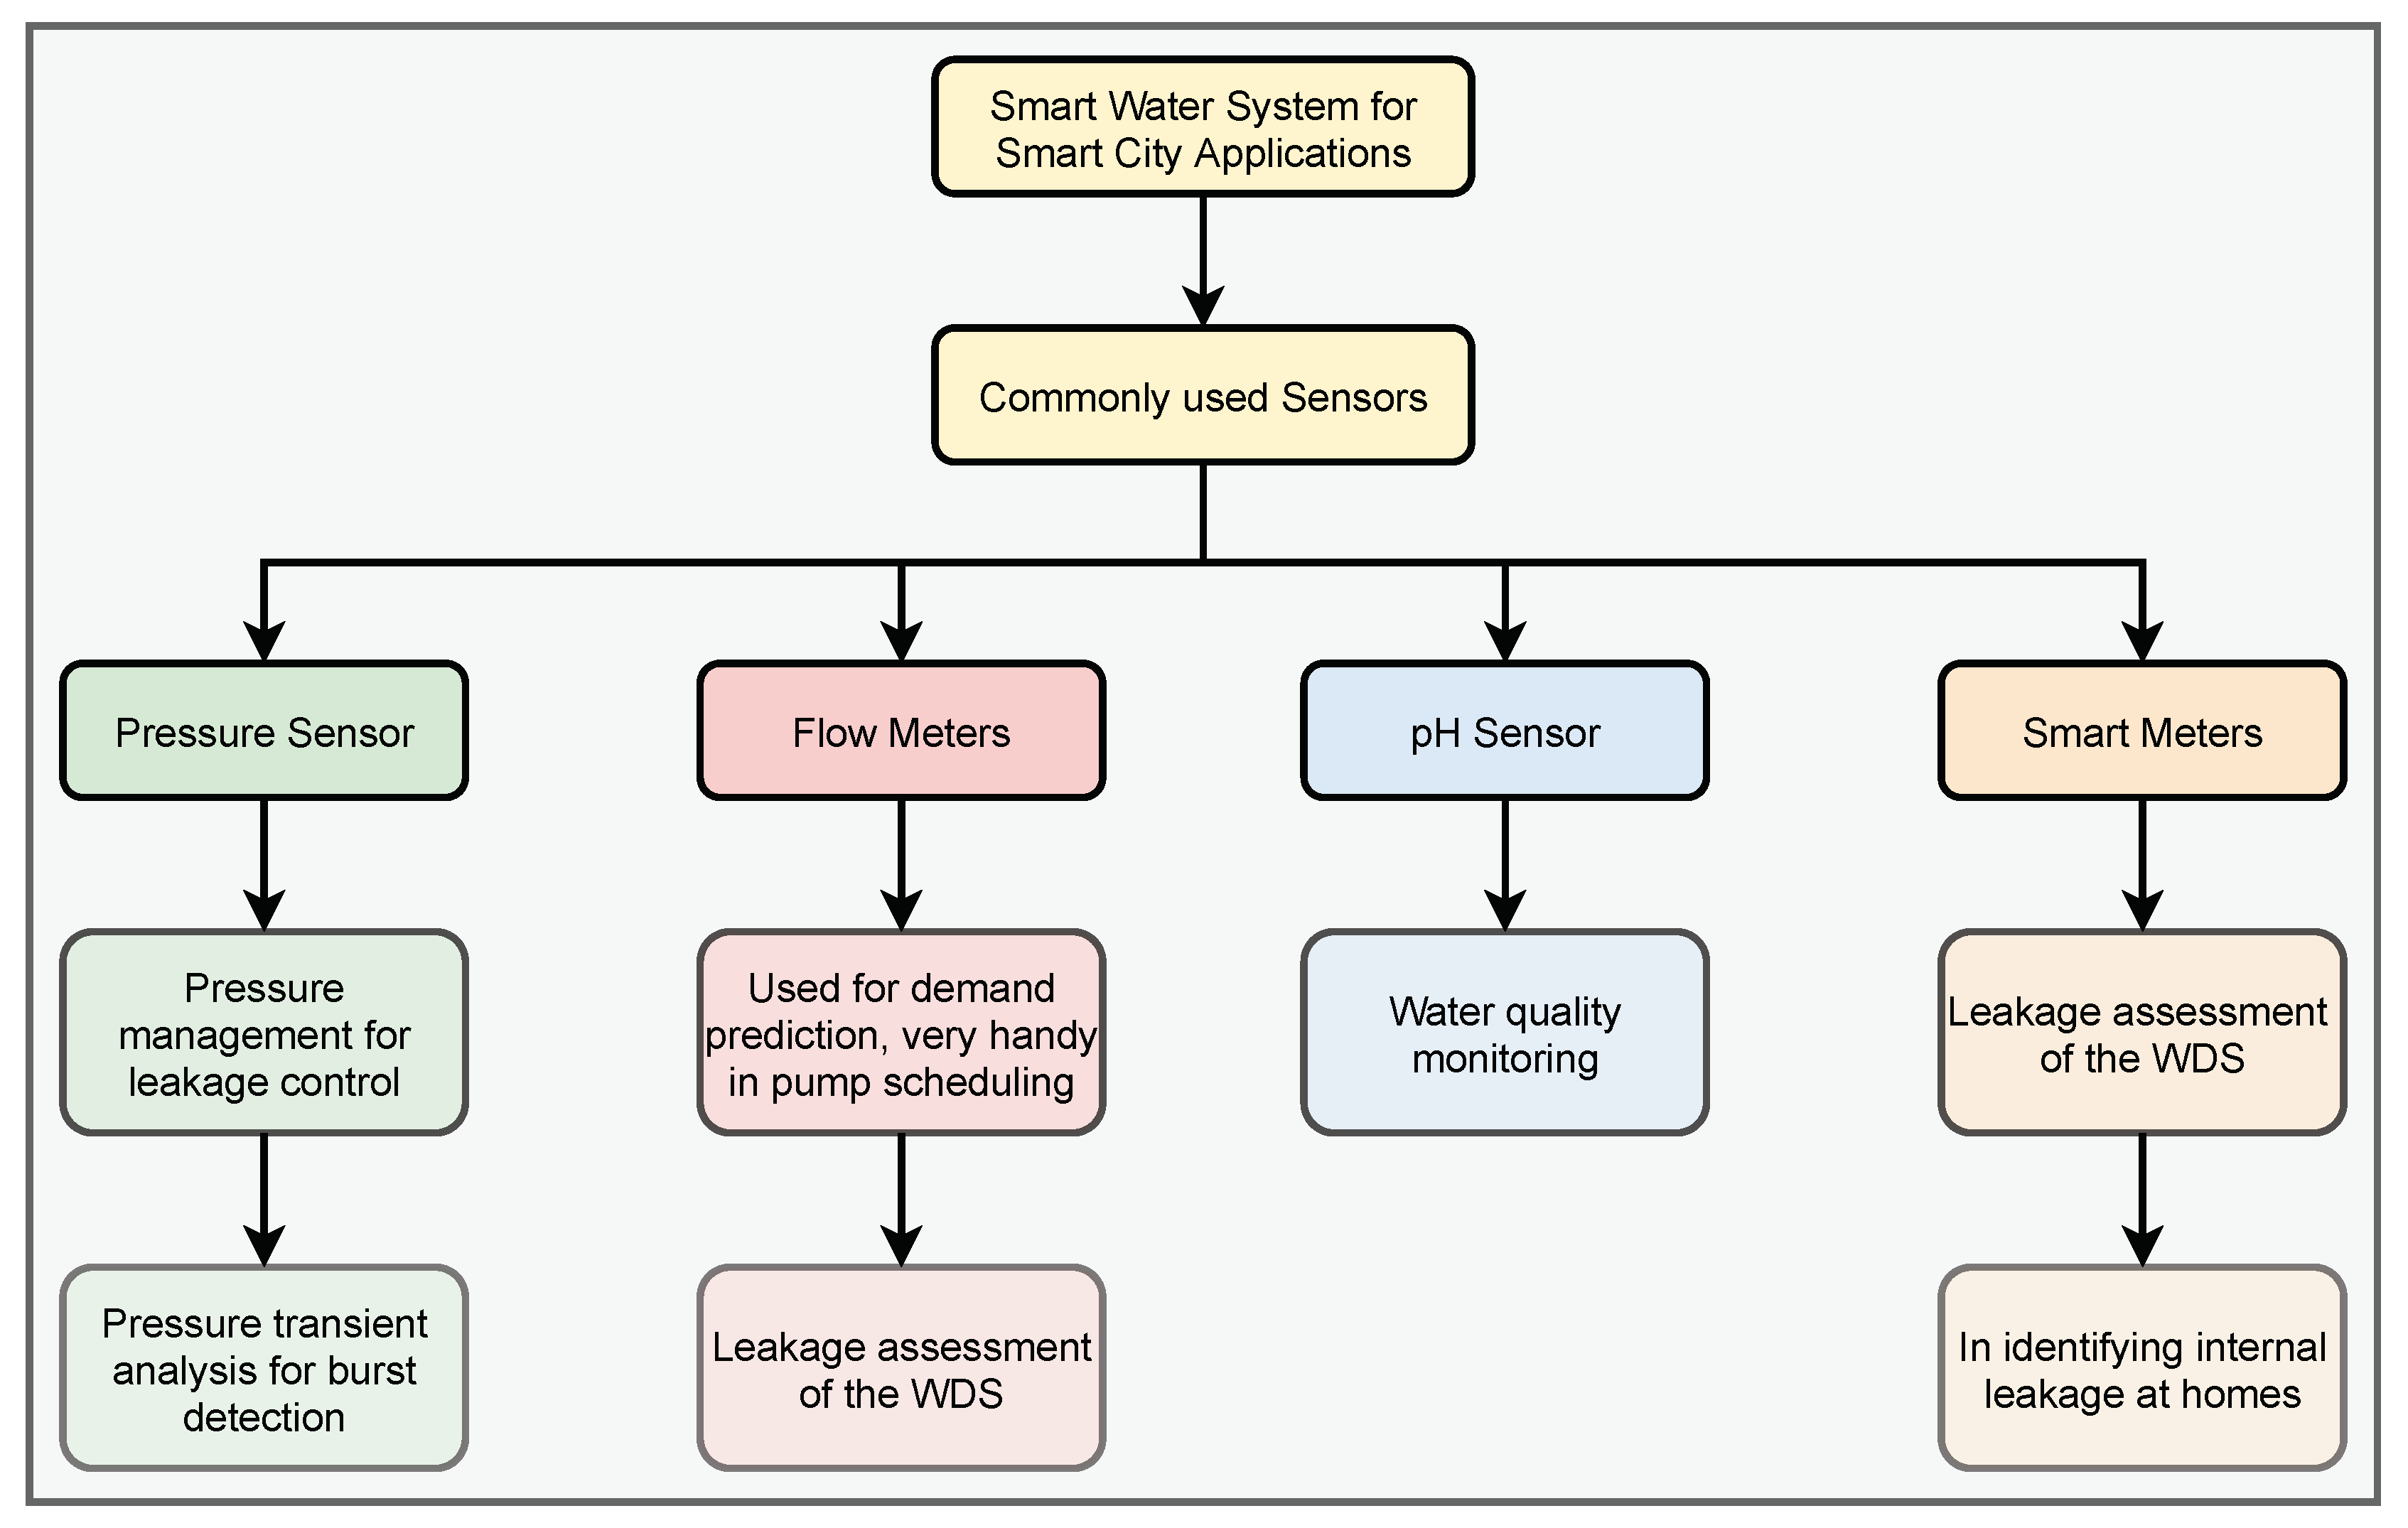
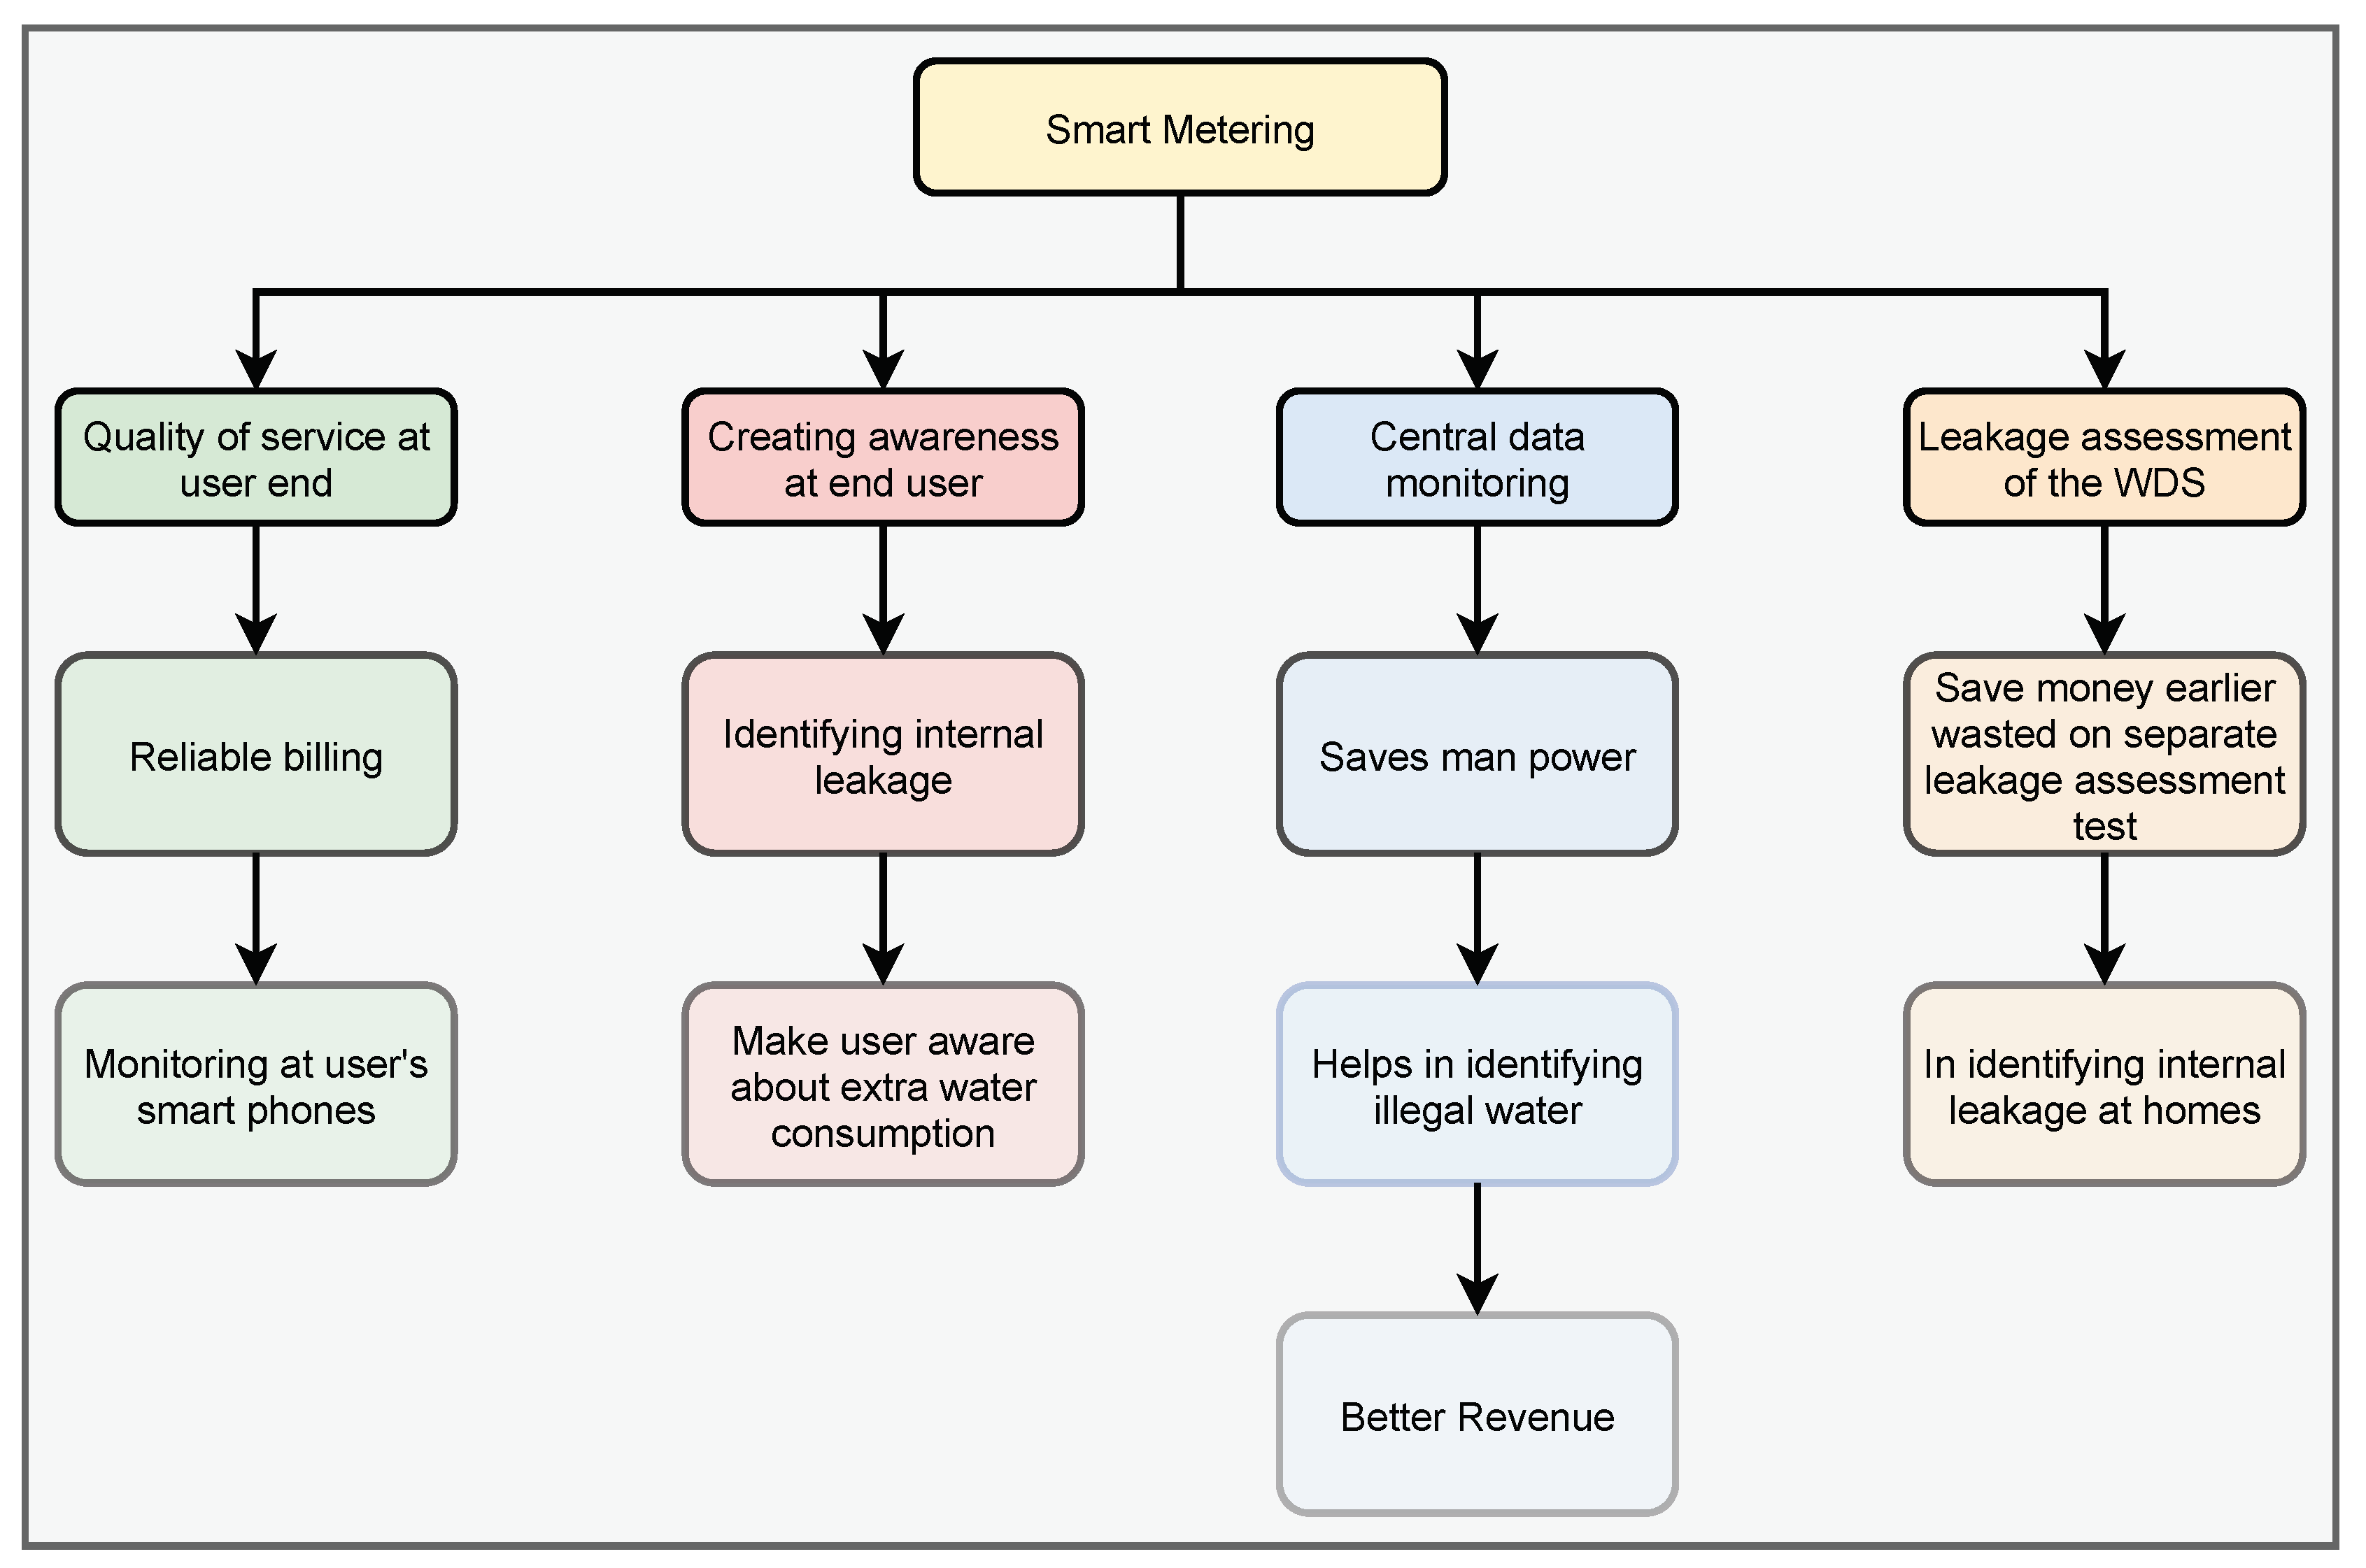
6. Smart Metering for Water Distribution System

Smart water metering is capable of providing early alarming of unusual events such as leakages, high water consumption, etc. from the perspective of the water consumer. Gathered data analysis helps in making decisions regarding intervention policies, pricing strategies, and setting of water usage reduction targets. Some of the other applications along with their advantages of using smart metering can be better understand from Figure 7.
Masia et al. [94] have shown usage of a smart meter for reducing NRW losses and demand management in WDS of Gauteng, South Africa. Smart water metering has created awareness among the 40% of the population regarding excess water consumption by them. Supervisory control and data acquisition (SCADA) [95] is installed for analysis of collected data from a smart meter, in WDS of North Yorkshire, UK to identify burst events by generating alarms. Results show 40% of alarm corresponding to burst events. KWD [63], USA supplies 1.2 gallons of water per day to 23,000 customers. KWD suffers from challenges such as handling of water meter reading and labor cost. KWD installed advanced metering infrastructure (AMI) at homes, which can communicate in two directions. It can communicate or issuance of command or price signal from the utility to the meter and on other hand, they communicate water consumption data, etc. to the utility. They provide water consumption data to consumers, making them aware regarding water usage. This results in an improvement in the quality of WDS services, with a reduction in manpower, and can solve leakage problems (including commercial losses) more easily. A smart water grid [96] prototype has been developed for smart cities. Data transmission from a smart meter, flow, and pH sensor is done at 169 MHz. The microcontroller MSP430M has been used to collect the data and control the operation at the receiving end. This increases the user’s awareness and will improve the efficiency of the water grid infrastructure and its management.
South-east-Queensland residency end-user study (SEQREUS) was performed in winter 2010 [97] to analyze the water demand pattern and to increase the awareness among people regarding water consumption. As a result of this study, many consumers have started using water efficient washing machines leading towards a reduction of water consumption causing estimated annual savings of US$ 45,000. Smart meters were installed in 337 homes in Melbourne city, during winter 2010 and summer 2012 in order to estimate daily water consumption by individuals [62]. It was observed that during summer, the city had a water consumption rate of 149 l/capita/day while in winter, it was reduced to 117 l/capita/day. More water is usually consumed in irrigation, evaporative cooler, and toilets during the summer season, which increases water demand. Wang et al. [98] have proposed an algorithm to predict water usage activities based on smart meter readings. Loureiro et al. [99] have used smart meter readings from 311 houses to identify low, medium, and high water consumption groups. A daily water consumption pattern in the district was estimated based on measured data. Gurung et al. [100] developed a simulator which models the water system with more operational variables, making the implementation of ICT devices easier in WDS. This study has shown the usage of smart meters for calculating average and peak demand for maintaining optimal pressure in WDS which results in a reduction of leakages. Thus, a smart meter can be seen as a perfect tool for identification of demand in WDS. DMA requires high-resolution and costly devices for monitoring purposes. The high implementation cost of these smart meters makes them difficult to be used in many countries. A conventional mechanical water meter is installed in older WDS of some countries. Conversion of such mechanical meters into smart meters will lead to an improvement in the quality of services and reduction of manpower for data collection, particularly in underdeveloped or in developing countries. A novel mechanical meter [101] having an additional circuit is used as a smart meter in Japan. Reading on meters acts as a sensing pad (Figure 8). Water is filled inside the device, which acts as a capacitive medium between the arrow and sensing pad. A code is generated whenever the pointing arrow is above the sensing pad. The data is collected in the microprocessor. GPRS is used to transmit signals to the control room. [102] have proposed other low cost wireless smart meters based on ZigBee. All the devices present in a predefined area transfer meter reading to the master node which sends data to the central processing center, where data analysis is performed.
Smart meter failure will lead to the creation of uncertainties related to water loss in WDS, thus a proper replacement is required. Ref. [103] have proposed an algorithm to suggest the optimum replacement time of smart meters. Similar case studies on smart meters with their benefits and challenges are also discussed in [104,105]. Various available smart water technologies have been discussed in a report by Oxford [50]. Smart meters will lead to an improvement in the quality of services, data reliability, and reduction of manpower during operations of data collection [63]. Leakage assessment can be performed more efficiently on WDS using a smart meter [30]. A smart meter provides additional information regarding post meter leakages known as commercial losses [50] and helps in predicting demand variations [106]; detection of leakages [95], which leads to a reduction of water losses in WDS. It increases awareness among consumers regarding water consumption [97]. This awareness can reduce water consumption which can cause estimated annual savings of US$ 45,000 for developed countries such as Australia. Smart meter [104] suffers from challenges such as privacy of data, interference with other electronic devices, power consumption, high cost, low accuracy at low flow, and uncertainties related to water loss due to failed meters. Other challenges while deployment of smart meters in water infrastructures can be found in the study given by [107]. The study proposes fog computing paradigm for SWS to reduce the data volume exchanged between the different system layer. Universal metering can be seen as one future task for improvement of leakage assessment in WDS.

7. Standardization of Hydro-Meteorological Data Format

Most countries have their own standard data formats for sending meteorological data; this makes data exchanging difficult among different nations [108]. Much less effort has been made on a global level for data standardizations [109]. The data format used for sending hydro-meteorological data such as weather, annual rainfall, condition of water resources, etc., needs to be standardized at a global level. In January 2010 [110], the World Meteorological Organization (WMO) together with the Open Geospatial Consortium (OGC) decided to work jointly to develop water markup language 2.0 (Water ML.2.0). It will be an international standard data format that will be used during the exchange of geospatial hydro-meteorological observations and data measurements with other meteorological communities of the world. Initially, an OGC encoding standard was developed for the representation of time series hydrological observations. This standard will be used during the exchange of rating data such as discrete river discharge flow measurements, etc. Underwater ML 2.0, Water Information Research and Development Alliance (WIRADA) in Australia started developing an interim data encoding standard based on the OGC standard data encoding, known as water data transfer format (WDTF). This will be used for delivering Australian water information (data measurements) to the Bureau of Meteorology (BoM), Australia. A report on successful completion of 10 years of ML. 2.0 concluded that the standardization has helped different water agencies such as National Meteorological and Hydrological Services (NMHSs) and WMO to improve the water management due to standardization of data format making easy exchange of data possible [111].

8. Constraints

This section is discussing various constraints associated with smart water technologies.

8.1. Constraints from Society

Adoption of smart water technology not just faces technical and research-oriented constraints but also from financial constraints such as lack of funding. Even though funds are available, many a times, there is no proper technical support (depending upon geographical locations), which is required to successfully maintain such technology. The decision regarding opting for such technology for the betterment of the city, depends on the local governance. Therefore, lack of understanding in local governance may deprive its citizens to take advantage of such technologies [112].
Data security is another risk which restricts individual from using smart water technology such as at homes for personal awareness or the sensors used in farms. The users might afraid of the usage of personal data stored on the cloud [113]. The data can be misused by some third person. Laws need to be created by governments, which will restrict the industry from misusing the personal data by firms or through cyber-attack [114]. One such example is observed in Queensland, Australia where an unauthorized user has taken the control of the SCADA system and has released 80,000 L of raw sewage into the surrounding water system [115]. The industry needs to update the security system for finding the unauthenticated users and can send regular software updates to the individual to improve the security of the system. This will also improve the trust of the individual over firms and motivate them to implement such technology in near future [116].

8.2. Social-Technical Constraints

Real-world is made from components such as people, governments, different communities, etc. There are many social components involved while implementing smart technology in the city for example for developing cities, building proper toilets for sanitation will be more essential and prioritized work for water industries than the implementation of a smart sensor network in the water system [117]. Therefore, the local challenges may act as a barrier while implementing such technologies in the real world. Similar social-technical constraints were analyzed in the smart city project of Songdo and PlanIT Valley in South Korea and Portugal, respectively [118]. It is observed that community and political support over a longer period is more required than the presence of an innovative environment for faster development and implementations of such technologies. It is observed in Europe and North America that smart system implementations involve resistance from society as they believe such technology neglects environmental protection, technology is more for the rich people rather than every citizen as they fail to solve their daily life problems [119]. Keeping transparency about the failures of smart water technology to the citizens along with success stories and the differences created by such technology in the citizen’s life. This will help in understanding the technologies and creating awareness among the citizens [120].

9. Conclusions

Water scarcity is a serious issue in many parts of the world and it needs attention. Using sensor technology, SWS provides online monitoring which helps in managing water resources more efficiently. SWT performs analysis on sensor data for optimal pressure management and detection of commercial water losses and pipeline leakages, which leads to a reduction of water losses in WDS. Water, which gets lost earlier due to commercial and physical losses, can be utilized to serve the people deprived form it. This can lead to reducing water scarcity worldwide. SWS improves WDS services by performing efficient labor management. It also indicates the location of WDS where pipeline maintenance is required. Smart farming increases the yield of the agricultural field. Based on weather studies and information regarding moisture and nutrient content in the soil, watering and fertilization scheduling in the agricultural field is decided by sensors, which can reduce water consumption by 20% and saves agricultural land from lateral damage. The sensor can act as a catalyst for monitoring toxic and chlorophyll content, present in water bodies. It makes monitoring possible even during adverse conditions such as monitoring at a greater depth of water bodies. These devices help in reducing water pollution by maintaining an equal load on sewage treatment plants. Installation of smart meters in WDS will lead to an improvement in the quality of services, data reliability, and reduction of manpower for meter reading and data collection. Leakage assessment can be performed more efficiently on WDS using SWT. Thus, smart technology is capable of replacing DMA methodology in the near future for leakage assessment and detection. Use of smart water technology can help in improving the ecosystem by reducing the carbon and water foot prints. Based on the literature review being discussed, the following are the challenges and future scope that needs to be resolved:
  • Leakage detection using online monitoring has taken leakage management to a higher level. SWT technology suffers from false alarms due to the presence of different operations such as valve opening and closing, pump operation, etc. Researchers need to rectify this by differentiating the burst event from different hydraulic operations such as valve closing, pump switching, etc. Pinpointing the exact location is still difficult. The present system has a localization error of 50 m. There is a scope of improvement in the localization techniques. A device that will rectify commercial losses such as internal leakages from houses is needed to be developed.
  • ITA has shown some success in recent past in-field implementation of leakage detection. Leakage detection techniques such as TDA and IRA need to be encouraged towards field implementation. Wavelet transforms have proven to be efficient tools for burst detection in WDS using pressure transient analysis. Other transforms such as the Hilbert transform, Teager energy operator (TEO) are yet to be explored for transient analysis. Kalman filters and ANN have been widely used for the prediction of abnormalities in WDS but support vector machine (SVM) can be seen as an alternative in the near future.
  • Based on the collected data from sensors, prediction modeling can be used to predict maintenance operations such as pipeline replacement, bursting of the pipeline. This will lead to further improvement in WDS services along with a reduction in manpower and maintenance costs. Failures in predictions may leads to some devastating results. Thus, there is scope of improvement in the field of predictions. Hence, more accurate predictions algorithms needs to be developed. Such prediction algorithms can be developed in the near future and can be field specified only.
  • Millions of sensors will consume lots of energy; providing electricity to a rural area is itself a challenging task in developing countries of Asia and Africa. This makes the deployment of a sensor network challenging in such rural areas for efficient farming. Farming sensors based on energy harvesting need to be developed in the future for smart farming [121]. To protect sensors from physical damage is a challenging task for water industries.
  • Universal smart water metering can be seen as an important leakage assessment technique at the user’s end. This will make the consumer more aware of internal leakages and excess water consumption.
  • The use of different data formats for sending hydro-meteorological data may act as a barrier while exchanging data at a global level. Hence, standardization of data format for sending meteorological data is needed to be done along with their adoption at a global level. This will make data exchange convenient and data can be easily used further by research communities in different countries.
  • Dynamic allocation of sensors and extracting data from dynamic sensors is a challenging task. Lots of research work is still needed to be done for the algorithmic development of dynamic sensor allocation. Wireless transmission of data from the sensor may cause interference with other devices. A dedicated frequency band should be allocated for transmission of data from smart water devices to avoid interference with other devices.
  • Billions of data points will be generated from sensors; handling such massive data in the control center, and assuring to maintain privacy is still a challenging task. To generate useful information from these collected data, big data analysis can be a step that researchers can look to work in the near future. Modification of the MAC layer in network architecture can be seen as future work to increase data reliability and privacy.
  • Smart water devices must have a common standardized module and platform so that machine to machine communication can be established among them. Work should be done in the standardization of the platform and module to be used in smart water devices. The development of smart portable devices can be an area which researchers can look into.
  • The use of SWT for WDS, agriculture, industry, etc. in many countries is a challenging task due to some poor economies. There is a need for low cost and low maintenance SWS which is simple in-field implementation and has high efficiency in terms of data reliability and privacy.
  • Several techniques are proposed in the literature but their field implementation and their results are rarely analyzed. Thus, more collaboration between research institutes and the water industry needs to be done to feel this gap of absence of actual field implementation of various valuable proposed techniques.
  • Standardization of data format i.e., use of Water Mark UP language 2.0 has made data exchange easier between different water authorities. This data availability helps water authorities to perform efficient data analysis to get more accurate results which leads to better management of water resources.
  • Selling of SWT-based products and making them acceptable by society is going to be a challenging task. Some awareness needs to be created among people regarding the advantages of such devices.
  • It is important to know the state-of-the-art in the working field. A common platform needs to be made where information can be shared. A smart water forum has been developed (SWAM) which consists of members from different industries. The idea behind this forum is to share new research so that joint efforts can be made. This can act as a good platform for new researchers.
  • Reliability, privacy, and synchronization of sensor data may act as a challenging task when it comes to field implementation.
This review has summarised the work carried out by various researchers related to SWT, associated problems, and their solutions, in the last two decades. This can help researchers working in smart water technology to identify their problem statements.

Author Contributions

Conceptualization, A.D.G., A.F. and N.D.B.; methodology, A.D.G., P.P. and A.F.; software, A.D.G., Z.M.Y. and N.D.B.; validation, A.F., Z.M.Y. and N.D.B.; formal analysis, P.P. and A.F.; investigation, A.D.G., A.F., Z.M.Y. and N.D.B.; resources, Z.M.Y. and N.D.B.; data curation, A.D.G., P.P., A.F. and N.D.B.; writing–original draft preparation, A.D.G., A.F. and N.D.B.; visualization, A.D.G., A.F. and N.D.B.; supervision, A.F., Z.M.Y. and N.D.B.; project administration, A.D.G. and N.D.B.; funding acquisition, N.D.B. All authors have read and agreed to the published version of the manuscript.

Funding

This research received no external funding.

Conflicts of Interest

The authors declare no conflict of interest.

References

  1. De Albuquerque, C.; Leo, H. Common Violations of the Human Rights to Water and Sanitation, United Nations Human Rights Report. 2014. Available online: https://www.ohchr.org/EN/Issues/WaterAndSanitation/SRWater/Pages/CommonHRViolations.aspx (accessed on 30 September 2020).
  2. Gupta, A.; Mishra, S.; Bokde, N.; Kulat, K. Need of smart water systems in India. Int. J. Appl. Eng. Res. 2016, 11, 2216–2223. [Google Scholar]
  3. Liemberger, R.; Wyatt, A. Quantifying the global non-revenue water problem. Water Supply 2019, 19, 831–837. [Google Scholar] [CrossRef]
  4. Bank, W. The World Bank Annual Report 2020; The World Bank: Washington, DC, USA, 2020. [Google Scholar]
  5. Plath, M.; Ernst, M.; Wichmann, K. Energy efficiency and energy saving in the German water industry. Water Pract. Technol. 2014, 9, 256–263. [Google Scholar] [CrossRef]
  6. Paliwal, V.; Ghare, A.D.; Mirajkar, A.B.; Bokde, N.D.; Feijoo Lorenzo, A.E. Computer Modeling for the Operation Optimization of Mula Reservoir, Upper Godavari Basin, India, Using the Jaya Algorithm. Sustainability 2020, 12, 84. [Google Scholar] [CrossRef] [Green Version]
  7. Pandey, P.; Dongre, S.; Gupta, R.; Bokde, N. Hybrid models for water demand forecasting. J. Water Resour. Plan. Manag. 2020. [Google Scholar] [CrossRef]
  8. Kim, K.G. Development of an integrated smart water grid model as a portfolio of climate smart cities. J. Smart Cities 2019, 3, 23–34. [Google Scholar]
  9. Association, A.W.W. Water Audits and Loss Control Programs: M36; AWWA Manual of Practice; American Water Works Association: Washington DC, USA, 2008. [Google Scholar]
  10. Committee, A.W.L.C. Committee Report: Applying worldwide BMPs in water loss control. J. Am. Water Work. Assoc. 2003, 95, 65–79. [Google Scholar] [CrossRef]
  11. Fan, C.; Sun, F.; Yang, L. Investigation on nondestructive evaluation of pipelines using infrared thermography. In Proceedings of the 2005 Joint 30th International Conference on Infrared and Millimeter Waves and 13th International Conference on Terahertz Electronics, Williamsburg, VA, USA, 19–23 September; Volume 2, pp. 339–340.
  12. Colombo, A.F.; Lee, P.; Karney, B.W. A selective literature review of transient-based leak detection methods. J. Hydro-Environ. Res. 2009, 2, 212–227. [Google Scholar] [CrossRef]
  13. Wu, Z.Y.; Farley, M.; Turtle, D.; Kapelan, Z.; Boxall, J.; Mounce, S.; Dahasahasra, S.; Mulay, M.; Kleiner, Y. Water Loss Reduction; Bentley Institute Press: Exton, PA, USA, 2011. [Google Scholar]
  14. Puust, R.; Kapelan, Z.; Savic, D.; Koppel, T. A review of methods for leakage management in pipe networks. Urban Water J. 2010, 7, 25–45. [Google Scholar] [CrossRef]
  15. Mutikanga, H.E.; Sharma, S.K.; Vairavamoorthy, K. Methods and tools for managing losses in water distribution systems. J. Water Resour. Plan. Manag. 2013, 139, 166–174. [Google Scholar] [CrossRef]
  16. Bhagat, S.K.; Welde, W.; Tesfaye, O.; Tung, T.M.; Al-Ansari, N.; Salih, S.Q.; Yaseen, Z.M. Evaluating physical and fiscal water leakage in water distribution system. Water 2019, 11, 2091. [Google Scholar] [CrossRef] [Green Version]
  17. Britto, J. IoT Sensors for Smart Farming; Senseye: Southampton, UK. Available online: http://info.senseye.io/blog/internet-of-things-sensors-for-smart-farming (accessed on 10 August 2020).
  18. Weekly, K.P. Applied Estimation of Mobile Environments. Ph.D. Thesis, University of California, Berkeley, CA, USA, 2014. [Google Scholar]
  19. Ramos, H.M.; McNabola, A.; López-Jiménez, P.A.; Pérez-Sánchez, M. Smart water management towards future water sustainable networks. Water 2020, 12, 58. [Google Scholar] [CrossRef] [Green Version]
  20. Muñoz, M.; Gil, J.D.; Roca, L.; Rodríguez, F.; Berenguel, M. An IoT Architecture for Water Resource Management in Agroindustrial Environments: A Case Study in Almería (Spain). Sensors 2020, 20, 596. [Google Scholar] [CrossRef] [PubMed] [Green Version]
  21. Tiyasha; Tung, T.M.; Yaseen, Z.M. A survey on river water quality modelling using artificial intelligence models: 2000–2020. J. Hydrol. 2020, 585, 124670. [Google Scholar] [CrossRef]
  22. Schneider. Water and Wastewater Industry Solutions; Schneider: Rueil-Malmaison, France; Available online: http://www.schneider-electric.com/b2b/en/solutions/for-business/water/explore-ouroffer/index.jsp?segment=4873004 (accessed on 10 August 2020).
  23. Gupta, A.; Kulat, K. A selective literature review on leak management techniques for water distribution system. Water Resour. Manag. 2018, 32, 3247–3269. [Google Scholar] [CrossRef]
  24. Lambert, A.; Hirner, W. Losses from Water Supply Systems: Astandard Terminology and Recommended Performance Measures; IWA: London, UK, 2000. [Google Scholar]
  25. Liemberger, R.; Farley, M. Developing a Nonrevenue Water Reduction Strategy Part 1: Investigating and Assessing Water Losses; Paper to IWA Congress: Marrakesh, Morocco, 2004. [Google Scholar]
  26. Farley, M.; Trow, S. Losses in Water Distribution Networks; IWA Publishing: London, UK, 2003. [Google Scholar]
  27. Ozevin, D.; Harding, J. Novel leak localization in pressurized pipeline networks using acoustic emission and geometric connectivity. Int. J. Press. Vessel. Pip. 2012, 92, 63–69. [Google Scholar] [CrossRef]
  28. Farley, M. Finding ‘Difficult’ Leaks; International Water Association Specialist Group–Efficient Operation and Management: London, UK, 2008. [Google Scholar]
  29. Whittle, A.J.; Allen, M.; Preis, A.; Iqbal, M. Sensor networks for monitoring and control of water distribution systems. In Proceedings of the 6th International Conference on Structural Health Monitoring of Intelligent Infrastructure (SHMII 2013), Hong Kong, China, 9 December 2013. [Google Scholar]
  30. Savic, D.; Boxall, J.; Ulanicki, B.; Kapelan, Z.; Makropoulos, C.; Fenner, R.; Soga, K.; Marshall, I.; Maksimovic, C.; Postlethwaite, I.; et al. Project Neptune: Improved operation of water distribution networks. In Water Distribution Systems Analysis 2008; ASCE library: Reston, VA, USA, 2008; pp. 1–16. [Google Scholar] [CrossRef] [Green Version]
  31. Savić, D.; Ferrari, G. Design and performance of district metering areas in water distribution systems. Procedia Eng. 2014, 89, 1136–1143. [Google Scholar] [CrossRef] [Green Version]
  32. Gurung, T.R.; Stewart, R.A.; Beal, C.D.; Sharma, A.K. Smart meter enabled water end-use demand data: Platform for the enhanced infrastructure planning of contemporary urban water supply networks. J. Clean. Prod. 2015, 87, 642–654. [Google Scholar] [CrossRef] [Green Version]
  33. Stoianov, I.; Nachman, L.; Madden, S.; Tokmouline, T. PIPENET: A wireless sensor network for pipeline monitoring. In Proceedings of the 6th International Conference on Information Processing in Sensor Networks, Cambridge, MA, USA, 25–27 April 2007; pp. 264–273. [Google Scholar]
  34. Mounce, S.; Pedraza, C.; Jackson, T.; Linford, P.; Boxall, J. Cloud based machine learning approaches for leakage assessment and management in smart water networks. In Procedia Engineering; Elsevier: Amsterdam, The Netherlands, 2015; Volume 119, pp. 43–52. [Google Scholar] [CrossRef] [Green Version]
  35. Liggett, J.A.; Chen, L.C. Inverse transient analysis in pipe networks. J. Hydraul. Eng. 1994, 120, 934–955. [Google Scholar] [CrossRef]
  36. Duan, H.F.; Lee, P.J.; Ghidaoui, M.S.; Tung, Y.K. Leak detection in complex series pipelines by using the system frequency response method. J. Hydraul. Res. 2011, 49, 213–221. [Google Scholar] [CrossRef]
  37. Gupta, A.; Kulat, K. Pipeline Burst Detection and its localization using Pressure Transient Analysis. In Proceedings of the International Conference on Paradigms of Computing, Communication and Data Sciences, Kurukshetra, India, 1–3 May 2020; pp. 1–9. [Google Scholar]
  38. Haghighi, H.; Covas, C.; Ramos, H. Modified Inverse Transient Analysis for Leak Detection of Pressurized Pipes; BHR Group Pressure Surges: Chester, UK, 2012. [Google Scholar]
  39. Public Utilities Board Singapore. Managing the water distribution network with a Smart Water Grid. Smart Water 2016, 1, 4. [Google Scholar] [CrossRef] [Green Version]
  40. Lee, S.J.; Lee, G.; Suh, J.C.; Lee, J.M. Online burst detection and location of water distribution systems and its practical applications. J. Water Resour. Plan. Manag. 2016, 142, 04015033. [Google Scholar] [CrossRef]
  41. Wang, X.J.; Lambert, M.F.; Simpson, A.R.; Liggett, J.A.; V ı tkovskỳ, J.P. Leak detection in pipelines using the damping of fluid transients. J. Hydraul. Eng. 2002, 128, 697–711. [Google Scholar] [CrossRef] [Green Version]
  42. Kim, S.H. Extensive development of leak detection algorithm by impulse response method. J. Hydraul. Eng. 2005, 131, 201–208. [Google Scholar] [CrossRef]
  43. Tucciarelli, T.; Criminisi, A.; Termini, D. Leak analysis in pipeline systems by means of optimal valve regulation. J. Hydraul. Eng. 1999, 125, 277–285. [Google Scholar] [CrossRef]
  44. Ye, G.; Fenner, R.A. Kalman filtering of hydraulic measurements for burst detection in water distribution systems. J. Pipeline Syst. Eng. Pract. 2011, 2, 14–22. [Google Scholar] [CrossRef]
  45. Rice, D.C.; Carriveau, R.; Ting, D.S.K. Commercial greenhouse water demand sensitivity analysis: Single crop case study. Water Sci. Technol. Water Supply 2016, 16, 1185–1197. [Google Scholar] [CrossRef]
  46. Gupta, A.; Bokde, N.; Kulat, K. Hybrid leakage management for water network using PSF algorithm and soft computing techniques. Water Resour. Manag. 2018, 32, 1133–1151. [Google Scholar] [CrossRef]
  47. Bokde, N.; Feijóo, A.; Kulat, K. Analysis of differencing and decomposition preprocessing methods for wind speed prediction. Appl. Soft Comput. 2018, 71, 926–938. [Google Scholar] [CrossRef]
  48. Bokde, N.; Asencio-Cortés, G.; Martínez-Álvarez, F.; Kulat, K. PSF: Introduction to R Package for Pattern Sequence Based Forecasting Algorithm. R J. 2017, 9, 324–333. [Google Scholar] [CrossRef] [Green Version]
  49. Bokde, N.; Asencio-Cortes, G.; Martinez-Alvarez, F. PSF: Forecasting of Univariate Time Series Using the Pattern Sequence-Based Forecasting (PSF) Algorithm; R Package Version 0.4. 2017. Available online: https://CRAN.R-project.org/package=PSF (accessed on 10 August 2020).
  50. Hope, R.; Foster, T.; Money, A.; Rouse, M.; Money, N.; Thomas, M. Smart Water Systems. In Project Report to UK DFID; Oxford University: Oxford, UK, April 2011. Available online: https://assets.publishing.service.gov.uk/media/57a08ab9e5274a31e000073c/SmartWaterSystems_FinalReport-Main_Reduced__April2011.pdf (accessed on 10 August 2020).
  51. Kumar, S.; Yadav, S.; Yashaswini, H.; Salvi, S. An IoT-Based Smart Water Microgrid and Smart Water Tank Management System. In Emerging Research in Computing, Information, Communication and Applications; Springer: Berlin, Germany, 2019; pp. 417–431. [Google Scholar]
  52. Covelli, C.; Cimorelli, L.; Cozzolino, L.; Della Morte, R.; Pianese, D. Reduction in water losses in water distribution systems using pressure reduction valves. Water Sci. Technol. Water Supply 2016, 16, 1033–1045. [Google Scholar] [CrossRef] [Green Version]
  53. Raleigh, N.C. Water 20/20: Bringing Smart Water Networks into Focus; Sensus: Morrisville, NC, USA; Available online: http://sensus.com/documents/10157/1577608/Sensus_Water2020-USweb.pdf/d67d0a75-255a-4a20-86f1-d4548bfcdf78 (accessed on 10 August 2020).
  54. Bakker, M.; Rajewicz, T.; Kien, H.; Vreeburg, J.; Rietveld, L. Advanced control of a water supply system: A case study. Water Pract. Technol. 2014, 9, 264–276. [Google Scholar] [CrossRef] [Green Version]
  55. Di Nardo, A.; Di Natale, M.; Greco, R.; Santonastaso, G. Ant algorithm for smart water network partitioning. Procedia Eng. 2014, 70, 525–534. [Google Scholar] [CrossRef] [Green Version]
  56. Di Nardo, A.; Giudicianni, C.; Greco, R.; Herrera, M.; Santonastaso, G.F.; Scala, A. Sensor placement in water distribution networks based on spectral algorithms. In Proceedings of the 13th International Conference on Hydroinformatics (HIC2018), Palermo, Italy, 1–5 July 2018; Volume 7. [Google Scholar]
  57. Shahra, E.Q.; Wu, W. Water contaminants detection using sensor placement approach in smart water networks. J. Ambient. Intell. Humaniz. Comput. 2020, 1–16. [Google Scholar] [CrossRef]
  58. Kombo, P.N.; Kipkorir, E.C.; Ekisa, G.T. Public-Private Partnership approach towards enhancing water accessibility in Busia Municipality, Kenya. Water Pract. Technol. 2014, 9, 353–361. [Google Scholar] [CrossRef]
  59. Allen, M.; Prels, A.; Lqbal, M.; Srirangarajan, S.; Llm, H.B.; Glrod, L.; Whittle, A.J. Real-time in-network distribution system monitoring to improve operational efficiency. J. Am. Water Work. Assoc. 2011, 103, 63–75. [Google Scholar] [CrossRef]
  60. Hoo, R. Managing water demand in Singapore through a systems perspective. Int. J. Water Resour. Dev. 2019. [Google Scholar] [CrossRef]
  61. Allen, M.; Preis, A.; Iqbal, M.; Whittle, A.J. Case study: A smart water grid in Singapore. Water Pract. Technol. 2012, 7, 1–8. [Google Scholar] [CrossRef] [Green Version]
  62. Redhead, M.; Athuraliya, A.; Brown, A.; Gan, K.; Ghobadi, C.; Jones, C. Melbourne Residential Water End Uses Winter 2010/Summer 2012; Report 10TR5-001; Smart Water Fund: Melbourne, Victoria, Australia, 2013. [Google Scholar]
  63. Hodsdon, A. Kennebec Water District: Public Water System ID ME0090750, Kennebec Water District, Kennebec, USA. Available online: http://www.kennebecwater.org/wpcontent/uploads/2015/06/CCR2014.pdf (accessed on 10 August 2020).
  64. Simitha, K.; Raj, S. IoT and WSN Based Water Quality Monitoring System. In Proceedings of the 2019 3rd International conference on Electronics, Communication and Aerospace Technology (ICECA), Tamil Nadu, India, 12–14 June 2019; IEEE: Piscataway, NJ, USA, 2019; pp. 205–210. [Google Scholar]
  65. Copeland, C. Water Infrastructure Financing: The Water Infrastructure Finance and Innovation Act (WIFIA) Program; Congressional Research Service: Washington, DC, USA, 2016. [Google Scholar]
  66. Lewis, K. Transforming the Agricultural Industry; IBM: New York, NY, USA; Available online: https://www.ibm.com/blogs/internet-of-things/iot-food-security (accessed on 10 August 2020).
  67. Huang, A. Transforming the Agricultural Industry; IBM: New York, NY, USA; Available online: https://www.ibm.com/blogs/internet-of-things/agricultural-industry/i (accessed on 10 August 2020).
  68. Rinskje, K. Dacom and Crop-R Join Forces under Dacom Farm Intelligence, Dacom, Emmen, Nederland. Available online: https://en.dacom.nl/news/dacom-and-crop-r-join-forces (accessed on 10 August 2020).
  69. Kokossalakis, G. Acoustic Data Communication System for in-Pipe Wireless Sensor Networks. Ph.D. Thesis, Massachusetts Institute of Technology, Cambridge, MA, USA, 2006. [Google Scholar]
  70. Munir, M.S.; Bajwa, I.S.; Naeem, M.A.; Ramzan, B. Design and implementation of an IoT system for smart energy consumption and smart irrigation in tunnel farming. Energies 2018, 11, 3427. [Google Scholar] [CrossRef] [Green Version]
  71. EDYN Garden Sensor; EDYN: Oakland, CA, USA; Available online: https://edyn.com/getstarted#quick-start (accessed on 10 August 2020).
  72. Abbas, A.H.; Mohammed, M.M.; Ahmed, G.M.; Ahmed, E.A.; Seoud, R.A.A.A.A. Smart watering system for gardens using wireless sensor networks. In Proceedings of the 2014 International Conference on Engineering and Technology (ICET), Cairo, Egypt, 19–20 April 2014; IEEE: Piscataway, NJ, USA, 2014; pp. 1–5. [Google Scholar]
  73. Das V, J.; Sharma, S.; Kaushik, A. Views of Irish farmers on smart farming technologies: An observational study. AgriEngineering 2019, 1, 164–187. [Google Scholar]
  74. Wiseman, L.; Sanderson, J.; Zhang, A.; Jakku, E. Farmers and their data: An examination of farmers’ reluctance to share their data through the lens of the laws impacting smart farming. NJAS-Wagening. J. Life Sci. 2019, 90, 100301. [Google Scholar] [CrossRef]
  75. Caffaro, F.; Cavallo, E. The Effects of Individual Variables, Farming System Characteristics and Perceived Barriers on Actual Use of Smart Farming Technologies: Evidence from the Piedmont Region, Northwestern Italy. Agriculture 2019, 9, 111. [Google Scholar] [CrossRef] [Green Version]
  76. Gupta, M.; Abdelsalam, M.; Khorsandroo, S.; Mittal, S. Security and privacy in smart farming: Challenges and opportunities. IEEE Access 2020, 8, 34564–34584. [Google Scholar] [CrossRef]
  77. Kernecker, M.; Knierim, A.; Wurbs, A.; Kraus, T.; Borges, F. Experience versus expectation: Farmers’ perceptions of smart farming technologies for cropping systems across Europe. Precis. Agric. 2020, 21, 34–50. [Google Scholar] [CrossRef]
  78. Brewster, C.; Jan, E.; Raymond, K.; Rakers, P.; Iver, T.; Jürgen, V.; Astrid, W. Strategic Research and Innovation Agenda; ETIP Wind: Brussels, Belgium, 2018. [Google Scholar]
  79. Knierim, A.; Borges, F.; Kernecker, M.; Kraus, T.; Wurbs, A. What drives adoption of smart farming technologies? Evidence from a cross-country study. In Proceedings of the European International Farm Systems Association Symposium, Chania, Greece, 1–5 July 2018; pp. 1–5. [Google Scholar]
  80. Skinner, A.J.; Lambert, M.F. Using smart sensor strings for continuous monitoring of temperature stratification in large water bodies. IEEE Sens. J. 2006, 6, 1473–1481. [Google Scholar] [CrossRef] [Green Version]
  81. Bayen, A. Floating Sensor Network; Department of Electrical Engineering and Computer Sciences: Berkeley, CA, USA; Available online: https://float.berkeley.edu/fsn/?q=webfm_send/213 (accessed on 10 August 2020).
  82. Van der Gaag, B.; Volz, J. Real-Time on-Line Monitoring of Contaminants in Water: Developing a Research Strategy from Utility Experiences and Needs; KIWA Water Research: London, UK, 2008. [Google Scholar]
  83. Zurita, J.L.; Jos, Á.; Cameán, A.M.; Salguero, M.; López-Artíguez, M.; Repetto, G. Ecotoxicological evaluation of sodium fluoroacetate on aquatic organisms and investigation of the effects on two fish cell lines. Chemosphere 2007, 67, 1–12. [Google Scholar] [CrossRef]
  84. Vaseashta, A.; Duca, G.; Culighin, E.; Bogdevici, O.; Khudaverdyan, S.; Sidorenko, A. Smart and Connected Sensors Network for Water Contamination Monitoring and Situational Awareness. In Functional Nanostructures and Sensors for CBRN Defence and Environmental Safety and Security; Springer: Berlin, Germany, 2020; pp. 283–296. [Google Scholar]
  85. Demetillo, A.T.; Japitana, M.V.; Taboada, E.B. A system for monitoring water quality in a large aquatic area using wireless sensor network technology. Sustain. Environ. Res. 2019, 29, 12. [Google Scholar] [CrossRef] [Green Version]
  86. Adamo, F.; Attivissimo, F.; Carducci, C.G.C.; Lanzolla, A.M.L. A smart sensor network for sea water quality monitoring. IEEE Sens. J. 2014, 15, 2514–2522. [Google Scholar] [CrossRef]
  87. Murray, R.; Haxton, T.; Janke, R.; Hart, W.; Berry, J.; Phillips, C. Sensor Network Design for Drinking Water Contamination Warning Systems; US Environmental Protection Agency National Homeland Security Research Center: Cincinnati, OH, USA, 2010.
  88. Storey, M.V.; Van der Gaag, B.; Burns, B.P. Advances in on-line drinking water quality monitoring and early warning systems. Water Res. 2011, 45, 741–747. [Google Scholar] [CrossRef]
  89. White, L. IBM and DC WASA Flow Technology into Washington DC’s Water and Sewer System; IBM: New York, NY, USA; Available online: https://www.ibm.com/smarterplanet/global/files/gb__en_uk__cities__smarterplanet_DC_WASA.pdf (accessed on 10 August 2020).
  90. Siemens, A.G. Increasing Efficiency with SIWA Network Management System; Siemens: Nuremberg, Germany; Available online: http://w3.siemens.com/mcms/water-industry/de/Documents/E20001-A120-T122-X-7600_WS_SIWA (accessed on 10 August 2020).
  91. Schneider. Smart Water Networks: Storm Water Management, Schneider Electric’s; Smart Water Networks (SWN): Omaha, NE, USA; Available online: http://www.schneider-electric.com.au/en/download/document/storm_water_management_2012/ (accessed on 10 August 2020).
  92. Proctor, P. Achieving Energy Independence at the Gresham Wastewater Treatment Plant; Waterworld: Gresham, OR, USA; Available online: https://www.waterworld.com/home/article/16192388/achieving-energy-independence-atthe-gresham-wastewater-treatment-plant (accessed on 10 August 2020).
  93. Cyranoski, D. Chinese cities scan sewers for signs of illegal drug use: Privacy concerns and cultural differences could limit the technique’s use in other nations. Nature 2018, 559, 310–311. [Google Scholar] [CrossRef] [Green Version]
  94. Masia, O.; Erasmus, L. Smart metering implementation for enabling Water Conservation and water demand management: An investigation in Gauteng, South Africa. 2013 Africon 2013. [Google Scholar] [CrossRef]
  95. Mounce, S.; Boxall, J.; Machell, J. An artificial neural network/fuzzy logic system for DMA flow meter data analysis providing burst identification and size estimation. In Water Management Challenges in Global Change; Water Engineering Group, The University of Sheffield: Sheffield, UK, 2007; pp. 313–320. [Google Scholar]
  96. Gabrielli, L.; Pizzichini, M.; Spinsante, S.; Squartini, S.; Gavazzi, R. Smart water grids for smart cities: A sustainable prototype demonstrator. In Proceedings of the 2014 European Conference on Networks and Communications (EuCNC), Bologna, Italy, 23–26 June 2014; IEEE: Piscataway, NJ, USA, 2014; pp. 1–5. [Google Scholar]
  97. Beal, C.; Stewart, R.; Huang, T.; Rey, E. South East Queensland Residential End Use Study; Urban Water Security Research Alliance: Brisbane, Australia, 2011. [Google Scholar]
  98. Wang, J.; Cardell-Oliver, R.; Liu, W. Discovering routine behaviours in smart water meter data. In Proceedings of the 2015 IEEE Tenth International Conference on Intelligent Sensors, Sensor Networks and Information Processing (ISSNIP), Singapore, 7–9 April 2015; IEEE: Piscataway, NJ, USA, 2015; pp. 1–6. [Google Scholar]
  99. Loureiro, D.; Rebelo, M.; Mamade, A.; Vieira, P.; Ribeiro, R. Linking water consumption smart metering with census data to improve demand management. Water Sci. Technol. Water Supply 2015, 15, 1396–1404. [Google Scholar] [CrossRef] [Green Version]
  100. Gurung, T.R.; Stewart, R.A.; Sharma, A.K.; Beal, C.D. Smart meters for enhanced water supply network modelling and infrastructure planning. Resour. Conserv. Recycl. 2014, 90, 34–50. [Google Scholar] [CrossRef] [Green Version]
  101. Hsia, S.C.; Hsu, S.W.; Chang, Y.J. Remote monitoring and smart sensing for water meter system and leakage detection. IET Wirel. Sens. Syst. 2012, 2, 402–408. [Google Scholar] [CrossRef]
  102. Zhang, B.; Liu, J. A kind of design schema of wireless smart water meter reading system based on zigbee technology. In Proceedings of the 2010 International Conference on E-Product E-Service and E-Entertainment, Henan, China, 7–9 November 2010; IEEE: Piscataway, NJ, USA, 2010; pp. 1–4. [Google Scholar]
  103. Arregui, F.; Cobacho, R.; Cabrera, E., Jr.; Espert, V. Graphical method to calculate the optimum replacement period for water meters. J. Water Resour. Plan. Manag. 2011, 137, 143–146. [Google Scholar] [CrossRef]
  104. Nina, B. Analysis: Smart Meter and Smart Grid Problem, Legislative Proposal. Sebastopol, CA, USA. Available online: http://www.santepublique-editions.fr/objects/smart-meter-problemsdec-2012-final-voir-p28.pdf (accessed on 10 August 2020).
  105. Loureiro, D.; Alegre, H.; Coelho, S.; Martins, A.; Mamade, A. A new approach to improve water loss control using smart metering data. Water Sci. Technol. Water Supply 2014, 14, 618–625. [Google Scholar] [CrossRef]
  106. Claudio, K.; Couallier, V.; Leclerc, C.; Le Gat, Y.; Saracco, J. Consumption estimation with a partial automatic meter reading deployment. Water Sci. Technol. Water Supply 2015, 15, 50–58. [Google Scholar] [CrossRef]
  107. Amaxilatis, D.; Chatzigiannakis, I.; Tselios, C.; Tsironis, N.; Niakas, N.; Papadogeorgos, S. A smart water metering deployment based on the fog computing paradigm. Appl. Sci. 2020, 10, 1965. [Google Scholar] [CrossRef] [Green Version]
  108. Debele, S.E.; Kumar, P.; Sahani, J.; Marti-Cardona, B.; Mickovski, S.B.; Leo, L.S.; Porcù, F.; Bertini, F.; Montesi, D.; Vojinovic, Z.; et al. Nature-based solutions for hydro-meteorological hazards: Revised concepts, classification schemes and databases. Environ. Res. 2019, 179, 108799. [Google Scholar] [CrossRef]
  109. Khattar, R.; Ames, D.P. A Web Services Based Water Data Sharing Approach using Open Geospatial Consortium Standards. Open Water J. 2020, 6, 2. [Google Scholar]
  110. ITU-T L.1500–Standardization Gap Analysis for Smart Water Managemen; International Telecommunication Union: Geneva, Switzerland; Available online: https://www.itu.int/rec/T-REC-L.Sup14/en (accessed on 10 August 2020).
  111. Boston, T.; Pecora, S.; Blodgett, D.; Dornblut, I.; Brodaric, B.; Taylor, P. Water Data Standards by the Hydrology Domain Working Group of WMO and OGC—From Development to Implementation and Adoption. Available online: https://external.ogc.org/twiki_public/pub/HydrologyDWG/WebHome/water-data-standards-ISDE11-paper.pdf (accessed on 10 August 2020).
  112. Araral, E. Why do cities adopt smart technologies? Contingency theory and evidence from the United States. Cities 2020, 106, 102873. [Google Scholar] [CrossRef]
  113. Moy de Vitry, M.; Schneider, M.Y.; Wani, O.F.; Manny, L.; Leitão, J.P.; Eggimann, S. Smart urban water systems: What could possibly go wrong? Environ. Res. Lett. 2019, 14, 081001. [Google Scholar] [CrossRef]
  114. Taormina, R.; Galelli, S.; Tippenhauer, N.O.; Salomons, E.; Ostfeld, A.; Eliades, D.G.; Aghashahi, M.; Sundararajan, R.; Pourahmadi, M.; Banks, M.K.; et al. Battle of the attack detection algorithms: Disclosing cyber attacks on water distribution networks. J. Water Resour. Plan. Manag. 2018, 144, 04018048. [Google Scholar] [CrossRef] [Green Version]
  115. Abrams, M.; Weiss, J. Malicious Control System Cyber Security Attack Case Study–Maroochy Water Services, Australia; The MITRE Corporation: McLean, VA, USA, 2008. [Google Scholar]
  116. Price, W.N.; Cohen, I.G. Privacy in the age of medical big data. Nat. Med. 2019, 25, 37–43. [Google Scholar] [CrossRef] [PubMed]
  117. Li, T.; Horkoff, J. Dealing with security requirements for socio-technical systems: A holistic approach. In Proceedings of the International Conference on Advanced Information Systems Engineering, Thessaloniki, Greece, 16–20 June 2014; Springer: Berlin, Germany, 2014; pp. 285–300. [Google Scholar]
  118. Carvalho, L. Smart cities from scratch? A socio-technical perspective. Camb. J. Reg. Econ. Soc. 2015, 8, 43–60. [Google Scholar] [CrossRef]
  119. Martin, C.J.; Evans, J.; Karvonen, A. Smart and sustainable? Five tensions in the visions and practices of the smart-sustainable city in Europe and North America. Technol. Forecast. Soc. Chang. 2018, 133, 269–278. [Google Scholar] [CrossRef]
  120. Exida, L. Repository of Industrial Security Incidents (RISI) Online Incident Database. 2015. Available online: https://www.risidata.com/Database (accessed on 10 August 2020).
  121. Ramos, H.M.; Teyssier, C.; Samora, I.; Schleiss, A.J. Energy recovery in SUDS towards smart water grids: A case study. Energy Policy 2013, 62, 463–472. [Google Scholar] [CrossRef] [Green Version]
Figure 1. The organization of the discussed topics in this survey.
Energies 13 06268 g001
Figure 2. Sensors and their applications in smart cities.
Energies 13 06268 g002
Figure 3. Water-Wise Sensors used in the Singapore city [59].
Energies 13 06268 g003
Figure 4. Smart farming technologies and their application.
Energies 13 06268 g004
Figure 5. Edyn Garden Sensor and water valve [71].
Energies 13 06268 g005
Figure 6. Generation 3 drifter floating sensor [18].
Energies 13 06268 g006
Figure 7. Smart metering applications and their advantages.
Energies 13 06268 g007
Figure 8. Mechanical meter as a smart meter [101].
Energies 13 06268 g008
Table 1. List of abbreviations used in the paper.
Abbreviations
AMIAdvanced Metering Infrastructure PRVPressure Relief Valves
ANNArtificial Neural Network PSFPattern Sequence-based Forecasting
ARIMAAutoregRessive Integrated Moving Average SEQREUSSouth-east-Queensland Residency End-User Study
BoMBureau of Meteorology SVMSupport Vector Machine
CSOCombined Sewers Overflow SWAMSmart Water Forum
CUSUMCUMulative SUM SWSSmart Water System
DMADistrict Metering Area SWTSmart water technology
DSSDecision Support System TDMTransient Damping Method
DSTMDecision Support Tools Module TEOTeager Energy Operator
DSWASADistrict of Columbia Water and Sewer Authority UNUnited Nations
EAEvolutionary Algorithm USAUnited States of America
ICTInformation, and Communication Technology USEPAUnited States Environmental Protection Agency
IDEASintegrated Data and Electronic Alerts System WDSWater Distribution System
IRAImpulse Response Analysis WDTFWater Data Transfer Format
ITAInverse Transient Analysis WIFIAWater Infrastructure Finance and Innovation Act
KWDKennebec Water District WIRADAWater Information Research and Development Alliance
NMHSNational Meteorological and Hydrological Services WMOWorld Meteorological Organization
NRWNon-Revenue Water WTPWater Treatment Plant
OGCOpen Geospatial Consortium
Table 2. Smart water techniques for burst event detection in WDS.
Techniques UtilizedPlaceResultRemarksCitation
Inverse Transient analysis is used for pipeline
burst detection by analysis pressure sensors data.
The leakage function is optimized step by step and
the leak is added until the objective function
becomes nearly zero.
Dundee
pipeline

system,
UK
The system is capable
of identifying pipeline
burst event of 7.7 1 s .
The system is yet to
test for smaller leaks.
Classification of burst
event under different
hydraulic operations
are absent.
[38]
Joint time-frequency analysis (JTFA) is used
as transient analysis of pressure signal (collected
from sensor) for identify burst events.
SingaporeCan efficiently identify
the burst event varies
from 3 to 7 1 s .
Burst localization
(up to 50 m) error needs
to be reduced to avoid
the use of secondary
devices for localization
of burst event.
[39]
Cumulative sum along with Haar wavelet analysis
is applied to pressure signal for online burst event
detection. The pipeline length used as a testbed
has total length and area of 451.54 m and 2.577 km, respectively.
Boston,
USA
Burst events causing a
leakage rate of 3–8.33 1 s
can be easily identified.
Localization error is
reduced to 20 m as
compared to 50 m of [38].
[40]
Table 3. Various surveys on accepting smart farming technology by farmers.
Techniques UtilizedPlaceSurvey SizeRemarks
Farmers have used soil
monitoring using moisture
sensors, cameras, Crop cutting
decision-based on predictions [77]
Ireland,
Europe
300 farmers were selected for
the survey who are using
smart farming technology
Only 60% are satisfied with the
results whereas others were
unhappy with the differences
observed in the results promised
and the actual results
Global Navigation Satellite
System (GNSS) is used
for suggestions related to
preferable crops to be grown,
time of crop cutting for
better revenue, etc. [78]
USAMore than thousands of
farmers have shared their views
More than 80% of farmers are
happy with the results
EU Horizon 2020 project Smart
AKIS [79]: A survey is done on
farmers who are using smart
farming technologies
(for crop fertilization,
watering, etc.)
Denmark,
France,
Germany,
Greece,
Netherlands,
Serbia,
and the UK
287 farmers from different
countries working on different
areas such as wine
yards open field
60–70% of farmers believe that
smart farming improves comfort
and income. Whereas other believe
that better tools need to be
introduced for better results
Table 4. Various prototypes for water body monitoring.
Techniques UtilizedApplicationRemarks
Contamination Identification
and Level Monitoring Electronic
Display Systems (CILM-EDS) is
a prototype developed using
water imaging [84]
Central monitoring of water
contamination of large water
bodies. Any suspension
contamination is identified
and is reported in
the central display too
High implementation costs
as UAVs and underwater
HD cameras were utilized.
The prototype is still under
trials but has shown promising
results in identifying the
water contamination
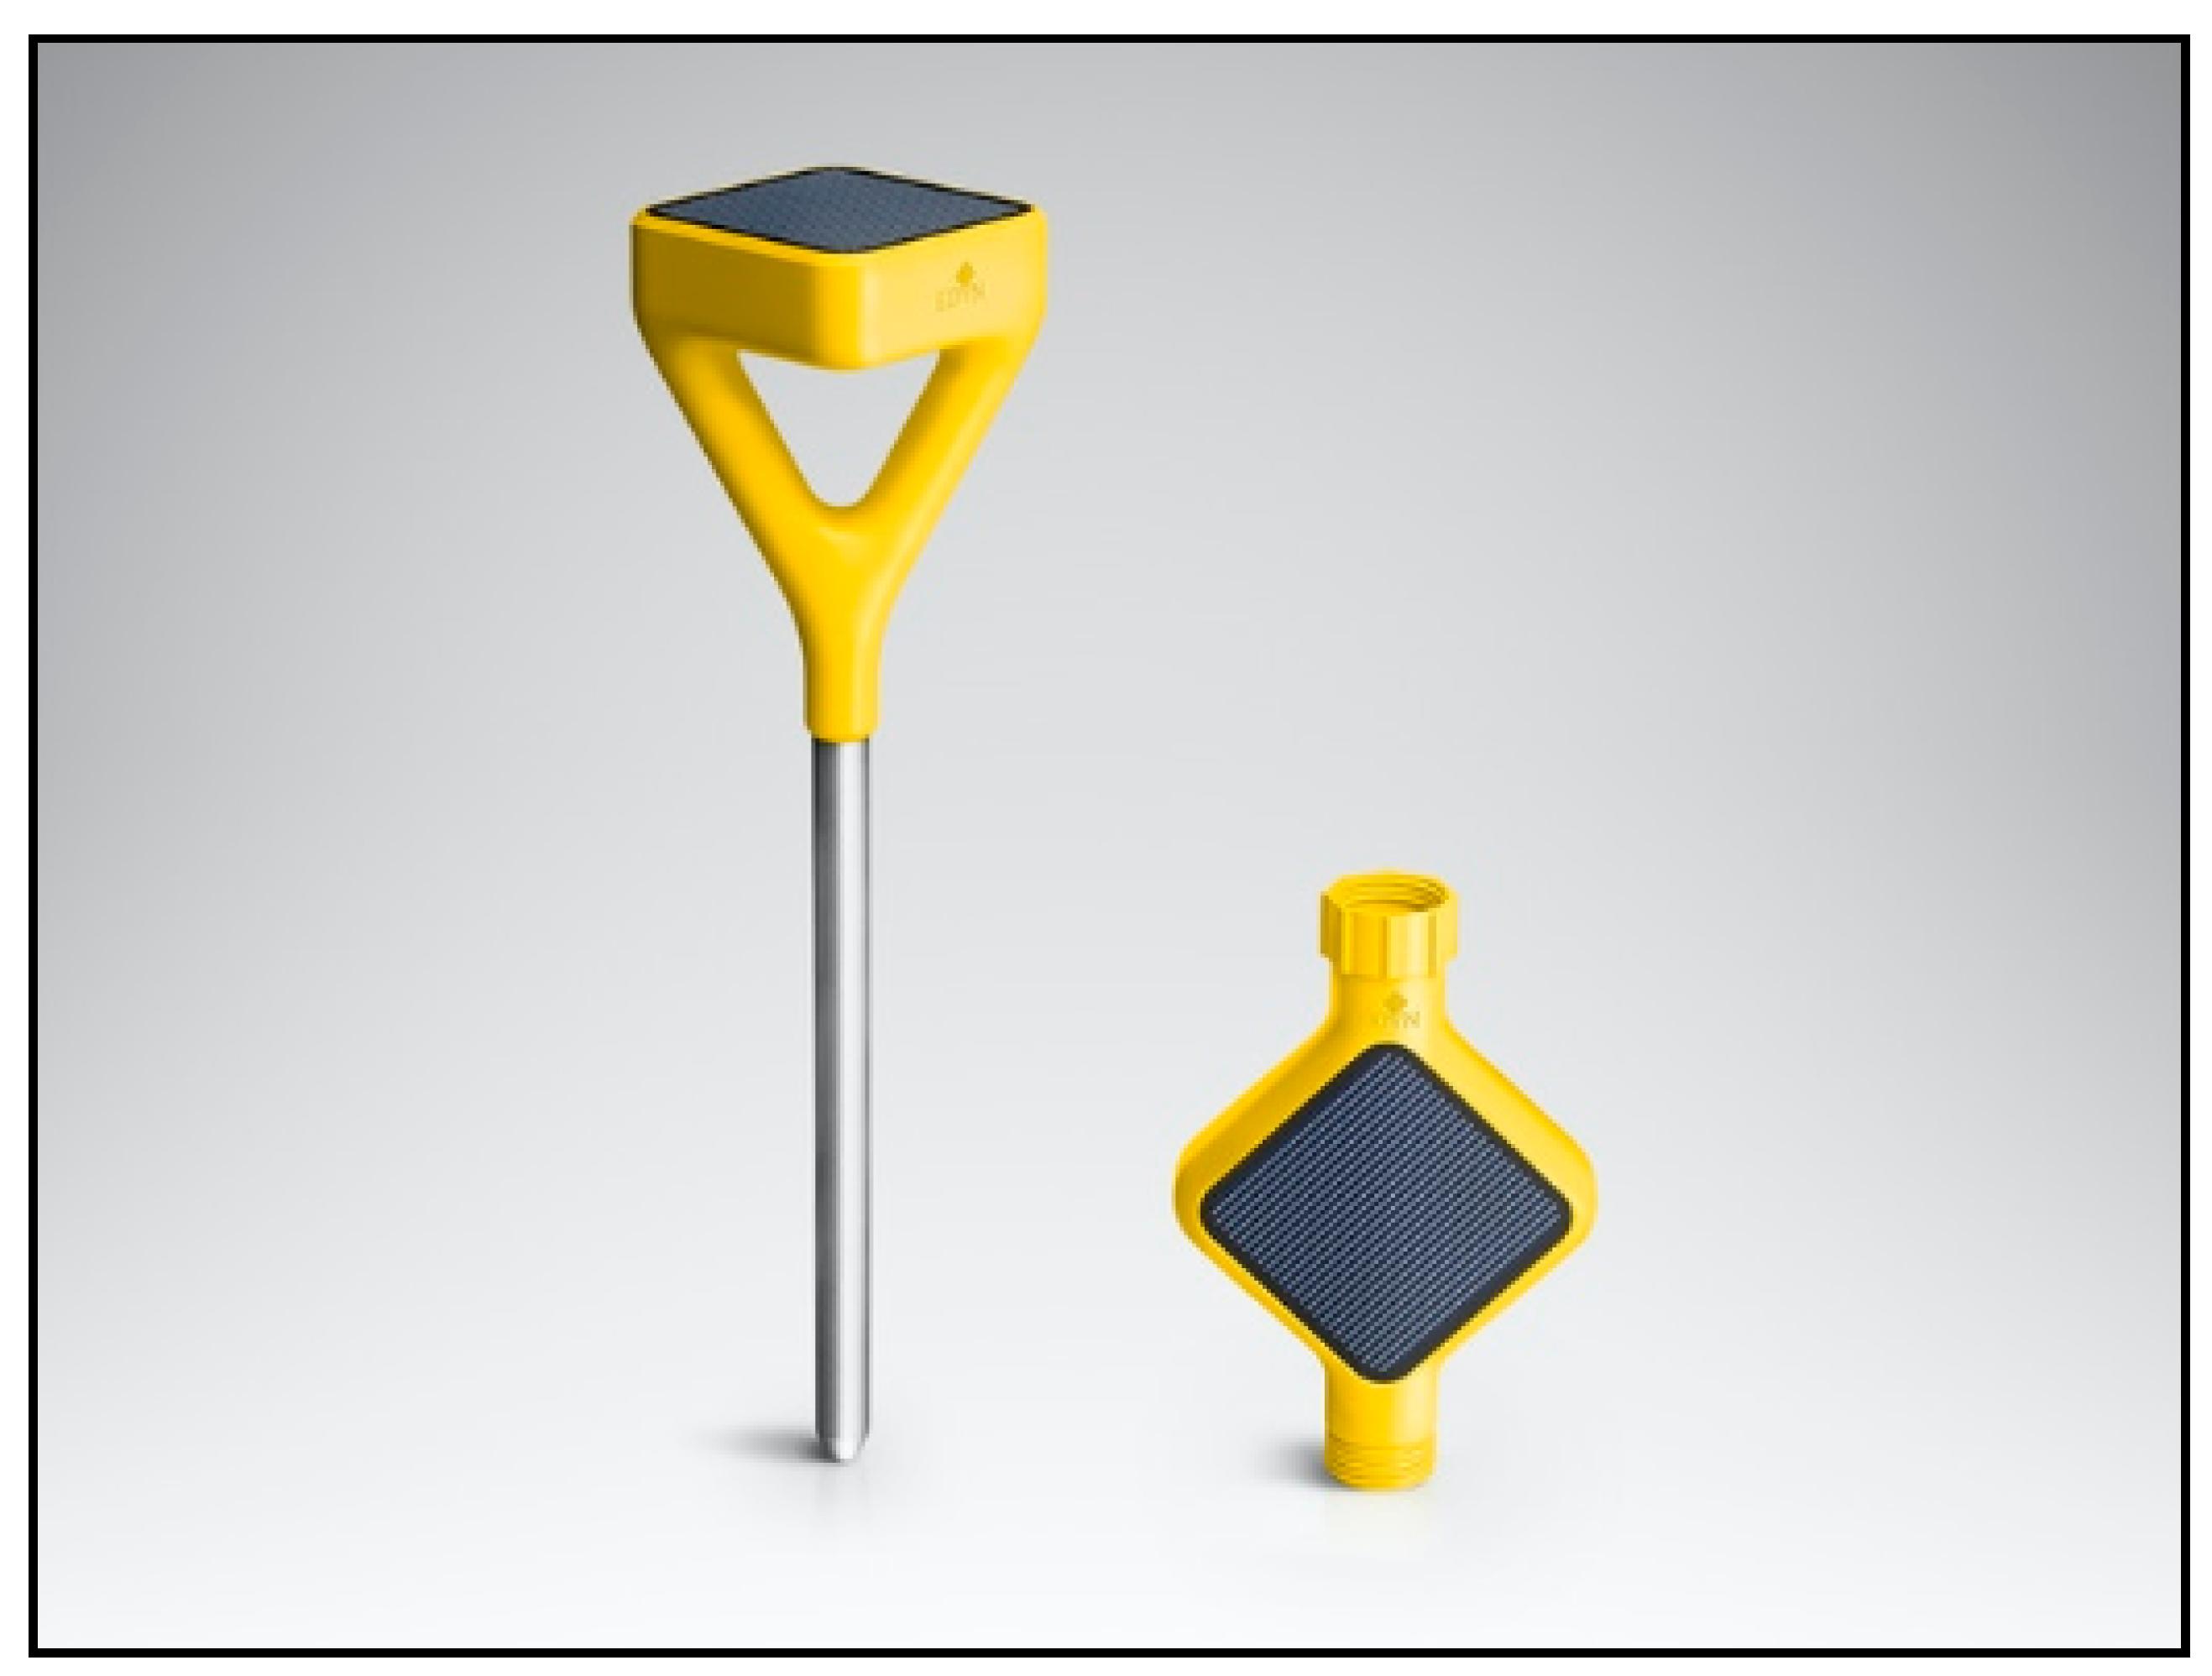
Different sensors such as PH,
temperature, DO sensors
(electrodes) [85]
To monitor water body
temperature, pH, and
dissolved oxygen value of
small lakes and ponds.
The use of solar panels
provides energy harvesting
which is used by the sensors
network. The results can
be monitored via mobile.
SMS alert is sent in case
of any undesired changes.
Table 5. Smart technologies for water treatment plants by industry pioneers.
IndustryApplicationRemarks
Schneider [22]Detects pipeline leakages,
Water quality monitoring,
Real-time field monitoring
using cameras
Provides solutions for water infrastructure management.
Reduces water losses by detecting pipeline leakages.
This saves electricity which is required for the pumping
and filtering of extra water which is lost earlier thus can
reduce carbon footprint and electric bills by 20% and 15%,
respectively. It helps manage laborers by providing
real-time field monitoring in WTP using cameras thus
increases the working efficiency of laborers by 25%.
IBM and the
District of
Columbia [89]
Water aging and Sewer
infrastructure management
The software solves issues related to valves, pipeline
maintenance, and public fire hazards by providing a
real-time mapping application. The system identifies
the location in WDS, where maintenance is required.
Automated meters installed in WDS have helped
reduce water bills. This makes pipeline management
faster easier and helps in reducing the required manpower.
SIWA sewer
by Siemens [90]
Regulation of wastewater
flow, water quality
monitoring using pH
sensors, and leakage
detection in water
treatment plants.
Water regulations provide even load distribution on
the sewage treatment plant. It provides water quality
monitoring such as pH value and oxygen dissolve value
in water.
Publisher’s Note: MDPI stays neutral with regard to jurisdictional claims in published maps and institutional affiliations.

