Environmental and Economic Assessments and Uncertainties of Multiple Lignocellulosic Biomass Utilization for Bioenergy Products: Case Studies


Abstract
:1. Introduction
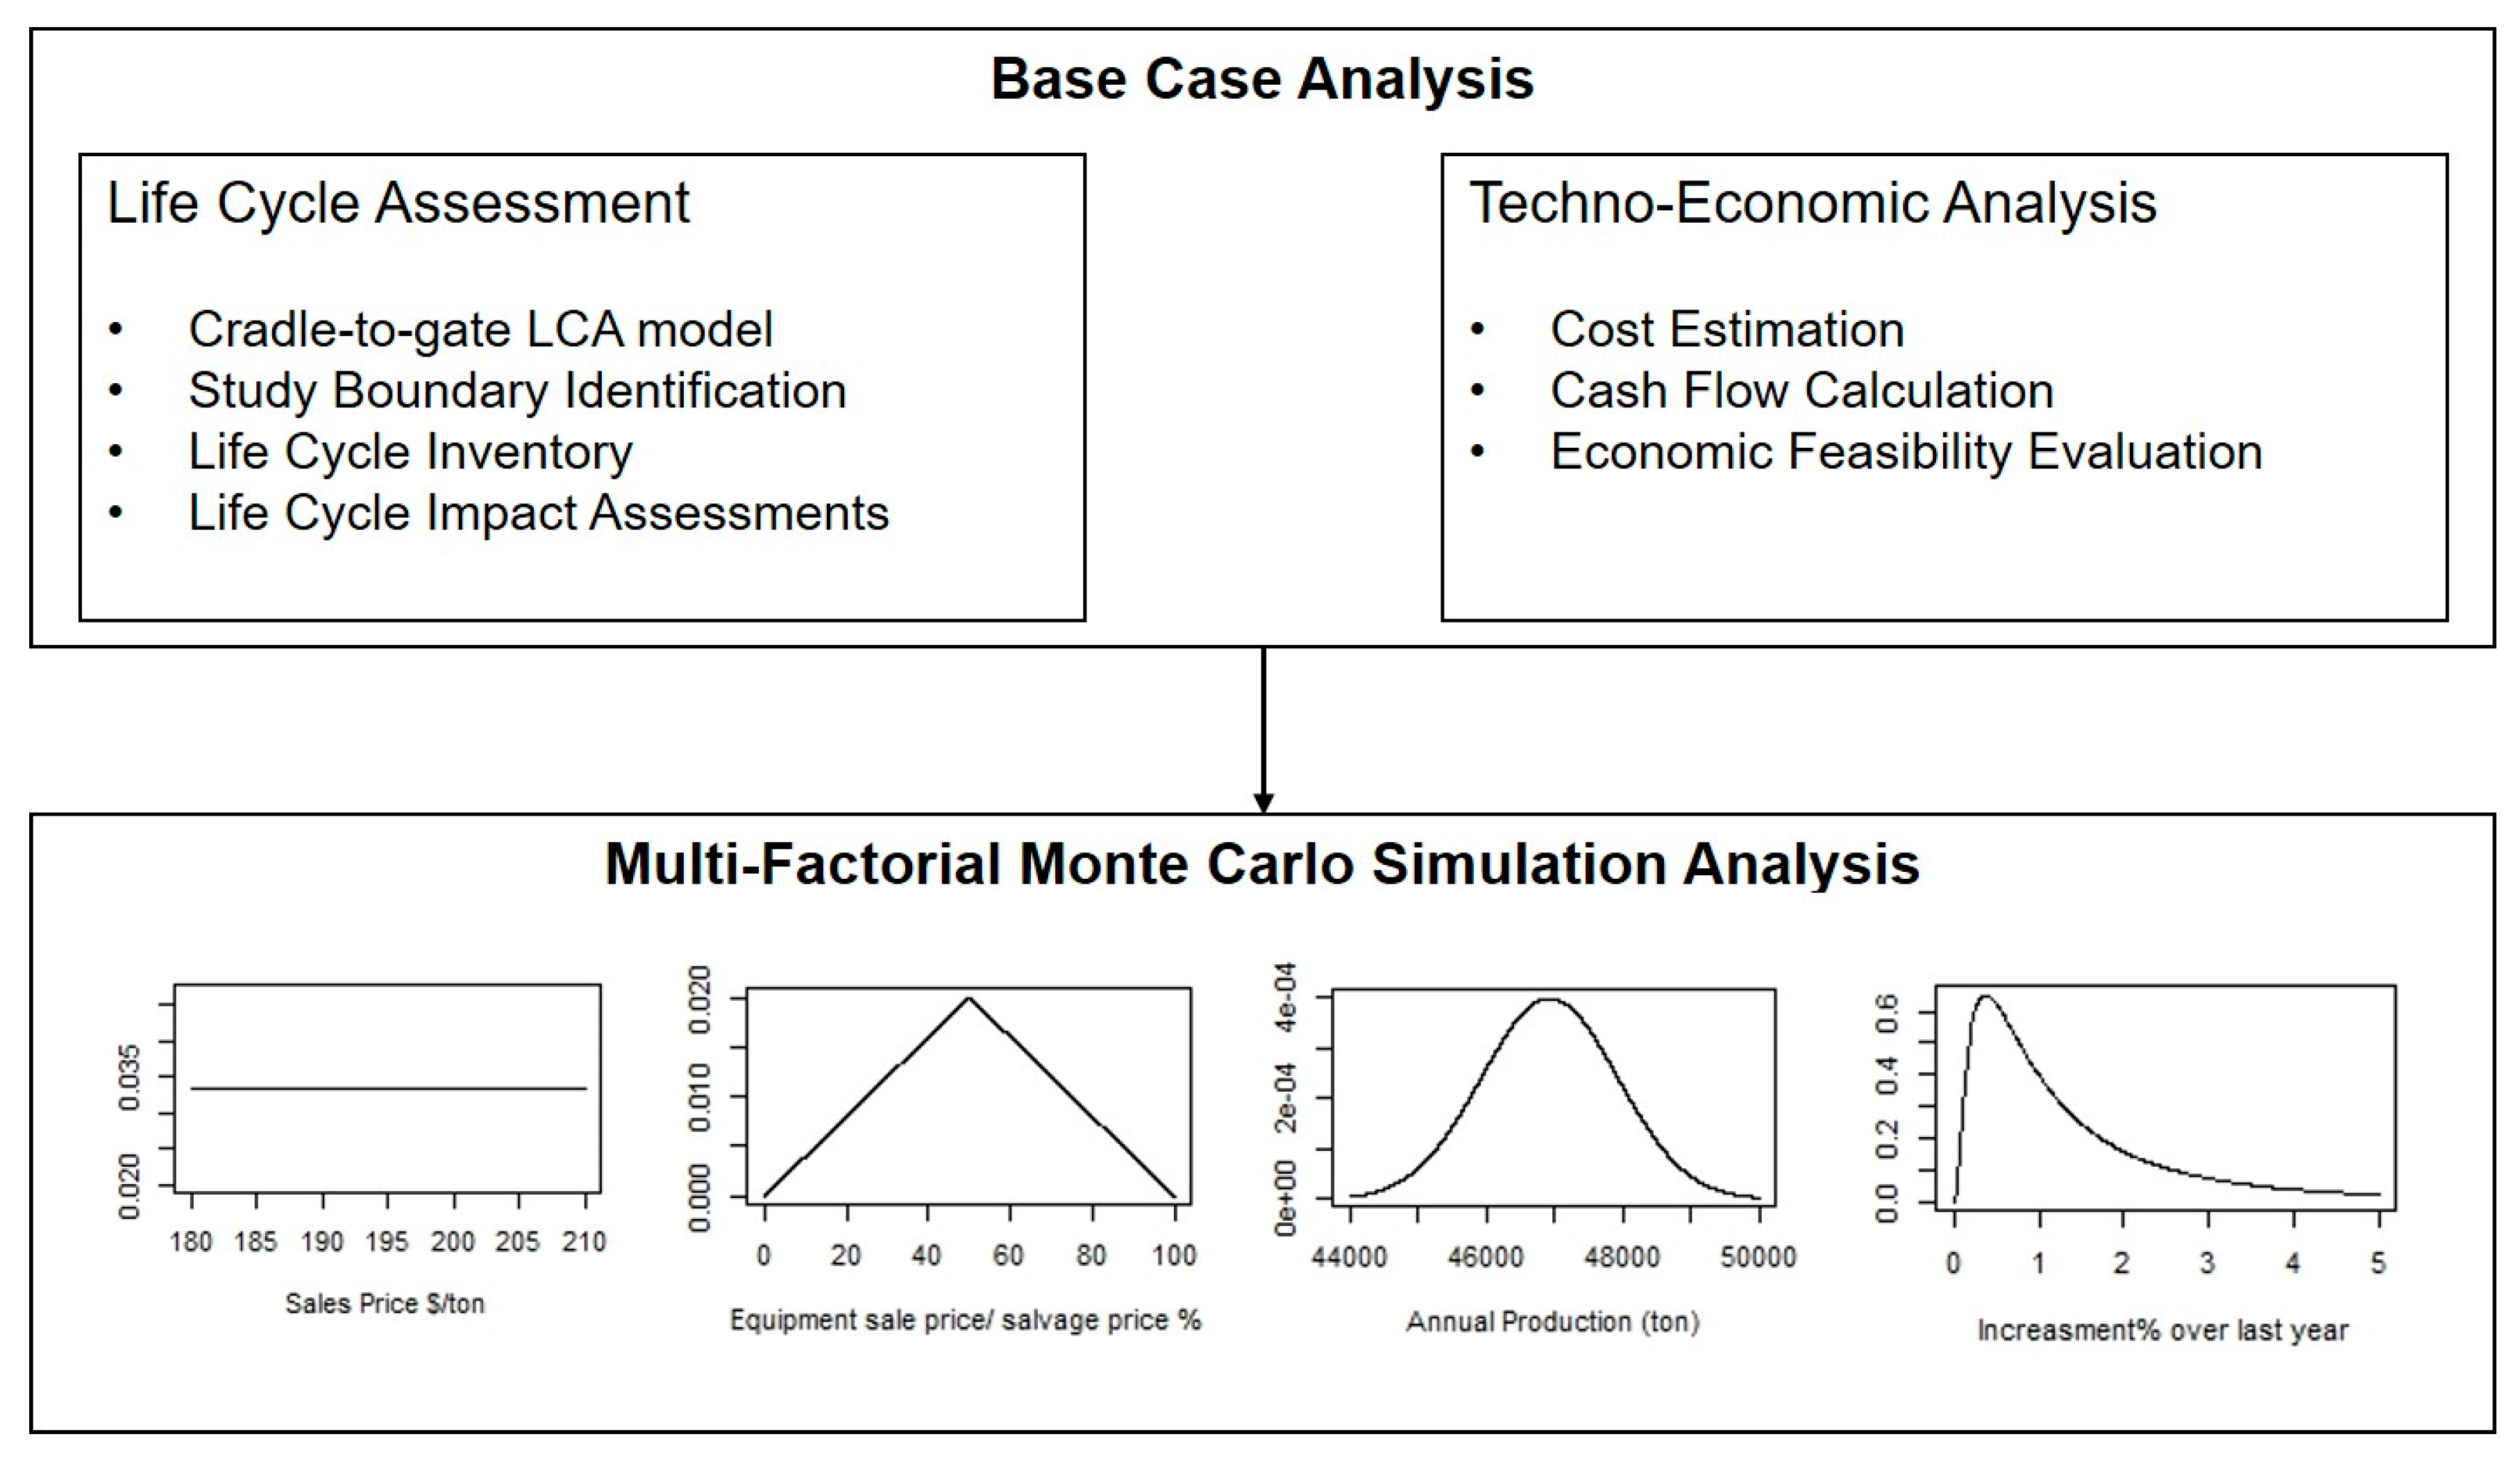
2. Materials and Methods
2.1. Life-Cycle Assessment (LCA)
2.2. Mathematical Model for Techno-Economic Analysis (TEA)
2.3. Monte Carlo Simulation for Uncertainties
3. Results
3.1. Life-Cycle Analysis
3.2. Techno-Economic Analysis
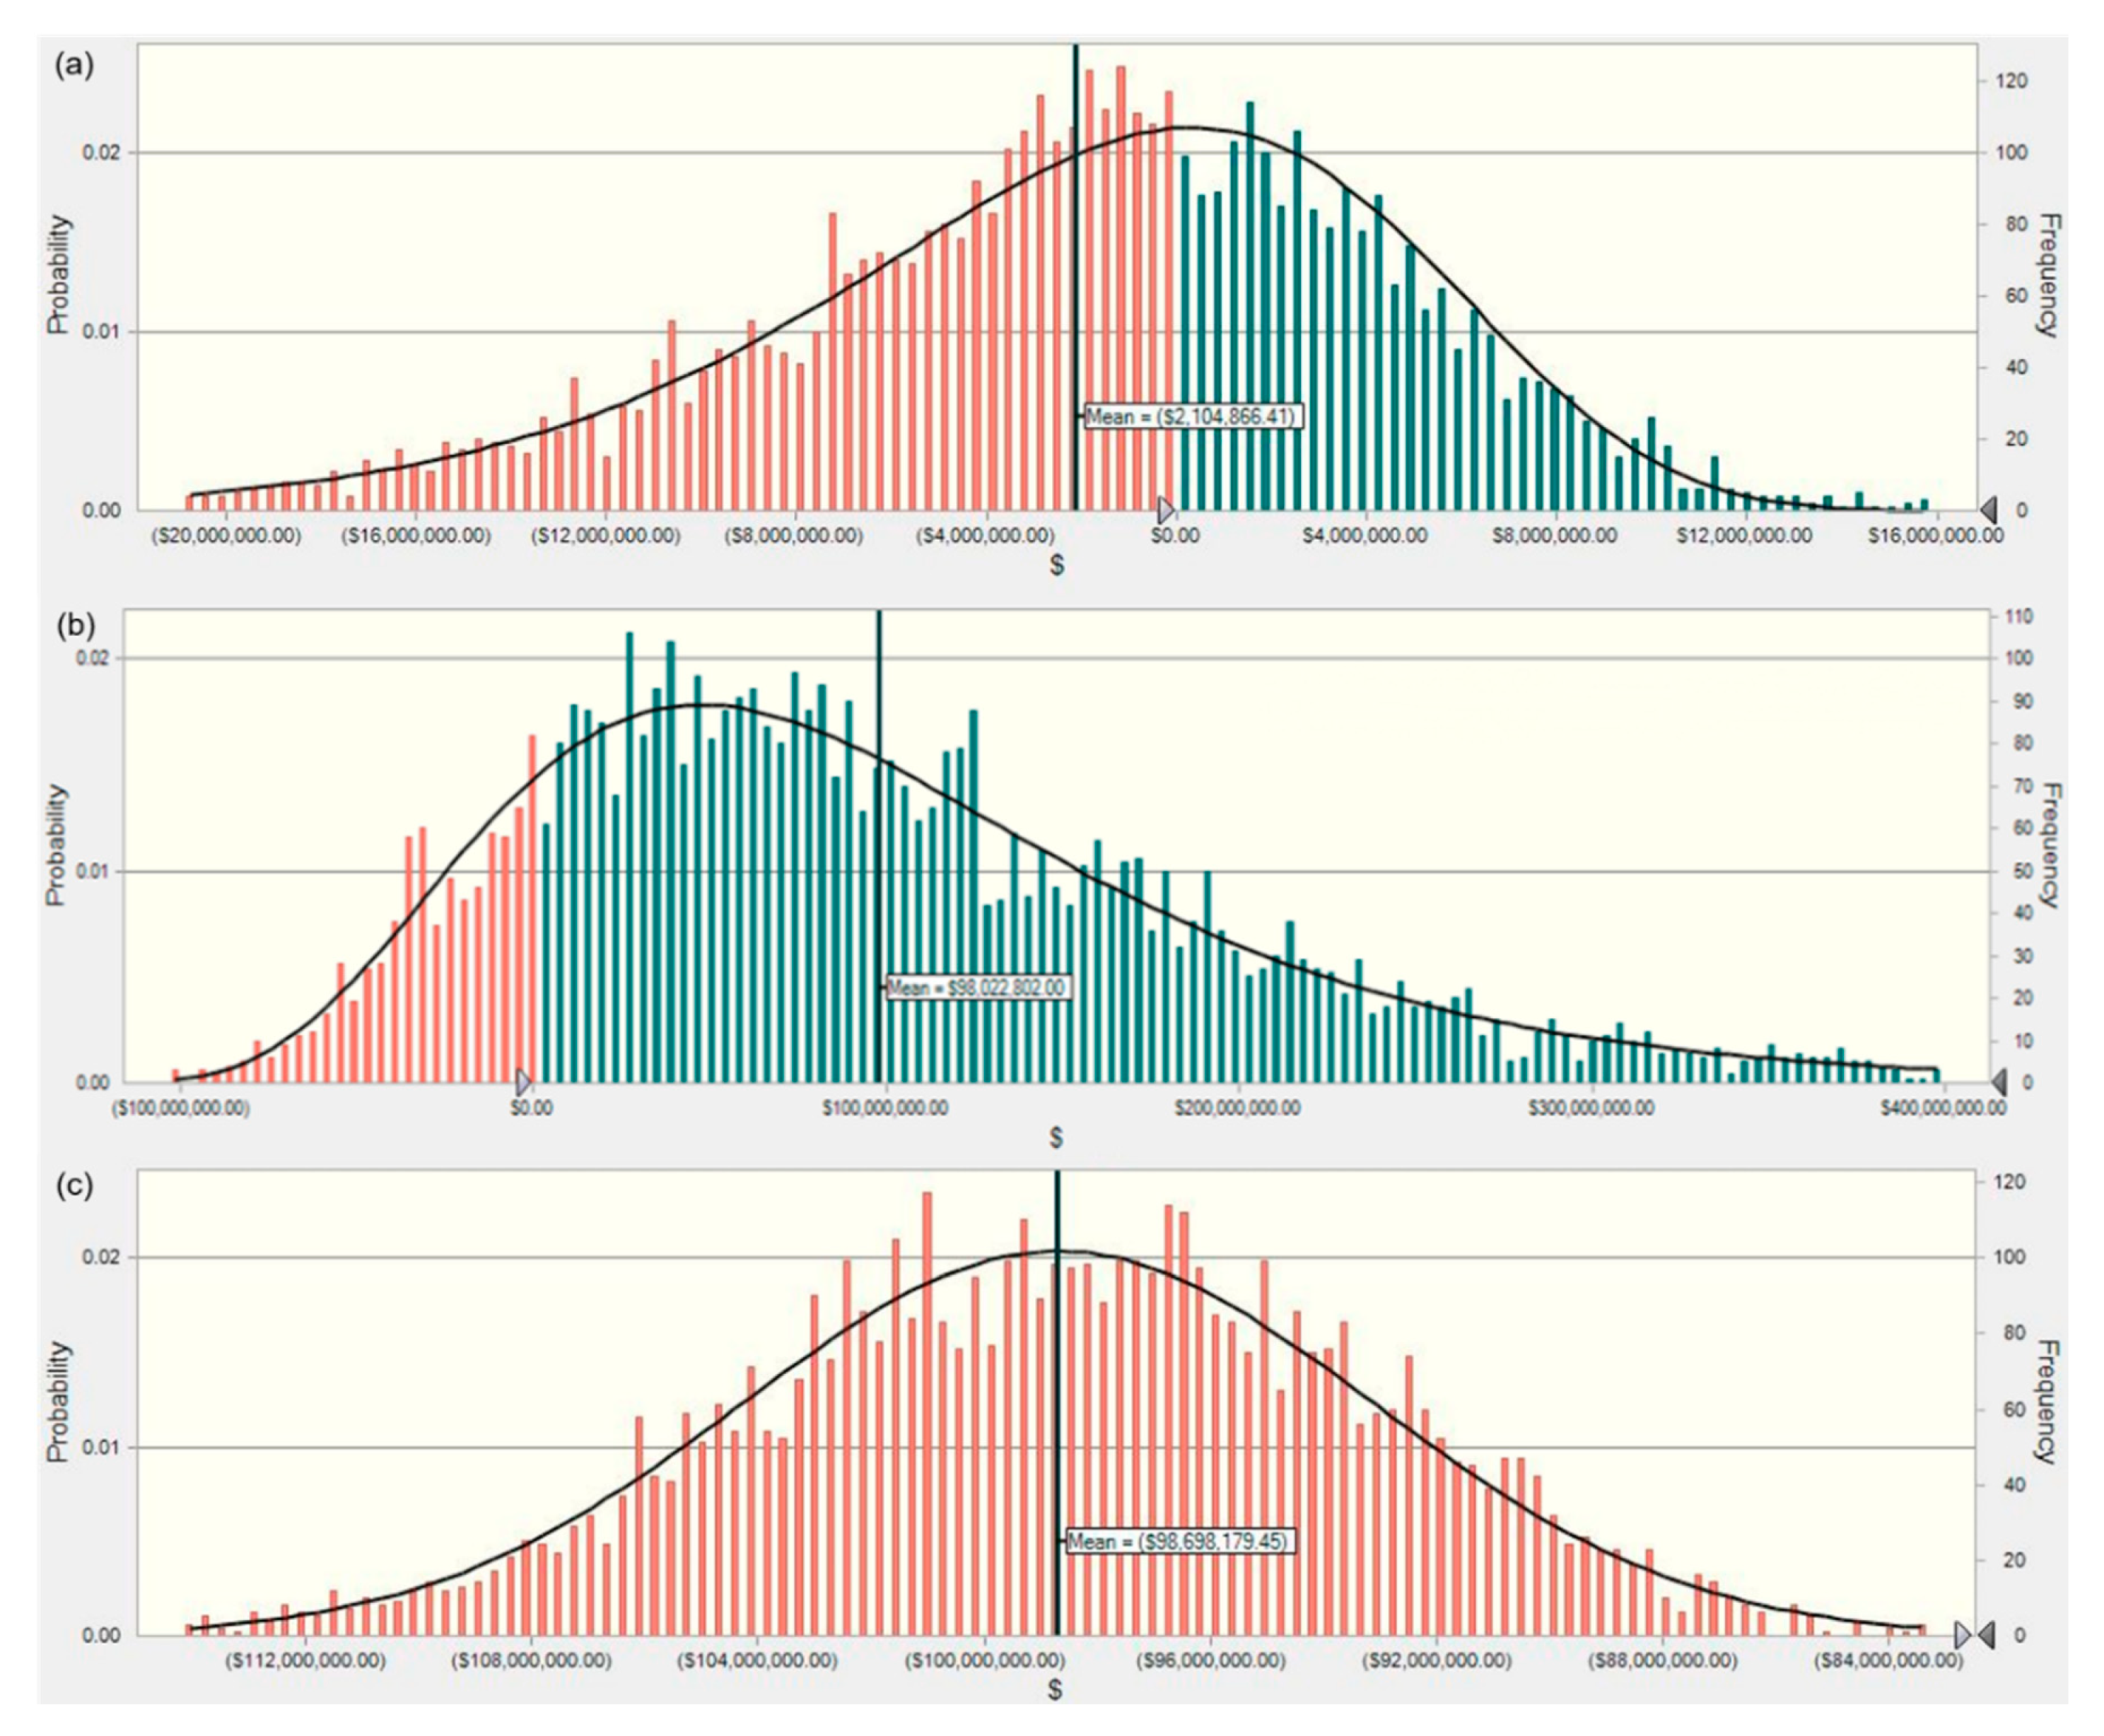
3.3. Uncertainties of the Environmental and Economic Impacts
4. Discussion
4.1. Environmental Impacts
4.2. Economic Feasibility
4.3. Uncertainty and Risks Analysis
5. Conclusions
Author Contributions
Funding
Conflicts of Interest
Abbreviations
| bbl | barrel of oil |
| BWC | blue water consumption |
| CEPCI | Chemical Engineering Plant Cost Index |
| f.u. | functional unit |
| GHG | greenhouse gas |
| ISO | International Organization for Standardization |
| LCA | life-cycle assessment |
| LCI | life-cycle inventory |
| Nm3 | normal cubic meter |
| NPV | net present value |
| odt | oven-dry tonne |
| TEA | techno-economic analysis |
References
- Searle, S.; Malins, C.J. Waste and residue availability for advanced biofuel production in EU Member States. Biomass Bioenergy 2016, 89, 2–10. [Google Scholar] [CrossRef]
- Sowlati, T. Modeling of forest and wood residues supply chains for bioenergy and biofuel production. In Biomass Supply Chains for Bioenergy and Biorefining; Woodhead Publishing: Cambridge, UK, 2016; pp. 167–190. [Google Scholar]
- Robertson, G.P.; Hamilton, S.K.; Barham, B.L.; Dale, B.E.; Izaurralde, R.C.; Jackson, R.D.; Landis, D.A.; Swinton, S.M.; Thelen, K.D.; Tiedje, J.M. Cellulosic biofuel contributions to a sustainable energy future: Choices and outcomes. Science 2017, 356, eaal2324. [Google Scholar] [CrossRef] [PubMed] [Green Version]
- Demirbaş, A. Biomass resource facilities and biomass conversion processing for fuels and chemicals. Energy Convers. Manag. 2001, 42, 1357–1378. [Google Scholar] [CrossRef]
- U.S. Department of Energy. Biomass Basics: The Facts about Bioenergy; Energy Efficiency & Renewable Energy, EE-1201; U.S. Department of Energy: Washington, DC, USA, 2015.
- Morais, A.R.C.; Lopes, A.M.D.C.; Bogel-Łukasik, R. Carbon Dioxide in Biomass Processing: Contributions to the Green Biorefinery Concept. Chem. Rev. 2015, 115, 3–27. [Google Scholar] [CrossRef] [PubMed] [Green Version]
- Cherubini, F. The biorefinery concept: Using biomass instead of oil for producing energy and chemicals. Energy Convers. Manag. 2010, 51, 1412–1421. [Google Scholar] [CrossRef]
- Novo, A.; Jansen, K.; Slingerland, M. The sugarcane-biofuel expansion and dairy farmers’ responses in Brazil. J. Rural. Stud. 2012, 28, 640–649. [Google Scholar] [CrossRef]
- Elander, R.T.; Putsche, V.L. Ethanol from corn: Technology and economics. In Handbook on Bioethanol; CRC Press LLC: Boca Raton, FL, USA, 2018; pp. 329–349. [Google Scholar]
- Naik, S.; Goud, V.V.; Rout, P.K.; Dalai, A.K. Production of first and second generation biofuels: A comprehensive review. Renew. Sustain. Energy Rev. 2010, 14, 578–597. [Google Scholar] [CrossRef]
- Sims, R.E.; Mabee, W.; Saddler, J.N.; Taylor, M. An overview of second generation biofuel technologies. Bioresour. Technol. 2010, 101, 1570–1580. [Google Scholar] [CrossRef]
- Stevens, C.V.; Verhé, R. Renewable Bioresources: Scope and Modification for Non-Food Applications; John Wiley & Sons: Hoboken, NJ, USA, 2004. [Google Scholar]
- Yancey, N.A.; Tumuluru, J.S.; Wright, C.T. Drying, Grinding and Pelletization Studies on Raw and Formulated Biomass Feedstock’s for Bioenergy Applications. J. Biobased Mater. Bioenergy 2013, 7, 549–558. [Google Scholar] [CrossRef]
- Goliński, T.; Foltynowicz, Z. Pellet-a key to biomass energy. Inter. J. Econ. Pract. Theor. 2012, 2, 197–204. [Google Scholar]
- Bhaskar, T.; Bhavya, B.; Singh, R.; Naik, D.V.; Kumar, A.; Goyal, H.B. Thermochemical Conversion of Biomass to Biofuels. In Biofuels; Pandey, A., Larroche, C., Ricke, S.C., Dussap, C.-G., Gnansounou, E., Eds.; Academic Press: Amsterdam, The Netherlands, 2011; Chapter 3; pp. 51–77. [Google Scholar]
- Liu, W.; Wang, J.; Bhattacharyya, D.; Jiang, Y.; DeVallance, D. Economic and environmental analyses of coal and biomass to liquid fuels. Energy 2017, 141, 76–86. [Google Scholar] [CrossRef]
- Zhang, J.; Zhang, X. The thermochemical conversion of biomass into biofuels. In Biomass, Biopolymer-Based Materials, and Bioenergy; Verma, D., Fortunati, E., Jain, S., Zhang, X., Eds.; Woodhead Publishing: Cambridge, UK, 2019; pp. 327–368. [Google Scholar]
- Lehto, J.; Oasmaa, A.; Solantausta, Y.; Kytö, M.; Chiaramonti, D. Review of fuel oil quality and combustion of fast pyrolysis bio-oils from lignocellulosic biomass. Appl. Energy 2014, 116, 178–190. [Google Scholar] [CrossRef]
- Fantozzi, F.; Buratti, C. Life cycle assessment of biomass chains: Wood pellet from short rotation coppice using data measured on a real plant. Biomass Bioenergy 2010, 34, 1796–1804. [Google Scholar] [CrossRef] [Green Version]
- Sultana, A.; Kumar, A. Ranking of biomass pellets by integration of economic, environmental and technical factors. Biomass Bioenergy 2012, 39, 344–355. [Google Scholar] [CrossRef]
- Loock, R. Biomass Power Plant. U.S. Patent Application No. US2011/0183410A1, 28 July 2011. [Google Scholar]
- Ehrlich, P. Faculty Opinions recommendation of Environmental, economic, and energetic costs and benefits of biodiesel and ethanol biofuels. Proc. Natl. Acad. Sci. USA 2006, 103, 11206–11210. [Google Scholar]
- Cadenas, A.; Cabezudo, S. Biofuels as Sustainable Technologies: Perspectives for Less Developed Countries. Technol. Forecast. Soc. Chang. 1998, 58, 83–103. [Google Scholar] [CrossRef]
- Arena, U.; Gregorio, F.D.; Santonastasi, M. A techno-economic comparison between two design configurations for a small scale, biomass-to-energy gasification based system. Chem. Eng. J. 2010, 162, 580–590. [Google Scholar] [CrossRef]
- Pootakham, T.; Kumar, A. Bio-oil transport by pipeline: A techno-economic assessment. Bioresour. Technol. 2010, 101, 7137–7143. [Google Scholar] [CrossRef]
- Brown, T.R.; Wright, M.M. Techno-economic impacts of shale gas on cellulosic biofuel pathways. Fuel 2014, 117, 989–995. [Google Scholar] [CrossRef]
- Patel, C.; Lettieri, P.; Germanà, A. Techno-economic performance analysis and environmental impact assessment of small to medium scale SRF combustion plants for energy production in the UK. Process. Saf. Environ. Prot. 2012, 90, 255–262. [Google Scholar] [CrossRef]
- Trippe, F.; Fröhling, M.; Schultmann, F.; Stahl, R.; Henrich, E. Techno-economic assessment of gasification as a process step within biomass-to-liquid (BtL) fuel and chemicals production. Fuel Process. Technol. 2011, 92, 2169–2184. [Google Scholar] [CrossRef]
- Wright, M.M.; Daugaard, D.E.; Satrio, J.A.; Brown, R.C. Techno-economic analysis of biomass fast pyrolysis to transportation fuels. Fuel 2010, 89, S2–S10. [Google Scholar] [CrossRef] [Green Version]
- Batan, L.Y.; Graff, G.D.; Bradley, T.H. Techno-economic and Monte Carlo probabilistic analysis of microalgae biofuel production system. Bioresour. Technol. 2016, 219, 45–52. [Google Scholar] [CrossRef] [PubMed]
- Tan, R.R.; Culaba, A.B.; Purvis, M.R. POLCAGE 1.0—A possibilistic life-cycle assessment model for evaluating alternative transportation fuels. Environ. Model. Softw. 2004, 19, 907–918. [Google Scholar] [CrossRef]
- Cao, C. Sustainability and life assessment of high strength natural fibre composites in construction. In Advanced High Strength Natural Fibre Composites in Construction; Fan, M., Fu, F., Eds.; Woodhead Publishing: Cambridge, UK, 2017; pp. 529–544. [Google Scholar]
- Koura, J.; Manneh, R.; Belarbi, R.; El Khoury, V.; El Bachawati, M. Comparative cradle to grave environmental life cycle assessment of traditional and extensive vegetative roofs: An application for the Lebanese context. Int. J. Life Cycle Assess. 2020, 25, 423–442. [Google Scholar] [CrossRef]
- Caputo, J.; Balogh, S.B.; Volk, T.A.; Johnson, L.; Puettmann, M.; Lippke, B.; Oneil, E. Incorporating Uncertainty into a Life Cycle Assessment (LCA) Model of Short-Rotation Willow Biomass (Salix spp.) Crops. BioEnergy Res. 2014, 7, 48–59. [Google Scholar] [CrossRef]
- You, F.; Wang, B.M. Life Cycle Optimization of Biomass-to-Liquid Supply Chains with Distributed–Centralized Processing Networks. Ind. Eng. Chem. Res. 2011, 50, 10102–10127. [Google Scholar] [CrossRef]
- Budsberg, E.; Rastogi, M.; Puettmann, M.E.; Caputo, J.; Balogh, S.; Volk, T.A.; Gustafson, R.; Johnson, L. Life-Cycle Assessment for the Production of Bioethanol from Willow Biomass Crops via Biochemical Conversion. For. Prod. J. 2012, 62. Available online: http://search.ebscohost.com/login.aspx?direct=true&profile=ehost&scope=site&authtype=crawler&jrnl=00157473&AN=85361701&h=ZkO1eG3nGlyZek%2B19lCYJXxu%2FH%2BS%2ByPY90Kvi7yScND8xVW%2BST90%2FSApSLhXlYIA%2BLzI6wow89KYBamN5y8Gow%3D%3D&crl=c (accessed on 2 June 2014). [CrossRef] [Green Version]
- Popp, A.; Dietrich, J.P.; Lotze-Campen, H.; Klein, D.; Bauer, N.; Krause, M.; Beringer, T.; Gerten, D.; Edenhofer, O. The economic potential of bioenergy for climate change mitigation with special attention given to implications for the land system. Environ. Res. Lett. 2011, 6, 034017. [Google Scholar] [CrossRef]
- Hsu, D.D.; Inman, D.; Heath, G.A.; Wolfrum, E.J.; Mann, M.K.; Aden, A. Life Cycle Environmental Impacts of Selected U.S. Ethanol Production and Use Pathways in 2022. Environ. Sci. Technol. 2010, 44, 5289–5297. [Google Scholar] [CrossRef]
- Liu, W.; Wang, J.; Richard, T.L.; Hartley, D.S.; Spatari, S.; Volk, T.A. Economic and life cycle assessments of biomass utilization for bioenergy products. Biofuels Bioprod. Biorefining 2017, 11, 633–647. [Google Scholar] [CrossRef]
- Lo, S.-L.; Ma, H.-W. Quantifying and reducing uncertainty in life cycle assessment using the Bayesian Monte Carlo method. Sci. Total Environ. 2005, 340, 23–33. [Google Scholar] [CrossRef] [PubMed]
- Sonnemann, G.; Schuhmacher, M.; Castells, F. Uncertainty assessment by a Monte Carlo simulation in a life cycle inventory of electricity produced by a waste incinerator. J. Clean. Prod. 2003, 11, 279–292. [Google Scholar] [CrossRef]
- Heijungs, R.; Huijbregts, M.A. A review of approaches to treat uncertainty in LCA. In Proceedings of the 2nd International Congress on Environmental Modelling and Software, Osnabrück, Germany, 14–17 June 2004. [Google Scholar]
- Huijbregts, M.A.J. Uncertainty and variability in environmental life-cycle assessment. Int. J. Life Cycle Assess. 2002, 7, 173. [Google Scholar] [CrossRef] [Green Version]
- Huijbregts, M.A. Application of uncertainty and variability in LCA. Int. J. Life Cycle Assess. 2013, 3, 273. [Google Scholar] [CrossRef]
- Geisler, G.; Hellweg, S.; Hungerbühler, K. Uncertainty analysis in life cycle assessment (LCA): Case study on plant-protection products and implications for decision making (9 pp + 3 pp). Int. J. Life Cycle Assess. 2005, 10, 184–192. [Google Scholar] [CrossRef]
- Guo, M.; Murphy, R. LCA data quality: Sensitivity and uncertainty analysis. Sci. Total Environ. 2012, 435, 230–243. [Google Scholar] [CrossRef]
- Nguyen, L.; Cafferty, K.; Searcy, E.M.; Spatari, S. Uncertainties in Life Cycle Greenhouse Gas Emissions from Advanced Biomass Feedstock Logistics Supply Chains in Kansas. Energies 2014, 7, 7125–7146. [Google Scholar] [CrossRef] [Green Version]
- Gold, S.; Seuring, S. Supply chain and logistics issues of bio-energy production. J. Clean. Prod. 2011, 19, 32–42. [Google Scholar] [CrossRef]
- Sukumaran, R.K.; Surender, V.J.; Sindhu, R.; Binod, P.; Janu, K.U.; Sajna, K.V.; Rajasree, K.P.; Pandey, A. Lignocellulosic ethanol in India: Prospects, challenges and feedstock availability. Bioresour. Technol. 2010, 101, 4826–4833. [Google Scholar] [CrossRef]
- Puri, M.; Abraham, R.E.; Barrow, C.J. Biofuel production: Prospects, challenges and feedstock in Australia. Renew. Sustain. Energy Rev. 2012, 16, 6022–6031. [Google Scholar] [CrossRef]
- Hari, T.K.; Yaakob, Z.; Binitha, N.N. Aviation biofuel from renewable resources: Routes, opportunities and challenges. Renew. Sustain. Energy Rev. 2015, 42, 1234–1244. [Google Scholar] [CrossRef]
- Zhao, X.; Brown, T.R.; Tyner, W.E. Stochastic techno-economic evaluation of cellulosic biofuel pathways. Bioresour. Technol. 2015, 198, 755–763. [Google Scholar] [CrossRef] [PubMed]
- Zhang, Y.; Brown, T.R.; Hu, G.; Brown, R.C. Techno-economic analysis of two bio-oil upgrading pathways. Chem. Eng. J. 2013, 225, 895–904. [Google Scholar] [CrossRef]
- U.S. Energy Information Administration. EIA—Electricity Data. EIA Independent Statistics and Analysis, 24 April 2020. Available online: https://www.eia.gov/electricity/monthly/epm_table_grapher.php?t=epmt_5_6_a (accessed on 30 April 2020).
- U.S. Energy Information Administration. Electric Power Monthly—U.S. Energy Information Administration (EIA). Available online: https://www.eia.gov/electricity/monthly/epm_table_grapher.php (accessed on 16 November 2020).
- Klein, J.; Rhyne, I.; Bender, S.; Jones, M. Comparative Costs of California Central Station Electricity Generation. CEC-200-2009-07SF, January 2010. Available online: http://large.stanford.edu/courses/2015/ph240/crane2/docs/cec-200-2009-07sf.pdf (accessed on 16 November 2020).
- Bauer, L. Biomass Pyrolysis Comes of Age. Biofuels Digest, 8 June 2017. Available online: https://www.biofuelsdigest.com/bdigest/2017/06/08/biomass-pyrolysis-comes-of-age/ (accessed on 21 June 2020).
- Macrotrends LLC. WTI Crude Oil Prices—10 Year Daily Chart, Macrotrends. 2020. Available online: https://www.macrotrends.net/2516/wti-crude-oil-prices-10-year-daily-chart (accessed on 12 November 2020).
- Bioenergy Technologies Office. Multi-Year Program Plan; Department of Energy: Washington, DC, USA, 2016. [Google Scholar]
- Klöpffer, W. Life cycle assessment. Environ. Sci. Pollut. Res. 1997, 4, 223–228. [Google Scholar] [CrossRef]
- Wu, J.; Wang, J.; McNeel, J. Economic modeling of woody biomass utilization for bioenergy and its application in central Appalachia, USA. Can. J. For. Res. 2011, 41, 165–179. [Google Scholar] [CrossRef]
- National Renewable Energy Laboratory. U.S. Life Cycle Inventory Database. 2012. Available online: https://www.lcacommons.gov/nrel/search (accessed on 19 November 2019).
- Wang, Y.; Wang, J.; Schuler, J.; Hartley, D.; Volk, T.; Eisenbies, M. Optimization of harvest and logistics for multiple lignocellulosic biomass feedstocks in the northeastern United States. Energy 2020, 197, 117260. [Google Scholar] [CrossRef]
- PRé Consultants. Introduction to LCA with SimaPro.pdf. January 2016. Available online: https://www.pre-sustainability.com/legacy/download/SimaPro8IntroductionToLCA.pdf (accessed on 2 September 2019).
- Wernet, G.; Bauer, C.; Steubing, B.; Reinhard, J.; Moreno-Ruiz, E.; Weidema, B.P. The ecoinvent database version 3 (part I): Overview and methodology. Int. J. Life Cycle Assess. 2016, 21, 1218–1230. [Google Scholar] [CrossRef]
- Liu, W.; Zhang, Z.; Xie, X.; Yu, Z.; Von Gadow, K.; Xu, J.; Zhao, S.; Yang, Y. Analysis of the Global Warming Potential of Biogenic CO2 Emission in Life Cycle Assessments. Sci. Rep. 2017, 7, 39857. [Google Scholar] [CrossRef] [Green Version]
- Boulay, A.-M.; Bouchard, C.; Bulle, C.; Deschênes, L.; Margni, M. Categorizing water for LCA inventory. Int. J. Life Cycle Assess. 2011, 16, 639–651. [Google Scholar] [CrossRef]
- Frischknecht, R.; Jungbluth, N.; Althaus, H.; Bauer, C.; Doka, G.; Dones, R.; Hischier, R.; Hellweg, S.; Humbert, S.; Köllner, T.; et al. Implementation of Life Cycle Impact Assessment Methods; Ecoinvent Report No. 3; Swiss Centre for Life Cycle Inventories: Dübendorf, Switzerland, 2007. [Google Scholar]
- Frischknecht, R.; Wyss, F.; Knöpfel, S.B.; Lützkendorf, T.; Balouktsi, M. Cumulative energy demand in LCA: The energy harvested approach. Int. J. Life Cycle Assess. 2015, 20, 957–969. [Google Scholar] [CrossRef]
- Frischknecht, R.; Heijungs, R.; Hofstetter, P. Einstein’ssons for energy accounting in LCA. Int. J. Life Cycle Assess. 1998, 3, 266–272. [Google Scholar] [CrossRef] [Green Version]
- Žižlavský, O. Net Present Value Approach: Method for Economic Assessment of Innovation Projects. Procedia Soc. Behav. Sci. 2014, 156, 506–512. [Google Scholar] [CrossRef]
- Mahmoudi, M.; Sowlati, T.; Sokhansanj, S. Logistics of supplying biomass from a mountain pine beetle-infested forest to a power plant in British Columbia. Scand. J. For. Res. 2009, 24, 76–86. [Google Scholar] [CrossRef]
- Mobini, M.; Sowlati, T.; Sokhansanj, S. Forest biomass supply logistics for a power plant using the discrete-event simulation approach. Appl. Energy 2011, 88, 1241–1250. [Google Scholar] [CrossRef]
- McKendry, P. Energy production from biomass (part 1): Overview of biomass. Bioresour. Technol. 2002, 83, 37–46. [Google Scholar] [CrossRef]
- McKendry, P. Energy production from biomass (part 2): Conversion technologies. Bioresour. Technol. 2002, 83, 47–54. [Google Scholar] [CrossRef]
- McKendry, P. Energy production from biomass (part 3): Gasification technologies. Bioresour. Technol. 2002, 83, 55–63. [Google Scholar] [CrossRef]
- Anderson, V. Alternative Economic Indicators (Routledge Revivals); Routledge: London, UK, 2014. [Google Scholar]
- Rubinstein, R.Y.; Kroese, D.P. Simulation and the Monte Carlo Method; John Wiley & Sons: Hoboken, NJ, USA, 2016. [Google Scholar]
- Löwgren, B.H.; Weigert, J.; Esche, E.; Repke, J.-U. Uncertainty Analysis for Data-Driven Chance-Constrained Optimization. Sustainability 2020, 12, 2450. [Google Scholar] [CrossRef] [Green Version]
- Röder, M.; Whittaker, C.; Thornley, P. How certain are greenhouse gas reductions from bioenergy? Life cycle assessment and uncertainty analysis of wood pellet-to-electricity supply chains from forest residues. Biomass Bioenergy 2015, 79, 50–63. [Google Scholar] [CrossRef]
- Rasheed, R.; Khan, N.; Yasar, A.; Su, Y.; Tabinda, A.B. Design and cost-benefit analysis of a novel anaerobic industrial bioenergy plant in Pakistan. Renew. Energy 2016, 90, 242–247. [Google Scholar] [CrossRef]
- Jagannathan, R.; Matsa, D.A.; Meier, I.; Tarhan, V. Why Do Firms Use High Discount Rates? J. Financ. Econ. 2016, 120, 445–463. [Google Scholar] [CrossRef]
- Spath, P.L.; Mann, M.K. Biomass Power and Conventional Fossil Systems with and without CO2 Sequestration—Comparing the Energy Balance, Greenhouse Gas Emissions and Economics; EERE Publication and Product Library: Washington, DC, USA, 2004; p. 38. [Google Scholar]
- Hsu, D.D. Life cycle assessment of gasoline and diesel produced via fast pyrolysis and hydroprocessing. Biomass Bioenergy 2012, 45, 41–47. [Google Scholar] [CrossRef] [Green Version]
- Steele, P.; Puettmann, M.E.; Penmetsa, V.K.; Cooper, J.E. Life-Cycle Assessment of Pyrolysis Bio-Oil Production. For. Prod. J. 2012, 62, 326–334. [Google Scholar] [CrossRef]
- Cherubini, F.; Jungmeier, G. LCA of a biorefinery concept producing bioethanol, bioenergy, and chemicals from switchgrass. Int. J. Life Cycle Assess. 2010, 15, 53–66. [Google Scholar] [CrossRef]
- Nuss, P.; Gardner, K.H.; Jambeck, J.R. Comparative Life Cycle Assessment (LCA) of Construction and Demolition (C&D) Derived Biomass and U.S. Northeast Forest Residuals Gasification for Electricity Production. Environ. Sci. Technol. 2013, 47, 3463–3471. [Google Scholar] [PubMed]
- Tidball, R.; Bluestein, J.; Rodriguez, N.; Knoke, S.; International, I.; Macknick, J. Cost and Performance Assumptions for Modeling Electricity Generation Technologies; National Renewable Energy Lab: Golden, CO, USA, 2010; p. 221. [Google Scholar]
- Sultana, A.; Kumar, A.; Harfield, D. Development of agri-pellet production cost and optimum size. Bioresour. Technol. 2010, 101, 5609–5621. [Google Scholar] [CrossRef]
- Swanson, R.M.; Platon, A.; Satrio, J.A.; Brown, R.C. Techno-economic analysis of biomass-to-liquids production based on gasification. Fuel 2010, 89, S11–S19. [Google Scholar] [CrossRef] [Green Version]
- Zhang, X.; Wang, J.; Vance, J.; Wang, Y.; Wu, J.; Hartley, D.S. Data Analytics for Enhancement of Forest and Biomass Supply Chain Management. Curr. For. Rep. 2020, 6, 129–142. [Google Scholar] [CrossRef]


| Parameter | Base Cases | ||
|---|---|---|---|
| Pellet | Biopower | Biofuel | |
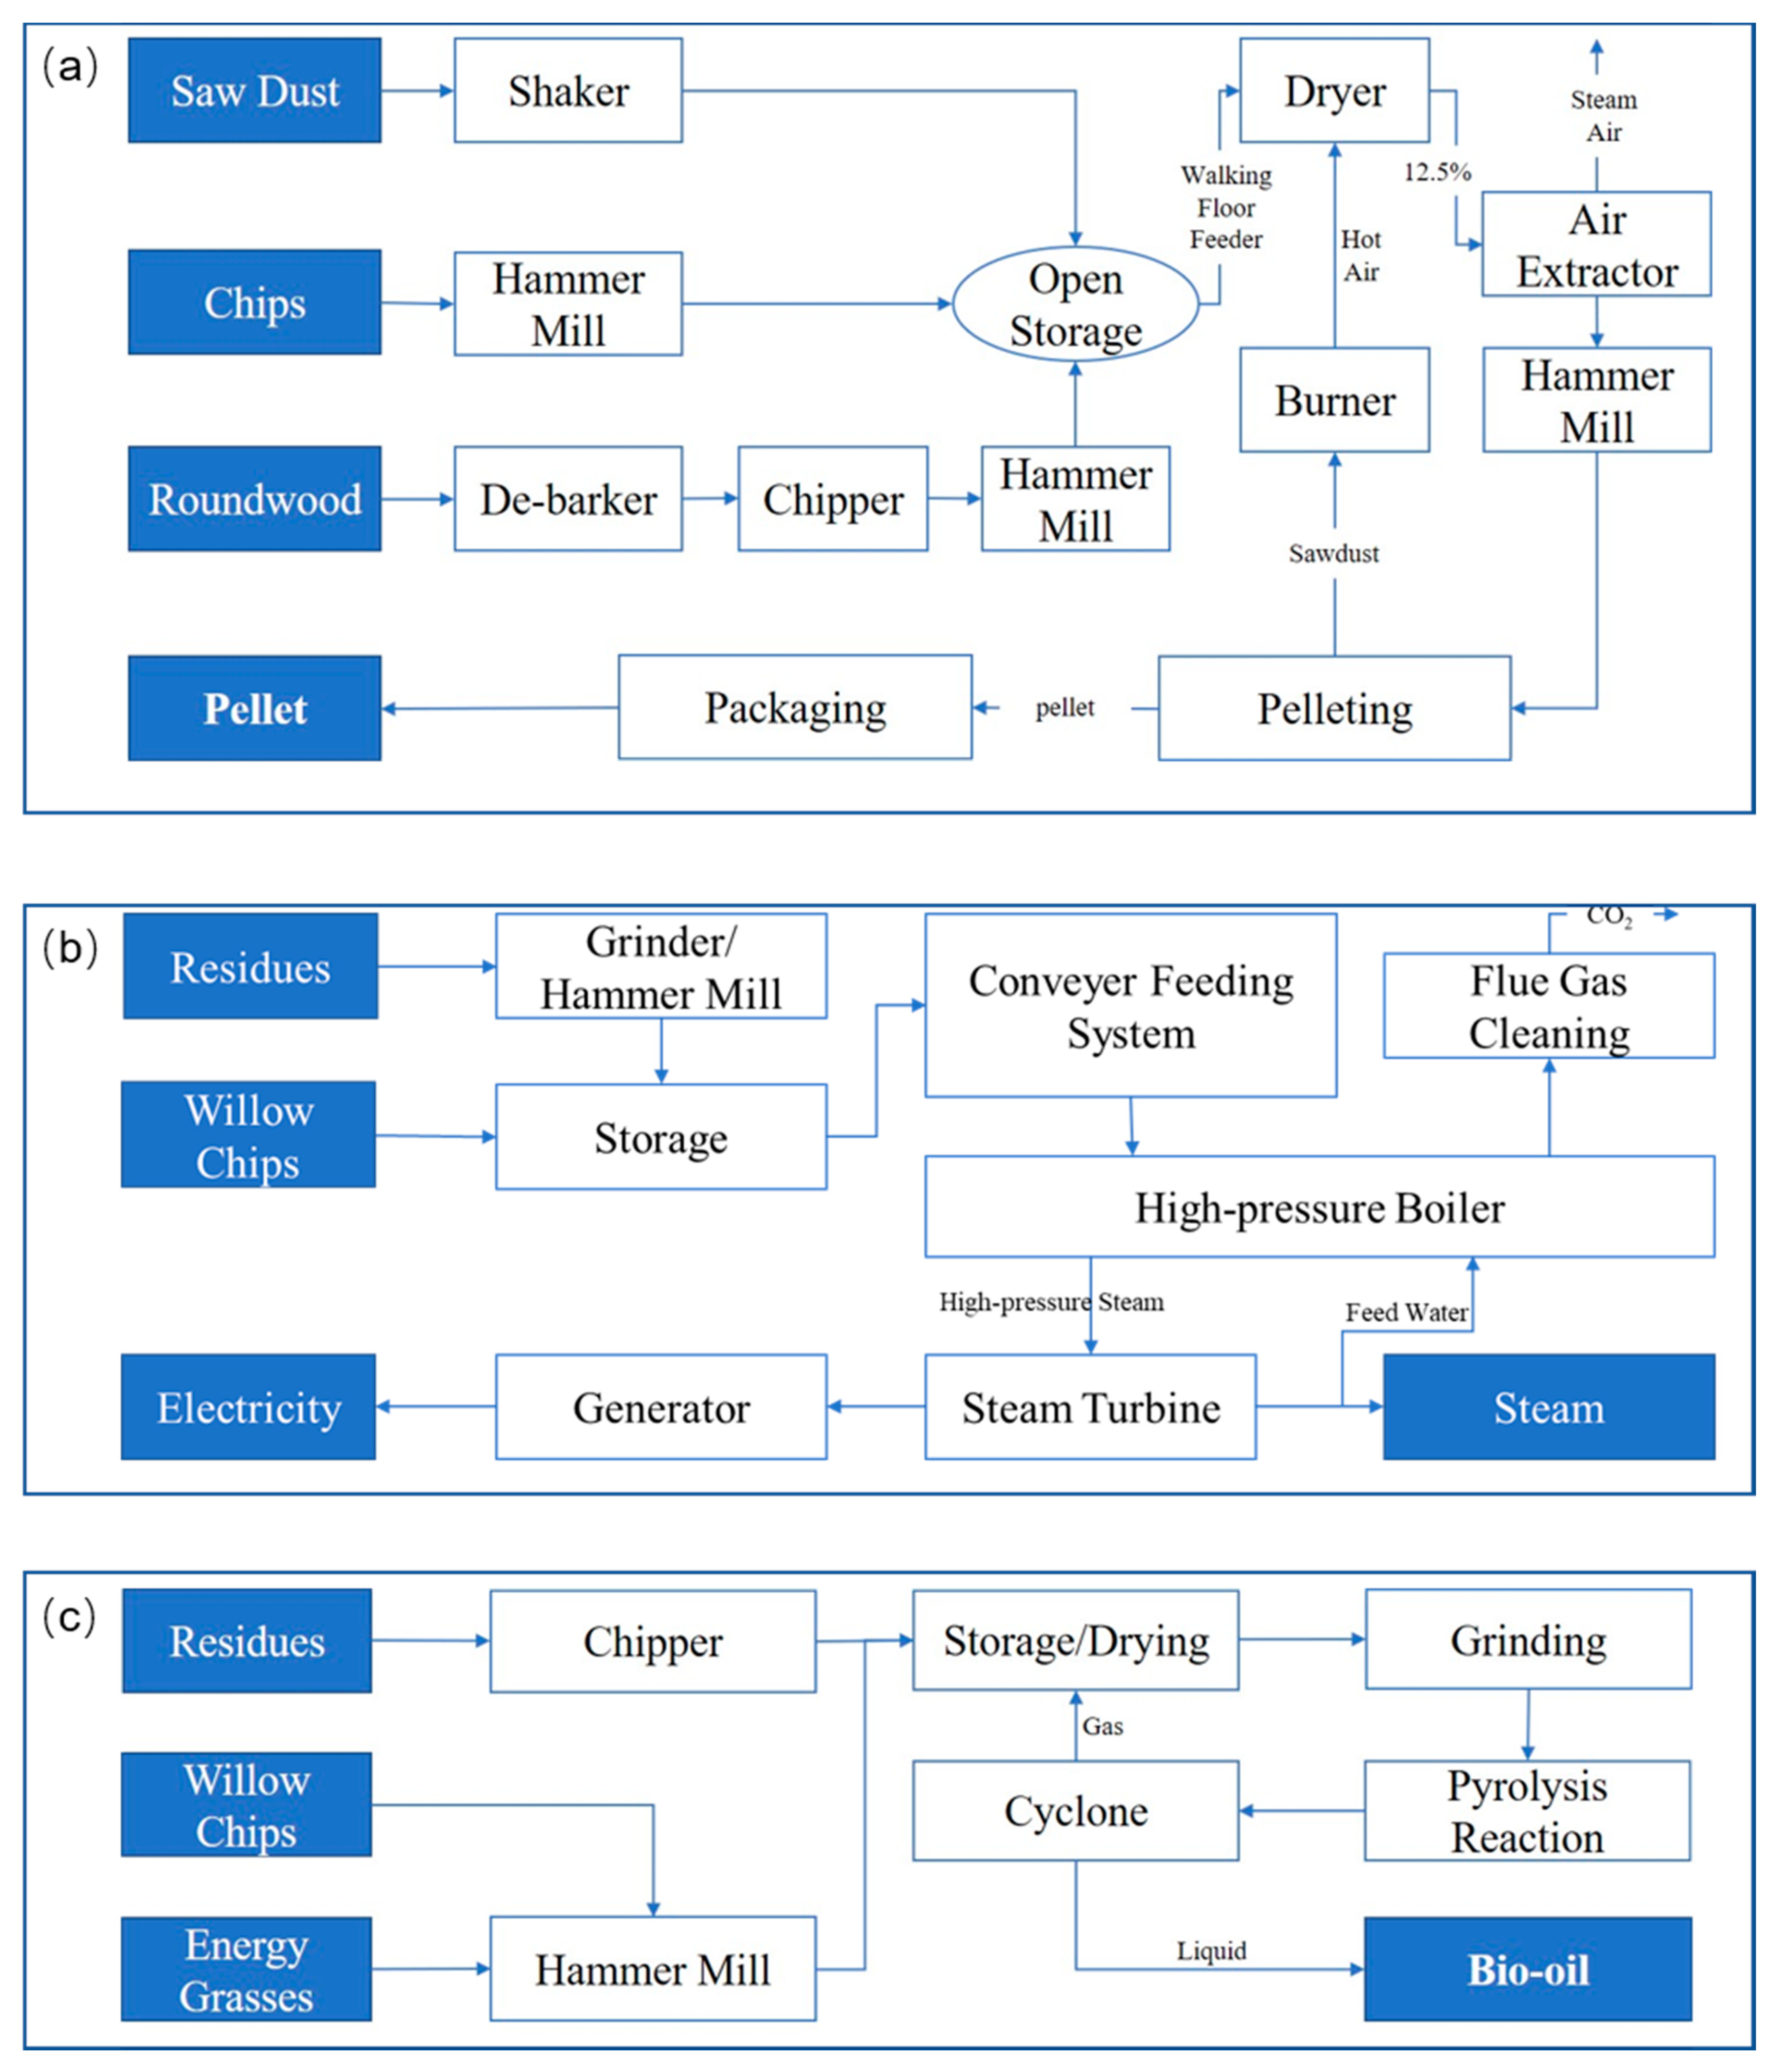
| Production technology | pellet mill | combustion with steam turbine | fast pyrolysis |
| Products | pellets | electricity | pyrolysis bio-oil |
| Annual yield | 46,929 Mg | 223,380,000 KWh | 78,000 Barrels (bbl) |
| Product sale price | $185/Mg 1 | $0.105/KWh [54] | $54/bbl [57] |
| Price Range | $180–210/Mg | $0.08–0.26/KWh | $11.26–106.26/bbl |
| Product yield rate (from per dry Mg of feedstock) | 0.83 Mg of pellet 1 | 1.53 MWh of electricity | 2.17 bbl of pyrolysis oil |
| Capital Investment | $4,403,744 | $71,616,960 | $106,015,291 |
| Annual operation cost | $4,046,745 | $3,560,469 | $612,069 |
| Feedstock price | $84/dry Mg | $84/dry Mg | $84/dry Mg |
| Variable | Scenarios | Minimum | Base Case | Maximum | Distribution |
|---|---|---|---|---|---|
| Parameters of Life Cycle Inventory | |||||
| Diesel Consumption in Collection (per dry Mg biomass, L) | All | 4.97 | 6.21 | 7.45 | Uniform |
| Lubricant Oil Consumption (per dry Mg biomass, kg) | All | 0.048 | 0.06 | 0.072 | Beta |
| Pellet Annual Production (Mg) | Pellet | 37,543 | 46,929 | 56,314 | Triangular |
| Electricity Annual Production (MWh) | Biopower | 178,704 | 223,380 | 268,056 | Triangular |
| Pyrolysis oil Annual Production (bbl) | Biofuel | 62,400 | 78,000 | 93,600 | Triangular |
| Parameters of Techno-Economic Assessment | |||||
| Pellet Conversion Rate (Mg per dry Mg feedstock) | Pellet | 0.81 | 0.83 | 0.90 | Beta |
| Electricity Conversion Rate (MWh per dry Mg feedstock) | Biopower | 1.37 | 1.53 | 1.68 | Beta |
| Liquid Bio-oil Conversion Rate (bbl per dry Mg feedstock) | Biofuel | 1.89 | 2.17 | 2.56 | Beta |
| Increase over previous year | All | 0% | 0% | N/A | Lognormal |
| Pellets Sales Price (per Mg) | Pellet | $180 | $185 | $210 | Beta |
| Electricity Sales Price (per KWh) | Biopower | $0.08 | $0.105 | $0.26 | Beta |
| Liquid Bio-oil Sales Price ($/bbl) | Biofuel | $11.26 | $54 | $106 | Beta |
| Biomass Feedstock Price (per dry Mg) | All | $69 | $84 | $136 | Beta |
| Discount rate | All | 0% | 5% | N/A | Lognormal |
| Products | Impact Factor | Bioenergy Supply Chain Components | Total LCA Impacts | |||
|---|---|---|---|---|---|---|
| Feedstock Collection | Transportation | Storage and Preprocessing | Conversion | |||
| Pellet | Greenhouse Gas Emission (kg CO2 eq) | 1.239 | 0.294 | 2.394 | 4.368 | 8.29 |
| Blue Water Consumption (kg) | 0.01 | 0.04 | 0.01 | 0.41 | 0.46 | |
| Fossil Energy Consumption (MJ) | 2.37 | 6.08 | 2.55 | 94.42 | 105.42 | |
| Biopower | Greenhouse Gas Emission (kg CO2 eq) | 3.24 | 6.33 | 2.14 | 3.87 | 15.58 |
| Blue Water Consumption (kg) | 0.05 | 0.36 | 0.07 | 0.25 | 0.73 | |
| Fossil Energy Consumption (MJ) | 6.77 | 53.93 | 18.43 | 107.04 | 186.17 | |
| Biofuel | Greenhouse Gas Emission (kg CO2 eq) | 2.93 | 3.74 | 0.62 | 23.29 | 30.58 |
| Blue Water Consumption (kg) | 0.12 | 0.36 | 0.08 | 3.84 | 4.40 | |
| Fossil Energy Consumption (MJ) | 16.93 | 43.42 | 16.26 | 602.38 | 678.98 | |
| Parameter | Bioenergy Production Cases | ||
|---|---|---|---|
| Pellet | Biopower | Biofuel | |
| Bioenergy production summary | |||
| Plant life (year) | 16 | 25 | 20 |
| Feedstock consumption (dry Mg) | 848,114 | 3,505,217 | 666,900 |
| Bioenergy production | 703,935 Mg | 5,361,120 MWh | 1,482,000 bbl |
| Economic feasibility summary | |||
| Total investment cost ($) | 4,403,744 | 149,550,000 | 106,015,291 |
| Total feedstock cost ($) | 71,241,614 | 294,438,187 | 56,019,600 |
| Total operating cost ($) | 50,701,175 | 85,451,256 | 11,629,319 |
| Total revenue ($) | 139,236,253 | 565,623,106 | 80,028,000 |
| Net Present Value (NPV) ($) | 1,201,069 | 5,588,915 | (98,998,847) |
| Discount rate (%) | 5 | 5 | 5 |
Publisher’s Note: MDPI stays neutral with regard to jurisdictional claims in published maps and institutional affiliations. |
© 2020 by the authors. Licensee MDPI, Basel, Switzerland. This article is an open access article distributed under the terms and conditions of the Creative Commons Attribution (CC BY) license (http://creativecommons.org/licenses/by/4.0/).
Share and Cite
Wang, Y.; Wang, J.; Zhang, X.; Grushecky, S. Environmental and Economic Assessments and Uncertainties of Multiple Lignocellulosic Biomass Utilization for Bioenergy Products: Case Studies. Energies 2020, 13, 6277. https://doi.org/10.3390/en13236277
Wang Y, Wang J, Zhang X, Grushecky S. Environmental and Economic Assessments and Uncertainties of Multiple Lignocellulosic Biomass Utilization for Bioenergy Products: Case Studies. Energies. 2020; 13(23):6277. https://doi.org/10.3390/en13236277
Chicago/Turabian StyleWang, Yuxi, Jingxin Wang, Xufeng Zhang, and Shawn Grushecky. 2020. "Environmental and Economic Assessments and Uncertainties of Multiple Lignocellulosic Biomass Utilization for Bioenergy Products: Case Studies" Energies 13, no. 23: 6277. https://doi.org/10.3390/en13236277