Article

Coordinated Control of a Hybrid Energy Storage System for Improving the Capability of Frequency Regulation and State-of-Charge Management

1
Department of Energy System Engineering, Inje University, Gimhae 50834, Korea
2
School of Electrical and Electronic Engineering, Yonsei University, Seoul 03722, Korea
*
Author to whom correspondence should be addressed.
Energies 2020, 13(23), 6304; https://doi.org/10.3390/en13236304
Submission received: 19 October 2020 / Revised: 24 November 2020 / Accepted: 25 November 2020 / Published: 29 November 2020

Abstract

:
The paper proposes a coordinated operation method of two independent storages for managing state-of-charge (SOC) and for providing ancillary service concerning frequency regulation (FR); furthermore, this article also introduces the power allocation scheme between two storages in consideration of the coverage of the frequency band for each storage along with the SOC management scheme of the supercapacitor and battery. We also provide a guideline for the storage sizing on the basis of the smoothing time constant. Additionally, we verify the advantage of the HESS in extending the lifetime of the battery, which is estimated by a real-time state-of-health (SOH) calculation method. The Bode plot of the proposed method is analyzed to observe the power spectrum coverage in the frequency domain through the case studies using PSCAD/EMTDC and MATLAB.

1. Introduction

The high penetration of renewable energy resources (RES) poses significant challenges to grid frequency regulation (FR) in maintaining the stability and reliability of the power system [1,2]. Thus, energy storage systems (ESSs) are considered as a promising technology to provide FR service for ensuring stability by balancing the power generation and load demand [3,4,5]. The integration of energy storage device with RES to reduce the fluctuation of grid frequency has been widely conducted [4,5,6,7,8,9,10,11,12,13]. The various types of ESS technology have been researched for FR such as battery ESSs (BESSs) [4,5,11,12], SCs [13], superconducting magnetic energy storage (SMES) [10], and flywheels [9]. However, a battery is characterized as low power and high energy density, indicating that the battery has an adverse impact with a quick response in a transient instant. Therefore, numerous research efforts in regards to FR hybrid energy storage systems (HESSs) as the combination of batteries with high power density devices such as SCs, SMES, and flywheels have been conducted [14,15,16,17,18,19].
Frequency regulation can be attained by three different control levels, namely primary, secondary, and tertiary regulation [20]. The primary frequency control can be considered as the fastest frequency control, which restores the balance between the generated power and load power demand within a few seconds using droop control. The nominal frequency control is restored within a few minutes in the secondary control, which is controlled by changing the set point on the generator participating in automatic generation control (AGC). Finally, the tertiary control restores optimal characteristics in up to one hour. Several ESS applications have been conducted to provide FR by incorporating a droop control method while considering the SOC level [4,5,21,22,23,24,25]. For instance, the droop control with state-of-charge (SOC) feedback (DSOF) is proposed for improving the frequency response and regulation service of multiple ESSs to a system with high wind power penetration [4]. In the same manner, the benefits of the droop control algorithm for multiple ESSs with the SOC feedback in providing regulation service have been provided [5]. However, the existing FR method may not consider the lifetime of the battery, and an HESS sizing guideline composed of the battery and SC has not been formulated.
Thus, this paper proposes an FR method using the HESS while considering SOC management based on droop control with SOC feedback (DSOF). The advantage of the proposed method in extending the lifetime of the battery is assessed using real-time state-of-health (SOH) calculation. The main contributions of this paper are as follows:
  • An HESS control method with SOC management for FR application.
  • Power allocation of an SC and battery in the HESS based on the coverage of the frequency band.
  • Guideline for HESS sizing based on the proposed method.
  • Investigation of battery lifetime extension in the HESS using SOH calculation.
The rest of the paper is organized as follows: In Section 2, the proposed FR method of the HESS considering SOC management using DSOF is mathematically analyzed using the transfer function and block diagram. In Section 3, the performance of the DSOF method is assessed using a frequency and time domain analysis. Subsequently, the advantage of the proposed method in expanding the battery lifetime is demonstrated using a real-time SOH estimation. Finally, the conclusion of the research is provided in Section 5.

2. Frequency Regulation Using a Hybrid Energy Storage System

In this section, we introduce the proposed FR method for mitigating the frequency fluctuation while managing the SOC level based on the DSOF method. Firstly, we present the FR method for WTs using the ESS while considering SOC using DSOF as a research background proposed in [4]. We also propose the power allocation control method for the battery and SC in the HESS relying on the energy feedback management on the basis of transfer functions. The effectiveness of the proposed method is assessed using frequency- and time-domain simulation.

2.1. Droop Control with SOC Feedback: Review

The DSOF method was proposed for FR application with a single ESS previously [4,5], which is illustrated in Figure 1. For FR, while managing the SOC level of the ESS based on the energy feedback method, the frequency offset ( f ofs ) is determined from Δ SOC and the unit conversion factor K f as in (1). In this method, Δ SOC and SOC cen are selected to calculate the f ofs of the ESS. First, we define SOC cen as the highest potential energy point for charging/discharging of the ESS [4,26], which is selected as 50% in this paper. Second, Δ SOC is defined as the difference between a measured SOC of the ESS and SOC cen as in (2). The unit conversion factor K f (Hz/%) plays an important role in this method to connect the SOC level and frequency as shown in (3) and Figure 1.
f ofs ( t ) = Δ SOC ( t ) · K f
Δ SOC ( t ) = SOC ( t ) SOC cen
K f = f ofs max f ofs min SOC tot
where f ofs is the frequency offset of the ESS, SOC ( t ) is the SOC of the ESS, Δ SOC is the deviation of SOC ( t ) , K f is the conversion factor between SOC and frequency, SOC tot is the SOC usage of the ESS, and f ofs max and f ofs min are the maximum and minimum value of frequency offset, respectively.
From the frequency deviation Δ f and the frequency offset f ofs , the droop control method can be applied with a droop rate ( R ESS ) for determining the compensation power of the ESS ( Δ P ESS ) as shown in (4). By substituting the unit conversion factor in (3) into the frequency offset of in (1) and the substituting frequency offset in (1) into the compensation power of ESS in (4), the compensation power of the ESS ( Δ P ESS ) can be derived as shown in (5). We define Δ SOC ref as the relationship between frequency deviation ( Δ f ( t ) ) with K f to observe the variation of the SOC as shown in (6), which implies that the frequency deviation determines the SOC reference of the ESS.
Δ P ESS ( t ) = 1 R ESS Δ f ( t ) f ofs ( t )
Δ P ESS ( t ) = K f R ESS ( Δ S O C ref ( t ) Δ S O C ( t ) )
Δ S O C ref ( t ) = Δ f ( t ) K f
where Δ P ESS is the ESS power, Δ f ( t ) is the frequency deviation, R ESS is the droop gain of the ESS, and Δ S O C ref is the reference of the SOC.
The operation of the ESS in releasing or absorbing of power due to the variation of the grid frequency results in the deviation of the SOC. As shown in Figure 1, the frequency offset ( f ofs , inc and f ofs , dec ) is proportional to the grid frequency ( Δ f 1 = f ofs , inc = K f · Δ SOC 1 , Δ f 2 = f ofs , dec = K f · Δ SOC 2 ). When the grid frequency increases ( Δ f 1 ), the ESS charges power as Δ P 1 , leading to the increase of the SOC ( Δ SOC 1 ), and f ofs ( t ) moves to f ofs , inc . Meanwhile, when the grid frequency decreases to Δ f 2 , the ESS will release the power ( Δ P 2 ) to the system, then the SOC decreases ( Δ SOC 2 ), and f ofs ( t ) moves to the f ofs , dec .

2.2. Proposed HESS Operation for FR

In this subsection, we introduce the proposed FR method using the HESS composed of the battery and SC for FR while managing the SOC level of the ESSs. The battery has a relatively high energy density, but a low power density, whereas the SC has a low energy density with relatively high power density [26]. For this reason, the battery responds to the slow frequency fluctuation, and the SC responds to fast frequency fluctuation as an unexpected variation of renewable generation. Additionally, we propose the power allocation control method of the HESS using transfer functions relying on an energy feedback management method (i.e., SOC feedback method) for reducing the frequency fluctuation of RES.

2.2.1. Proposed Hybrid ESS Operation Method

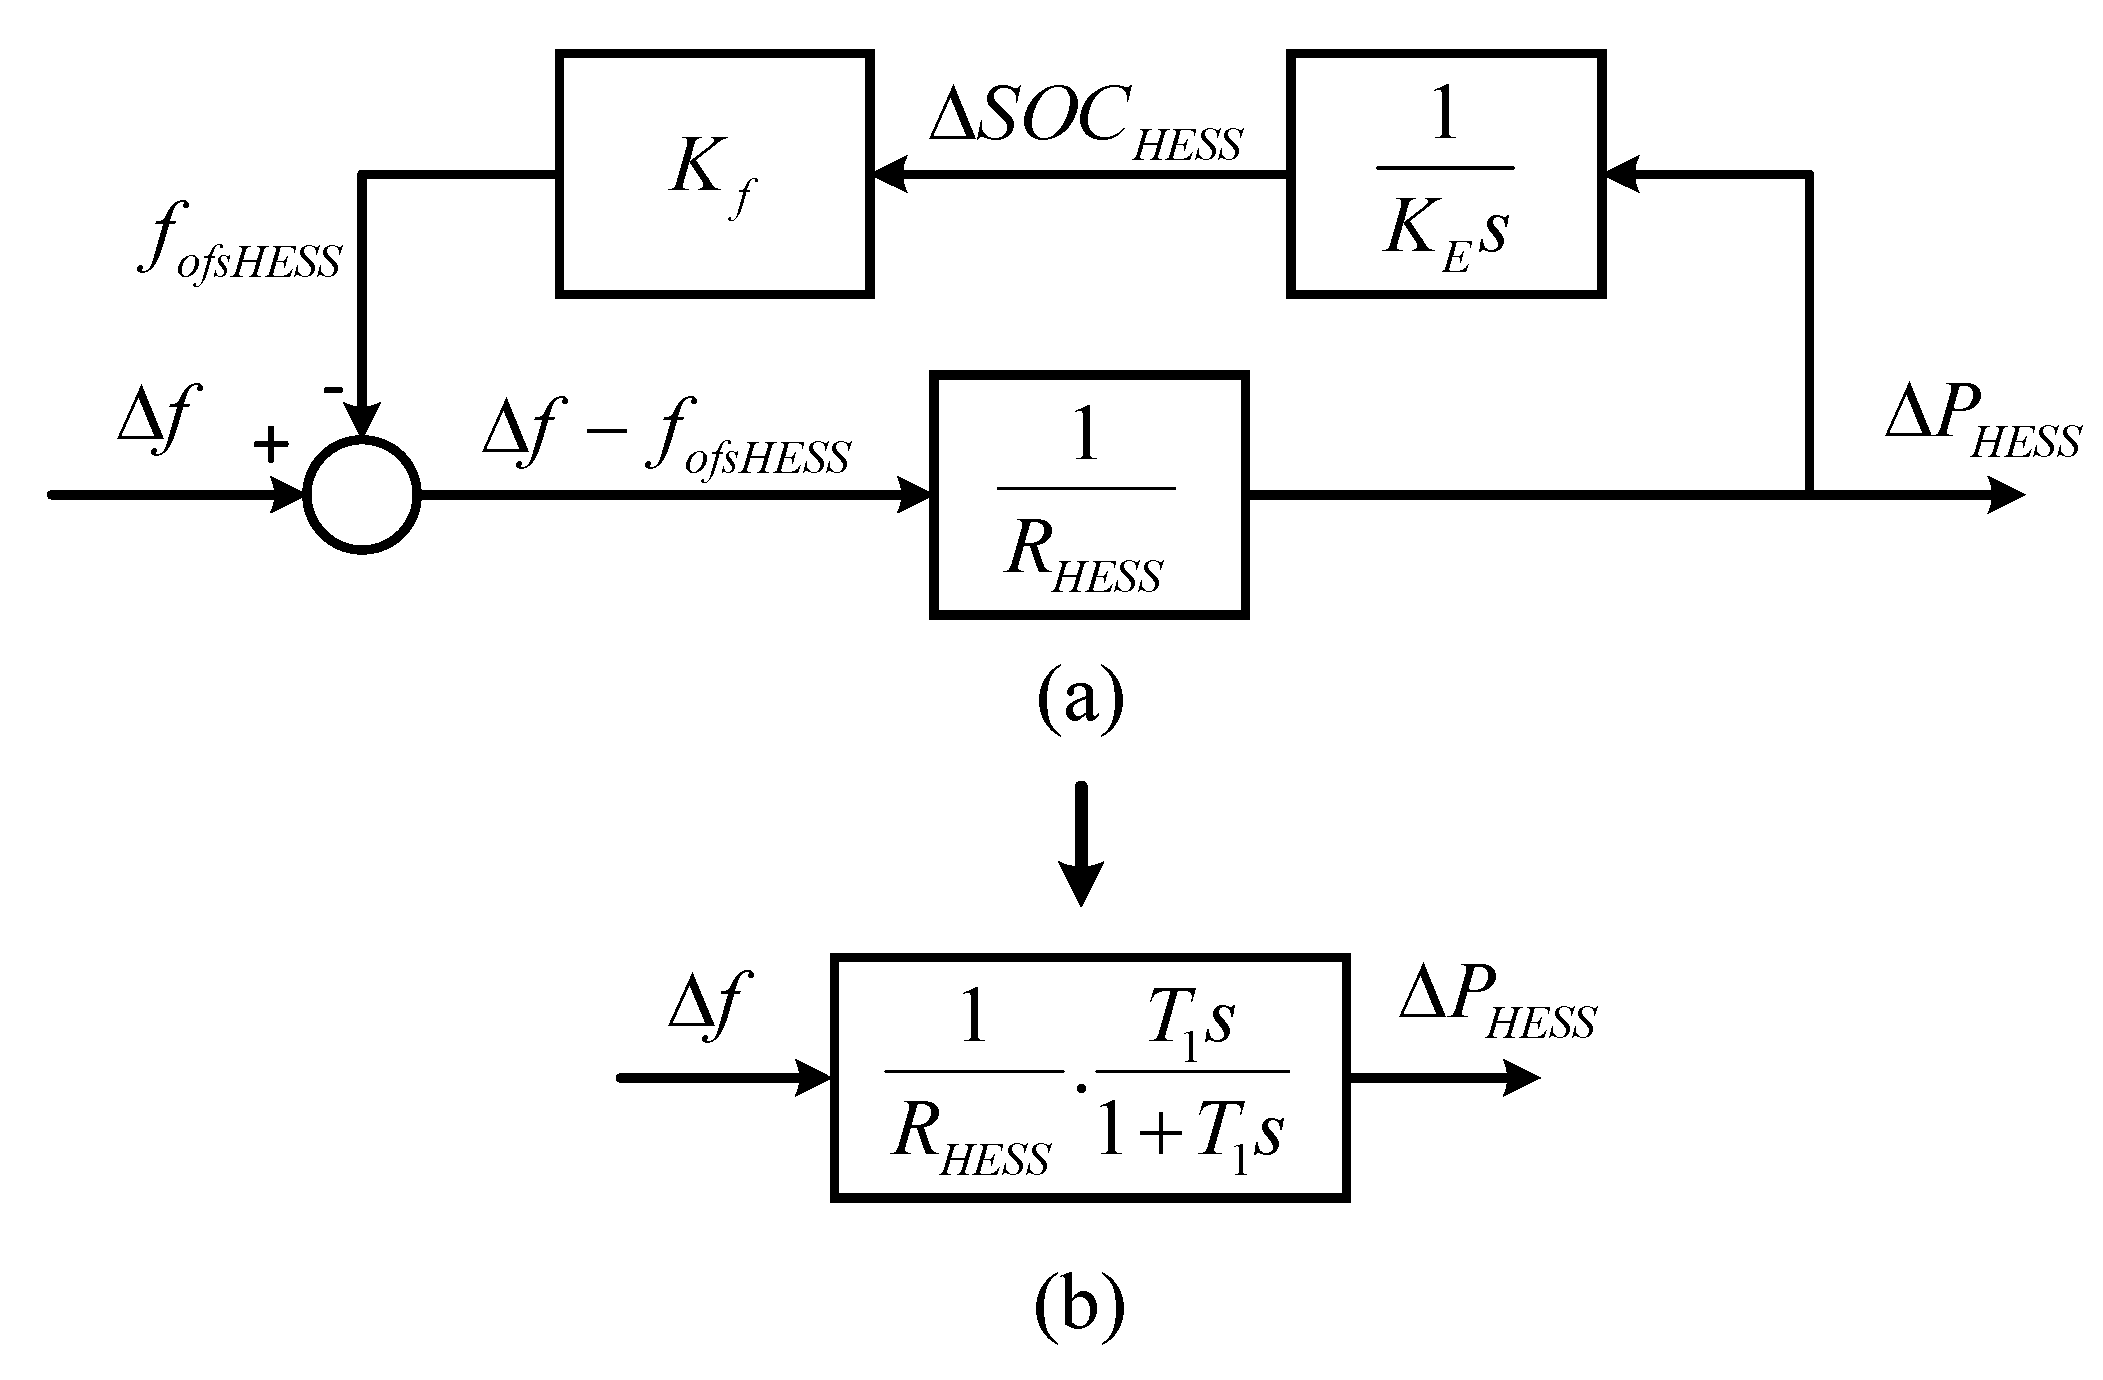
The block diagram of the proposed FR method based on the SOC feedback management using the HESS is shown in Figure 2a. We assume that the HESS mimics the operation as a single ESS, which monitors the fluctuation of the frequency for generating the frequency with lower fluctuation provided to the power system. In this method, the unit conversion factor K f connects the SOC and grid frequency as in (7) and links the frequency offset f ofs , HESS ( t ) with Δ SOC HESS ( t ) of the HESS for energy feedback management as in (8). As shown in Figure 2a, the frequency offset of the HESS ( f ofs , HESS ) calculated from the SOC ( Δ SOC HESS ) and the coefficient K f in (8) aim to manage the SOC level of the HESS. For the convenience of the SOC calculation, we define the SOC deviation ( Δ SOC HESS ( t ) ) as the difference of SOC HESS ( t ) from the central point of the SOC ( SOC cen ) as shown in (9). SOC cen can be considered as the highest potential energy point for charging/discharging, which selects the value of SOC cen as 50% in this research.
K f = f ofs max f ofs min SOC tot
f ofs , HESS ( t ) = Δ SOC HESS ( t ) · K f
Δ SOC HESS ( t ) = SOC HESS ( t ) SOC cen
where f ofs , HESS ( t ) is the frequency offset of the HESS, SOC cen is the central value of the SOC, Δ SOC HESS ( t ) is the SOC deviation of the HESS from SOC cen , SOC HESS ( t ) is the measured SOC of the HESS, K f is the conversion factor between the SOC and grid frequency of the HESS (Hz/%), f ofs max and f ofs min are the maximum and minimum of the compensation frequency range of the HESS, and SOC tot is the SOC usage of the HESS ranging from Δ SOC min to Δ SOC max .
In response to the frequency deviation, the compensation power of the HESS ( Δ P HESS ) is determined based on the droop control with the droop characteristic R HESS as shown in (10) and (11), respectively. This implies that the compensation power Δ P HESS results in a change in the SOC of the HESS. In this sense, the frequency offset reference ( f ofs , ref ) is identical to the grid frequency deviation ( Δ f = f ofs , ref = K f · Δ SOC ref ) implying that Δ f ( t ) leads to the change of Δ S O C ref ( t ) and makes Δ S O C HESS ( t ) follow Δ S O C ref ( t ) .
Δ P HESS ( t ) = 1 R HESS Δ f ( t ) f ofs , HESS ( t )
Δ P HESS ( t ) = K f R HESS ( Δ S O C ref ( t ) Δ S O C HESS ( t ) )
where Δ P HESS is the compensation power of the HESS, Δ f ( t ) is the frequency deviation from the nominal frequency ( f = 60 Hz), and R HESS is the droop rate of the HESS.
For the energy feedback management, the SOC of the HESS is determined based on the power and energy capacity of the HESS ( Δ P HESS and K E ) as shown in (12). By substituting (12) into the frequency offset of the HESS in (8) and substituting (8) into (10), the compensation power of the HESS ( Δ P HESS ) can be obtained as a type of high pass filter (HPF) as in (13) using Laplace transformation with the smoothing time constant T 1 in (14). This block diagram can be presented as an equivalent transfer function shown in Figure 2b.
SOC HESS ( t ) = 1 K E Δ P HESS ( t ) d t
G HESS ( s ) = Δ P HESS ( s ) Δ f ( s ) = 1 R HESS · T 1 s 1 + T 1 s
T 1 = R HESS · K E K f
where K E = E HESS · h is the energy of the HESS (MJ), E HESS is the size of the HESS in MWh, h is a factor that is used to change the unit from hours to seconds, and T 1 is time constant of the HESS.

2.2.2. Proposed Supercapacitor Operation Method

The determination of the SC power has several overlapping significant aspects: firstly, the power of the SC is controlled to react to the short period frequency fluctuations due to the SC characteristics such as high power density and low energy density; in other words, the SC is in charge of the high frequency components of the grid frequency. Secondly, the SC power determines the portion of power between the battery and the SC within the HESS configuration, which is related to the energy allocation for matching the SOC of two storages. For the control of the SC, we can control the SC as independent storage and also the portion between the SC and battery. As SOC management schemes are applied in the HESS and SC, both SOCs are autonomously managed.
Here, the frequency offset of the SC ( f ofs , SC ) is the feedback loop for allocating the SOC on the grid frequency, calculated from Δ SOC SC ( t ) with K f , SC as in (15) and (16), which proportionally changes from the SOC to grid frequency based on the operation range ( f ofs max f ofs min ) as in (17).
f ofs , SC ( t ) = Δ SOC SC · K f , SC
Δ SOC SC ( t ) = SOC SC ( t ) SOC cen
K f , SC = f ofs max f ofs min SOC tot , SC
where f ofs , SC ( t ) is frequency offset of the SC, Δ SOC SC ( t ) is the frequency deviation of the SC SOC from the central point SOC cen , which is the point of the highest potential energy for charging/discharging ( SOC cen = 50%), SOC SC ( t ) is the measured SOC of the SC, K f , SC is the conversion factor between the SOC and grid frequency of the SC, f ofs max and f ofs min are the maximum and minimum of compensation frequency range of the SC, and SOC tot is the SOC usage of the SC ranging from Δ SOC min to Δ SOC max .
In the response to the frequency deviation ( Δ f ), the compensation power of the SC is provided along with the droop characteristic of the SC R SC as in (17). This expression of the frequency deviation can be presented from the perspective of the SOC as in (19):
Δ P SC ( t ) = 1 R SC Δ f ( t ) f ofs , SC ( t )
Δ P SC ( t ) = K f , SC R SC ( Δ S O C ref ( t ) Δ S O C SC ( t ) )
where Δ SOC SC ( t ) is the deviation of the SC SOC ( SOC SC ) from the central SOC, SOC SC ( t ) is the measured SOC of the SC, f ofs , SC is the frequency offset of the SC, K f , SC is the conversion factor of the SC, which connects the grid frequency with the SOC of the SC, and R SC is the droop gain of the SC.
Originally, the SOC should be calculated with the current (A1) as in Appendix A; however, as previously mentioned, the SOC of the SC is assumed to be calculated by integrating the SC power ( Δ P SC ) as in (A2) in Appendix A and (20).
SOC SC ( t ) = 1 K E , SC Δ P SC ( t ) d t
As a result, the transfer function between the compensation power ( Δ P SC ) and frequency deviation ( Δ f ) of the SC can be obtained as shown in (21) with Laplace transformation, by substituting (20) into the frequency offset of the SC (15) and substituting (15) into (18). This transfer function becomes a type of high pass filter (HPF), especially the washout filter form with the gain R SC and the time constant ( T 2 ) as (21).
G SC ( s ) = Δ P SC ( s ) Δ f ( s ) = 1 R SC · T 2 s 1 + T 2 s
T 2 = R SC · K E , SC K f , SC
where K E , SC = E SC · h is the energy of the SC (MJ), E SC is the size of the SC in MWh, h is a factor to convert the unit from hours to seconds, and T 2 is the time constant of the SC.

2.2.3. Battery Operation

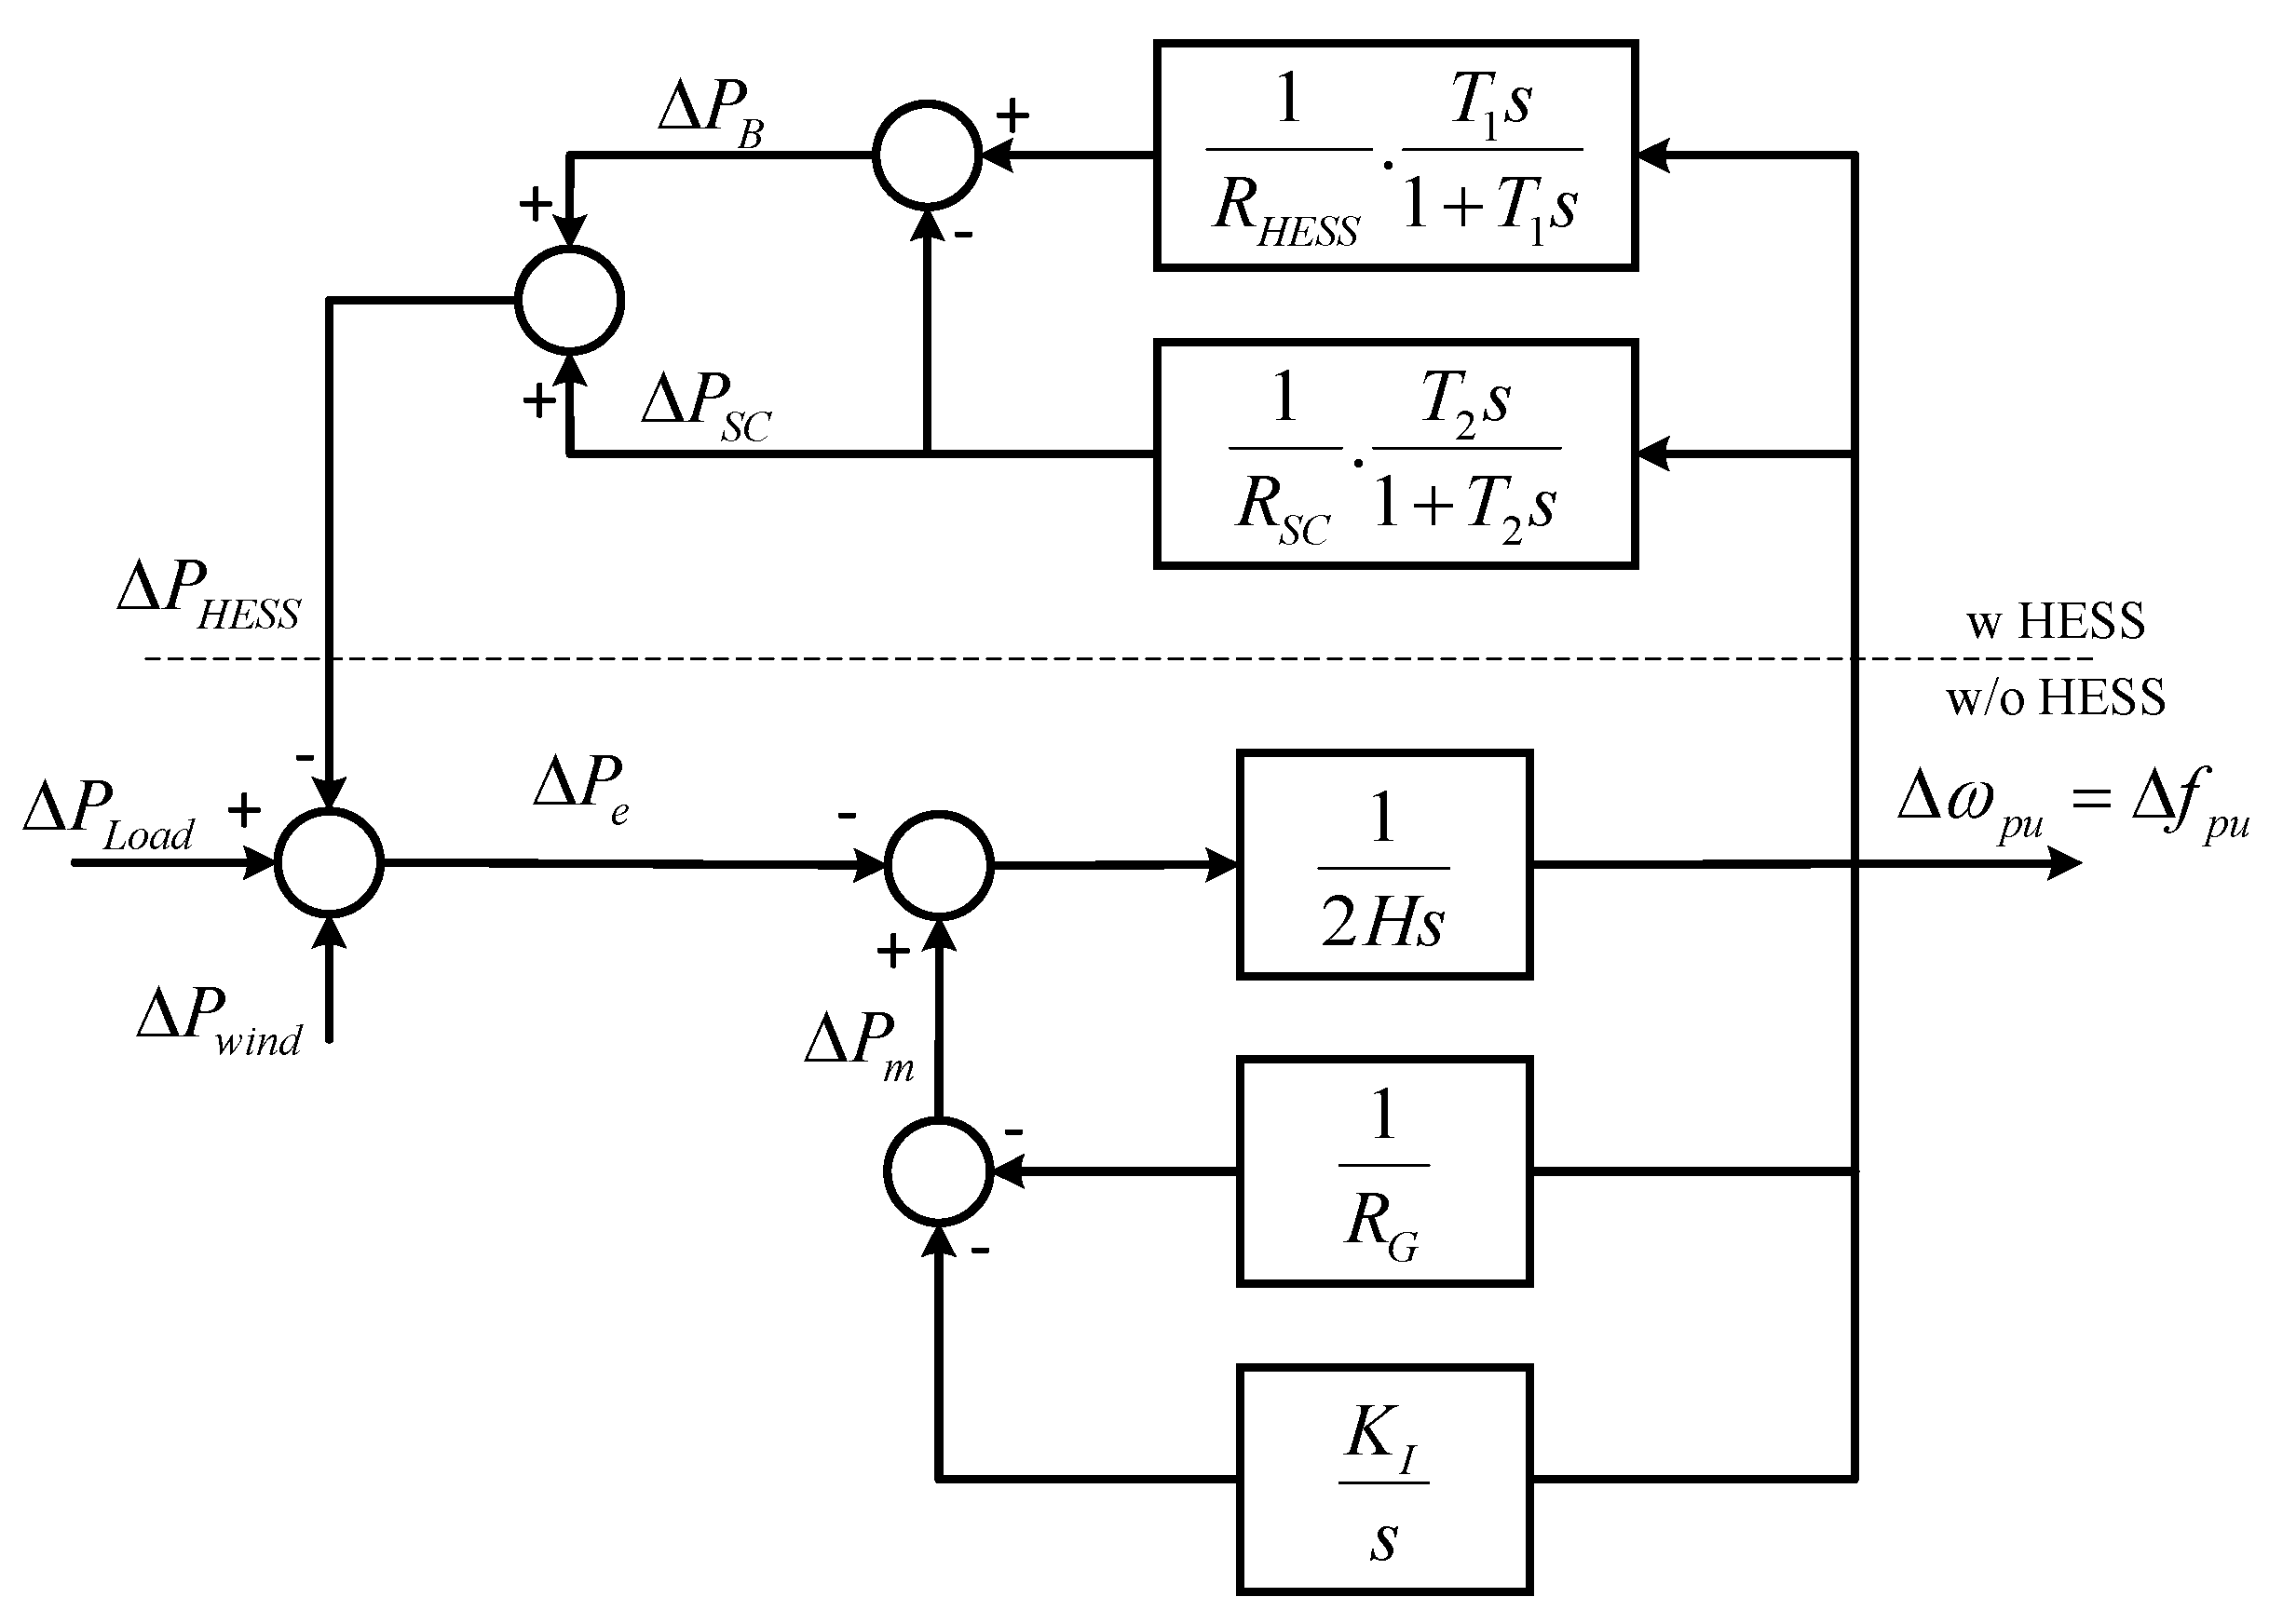
In this research, the power allocation of the battery ( Δ P B ) can be calculated by subtracting the HESS power ( Δ P HESS ) from the SC power ( Δ P SC ) as in (23) and Figure 3, implying that the smoothing time constant of the HESS ( T 1 ) is always larger than the smoothing time constant of the SC ( T 2 ) ( T 1 > T 2 ). In this research, the HESS power is considered as a conceptual value to calculate the power of the battery, which is not applied directly to the system. The transfer function of the battery power in response to a grid frequency deviation is derived from (13), (21), and (23). As in (23), the power of the battery is not directly calculated, and this means the SOC of the battery is not directly used for a feedback loop in our proposed method. Although the SOC of the battery is indirectly manipulated as a feedback signal, the SOC of the battery can be managed as both the HESS and SC are well managed.
Δ P B ( s ) = Δ P HESS ( s ) Δ P SC ( s )
G B ( s ) = Δ P B ( s ) Δ f ( s ) = 1 R B · ( T 1 s 1 + T 1 s T 2 s 1 + T 2 s ) = 1 R B · ( T 1 T 2 ) s T 1 T 2 s 2 + ( T 1 + T 2 ) s + 1
where Δ P B ( s ) , Δ P HESS ( s ) , and Δ P SC ( s ) are the battery power, the HESS power, and the SC power, respectively.
Similar to the previous power equations of the HESS and SC, the battery power can be determined along with the droop characteristics R B in response to a frequency deviation Δ f ( t ) as in (25) with the assumption that the droop rates of the HESS, the SC, and the battery are all equal ( R B = R HESS = R SC ). The transfer function of the f ofs , B to the battery power Δ P B is derived from (24) and (25).
The transfer function of feedback in Figure 2 can be expressed as (26). The conversion factor of the battery ( K f , B ) can be calculated in (27).
Δ P B ( t ) = 1 R B Δ f ( t ) f ofs , B ( t )
G ofs , B ( s ) = f ofs , B ( s ) Δ P B ( s ) = 1 K E , B s · K f , B
K f , B = R B · K E , B · T 1 T 2 s 2 + ( T 1 + T 2 ) s + 1 T 1 T 2
where f ofs , B is the feedback frequency signal of the battery response to grid frequency deviation, K f , B is the conversion factor to connect the SOC and frequency of the battery, K E = E B · h is the energy of the battery (MJ), and E B is the size of the battery in MWh.
The conversion factor of the battery is characterized as the second-order function shown in (27). Damping ratio ζ and natural frequency ω n can be defined with the smoothing time constant specified in (29) based on the characteristic equation in (28).
s 2 + T 1 + T 2 T 1 T 2 · s + 1 T 1 T 2 = 0
ω n = 1 T 1 T 2 , ζ = T 1 + T 2 2 T 1 T 2
As T 1 + T 2 2 T 1 T 2 is always guaranteed, the damping ratio ζ is always greater than one, implying that the battery power against the grid frequency change is stably operable.

2.3. Sizing of the Battery and Supercapacitor

Based on our proposed method, the size of the storages (SC and battery) can be determined based on the relation among the size of the storage ( E ), the smoothing time constant ( T ), the droop rate ( R ), and the conversion factor ( K f ) as in (30) and (31), respectively. In this calculation, the most important factor can be the smoothing time constant as we should determine how much power would be provided for the frequency compensation. As explained in (14) and (22), the smoothing time constant of the HESS and SC ( T 1 and T 2 ) can be calculated as the relationship between the conversion factor and the size of the HESS and SC ( E HESS and E SC ). The size of the battery can be obtained from the HESS size and the SC size as shown in (32).
E SC = T 2 · K f , SC R SC · h , f SC = 1 2 π T 2
E HESS = T 1 · K f R HESS · h , f HESS = 1 2 π T 1
E B = T 1 · K f R HESS · h T 2 · K f , SC R SC · h

2.4. Frequency- and Time-Domain Analysis

As our method can be expressed with transfer functions as in (13), (21), and (24), the analysis in frequency-domain can be carried out through the Bode plot.
As in Figure 4a, the input of the transfer function is grid frequency deviation ( Δ f ), and the output is the power of each storage. Thus, it indicates the frequency coverage of each ESS (HESS, SC, and battery) in frequency domain using Bode plots.
In Figure 4a, the frequency band of the HESS can be the combination of the frequency band of the battery and SC, which has the cut-off frequency of the HESS ( f HESS in (31)) and the cut-off frequency of the SC ( f SC in (30)). The battery has cut-off frequencies on both sides ( f HESS and f SC ). Figure 4a implies that the SC responds to the short-term power fluctuation while the battery responds to long-term power fluctuation, and those roles can be distinguished by the cut-off frequency of the SC ( f SC ) in the frequency domain. In Figure 4b, the compensation power of the HESS, battery, and SC are indicated in the time domain in response to a step input (0.01 pu). As shown in the figure, the SC responds to the short-term power fluctuation as the red line corresponding to the high frequency band while the battery responds to the long-term power fluctuation as the blue line corresponding to the low frequency band.
Figure 4 clarifies and proves that the proposed method divides the role between the battery and SC in response to frequency deviation in the frequency domain and also indicates the clear role allocation between the battery and SC in the time domain.

3. Integration of the HESS in a Power Grid

3.1. Test System Configuration

In this section, the effectiveness of the proposed method is assessed by frequency- and time-domain simulation with case studies. As shown in Table 1, the case studies are developed by changing the size of the battery and SC to assess the impact of the ESS sizing for frequency regulation. In Case 1, the SC and battery sizes are selected as 0.2 kWh and 0.5 MWh, respectively. Case 2 and Case 3 have the same size of battery as Case 1 while the size of the SC is determined as 2 kWh and 20 kWh, respectively. In Case 4, we increase the size of the SC and battery to 20 kWh and 5 MWh. The obtained cut-off frequencies of the SC and HESS ( f S C and f H E S S ) based on the case studies in Table 1 are shown in Table 2. In this study, the rating of the power system is determined as 500 MVA with a 2MWs/MVA inertia constant, connected to 100 MW of wind power. We determine K f as 0.1/100 (Hz/%), the droop rate R S C as 5%, and K E ,SC as the SC capacity in Table 1 based on K E , S C = 3600 · E S C . The conceptual configuration for the integration of the HESS and WT based on the proposed method is illustrated in Figure 5. The block diagram of the WT and HESS integration in the power system based on the proposed method is shown in Figure 6, and we can observe the frequency change in response to the power change such as the load change or RES power with/without the HESS.

3.2. Influence of the Capacity of the SC and Battery

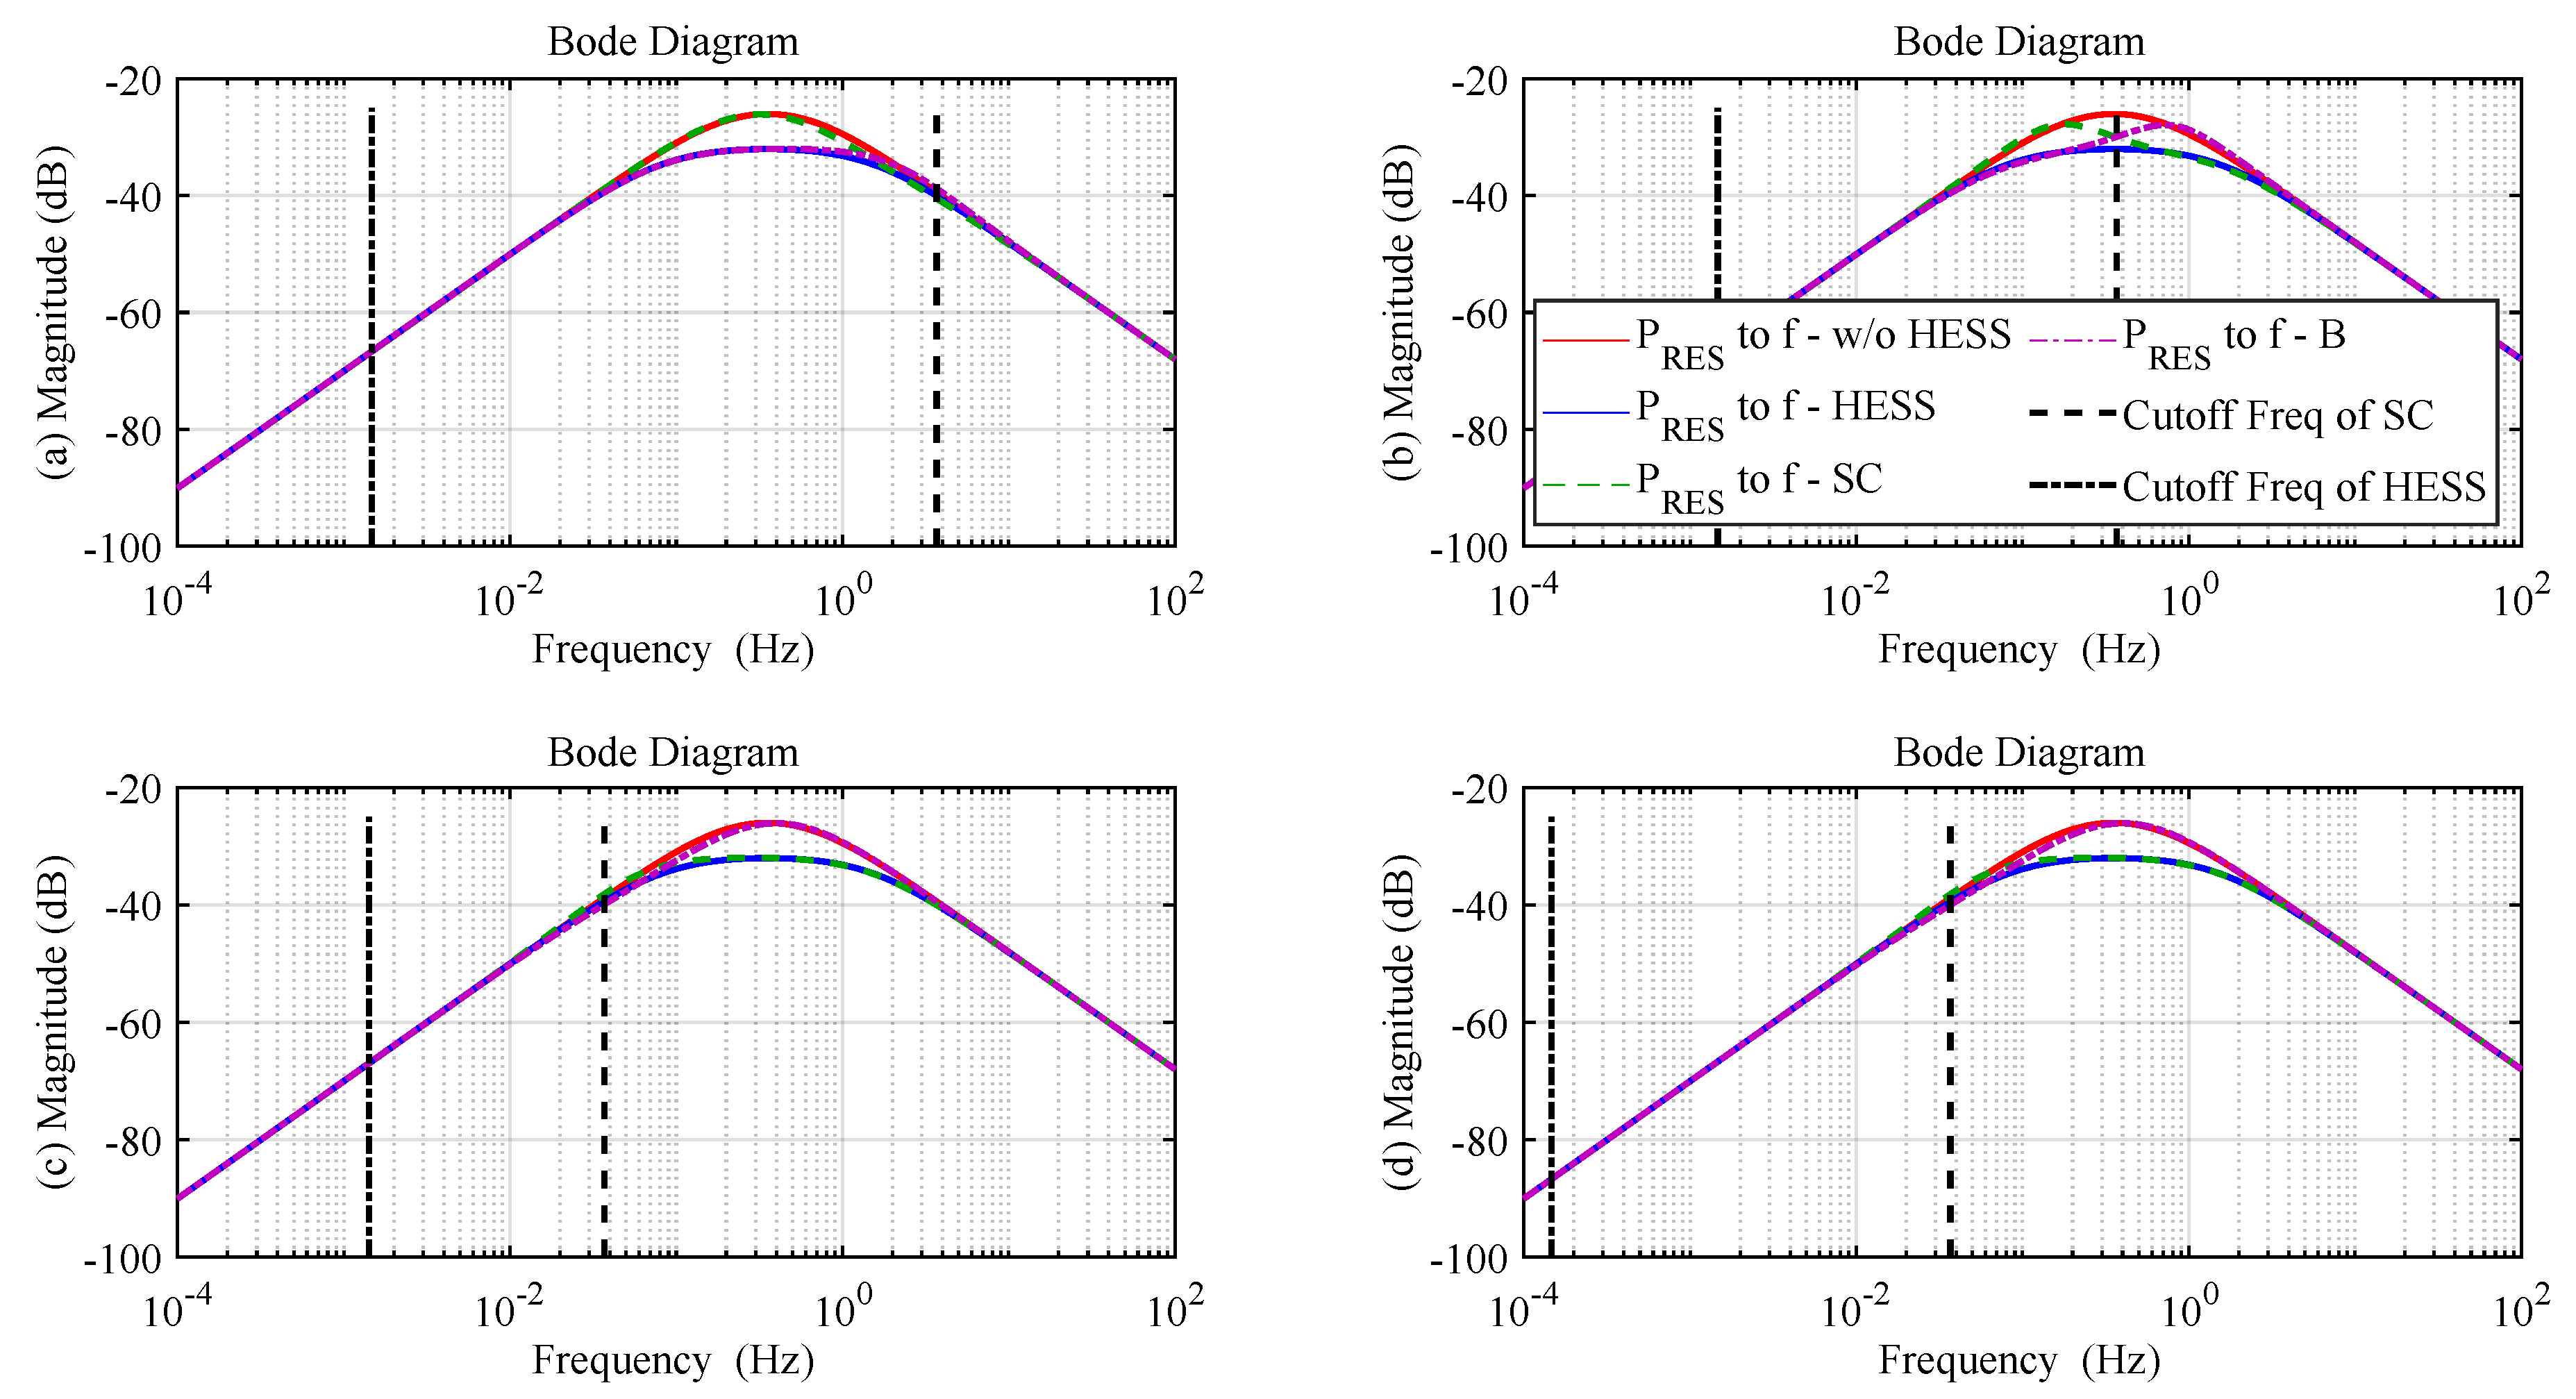
As an equivalent generator and the HESS can be expressed with transfer functions, the Bode plot analysis can be conducted in the frequency domain, based on (13), (21), and (24), along with the case studies. The test cases are organized based on the sizes of the battery and the SC to observe the relation between the compensation capacities of the ESS size in Table 1. The Bode plots in Figure 7 are displayed based on the block diagram in Figure 6, which indicates the HESS integration in the power system.
As this Bode plot indicates the relation between renewable input and grid frequency output, the effectiveness of the HESS, SC, and battery in the power system can be observed. For instance, the red and blue line sin Figure 7 indicate the frequency response of the generator without and with HESS compensation, respectively. We also observe the cases with a single ESS as green and purple lines indicating the frequency response of the generator with single storage such as the battery and SC, respectively.
The higher magnitude in Figure 7 indicates when renewable energy changes become frequency fluctuation in the corresponding frequency. Similarly, a lower magnitude shows when the fluctuation of renewable energy is reflected in the frequency fluctuation at a specific frequency. In this regard, all of the HESS application cases in Figure 7 reduce the renewable impact on the grid frequency, and also, we may know which storage between the battery and SC would take a larger portion, as Figure 7 shows the frequency compensation range of the battery and SC in the system.
In Figure 7a, the cut-off frequency of the SC (3.7 Hz as a black dashed line) is relatively high, and the cut-off frequency of the HESS is relatively low (1.473 mHz); this indicates that the frequency band of the SC is narrow and the frequency band of the battery is wide, resulting in the low coverage of the SC in the frequency band. In this case, the smoothing time constant of the SC becomes relatively small, which results in the small size of the SC (0.2 kWh) based on the ESS sizing calculation in (22) and (30). In Case 2, the sizes of the SC and battery are determined as 2 kWh and 0.5 MWh, respectively. This determination leads to the decrease of the cut-off frequency of the SC as in Figure 7b, implying that the SC is in charge of a larger amount of wind power and the battery takes charge of a lesser amount of the wind power compared to Case 1. In Case 3, we increase the SC size to 20 kWh, and the battery size is selected as 0.5 MWh, leading to the decrease of the cut-off frequency of the SC as in Figure 7c. This shows that the frequency coverage of the SC in the high-frequency band increases significantly when the SC size is increased and the frequency coverage of the battery is narrower, compared to Cases 1 and 2. In Case 4, the SC size is selected as 20 kWh, identical to Case 3, and the battery size is increased to 5 MWh. As a result of this size determination, the battery takes the responsibility of the wider frequency range, compared to the other cases, as in Figure 7d.
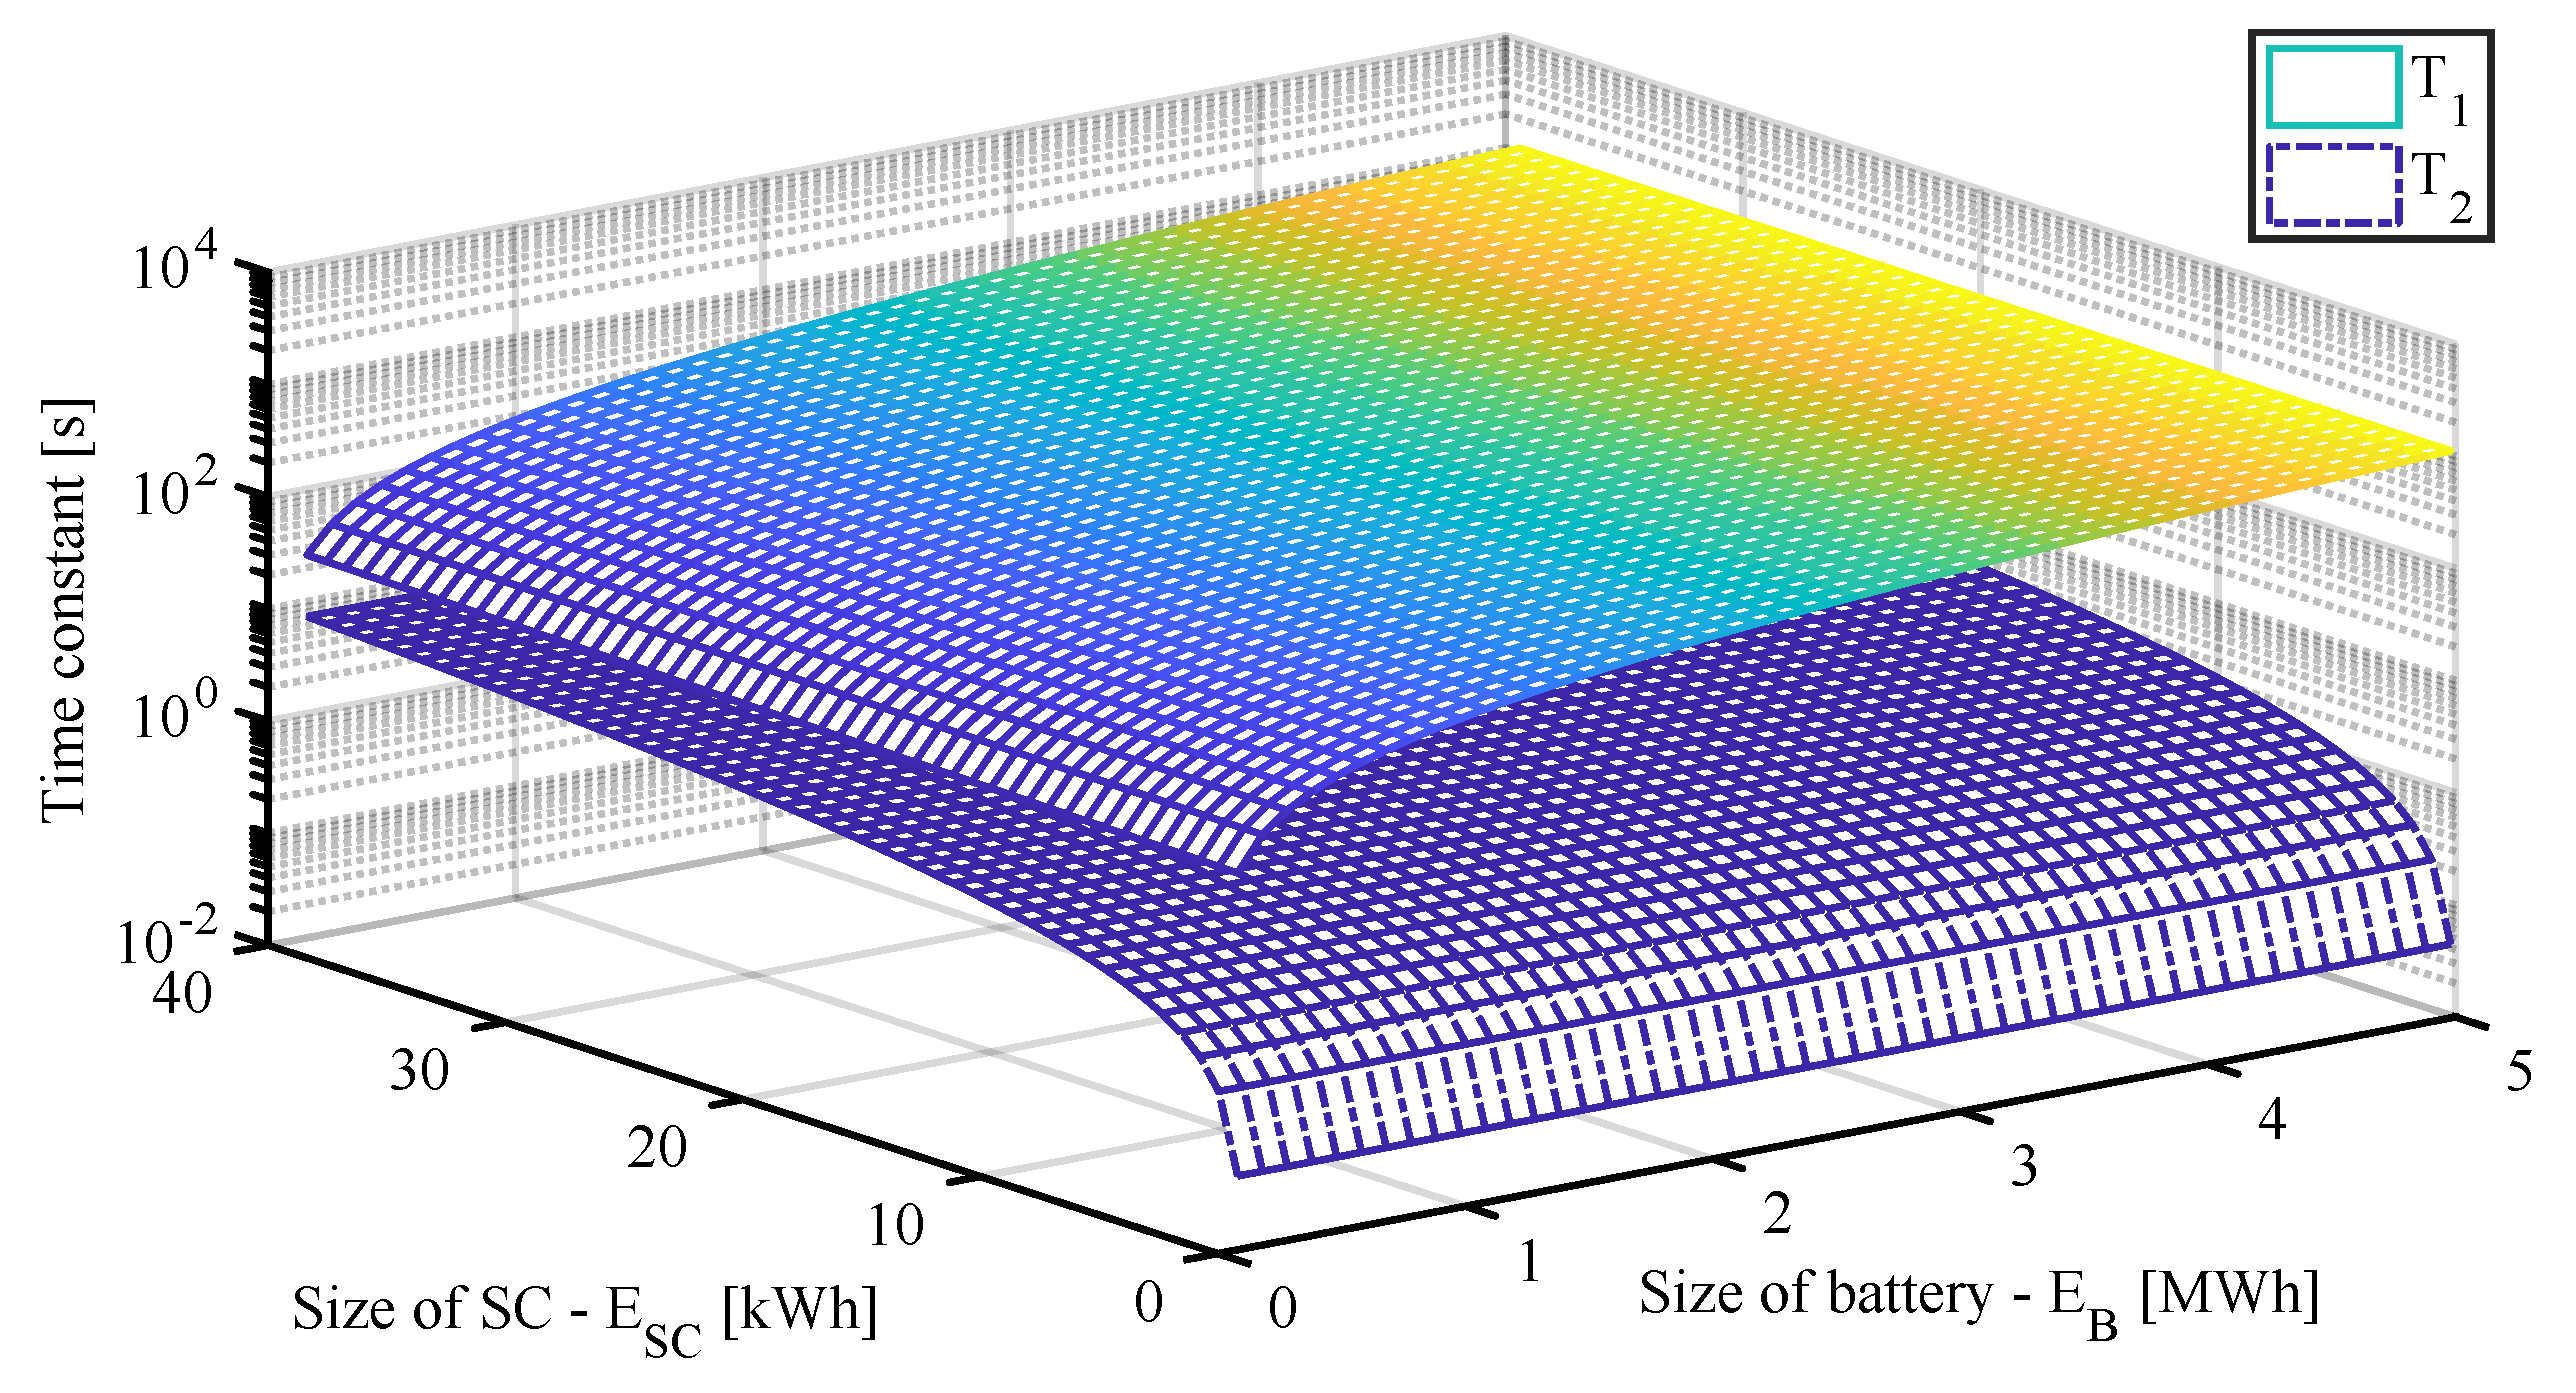
The size of the battery and SC are highly related to the cut-off frequency, so the size of the storages can be calculated based on the smoothing time constant ( T 1 and T 2 ) as in Figure 8, which indicates the relationship between the storage size and time constant. In Figure 8, the size of the battery is highly related to T 1 , while the SC size has a high relation to T 2 . In case the SC size increases, the smoothing time constant T 2 increases according to (30), and in case size of the battery becomes higher, the smoothing time constant T 1 increases as well in (32).

3.3. Time-Domain Analysis for the Frequency Regulation and SOC Management

To prove the effectiveness of the HESS, the time0domain simulation is carried out to show the advantage of the proposed method for frequency regulation and SOC management in accordance with the case study.
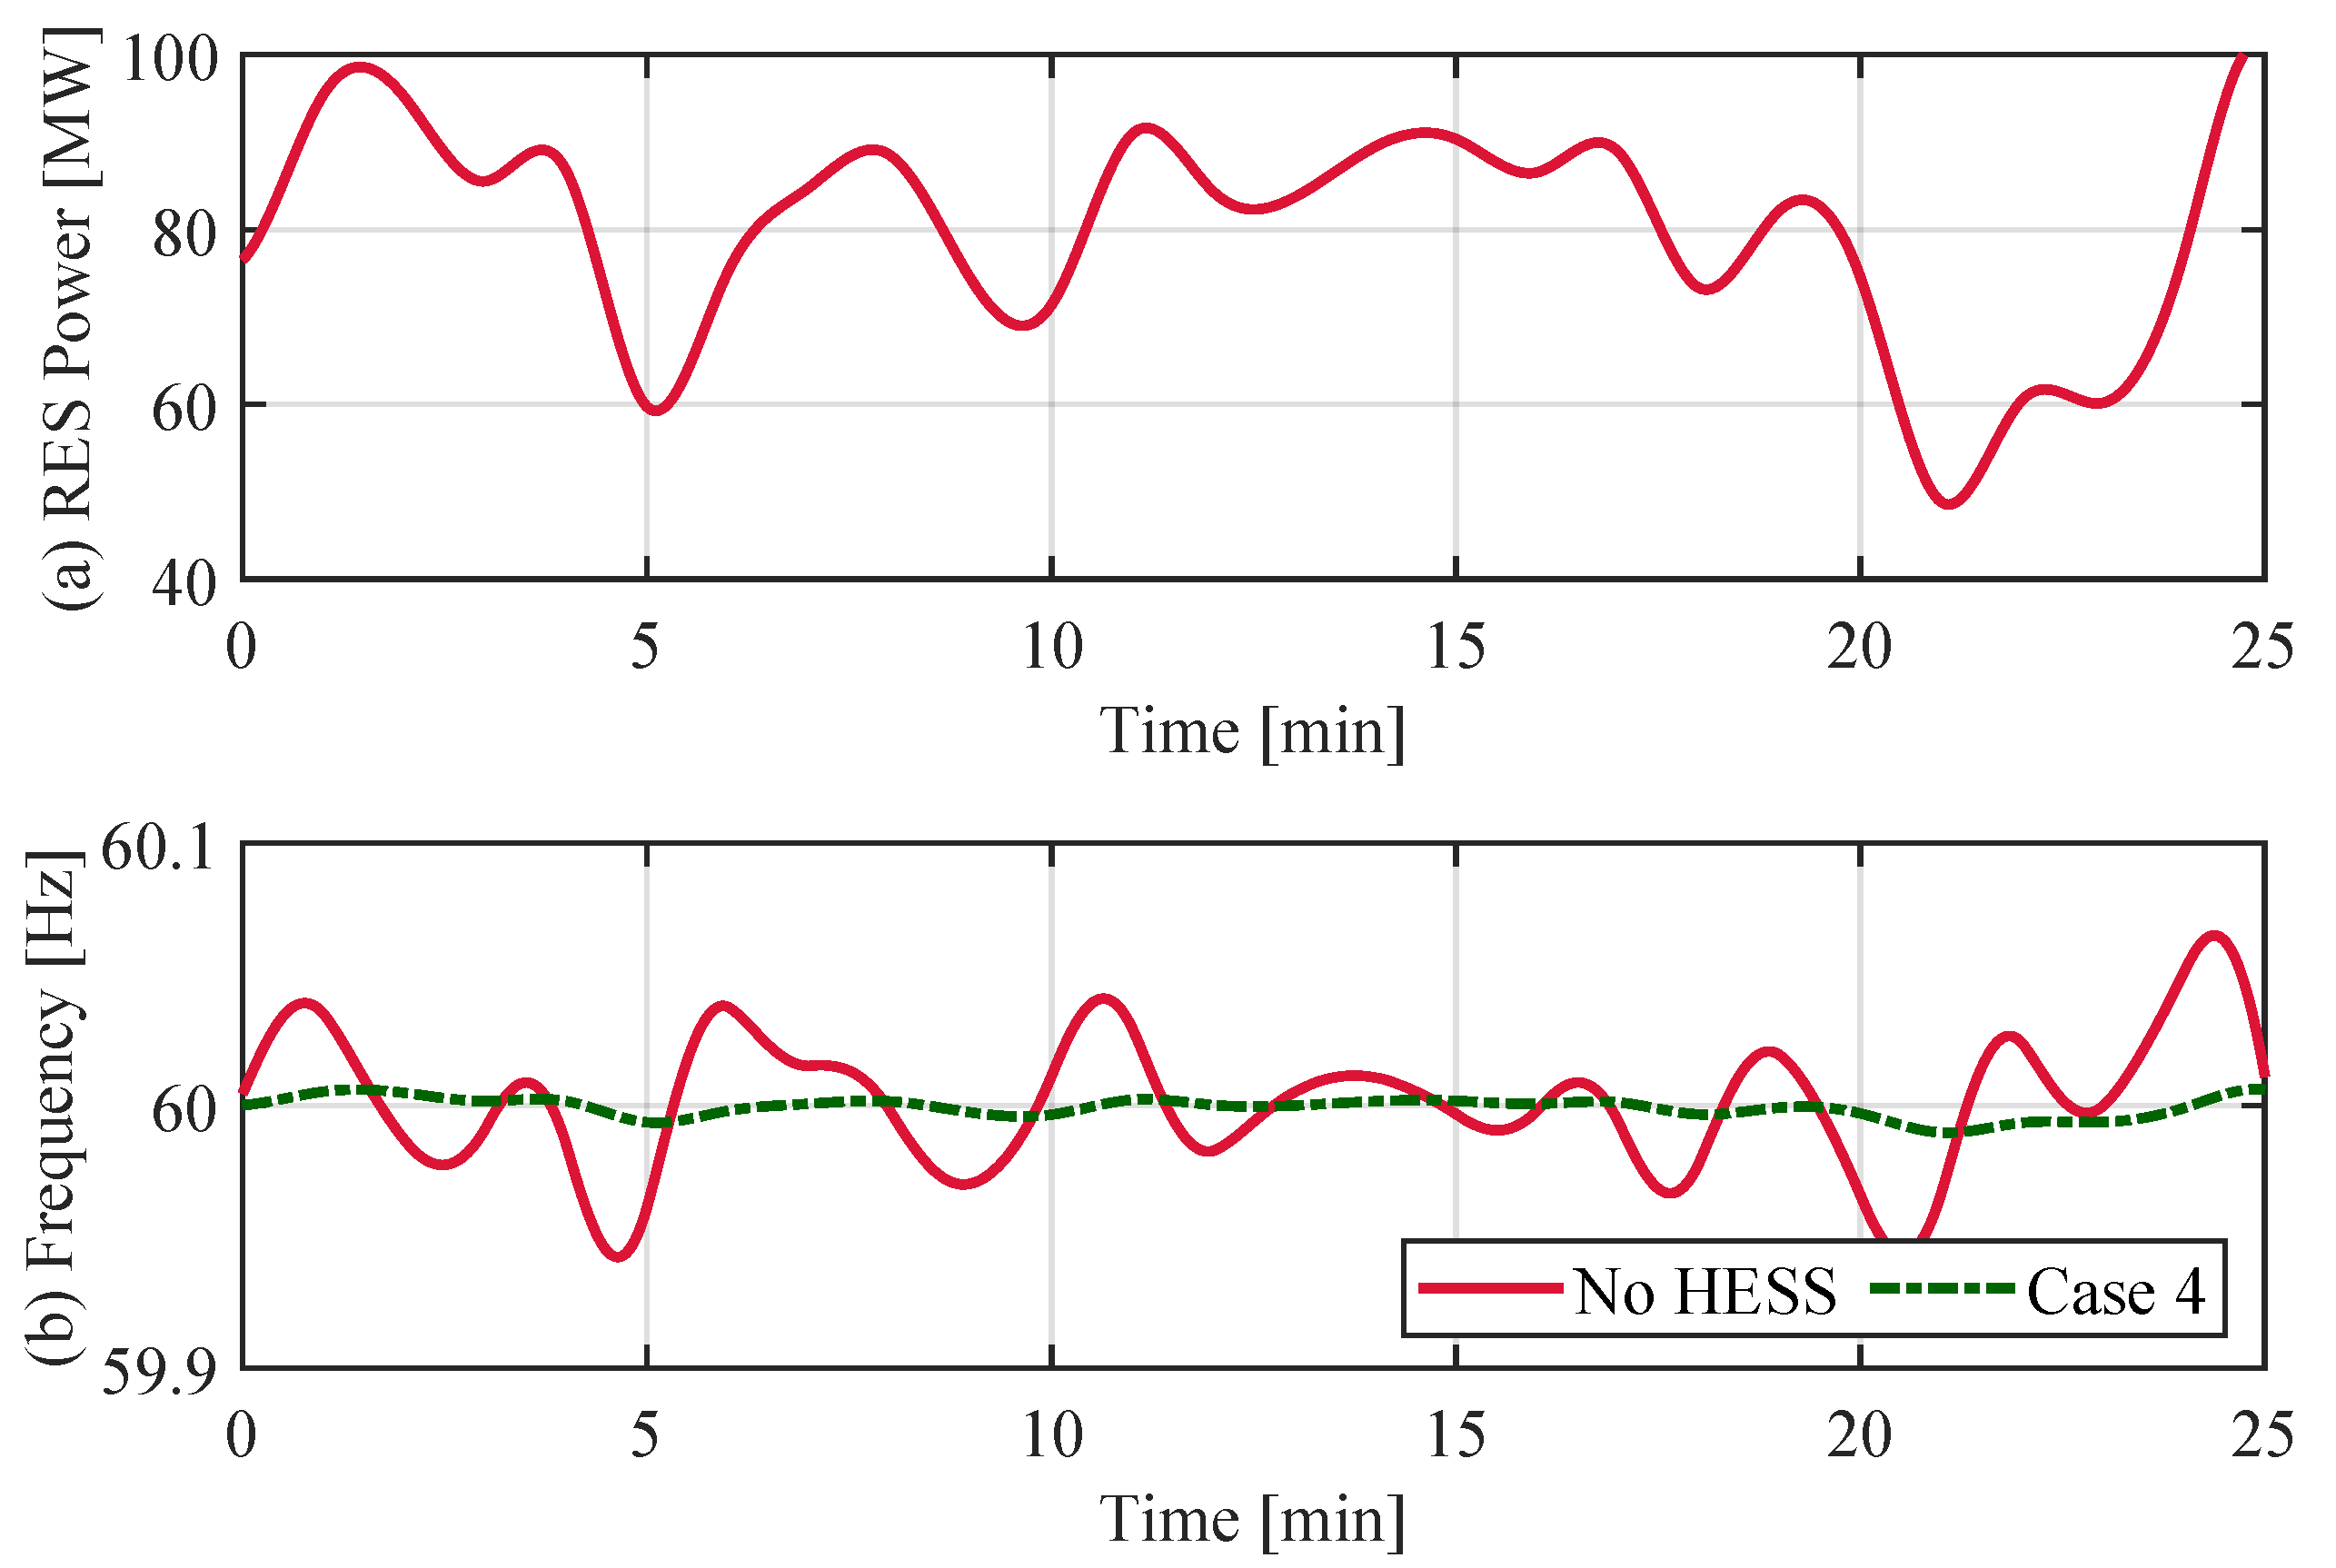
In Figure 9, the grid frequency change in response to the RES power is illustrated, which also shows the results between the grid frequency with/without the HESS in Figure 9b. This graph indicates that the application of the HESS reduces the fluctuation by providing the FR service.
Figure 10 presents the response of the battery and SC in Figure 10a,b in response to the frequency change. In Figure 10a, the size of the battery in Case 1 is the smallest, and Case 4 is the largest according to Table 1. The small size battery has low capacity to provide power, while the larger size of the battery provides higher active power.
However, in the case of SC, the compensation power shows clear differences depending on the size of the SC, implying that a larger SC compensates higher power, while a lower SC provides lower power.
Especially in Case 4, the battery and SC sizes are selected as the largest capacity (5 MWh and 20 kWh) compared to the other cases, which results in the highest compensation from the battery and SC against renewable fluctuation, as in Figure 10a,b, respectively.
Figure 11 indicates the SOC of each battery, which changes depending on the battery charging and discharging power. As the power of the battery charges and discharges in response to the fluctuating frequency, the SOC stays and manages around 50 % of the SOC. In this graph, Case 1 has higher fluctuation, as it has smaller capacity, and the SOC of the HESS in Case 4 is well maintained around 50% due to the larger battery capacity, as in Figure 11. Consequently, a larger HESS has a better performance of the frequency and SOC management, as shown in Case 4.

4. The Battery SOH Extension in a Hybrid Energy Storage System

The proposed method also has the advantage of battery lifetime extension; thus, this advantage is verified by the state-of-health (SOH) calculation in the time domain.

4.1. Definition of the SOH

The SOH is considered as an important factor in the storage operation, which represents the lifetime of the battery. Typically, the SOH is literally defined as the percentage of the maximal releasable capacity to the rated capacity of the battery as in (33) [27]. In this equation, Q rated stands for the capacity of the battery, which is the initial capacity, and Q max indicates the currently usable capacity, implying the degraded and reduced capacity after using the battery. For instance, when the battery is charged to 100%, the amount of initial charged capacity would be Q rated , but the amount of degraded capacity would be Q max , which is lower than the initial capacity of Q rated .
S O H = Q max Q rated · 100 %
where Q max is the maximal releasable capacity and Q rated is the battery’s rated capacity.
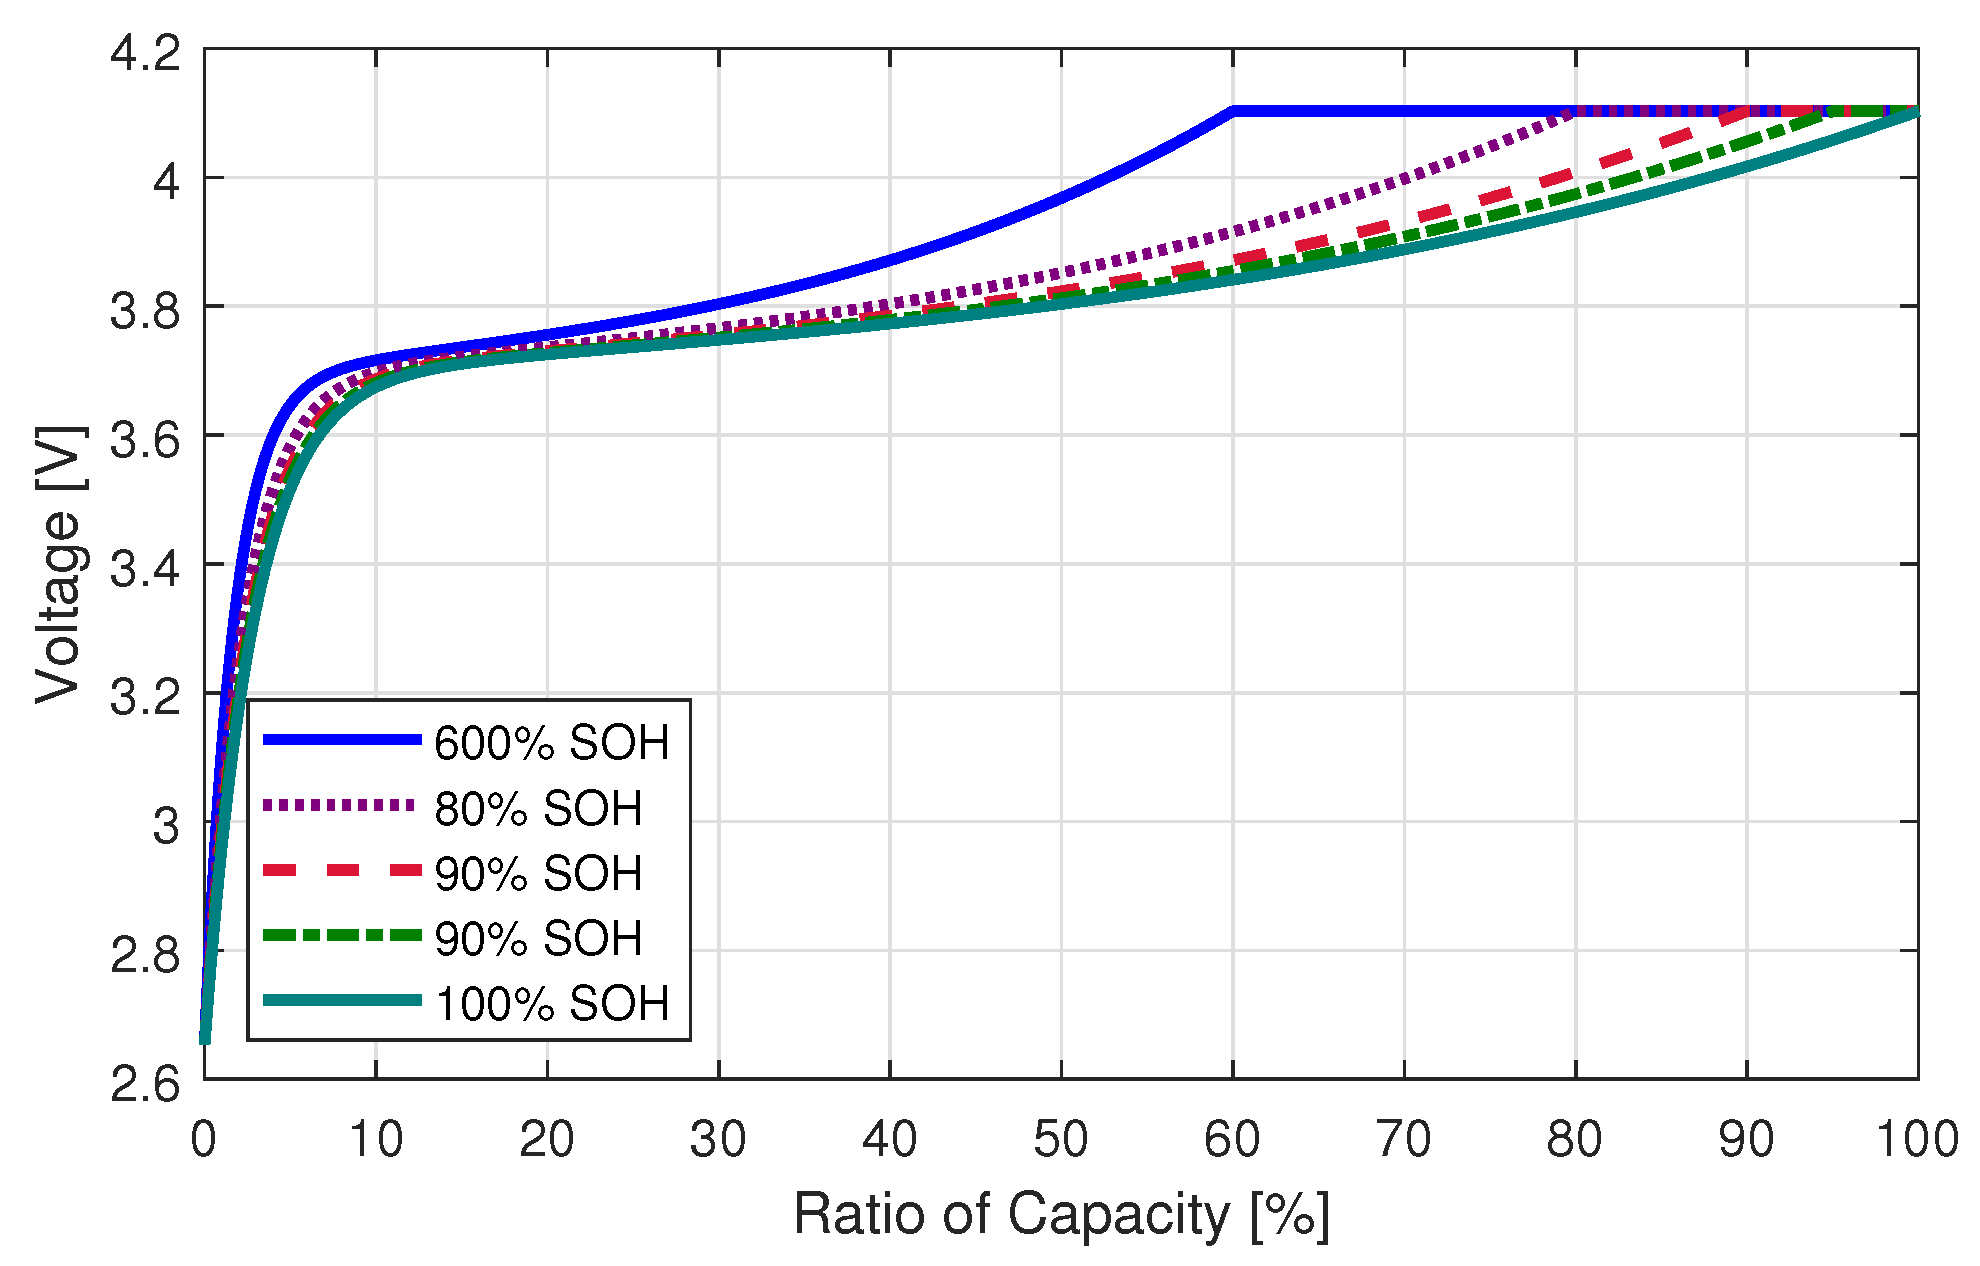
As the battery SOC can be calculated based on the SOH, the nonlinear relationship between the open-circuit voltage V OC and the SOC of battery can be presented as in Figure 12. In this figure, the decrease of the degraded capacity (%) (SOH) from 100% to 60% results from higher cycles, which is compared with fixed Q max and SOC levels [28].

4.2. Degradation Factors for SOH Assessment

The SOH of the battery is affected by the accumulated discharge value, current rate, depth of discharge (DOD), state-of-charge (SOC), ampere-hour (Ah) throughput, temperature, etc. [29]. These parameters are mutually interconnected with a complex relationship, which requires multifaceted modeling to describe the SOH behaviors accurately [27]. The parameters including the throughput, temperature, SOC, and operating time distribution affect the SOH degradation in (34), as Figure 13 shows [30].
S O H Batt = DEG TH · S O H initial 0 t Δ ( D E G SOC · DEG T ) d t
where SOH now is the estimated SOH after degrading, DEG TH (kAh) is the degradation ratio due to throughput, which comes from (35), and SOH initial means an initial value of the SOH, which is generally 1 or 100%. DEG SOC is the SOH degradation related to the SOC distribution, which comes from (37), and DEG T is the SOH degradation ratio associated with the temperature, as mentioned in Table 3. Moreover, Δ ( DEG SOC · DEG T ) is the SOH degradation caused by the SOC and temperature during the dt sampling time considered in the operating period t .
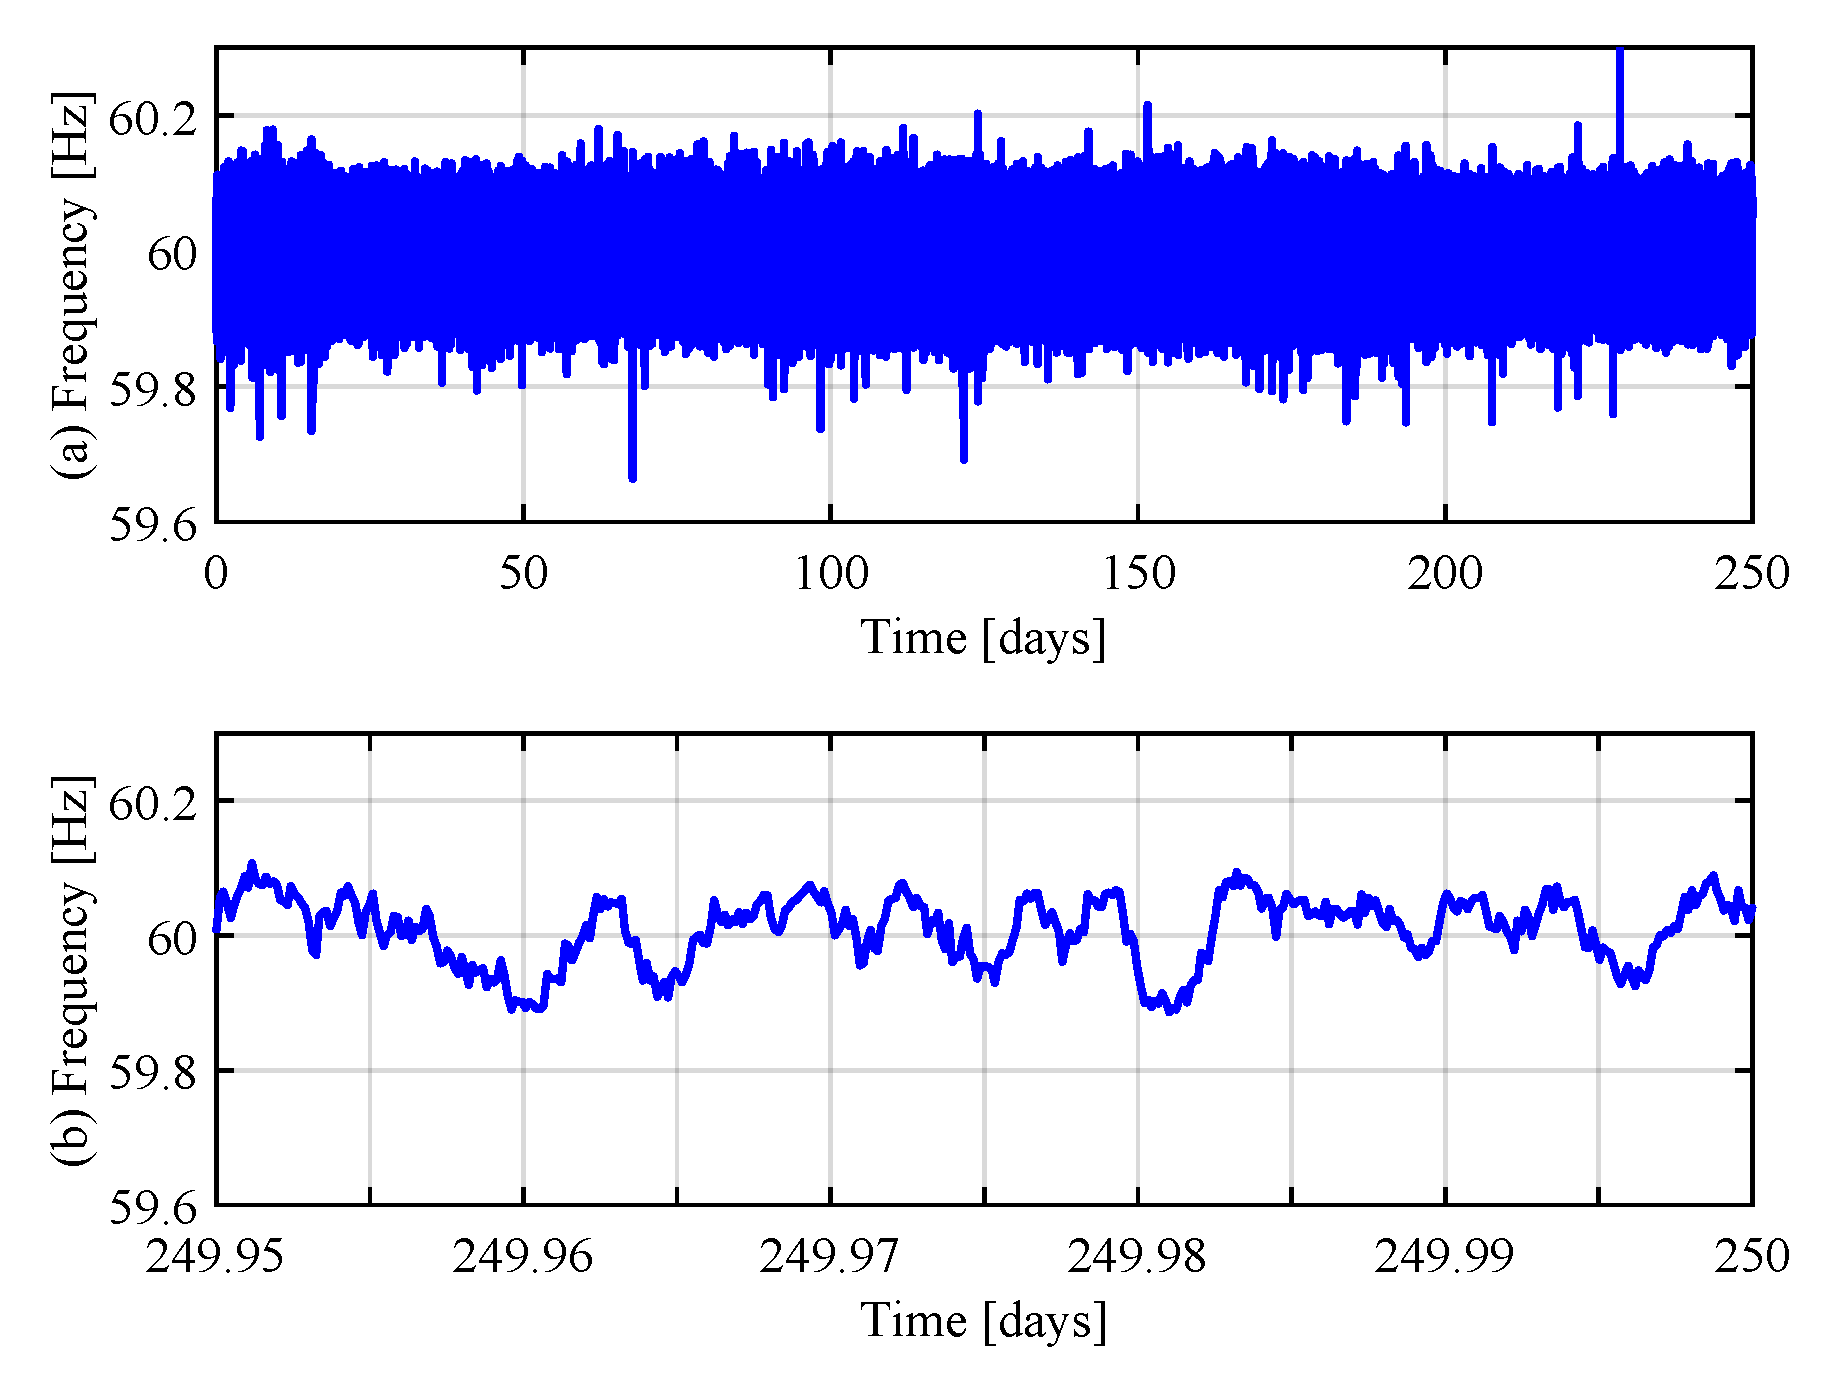
In this section, the effectiveness of incorporating the SC with the battery into the HESS to extend the battery lifetime for FR is analyzed using a time-domain simulation. The comparison of the SOH degradation is conducted in the case of a single battery and the battery in the HESS with the corresponding capacities according Table 3. The grid frequency data used in the simulation are illustrated in Figure 14.

4.2.1. Throughput Factor of Degradation

The throughput degradation of the SOH can be calculated based on the throughput of the battery using the regression method [30] as shown in (35). The battery throughput represents the amount of discharge power delivered by the battery during the iterative cycle [31], which can be calculated by the integration of the discharge current I discharge as shown in (36).
DEG TH = e 8 E 4 · T p Ah , ( T p Ah 50 k A h ) DEG TH = 0.9832 e 5 E 4 · T p Ah , ( T p Ah > 50 k A h )
T p Ah = 1 1000 · 0 t I discharge d t 3600 [ k A h ]
where I discharge is the discharge current of the battery (A), t is the operating time in s, DEG TH is the SOH degradation related to the throughput of the battery, and Tp Ah is the throughput of the battery (kAh).

4.2.2. Degradation Factor from the SOC Change

The usage of the battery can result in the degradation of battery usage due to complex chemical factors. Since the SOC naturally changes during the battery’ operation, the degradation from battery usage can be expressed by the relationship between battery usage and the SOC change. This means that the degradation of the battery occurs due to the SOC change. In previous research, the degradation factor due to the SOC change was mathematically expressed by an exponential function based on the regression method from the estimated SOH as in (37) [30]. Thus, we employ this equation to assess the degradation of the battery due to the SOC change.
DEG SOC = e ( 0.0043 S O C 3 0.0061 S O C 2 + 0.0017 S O C 0.002 ) t
where DEG SOC is the SOH degradation related to the SOC of the battery and t is the operating time in s.

4.2.3. Degradation Factor from the Temperature

The heating of the battery also leads to the degradation of the battery SOH according to previous research [30], and this self-heating of the battery results from Joule’s law of heating by current flow. Regarding this, a higher temperature of the ESS results in a quickly decreasing SOH, and the impact of the temperature on the degradation factor is mathematically formulated based on the experimental results [30]. For the calculation of the heating impact, the power of the battery is necessary, which can be calculated using Joule’s law in (38) based on the DC current value of the battery. As a result, the temperature of the battery can be obtained for the degradation assessment as (39) from the battery power.
P = I 2 · R · t · 845 [ k c a l ]
T inc = K effi · P K heat . K mass
where I is the current of the battery in RMS (A), R is the resistance of the battery ( Ω ), t is the operating time in s, P is the battery power given by (38), K heat is the specific heat of air as 0.24 (kcal/kg C), K mass is the mass of air depending on the volume of the battery systems and defined as 1.1048 per cell (liter gram) following the structure of the battery system, K effi is the heating efficiency of the battery system and is adjusted to 35% to trace the best fit with the actual test, and T inc is the amount of increased temperature per second.
Realistically, a cooling system is necessary to increase the lifetime of the battery, which can be achieved by a natural cooling or air circulation system. The amount of decreased temperature ( T dec ) from the cooling system is also considered in (40). In order to derive an equation of decreased temperature, the regression method based on the actual experiments is applied, and the mathematical approximation is derived as in (40) [30].
T dec = ( 0.4075 Δ T 0.0009 ) · e 4.0 4 · t
where T dec is the amount of decreased temperature per second and Δ T is the difference of the cell temperature and the ambient temperature.
The time t is increased when the conditions of Δ T are higher than 0.5 C. Otherwise, the time t will be reset to zero. In the modeling, the amount of temperature change is calculated in real time as in (41).
T cell = T ambient + 0 t ( T inc T dec )
where T cell is a function of the cell temperature and T ambient is the ambient temperature of the cell ( C).
The disgration rate at 60 C is the fastest among the test results [30]; thus, these degraded ratios DEG T can be expressed by polynomial forms, which is shown in Table 4, and Δ T 1 is represented by the difference between the temperature of the cell T cell and 60 C.

4.3. The Battery Lifetime Expansion in the Hybrid ESS Structure

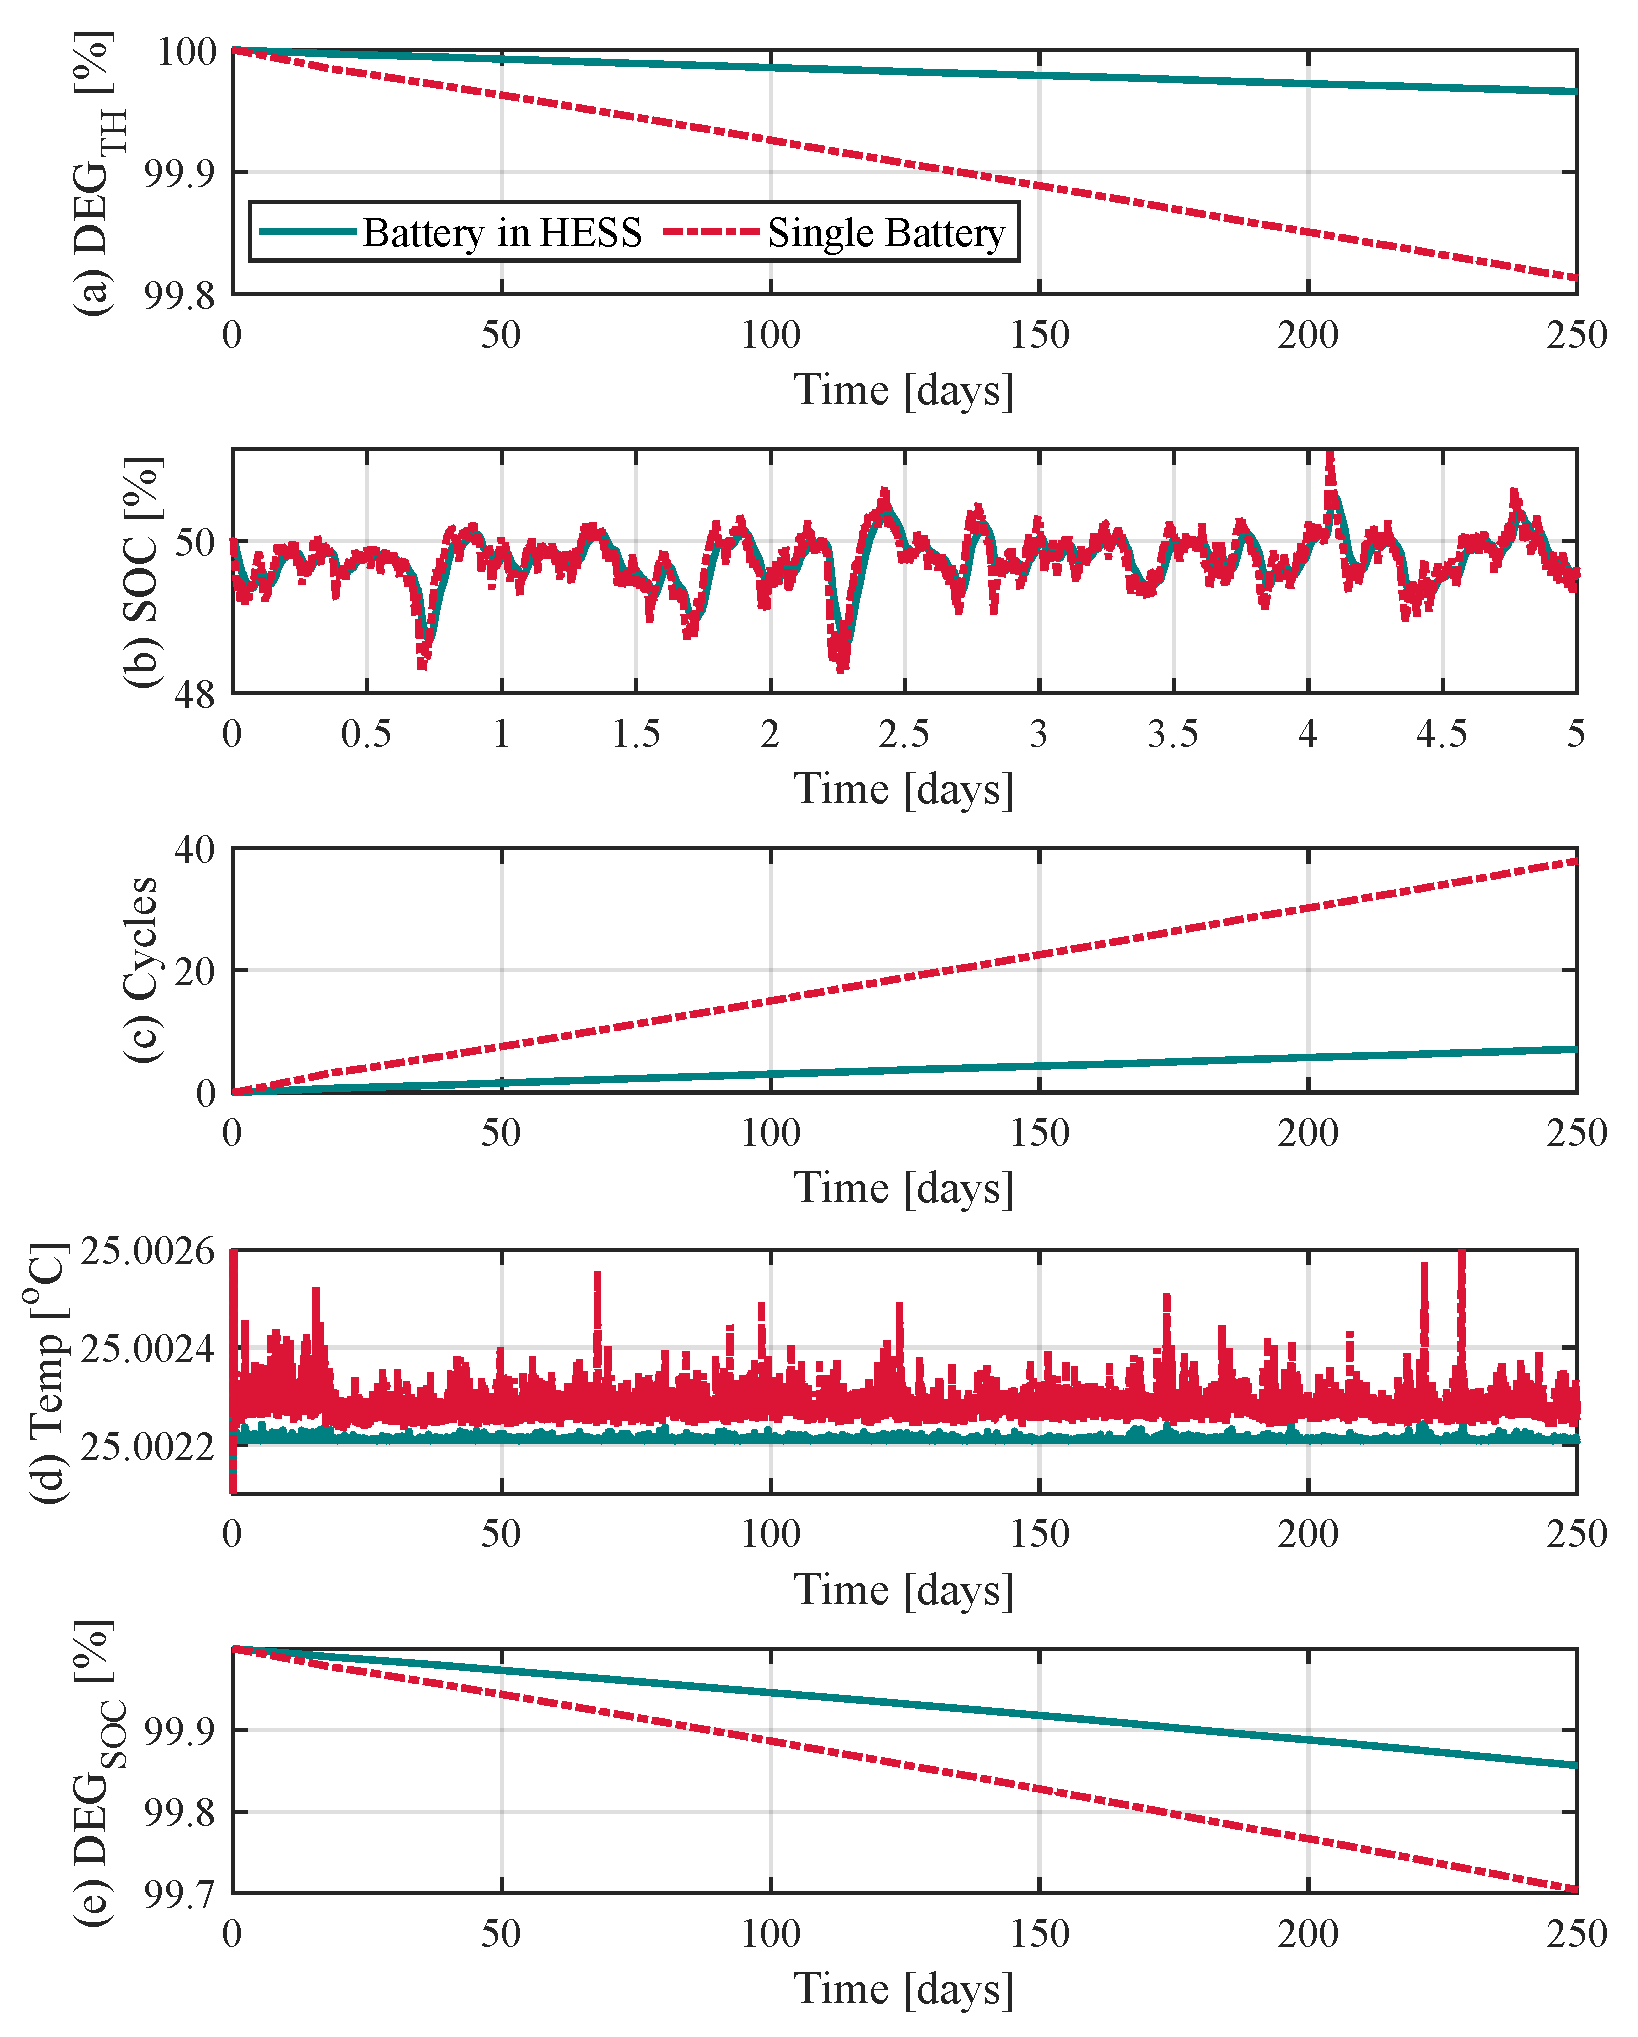
In the previous section, we investigated the degradation factors for the calculation of the SOH degradation such as the throughput degradation, the SOC change, and the temperature of the battery. Thus, based on those degradation factors, the comparison of the SOH degradation between a single battery and the battery in the HESS can be carried out as in Figure 15.
Figure 15a indicates the degradation from the throughput of the battery, and here, the throughput of the single battery significantly decreases rather than the battery in the HESS, which results from the less charging/discharging power of the battery in the HESS. As a result, the lesser power change of the battery in the HESS affects the SOC response as well; thus, the SOC of a single battery is not comparatively changed, rather the SOC of the battery in the HESS, as in Figure 15b. In the HESS, the SC is in charge of the high frequency band, while the battery takes responsibility for the low frequency band of the fluctuation. Thus, the change of the battery SOC in the HESS is slower than the change of the single battery SOC, which operates with a higher charge/discharge rate. This implies that the charge/discharge cycles of the battery in the HESS are lower than those of the single battery along time, as in Figure 15c. Moreover, as the temperature is highly related to the output power, the temperature of a single battery is higher than the temperature of the battery in the HESS in Figure 15d.
Consequently, the degradation of the SOH in the single battery is higher than the SOH of the battery in the HESS, in Figure 15e, according to the calculation in (34). This implies that the proposed method provides the advantage of extending the lifetime of the battery in the HESS compared with the single battery operation.

4.4. Discussion

The proposed FR method reduces the high frequency band of the grid frequency using the HESS composed of the SC and battery, while managing the SOC based on the energy feedback management method. Additionally, the proposed method also has the ability to manage the power allocation between the two storage systems of the HESS (SC and battery), as well as the SOC management scheme of each storage. The SC and HESS cooperatively take charge of the high frequency band of the grid frequency. The proposed method is designed on the basis of transfer functions as an HPF in (13), (21), and (24) with the input the grid frequency deviation and the output the compensation power of each storage. By adjusting the smoothing time constant of the SC ( T 2 ), we can control the compensation power assigned to the battery and SC in the HESS. The higher smoothing time constant of the SC T 2 results in allocating higher wind power to the battery. On the other hand, the lower smoothing time constant of the SC ( T 2 ) leads to the lower wind power assigned to the SC compared to the battery. The role allocation of the SC and battery in response to the frequency deviation is illustrated in the frequency- and time-domain, as shown in Figure 4. Additionally, we also provide a method for determining the HESS size composed of the SC size and battery size based on the smoothing time constant, droop rate, and operating coefficient.
The advantage of the proposed method in battery lifetime extension is assessed by comparing the SOH degradation in the case of a single battery and a battery in the HESS affected by throughput degradation ( DEG TH ), SOC degradation ( DEG SOC ), temperature degradation, etc. The simulation results demonstrate that the proposed method provides the advantage of extending the lifetime of the battery in the HESS compared with the single battery operation. The proposed method is applicable to hybrid electric vehicles (HEVs), electric vehicles (EVs), and the integration of energy storage in the power system with the high penetration of RES, which requires the long lifetime of the battery. A comparison of the relevant criteria to the SOH calculation between the independent battery and the battery in the HESS is shown in Table 5.
The SOH is monitored to quantify the degradation capacity of the battery in such cases as smartphones, electric vehicles (EVs), etc. However, it is difficult to measure the battery’s actual capacity in practice such as in a large power system application, which requires a full discharge process. Therefore, the introduced method uses the SOH estimation method based on the formula from curve fitting of the test information [30]. In other words, the SOH of the battery is determined based on the SOH estimation method on the basis of the throughput degradation, SOC degradation, and temperature degradation. The mathematical method is used here since the application is for FR, although the method has a relatively lower calculation accuracy of the SOH compared to the measurement-based method.

5. Conclusions

In this paper, we attempt to introduce the droop control with the SOC feedback management (DSOF) method for FR while managing the SOC using the HESS. We mathematically analyze the power allocation of the battery and SC using transfer functions and block diagrams. Additionally, a guideline for the HESS sizing for both the SC and battery is provided based on the smoothing time constant, droop rate, and RES power rating. The effectiveness of the proposed method is demonstrated using frequency-, and time-domain simulation in PSCAD/EMTDC and MATLAB software. The advantage of the proposed method in expanding battery lifetime is verified, based on a real-time SOH calculation method on the basis of the throughput degradation, SOC degradation, and temperature degradation.

Author Contributions

T.-A.N.-H. and V.T.N. contribute equally. T.-A.N.-H. carry out the work for simulation, analysis, original draft writing, and investigation; V.T.N. is responsible for the paper modification and response to the reviewers. K.H. review the paper and provide advice on the improvement of the paper quality. J.W.S. supervised this research including project administration, funding acquisition, and methodology development and conceived the original idea for methodology as well as reviewing and editing. All authors have read and agreed to the published version of the manuscript.

Funding

This work was supported by the 2019 Inje University research grant. (No. 20190181)

Conflicts of Interest

The authors declare no conflict of interest.

Nomenclature

ESSEnergy storage system
HESSHybrid energy storage system
SCSupercapacitor
SMESSuperconducting magnetic energy storages
SOCState-of-charge
SOHState-of-health
FRFrequency regulation
RESRenewable energy resource
AGCAutomatic generation control
DSOFDroop control with SOC feedback
Δ P B , Δ P SC , and  Δ P HESS Compensation power of the battery, SC, and HESS
SOC SC and SOC HESS SOC of the SC and HESS
R B , R SC , and  R HESS Droop rate of the battery, SC, and HESS
f ofs , SC and f ofs , HESS Frequency offset of the HESS and SC
f ofs max Maximum frequency compensation of the ESS
f ofs min Minimum frequency compensation of the ESS
Δ f Frequency deviation from nominal frequency
SOC cen Central value of the SOC
Δ SOC SC and Δ SOC HESS SOC deviation from SOC cen of the SC and HESS
K f , B , K f , SC , and  K f Operating coefficient of the battery, SC, and HESS
K E , B , K E , SC , and  K E Energy of the battery, SC, and HESS
E B , E SC , and  E HESS Capacity of the battery, SC, and HESS
T 2 and T 1 Smoothing time constant of the SC and HESS
f SC and f HESS Cut-off frequency of the SC and HESS
HInertia constant (MWs/MVA)
R G Droop rate of the generator
Q max Maximal releasable capacity of the battery
Q rated Rated capacity of the battery
V OC Open-circuit voltage
D O D Depth of discharge
SOH Batt Estimated SOH after degrading
SOH initial Initial value of the SOH
D E G SOC SOH degradation factor related to the SOC distribution of the battery
DEG T SOH degradation factor related to the temperature of the battery
D E G TH SOH degradation factor related to the throughput of the battery
T p Ah Throughput of the battery
T dec Amount of decreased temperature per second
T inc Amount of increased temperature per second
T cell Function of the cell temperature
T ambient Ambient temperature of the cell
S O H Batt SOH of the battery

Appendix A

The SOC is typically calculated using the current (A1) [32]. In this research, we assume a constant DC voltage, so the change in the SOC can be represented by a power-based expression (A2).
S O C ( t ) = S O C 0 + 1 Q h i ( t ) d t ,
Δ S O C ( t ) = 1 E h P ESS ( t ) d t ,
where Δ SOC ( t ) = SOC ( t ) SOC 0 ; Q is the nominal electric charge capacity of a battery (or SC or HESS) (Ah); i ( t ) is the battery (or SC or HESS) current (A); SOC 0 is the initial SOC; E is the nominal energy capacity of a battery (or SC or HESS) (Wh); P is the battery (or SC or HESS) power (W); and h is a constant used for converting the time from hours to seconds.

References

  1. Bevrani, H.; Ghosh, A.; Ledwich, G. Renewable energy sources and frequency regulation: Survey and new perspectives. IET Renew. Power Gener. 2010, 4, 438–457. [Google Scholar] [CrossRef] [Green Version]
  2. Li, J.; Xiong, R.; Yang, Q.; Liang, F.; Zhang, M.; Yuan, W. Design/test of a hybrid energy storage system for primary frequency control using a dynamic droop method in an isolated microgrid power system. Appl. Energy 2016. [Google Scholar] [CrossRef]
  3. Li, J.; Yang, Q.; Robinson, F.; Liang, F.; Zhang, M.; Yuan, W. Design and test of a new droop control algorithm for a SMES/battery hybrid energy storage system. Energy 2016, 118. [Google Scholar] [CrossRef]
  4. Shim, J.W.; Verbič, G.; Zhang, N.; Hur, K. Harmonious Integration of Faster-Acting Energy Storage Systems Into Frequency Control Reserves in Power Grid with High Renewable Generation. IEEE Trans. Power Syst. 2018, 33, 6193–6205. [Google Scholar] [CrossRef]
  5. Shim, J.W.; Verbič, G.; Kim, H.; Hur, K. On Droop Control of Energy-Constrained Battery Energy Storage Systems for Grid Frequency Regulation. IEEE Access 2019, 7, 166353–166364. [Google Scholar] [CrossRef]
  6. Conover, D.R.; Crawford, A.J.; Viswanathan, V.V.; Ferreira, S.; Schoenwald, D. Protocol for Uniformly Measuring and Expressing the Performance Of Energy Storage Systems; Technical Report; Pacific Northwest National Lab. (PNNL): Richland, WA, USA, 2014.
  7. Greenwood, D.; Lim, K.Y.; Patsios, C.; Lyons, P.; Lim, Y.S.; Taylor, P. Frequency response services designed for energy storage. Appl. Energy 2017, 203, 115–127. [Google Scholar] [CrossRef]
  8. Rosewater, D.; Ferreira, S. Development of a frequency regulation duty-cycle for standardized energy storage performance testing. J. Energy Storage 2016, 7, 286–294. [Google Scholar] [CrossRef] [Green Version]
  9. Zhang, F.; Tokombayev, M.; Song, Y.; Gross, G. Effective flywheel energy storage (FES) offer strategies for frequency regulation service provision. In Proceedings of the 2014 Power Systems Computation Conference, Wroclaw, Poland, 18–22 August 2014; pp. 1–7. [Google Scholar]
  10. Indu, P.; Jayan, M. Frequency regulation of an isolated hybrid power system with superconducting magnetic energy storage. In Proceedings of the 2015 International Conference on Power, Instrumentation, Control and Computing (PICC), Thrissur, India, 9–11 December 2015; pp. 1–6. [Google Scholar]
  11. Stroe, D.I.; Knap, V.; Swierczynski, M.; Stroe, A.I.; Teodorescu, R. Suggested operation of grid-connected lithium-ion battery energy storage system for primary frequency regulation: Lifetime perspective. In Proceedings of the 2015 IEEE Energy Conversion Congress and Exposition (ECCE), Montreal, QC, Canada, 20–24 September 2015; pp. 1105–1111. [Google Scholar]
  12. Świerczyński, M.; Stroe, D.I.; Stan, A.I.; Teodorescu, R. Primary frequency regulation with Li-ion battery energy storage system: A case study for Denmark. In Proceedings of the 2013 IEEE ECCE Asia Downunder, Melbourne, Australia, 3–6 June 2013; pp. 487–492. [Google Scholar]
  13. Mongkoltanatas, J.; Riu, D.; LePivert, X. Energy storage design for primary frequency control for islanding micro grid. In Proceedings of the IECON 2012 38th Annual Conference on IEEE Industrial Electronics Society, Montreal, QC, Canada, 25–28 October 2012; pp. 5643–5649. [Google Scholar]
  14. Cho, Y.; Shim, J.W.; Kim, S.J.; Min, S.W.; Hur, K. Enhanced frequency regulation service using hybrid energy storage system against increasing power-load variability. In Proceedings of the 2013 IEEE Power & Energy Society General Meeting, Vancouver, BC, Canada, 21–25 July 2013; pp. 1–5. [Google Scholar]
  15. Yue, M.; Wang, X. Grid Inertial Response-Based Probabilistic Determination of Energy Storage System Capacity Under High Solar Penetration. IEEE Trans. Sustain. Energy 2015, 6, 1039–1049. [Google Scholar] [CrossRef]
  16. Wickramasinghe Abeywardana, D.B.; Hredzak, B.; Agelidis, V.G. A Fixed-Frequency Sliding Mode Controller for a Boost-Inverter-Based Battery-Supercapacitor Hybrid Energy Storage System. IEEE Trans. Power Electron. 2017, 32, 668–680. [Google Scholar] [CrossRef]
  17. Akram, U.; Khalid, M. A Coordinated Frequency Regulation Framework Based on Hybrid Battery-Ultracapacitor Energy Storage Technologies. IEEE Access 2018, 6, 7310–7320. [Google Scholar] [CrossRef]
  18. Cao, J.; Du, W.; Wang, H.; McCulloch, M. Optimal Sizing and Control Strategies for Hybrid Storage System as Limited by Grid Frequency Deviations. IEEE Trans. Power Syst. 2018, 33, 5486–5495. [Google Scholar] [CrossRef]
  19. Akram, U.; Shah, R.; Mithulananthan, N. Hybrid energy stoarage system for frequency regulation in microgrids with source and load uncertainties. IET Gener. Transm. Distrib. 2019, 13, 5048–5057. [Google Scholar] [CrossRef]
  20. Kundur, P. Power System Stability and Control; The EPRI Power System Engineering Series; McGraw-Hill: New York, NY, USA, 1994. [Google Scholar]
  21. Xiao, J.; Wang, P.; Setyawan, L. Hierarchical control of hybrid energy storage system in DC microgrids. IEEE Trans. Ind. Electron. 2015, 62, 4915–4924. [Google Scholar] [CrossRef]
  22. Pahasa, J.; Ngamroo, I. PHEVs bidirectional charging/discharging and SoC control for microgrid frequency stabilization using multiple MPC. IEEE Trans. Smart Grid 2014, 6, 526–533. [Google Scholar] [CrossRef]
  23. Liu, H.; Hu, Z.; Song, Y.; Wang, J.; Xie, X. Vehicle-to-grid control for supplementary frequency regulation considering charging demands. IEEE Trans. Power Syst. 2014, 30, 3110–3119. [Google Scholar] [CrossRef]
  24. Tan, J.; Zhang, Y. Coordinated control strategy of a battery energy storage system to support a wind power plant providing multi-timescale frequency ancillary services. IEEE Trans. Sustain. Energy 2017, 8, 1140–1153. [Google Scholar] [CrossRef]
  25. Gundogdu, B.M.; Nejad, S.; Gladwin, D.T.; Foster, M.P.; Stone, D.A. A battery energy management strategy for UK enhanced frequency response and triad avoidance. IEEE Trans. Ind. Electron. 2018, 65, 9509–9517. [Google Scholar] [CrossRef] [Green Version]
  26. Nguyen, V.T.; Shim, J.W. Virtual Capacity of Hybrid Energy Storage Systems Using Adaptive State of Charge Range Control for Smoothing Renewable Intermittency. IEEE Access 2020, 8, 126951–126964. [Google Scholar] [CrossRef]
  27. Soon Ng, K.; Moo, C.S.; Chen, Y.P.; Hsieh, Y.C. Enhanced Coulomb counting method for estimating state-of-charge and state-of-health of lithium-ion batteries. Appl. Energy 2009, 86, 1506–1511. [Google Scholar] [CrossRef]
  28. Huang, S.C.; Tseng, K.H.; Liang, J.W.; Chang, C.L.; Pecht, M. An online SOC and SOH estimation model for lithium-ion batteries. Energies 2017, 10, 512. [Google Scholar] [CrossRef]
  29. Chen, M.; Rincon-Mora, G.A. Accurate electrical battery model capable of predicting runtime and I-V performance. IEEE Trans. Energy Convers. 2006, 21, 504–511. [Google Scholar] [CrossRef]
  30. Kim, W. Real Time SOH Estimation Method for Lithium Ion Batteries By Accumulation of Faded Capacity. Master’s Thesis, Yonsei University, Seoul, Korea, 2016. [Google Scholar]
  31. Wang, J.; Liu, P.; Hicks-Garner, J.; Sherman, E.; Soukiazian, S.; Verbrugge, M.; Tataria, H.; Musser, J.; Finamore, P. Cycle-life model for graphite-LiFePO 4 cells. Lancet 2011, 196, 3942–3948. [Google Scholar] [CrossRef]
  32. González-Longatt, F.M. Circuit based battery models: A review. Congreso Iberoamericano de Estudiantes de Ingenieria Electrica. Cibelec. 2006. Available online: https://www.semanticscholar.org/paper/Circuit-Based-Battery-Models3A-A-Review-Gonzalez-Longatt/5a79ca86eaea1de96f7c3ea1248ea4b28f55c2f1?p2df (accessed on 28 November 2020).
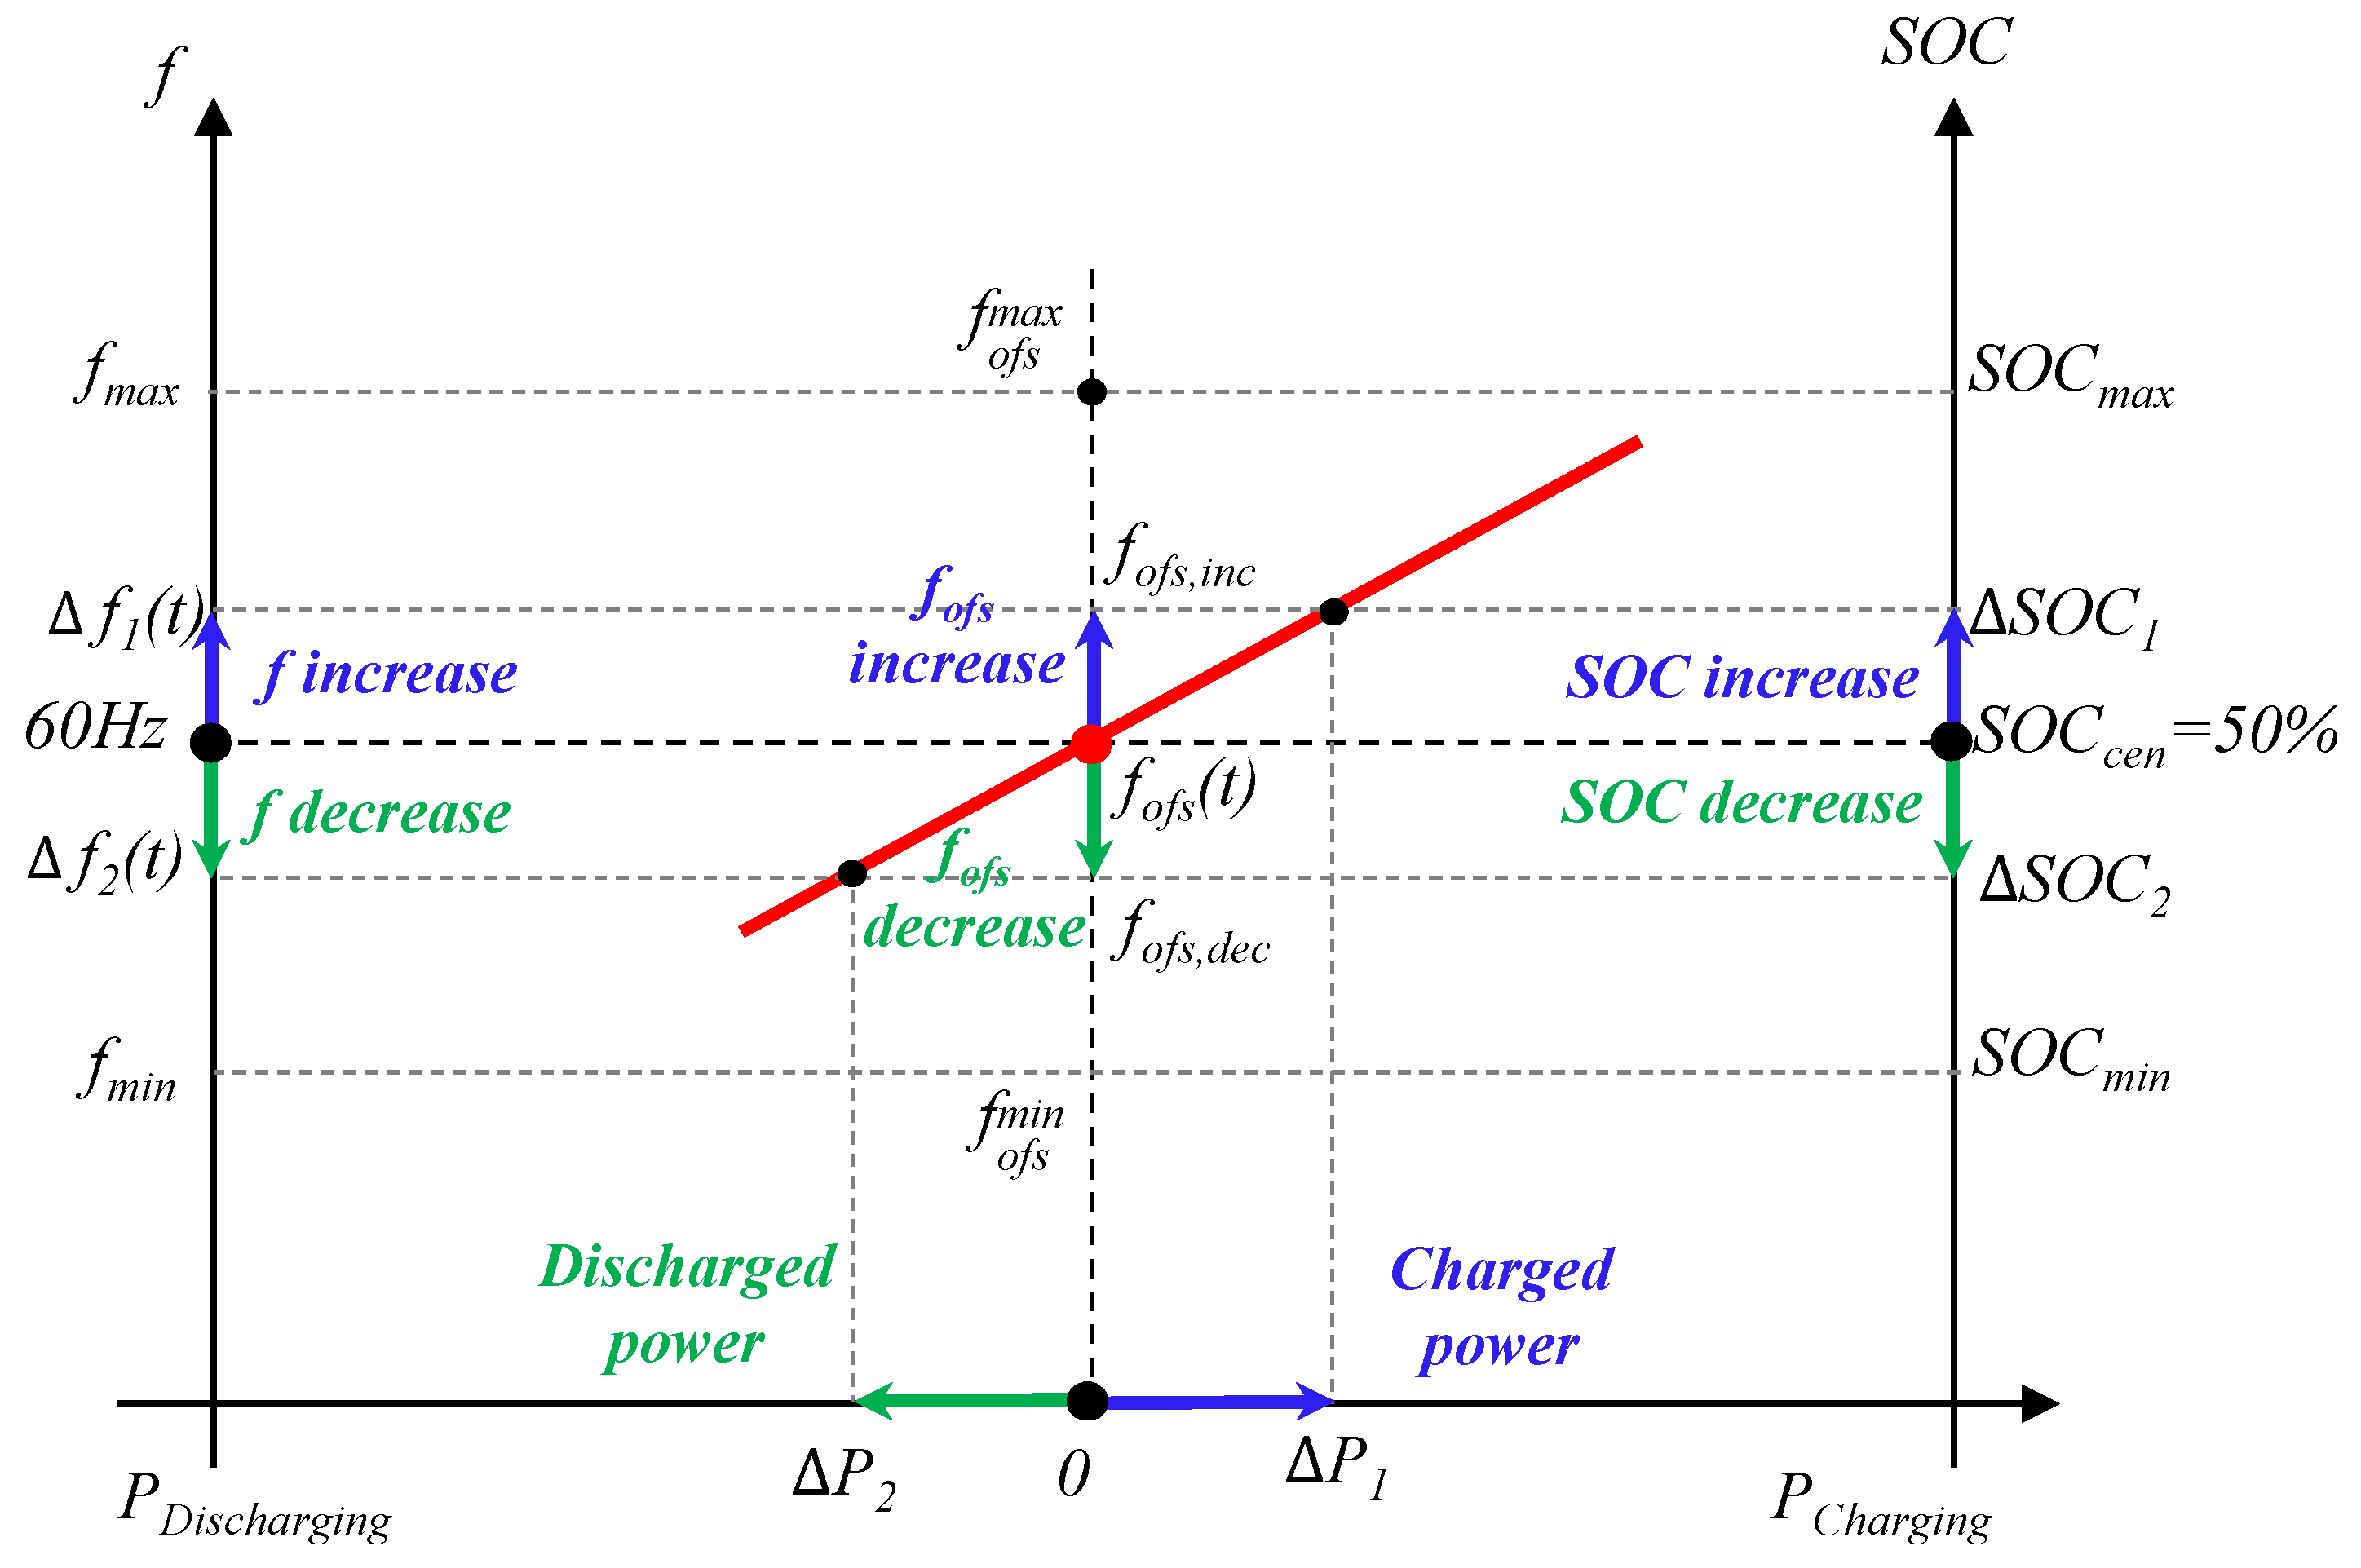
Figure 1. Operation principle of the droop control with SOC feedback (DSOF).
Energies 13 06304 g001
Figure 2. The block diagram of the DSOF method for the HESS: (a) SOC feedback for the FR (b) equivalent transfer function of the proposed method.
Energies 13 06304 g002
Figure 3. The proposed HESS block diagram.
Energies 13 06304 g003
Figure 4. The frequency- and time-domain analysis of the proposed method (input: Δ f , output: Δ P HESS , P B , P SC ): (a) Bode plot comparing the HESS, battery, and SC; (b) the ESS power in response to the frequency against step change (input: 0.01 pu) in the time domain.
Energies 13 06304 g004
Figure 5. HESS integration in the power system.
Energies 13 06304 g005
Figure 6. The block diagram of the FR HESS integration in the power system.
Energies 13 06304 g006
Figure 7. Bode plot of the HESS with the integration of the WT: (a) Case 1, (b) Case 2, (c) Case 3, and (d) Case 4.
Energies 13 06304 g007
Figure 8. The relationship between the time constant and the size of the storages (SC and battery).
Energies 13 06304 g008
Figure 9. The simulation results in the time domain: (a) RES power; (b) frequency response with/without the HESS.
Energies 13 06304 g009
Figure 10. The compensation power of the battery and SC in response to the frequency change in Table 1: (a) battery power, (b) SC power.
Energies 13 06304 g010
Figure 11. The comparison of the battery SOC for the cases in Table 1.
Energies 13 06304 g011
Figure 12. The relationship between V OC and the SOC according to the SOH.
Energies 13 06304 g012
Figure 13. Factors affecting the degradation of the SOH.
Energies 13 06304 g013
Figure 14. Grid frequency: (a) grid frequency for 250 days; (b) grid frequency for a half day.
Energies 13 06304 g014
Figure 15. SOH degradation test results: (a) throughput degradation (%), (b) SOC (%), (c) total cycles of full charge/discharge, (d) temperature of the cell ( C), and (e) SOH degradation (%).
Energies 13 06304 g015
Table 1. System parameters of the test cases.
CaseSC (kWh)Battery (MWh)
1. Small SC, small battery0.20.5
2. Medium SC, small battery20.5
3. Large SC, small battery200.5
4. Large SC, large battery205
Table 2. The results of the HESS and SC indicators based on Table 1.
SymbolsParametersCase 1Case 2Case 3Case 4
T 1 Time Constant678.85 s684.2 s705.72 s6812.3 s
T 2 Time Constant0.2714 s2.7144 s27.1739 s27.1739 s
f HESS Cut-off frequency1.473 mHz1.467 mHz1.416 mHz0.1467 mHz
f SC Cut-off frequency3.6841 Hz0.3684 Hz0.0368 Hz0.0368 Hz
Table 3. Parameters for the type of battery.
Type of BatterySC (kWh)Battery (MWh)
1. Battery in the HESS205
2. Single Battery05
Table 4. Polynomial form due to the battery temperature.
Temp Δ T 1 Base 60 CTemperature Degradation ( DEG T )
25352 · 10 5 t + 0.0703
33273 · 10 5 t + 0.1195
40204 · 10 5 t + 0.2476
50103 · 10 5 t + 0.7643
6001
Table 5. Comparison of relevant criteria to the SOH calculation between the independent battery and battery in the HESS.
Type of ESSCycles DEG SOC DEG T DEG TH SOH
Independent battery4058.5%0.24%99.81%99.67%
Battery in the HESS4058.7%0.22%99.97%99.84%
Publisher’s Note: MDPI stays neutral with regard to jurisdictional claims in published maps and institutional affiliations.