Article

Power Performance Analysis According to the Configuration and Load Control Algorithm of Power Take-Off System for Oscillating Water Column Type Wave Energy Converters

1
Korea Research Institute of Ships and Ocean Engineering (KRISO), 1312-32 Yuseong-daero, Yuseong-gu, Daejeon 34103, Korea
2
School of Electrical and Electronics Engineering, Chung-Ang University, Seoul 06974, Korea
*
Author to whom correspondence should be addressed.
Energies 2020, 13(23), 6415; https://doi.org/10.3390/en13236415
Submission received: 7 September 2020 / Revised: 24 November 2020 / Accepted: 26 November 2020 / Published: 4 December 2020
(This article belongs to the Special Issue Wave Energy Conversion 2021)

Abstract

:
A power take-off (PTO) system for an oscillating water column (OWC) wave energy converter comprises a turbine-generator-power converter. In this study, only the topologies of the power converter that affect the load control algorithm are compared. A power converter for renewable energy is composed of a diode-dc/dc converter and a pulse-width modulation (PWM) converter operating at small and large capacities, respectively. However, selecting a power converter according to the capacity based on the characteristics of the wave energy converter, in which the input energy is highly fluctuating, can significantly reduce the power performance. Thus, to verify load control characteristics according to the topology of the power converter, the turbine-generator-power converter was incorporated in the modeling, and the power performance based on the power converter topology under various wave conditions was analyzed. Further, torque control to obtain the maximum power among load control algorithms was applied under irregular wave conditions, and the power performance and PTO system characteristics according to the torque coefficient were analyzed. The results of this study suggested an increase in the torque coefficient of the maximum power control for the operational stability of the OWC-WEC, and it was confirmed that the RPM characteristics of the PTO system were reduced.

1. Introduction

Many new renewable energy systems that employ wave energy are being studied [1,2]. These technologies play an important part in driving renewable energy such as wind power and solar power. Several models have already been implemented in the ocean to complete commercial testing [3,4]. However, to enter the commercialization stage, it is necessary to study a control strategy to extract maximum power by adjusting a power take-off (PTO) system in response to irregular marine environment conditions. Initial research was conducted to obtain the maximum power generation using the theoretical optimal damping coefficient of the PTO system [5,6,7]. However, this control strategy cannot be implemented for practical applications because it requires predicting the excitation force of the wave and the velocity of the body.
Further, oscillating water column-wave energy converters (OWC-WECs) have been widely studied. In terms of construction, the simpler OWC-WEC focused on fixed systems along the coast [8,9,10] and floating systems in the open sea [11,12,13,14,15]. The OWC-WEC is composed of an oscillating water column chamber, turbine system, generator, and power converter. The interior surface of the chamber vibrates because of the incident wave. A reciprocating flow for turbine operation occurs because of pressure fluctuations in the chamber. Even if a reciprocating flow occurs, the turbine is rotated in only one direction through the guide vane; this method is suitable for conversion to electrical energy.
The studies were conducted to improve the efficiency of the OWC-WEC using a control strategy [16,17]. Jefferys et al. [16] presented an OWC-WEC latching control strategy considering air compressibility. Hoskin et al. [17] applied a phase controller to the OWC-WEC by making the attenuation factor proportional to the speed of the turbine. All these studies aimed to develop a strategy to maximize conversion efficiency at the chamber stage. However, the overall efficiency of the OWC-WEC is affected by the efficiency of the turbine, and therefore, a turbine control strategy is required for the system. The pneumatic energy derived from the chamber is transferred to the turbine, and the rotation of the turbine affects the movement of the chamber. Therefore, control strategies considering the effects of a turbine system have been studied [18,19,20].
In [18,19,20], a frequency domain analysis was introduced to calculate simulations considering various marine conditions. However, because the rotational speed of the turbine system is fixed, the result of the turbine is not valid when the input energy is low. Therefore, a time domain analysis was conducted using a real-time control method for the OWC-WEC considering turbine aerodynamics [21]. Unlike the frequency domain analysis, the angular velocity of the turbine was determined in real time using inertia and torque. However, it is difficult to apply this analysis to an actual system because the part related to the electric torque control of the generator is not considered.
For OWC-WEC, a rotational speed-based control strategy was first proposed in 1994 [22], and a rotational speed control by changing the electric torque using a power meter was proposed [23]. This is the most commonly used control method in OWC-WEC. Based on the rotational speed control, ref. [24] proposed the dependence of the electric torque according to the load factor and the control strategy for the rated output control. In addition, Maximum Power Pont Tracking (MPPT) control that reflects the optimization algorithm based on neural network [25] and fuzzy logic [26] was proposed. ref. [27] conducted research on rotational speed control strategy including sliding mode controller. Additionally, in [28], latching control using a high-speed control valve based on rotational speed control was proposed. In this paper, the most general rotational speed control-based maximum power control was applied to analyze the power generation performance based on the integrated simulation of OWC-WEC, and the characteristics analysis and power generation performance of PTO system of OWC-WEC according to the load factor control were conducted. In addition, the analysis on the load control performance of the power converter according to the MPPT control was intensively analyzed.
In this study, a time domain analysis reflecting real-time control under various input wave conditions was conducted by modeling the actual PTO system of the OWC-WEC. Based on the amount of pneumatic power generated according to the input wave condition, the characteristics of the PTO system and the output power generation based on the load control performance of the power converter were compared. The load control was considered for evaluating the electric torque control performance according to the topology of the power converter and the maximum power point tracking (MPPT) algorithm. In addition, the MPPT algorithm analyzed the power generation performance and turbine performance and efficiency according to the optimum torque coefficient and torque coefficient increase or decrease. As the torque coefficient increased, the MPPT algorithm obtained a lower amount of power generation, but due to the characteristics of wave power generation where the input energy rapidly changes, the stability of the operation was confirmed by reducing the variability of RPM. Increasing the torque coefficient of the MPPT algorithm than the optimal torque coefficient can be proposed as an MPPT algorithm that can overcome the limitations of OWC-WEC. Additionally, since this paper focuses on the performance of the load control of the power converter, the fluid dynamics of the chamber and turbine are assumed to be efficiency-based.

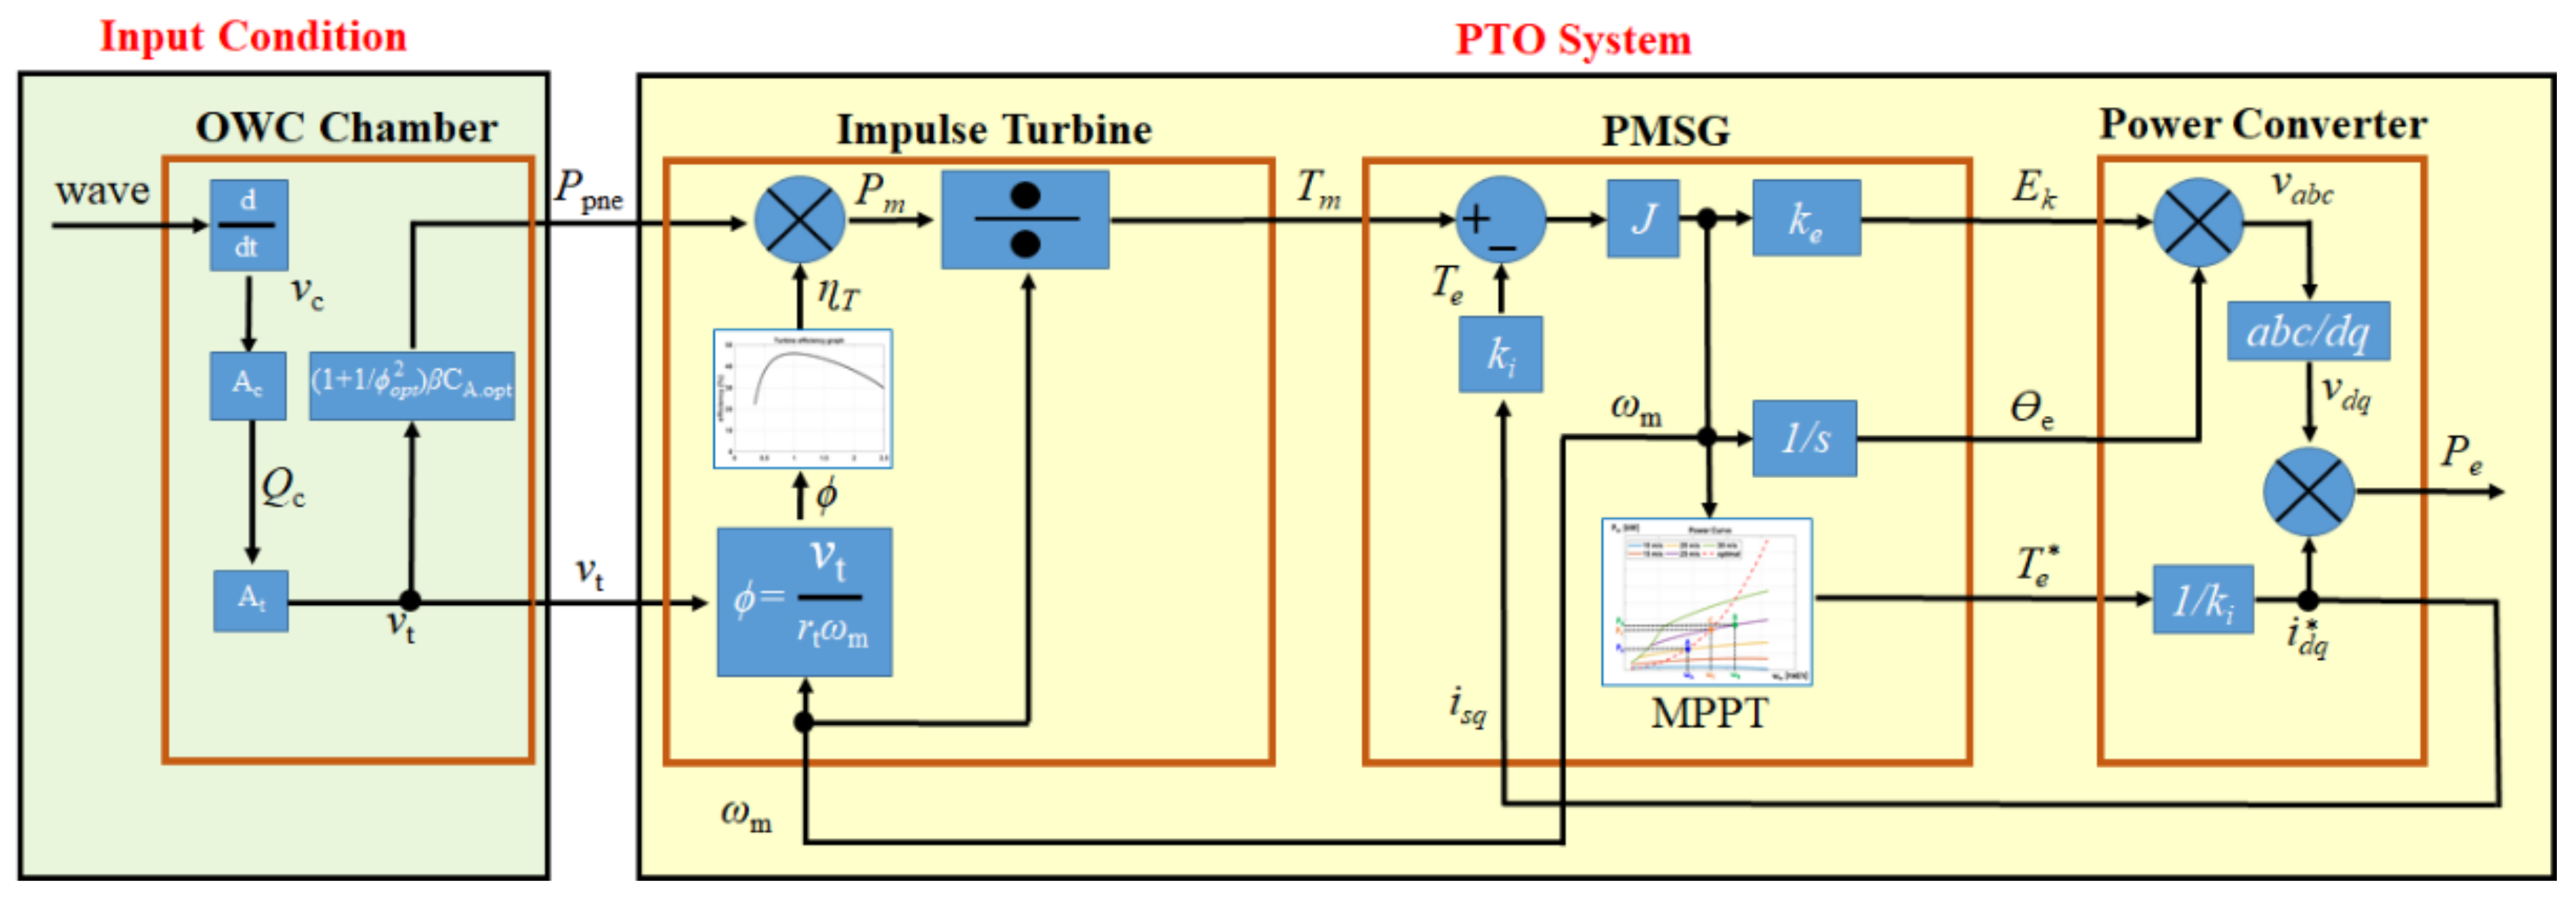
2. PTO System Configuration and Modeling

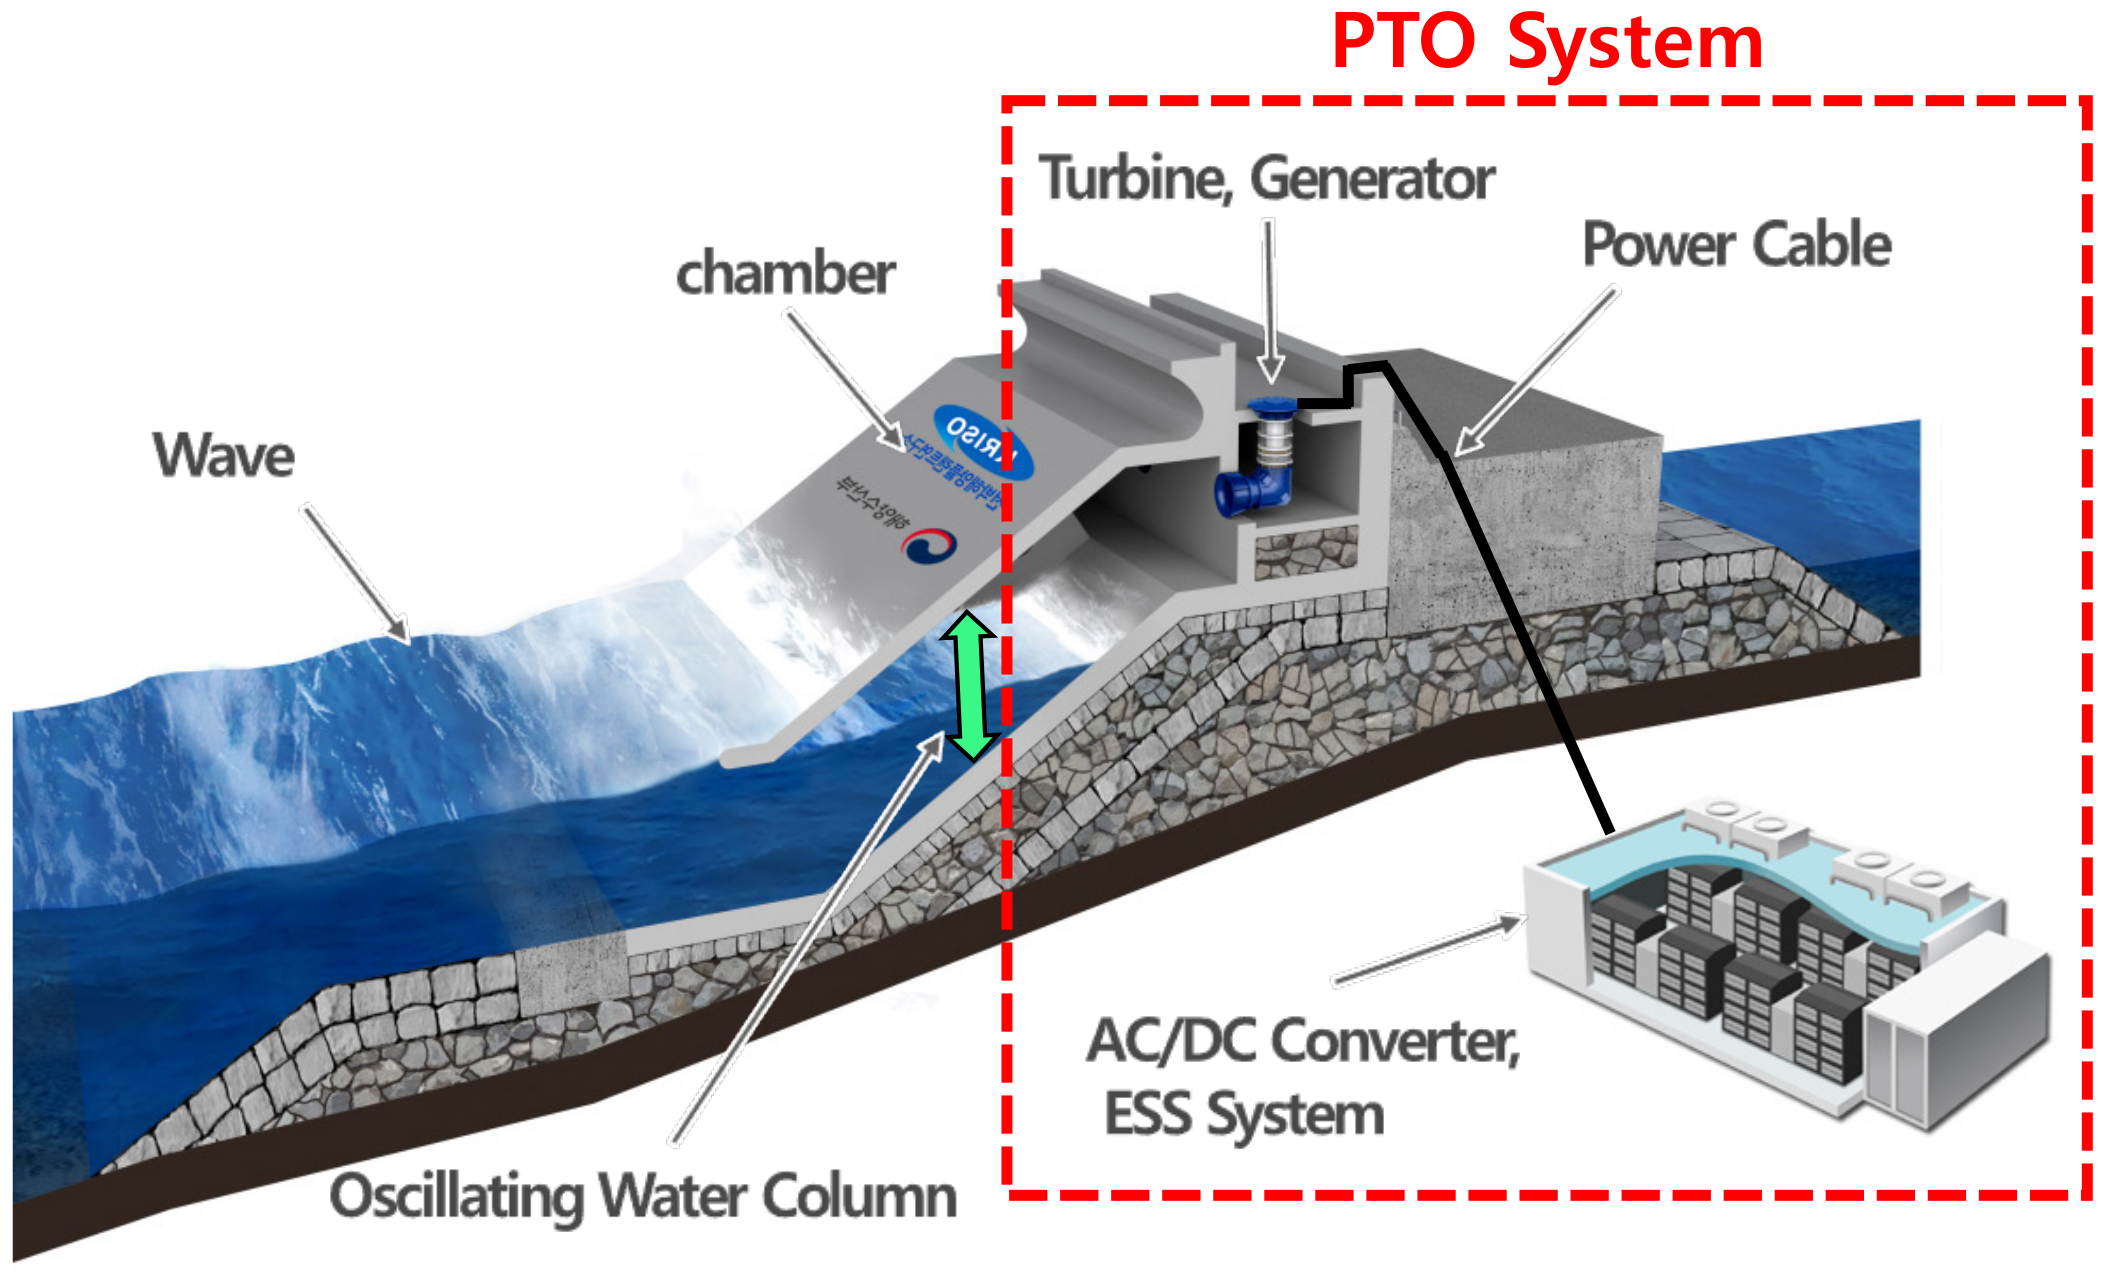
2.1. PTO System Composition of the OWC-Type Wave Energy Converter

Figure 1 shows that the OWC-WEC consists of an oscillating water column (OWC) chamber that delivers input wave energy as pneumatic energy to a PTO system, and a PTO system that delivers pneumatic energy as electrical energy. In consideration of the installation environment, the OWC-WEC structure was selected as an inclined OWC-WEC structure that can reduce energy loss by being less affected by turbulence, and a concrete wave breaker was added to prevent overtopping of waves [29]. The PTO system of the OWC-WEC comprises a turbine, generator, and power converter. The turbine efficiency is the ratio between the turbine shaft power and the pneumatic power available to the turbine, as shown in Equation (3). The efficiency of the turbine system plays a major role in the overall efficiency of the PTO system of the OWC-WEC. The efficiency of the generator and power converter is higher than that of the turbine system; it has a high efficiency of 90% or greater in the part under load control. Therefore, the PTO system of the OWC-WEC is controlled to increase the efficiency of the turbine. In other words, because the ratio of the input and turbine angular velocities is an important factor of turbine efficiency, angular velocity control is the most important part of the PTO system of the OWC-WEC according to the input velocity to obtain the maximum efficiency of the turbine. However, because input velocity cannot be measured accurately, load control is required to obtain the maximum efficiency of the turbine without measuring the input velocity.
Although the efficiency of the turbine system is an important component of the efficiency of the PTO system, angular speed control that determines the efficiency of the turbine depends on the power converter, and therefore, the load control of the power converter directly affects turbine efficiency. Although the inertia of the turbine system generator is present, the variability of the wave energy is large, so the load control of the power converter is very important. That is, the angular speed changes based on the load control performance of the power converter, and accordingly, the efficiency of the turbine changes as a whole. In this study, the power generation performance is compared according to the power converter of different topologies as the performance of load control differs based on the topology of the power converter. In addition, because the load control performance varies according to the maximum output control algorithm, the power generation performance is compared considering this aspect.
This study compares the power generation performance considering various factors affecting load control via the integrated modeling of the PTO system of the OWC-WEC. The comparison results will help verify the performance of the PTO system according to load control in the OWC-WEC.

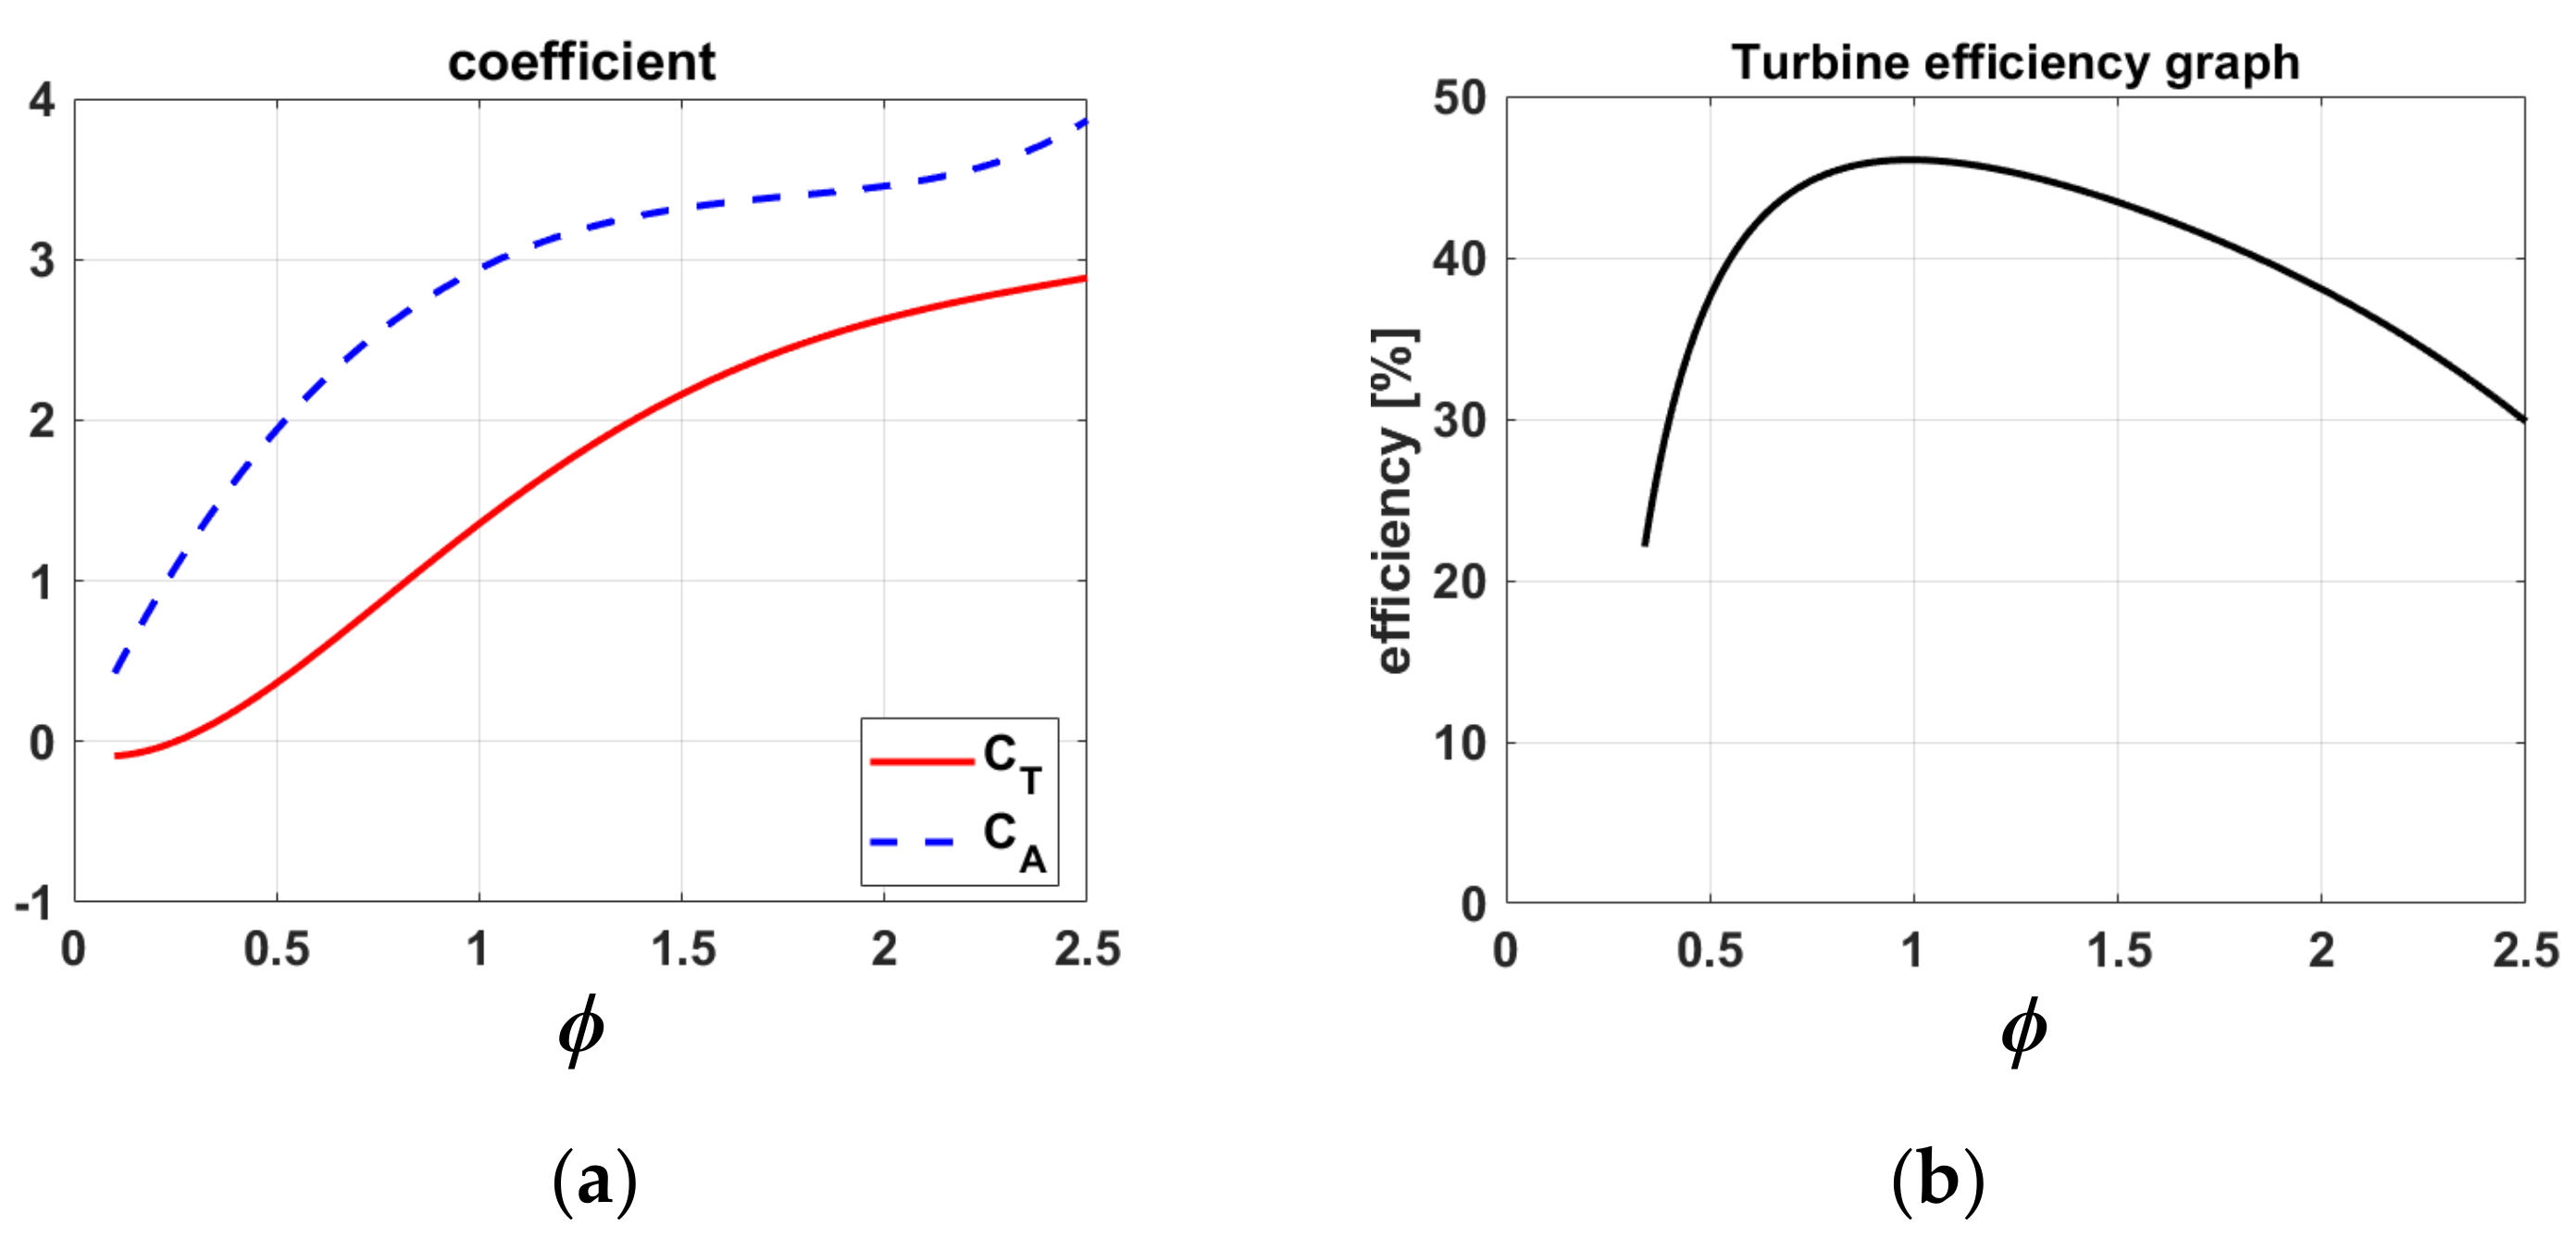
2.2. Impulse Turbine Modeling

Two types of turbine systems of OWC-WEC are generally used. Well turbines, which have been studied extensively, have a characteristic in that their efficiency is greatly reduced if load control based on the input energy fluctuation is not fast because high-speed operation characteristics and the range of angular speed required to obtain the maximum efficiency are narrow. Impulse turbines, which operate at a relatively low speed, do not drop significantly in efficiency depending on the angular speed, and have relatively easy load control, have therefore been studied in recent years [21]. Recently, research is being conducted on the most efficient biradial turbine [30]. In particular, the OWC-WEC may be suitable for an impulse turbine whose efficiency does not drop sharply according to load control because of fluctuations in input energy.
The dynamic models of impulse turbines are assumed to be steady-state and unidirectional flow rate models. Although the actual characteristics are characterized by bidirectional movement at varying angular speeds, the dynamic model of the turbine can be expressed as:
C A = Δ p Q β × v x 3 × 1 + 1 2
C T = T β × v x 2 × 1 + 1 2 × r t
η T = P m P pne = T × ω m Δ p Q = C T C A    
with:
= v x r t × ω m
β = ρ a × b t × l t × z 2
CA, CT, and turbine efficiency (ηT) shown in Equations (1)–(3) are a function of |Ø|, and therefore, it is necessary to model the simulation mathematically. Thus, this study uses CA and CT models derived from the experimental results of the 30 kW impulse turbine model; they are expressed as [31]:
C A = 0.0015 6 0.0193 5 + 0.0283 4 + 0.5313 3 2.8521 2 + 5.3347         0.0819
C T = 0.0075 6 0.1391 5 + 0.9676 4 3.1118 3 + 4.3434 2 0.6471         0.0651
where |Ø| is assumed to be within 0.3 < |Ø| < 2.5.
As shown in Figure 2, the range of |Ø| is used only above a certain value because CT with a value that is too small starts at a negative value.

2.3. Generator Modeling

The mechanical dynamic state of permanent magnet synchronous generator (PMSG) was modeled only using the difference between mechanical torque and electrical torque, assuming no loss due to friction. The one-mass model can be used represent the dynamic state of the PMSG generator as:
d d t ω m = 1 J T m T e
d d t θ m = ω m
where ω m is the angular velocity of the turbine, θ m is the rotor angle of the turbine, J is the moment of inertia, and Tm and Te are the mechanical torque and electrical torque, respectively.
The electromagnetic model of the PMSG can be expressed by applying Kirchhoff’s voltage law to the stator circuit. The PMSG electrical model is expressed using the dq-axis coordinate system, which is a rotating coordinate system that rotates at the same speed as the rotor of the generator, rather than the three-phase coordinate system:
V sd = L sq ω e i q L sd d i d d t R s i sd
V sq = ω e Ψ pm L sd ω e i sd L sq d i q d t R s i sq
where L sd ,   L sq represent the stator dq-axis inductances, R s is the stator resistance, ω e is the electrical angular frequency, Ψ pm is the flux linkage of the permanent magnet, and V sd and V sq are the stator dq-axis terminal voltages.
In the case of a three-phase balanced system, the instantaneous power Pe output by the PMSG can be expressed as:
P e = 3 2 ω e Ψ pm i sq ω e L sd L sq i sd i sq
Because the PMSG considered in this study uses the synchronous structure of the rotor, L sd L sq are the same. Therefore, Equation (13) can be summarized as:
P e = 3 2 ω e Ψ pm i sq
Using the relationship between power and torque, the electrical torque Te can be calculated as:
T e = P e ω m = 3 2 ω e Ψ pm i sq ω m = 3 2 N p Ψ pm i sq
The electrical angular frequency ( ω e ) is equal to the number of dipoles of the rotor ( N p ) and the angular velocity of the turbine ( ω m ). Equation (16) shows that electric torque is proportional to the stator q-axis current.

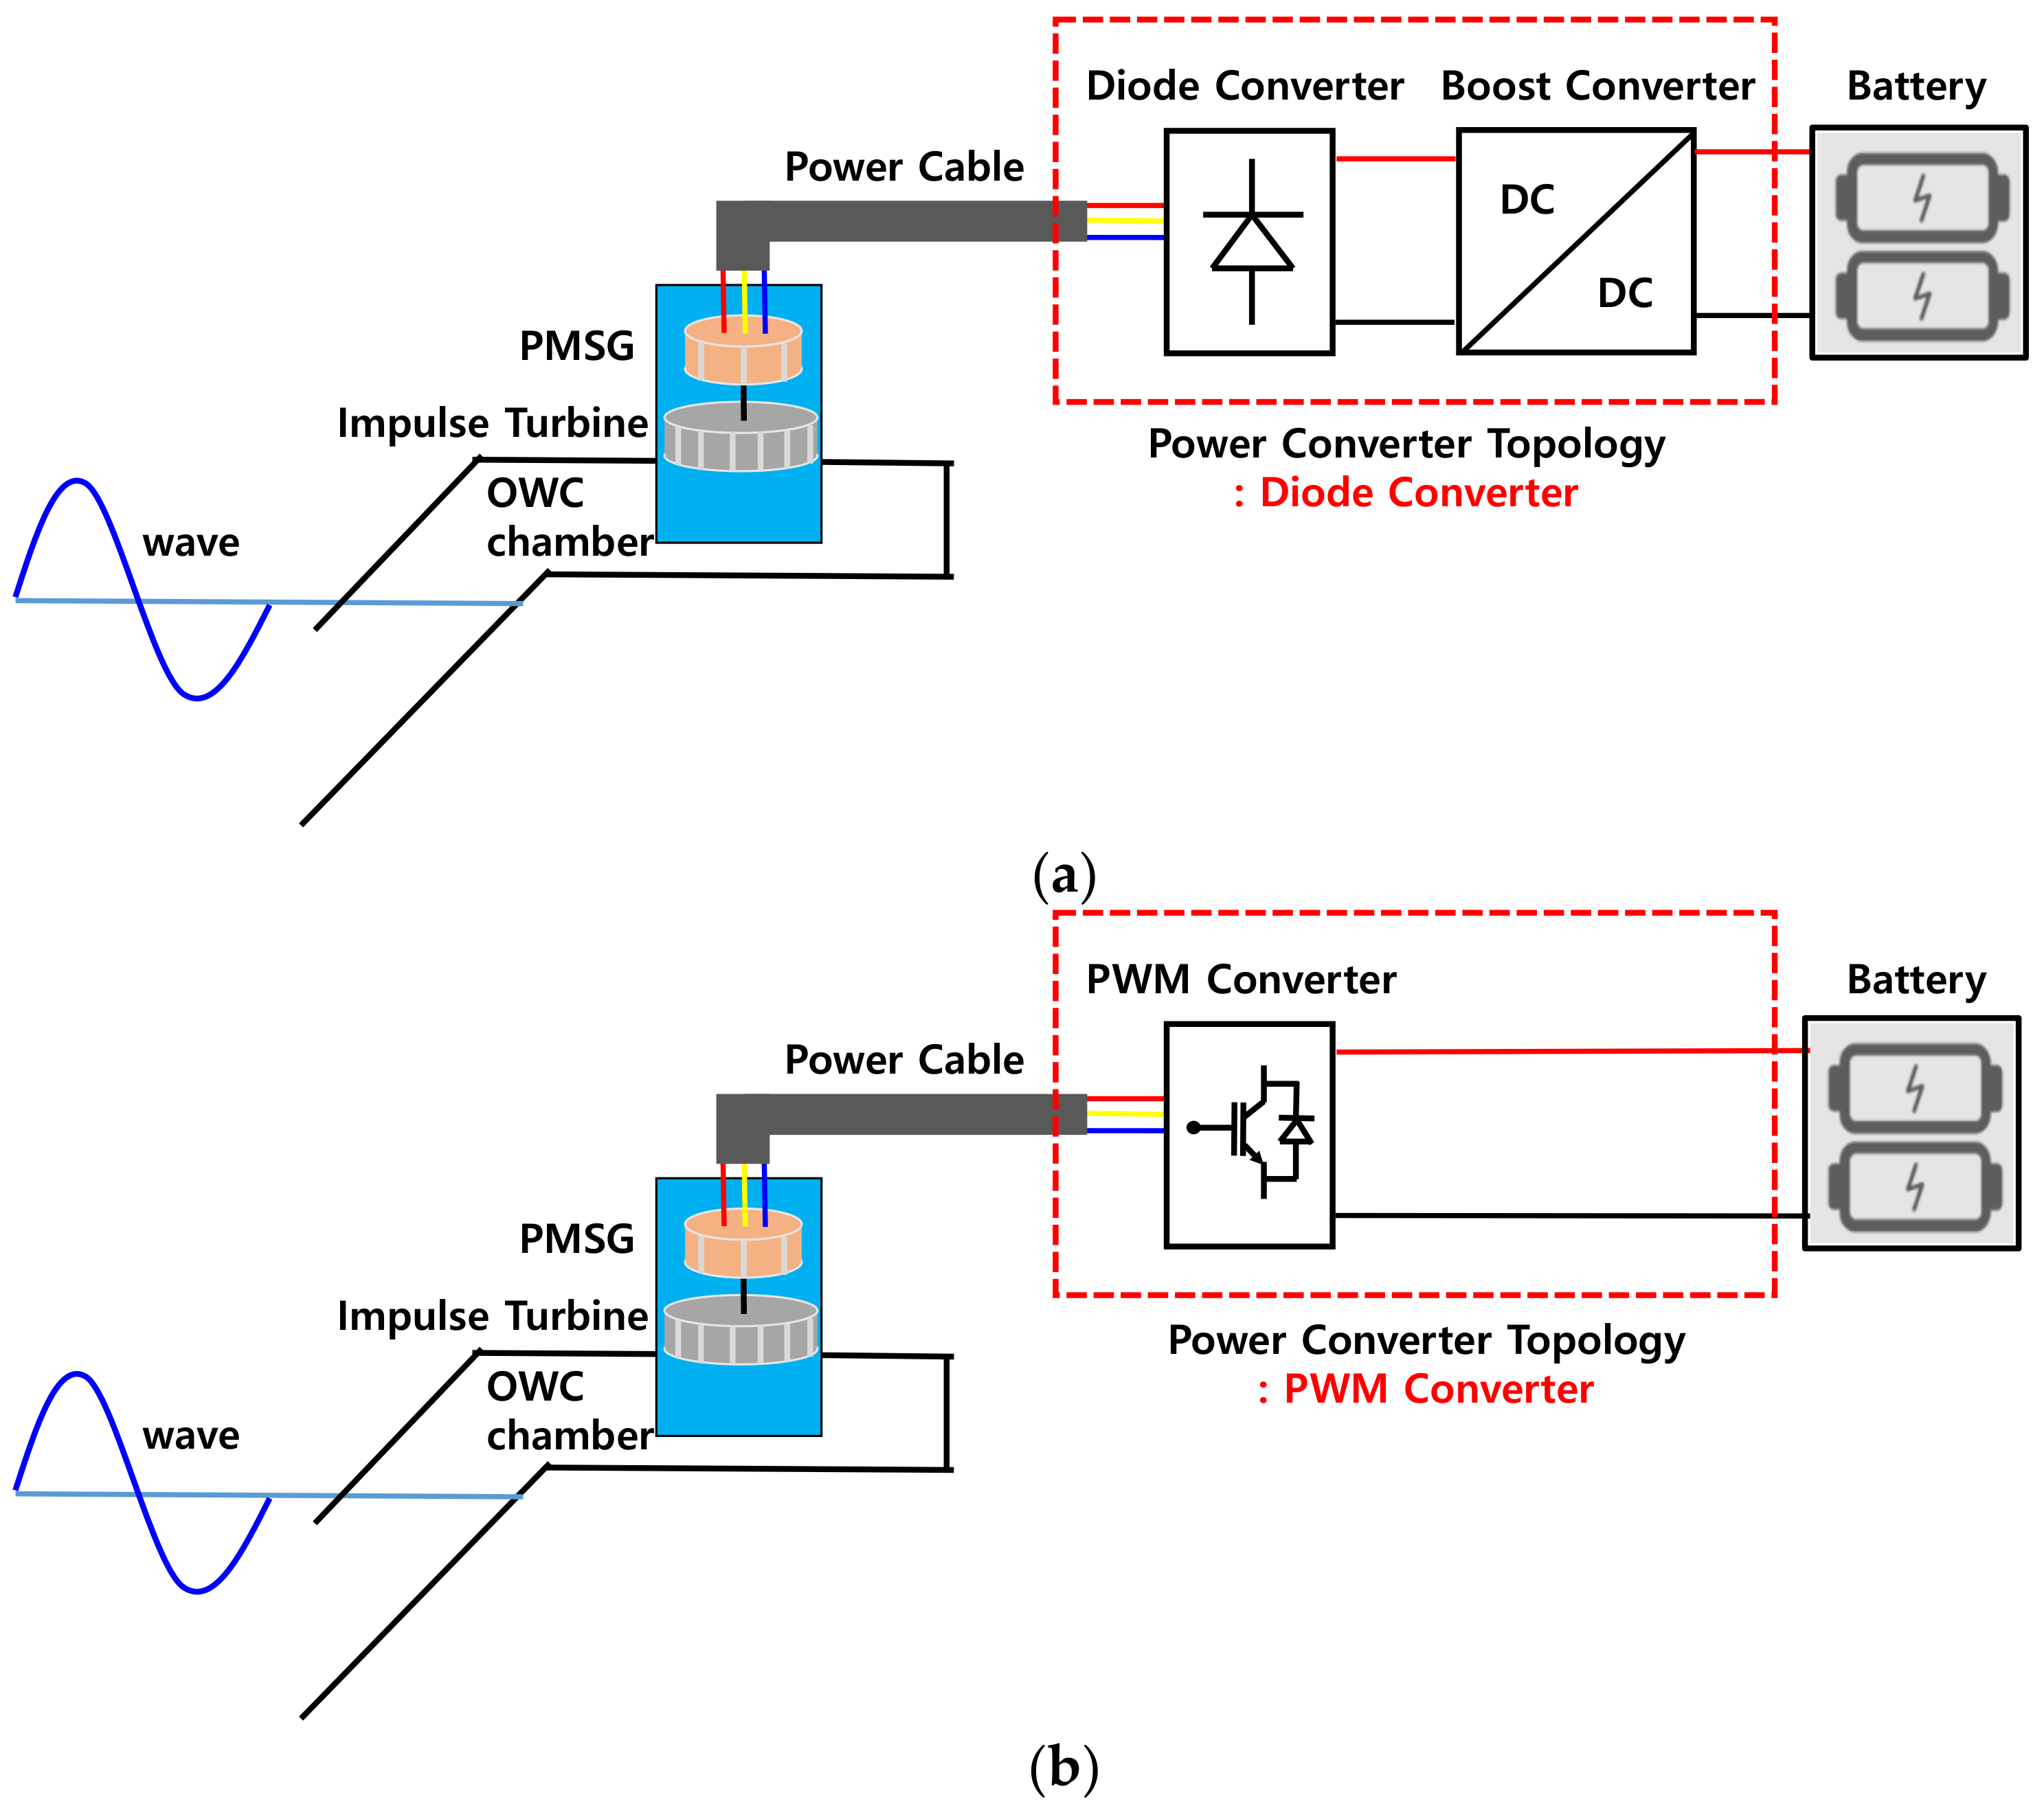
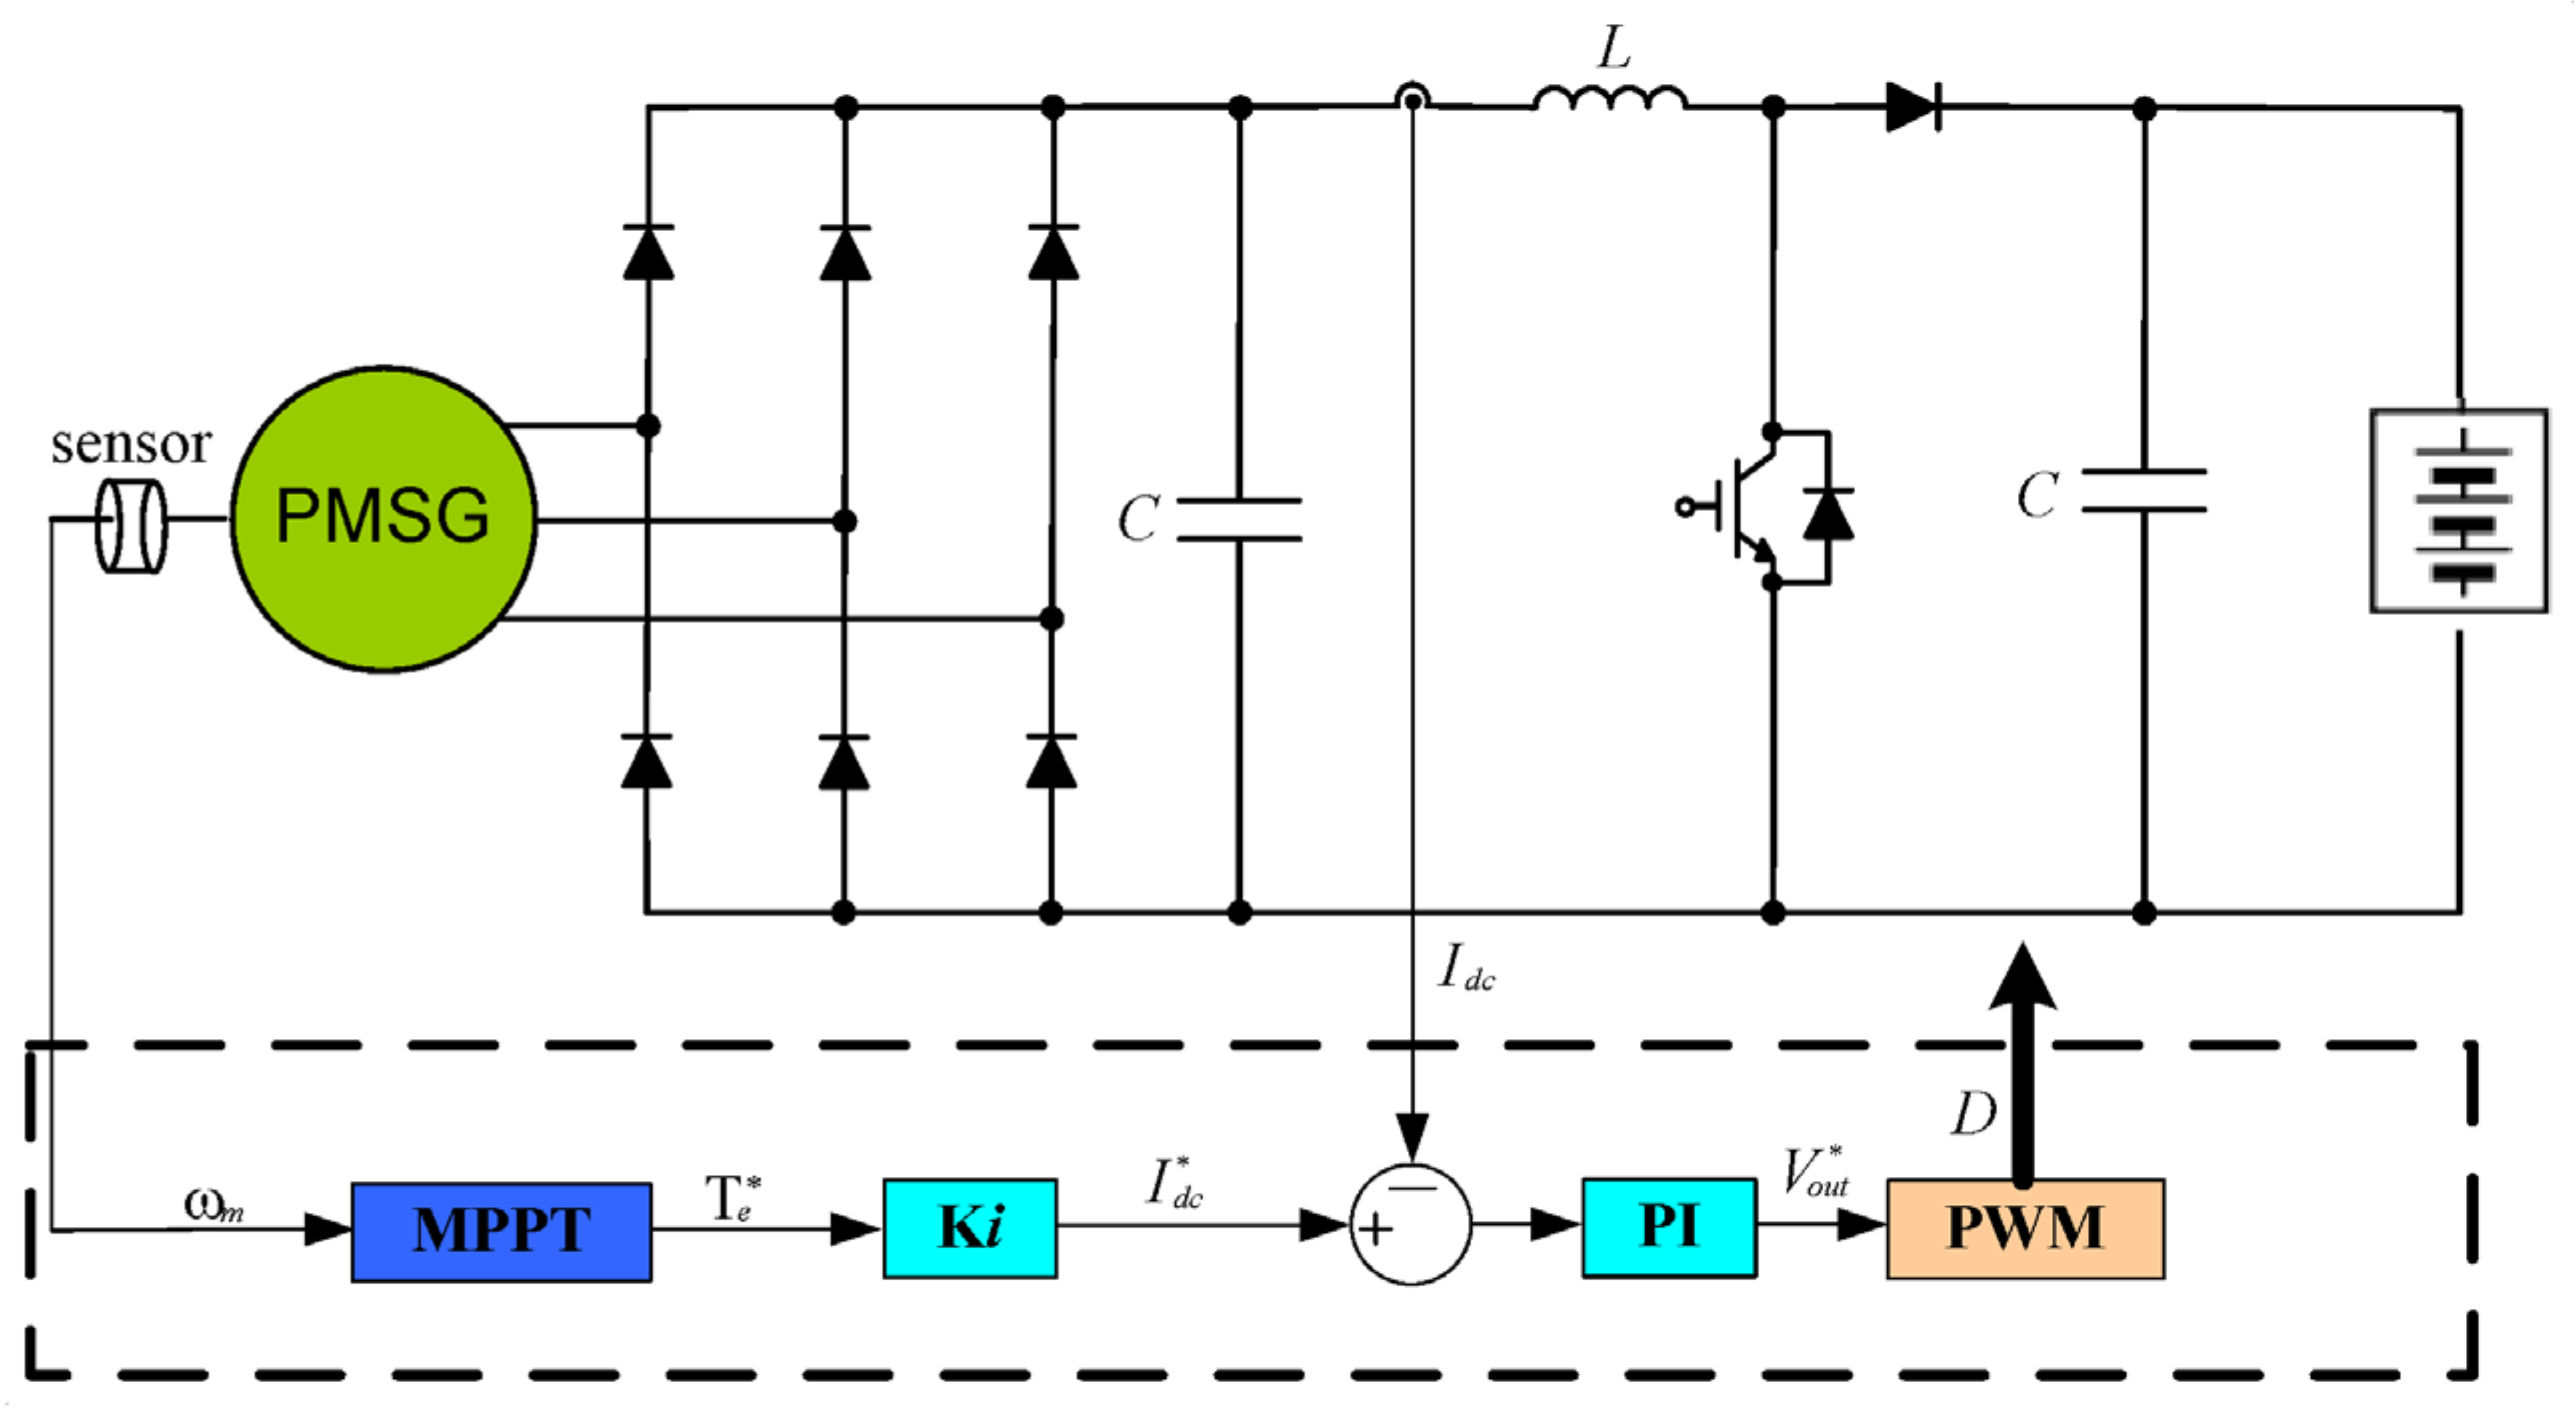
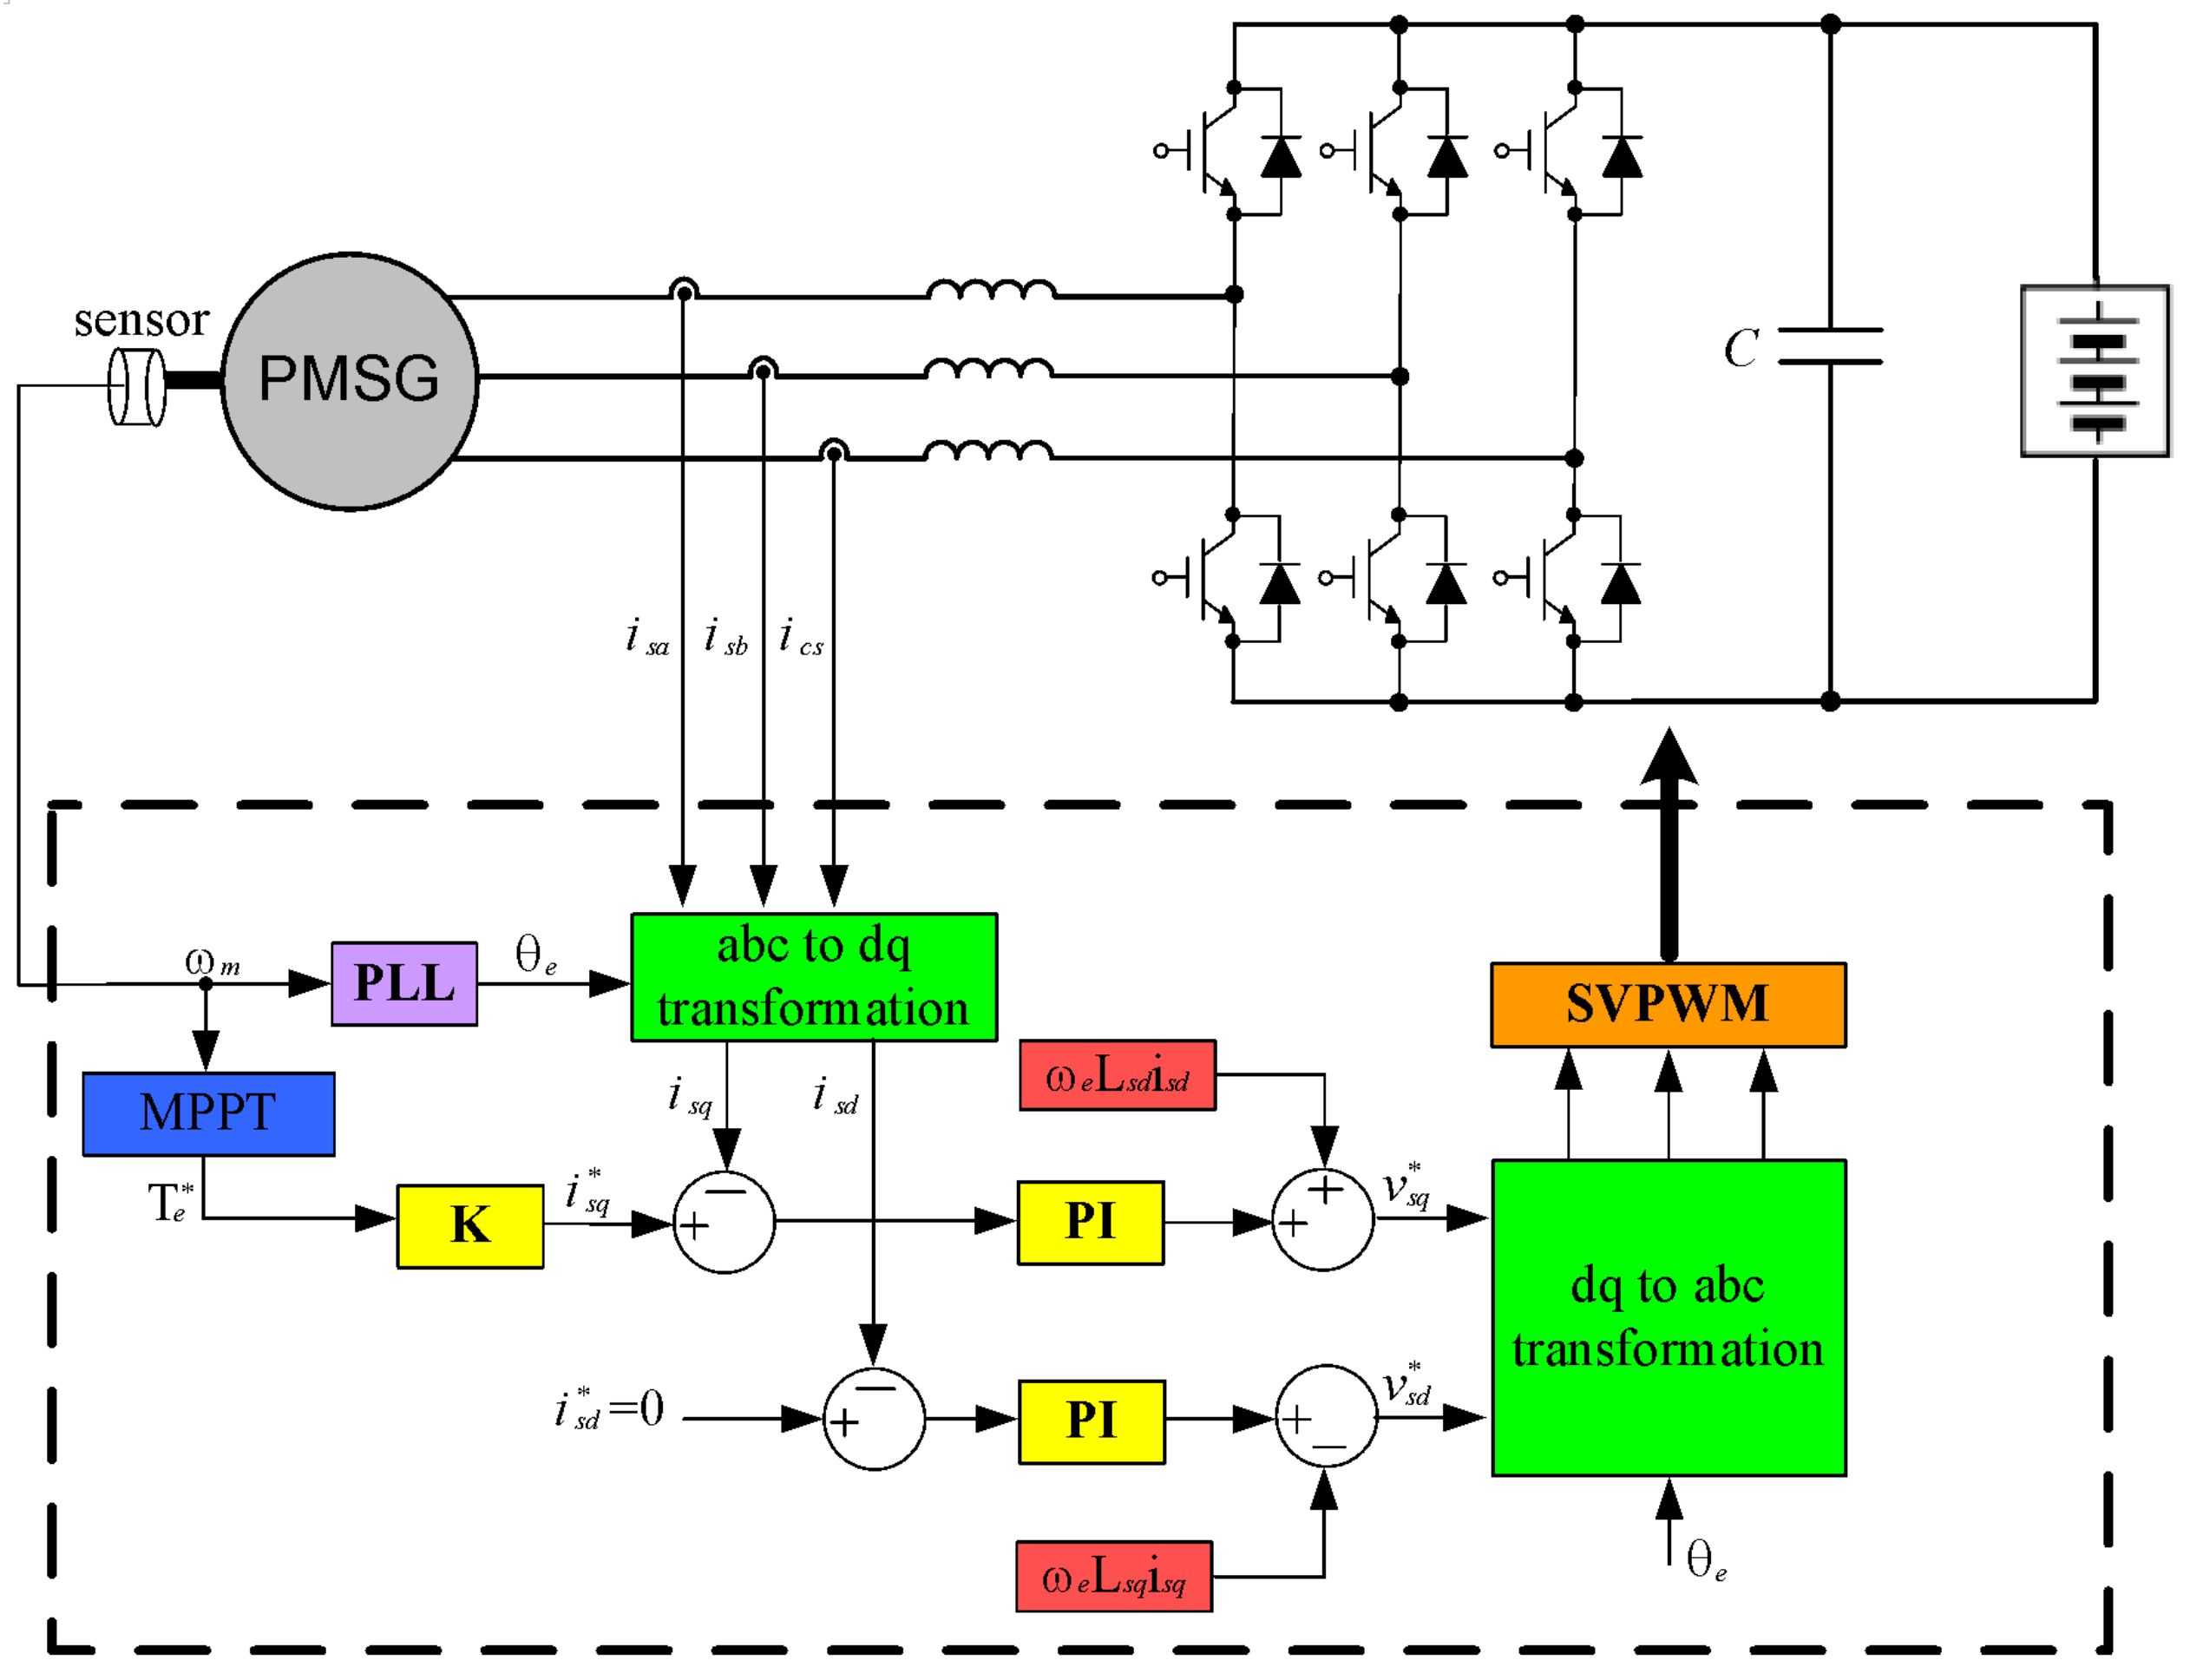
3. Power Converter Topology and Modeling

The power converter for the OWC-WEC must convert the AC power output from the generator into the AC power suitable for the grid power. To perform such a function, an AC–DC converter and a DC–AC inverter are commonly used in series to employ a back-to-back converter. The generator-side converter controls the speed and torque of the generator, and the grid-side inverter controls the system synchronization and output power factor control of the system. This study compares power performance with respect to load control on the generator side, and therefore, the analysis is focused on the generator-side converter. The topologies of the power converter for the OWC-WEC can be classified into two types as shown in Figure 3. Between these types, the generator-side converter can be divided into a topology using a diode rectifier and a DC–DC converter as shown in Figure 3a and a structure using a PWM converter as shown in Figure 3b.
The topology shown in Figure 3a is used in a small-capacity wind turbine. Because of its simple structure, control, and low cost, it is used for a small capacity with low power plants, even though its efficiency is relatively low. The AC output of the generator is converted to DC output using a diode rectifier, and a DC/DC boost converter is used to boost the voltage of the DC output. Because the diode rectifier is used, AC power is not directly controlled; however, it is passively converted to a DC output, and therefore, the input power factor decreases, thereby reducing power performance. In addition, the electric current on the generator side is not controlled directly, and therefore, the fluctuation of the angular speed of the turbine is further increased as the electric torque shown in Equation (16) is not controlled directly. This increases the fluctuation of the angular velocity as the input fluctuation of the wave energy.
As shown in Figure 4, the reference output voltage is calculated using the inductor current and the reference current output from the diode rectifier. Then, the duty ratio is generated through the PWM module. In other words, the load control performance such as generator power control and input power factor control is not good because the current converted to DC power is controlled without controlling the current of the generator for controlling the electrical torque. Using the voltage-sec equilibrium condition of the DC/DC converter, the relationship between the duty ratio and the input/output can be expressed as [32]:
V in D T = V out V in 1 D T .
V out = 1 1 D V in
The structure shown in Figure 3b is a topology used in a large-capacity wind turbine. It is used for large-capacity systems because of its complex structure and control, and its relatively expensive price but high efficiency. Unlike the topology shown in Figure 3a because the AC output of the generator is controlled directly, the input power factor is high and the amount of power generation can be increased. In addition, because the electric current on the generator side is controlled directly, the optimum electrical torque can be controlled directly, and therefore, the fluctuation of the angular speed of the turbine can be reduced.
As shown in Figure 5, a reference voltage is generated using the reference current and the generator-side current; the switch of the generator-side converter is operated using this reference voltage. Owing to the nature of wave power generation, the variation in input energy is greater than that of wind power, and therefore, if the power converter is selected according to capacity only, the amount of power generation may drop rapidly [33].
Figure 6 shows the performance of the generator load control and electric power for each topology. Because the electric torque is determined by the current on the generator side as shown in Equation (16), the load control performance shows the fluctuation of the angular speed of the turbine, as indicated in Equation (9). Because the electrical torque of the diode converter does not follow the mechanical torque accurately, the amount of electric power is lower than that of the PWM converter and the RPM fluctuation of the turbine is inferior.

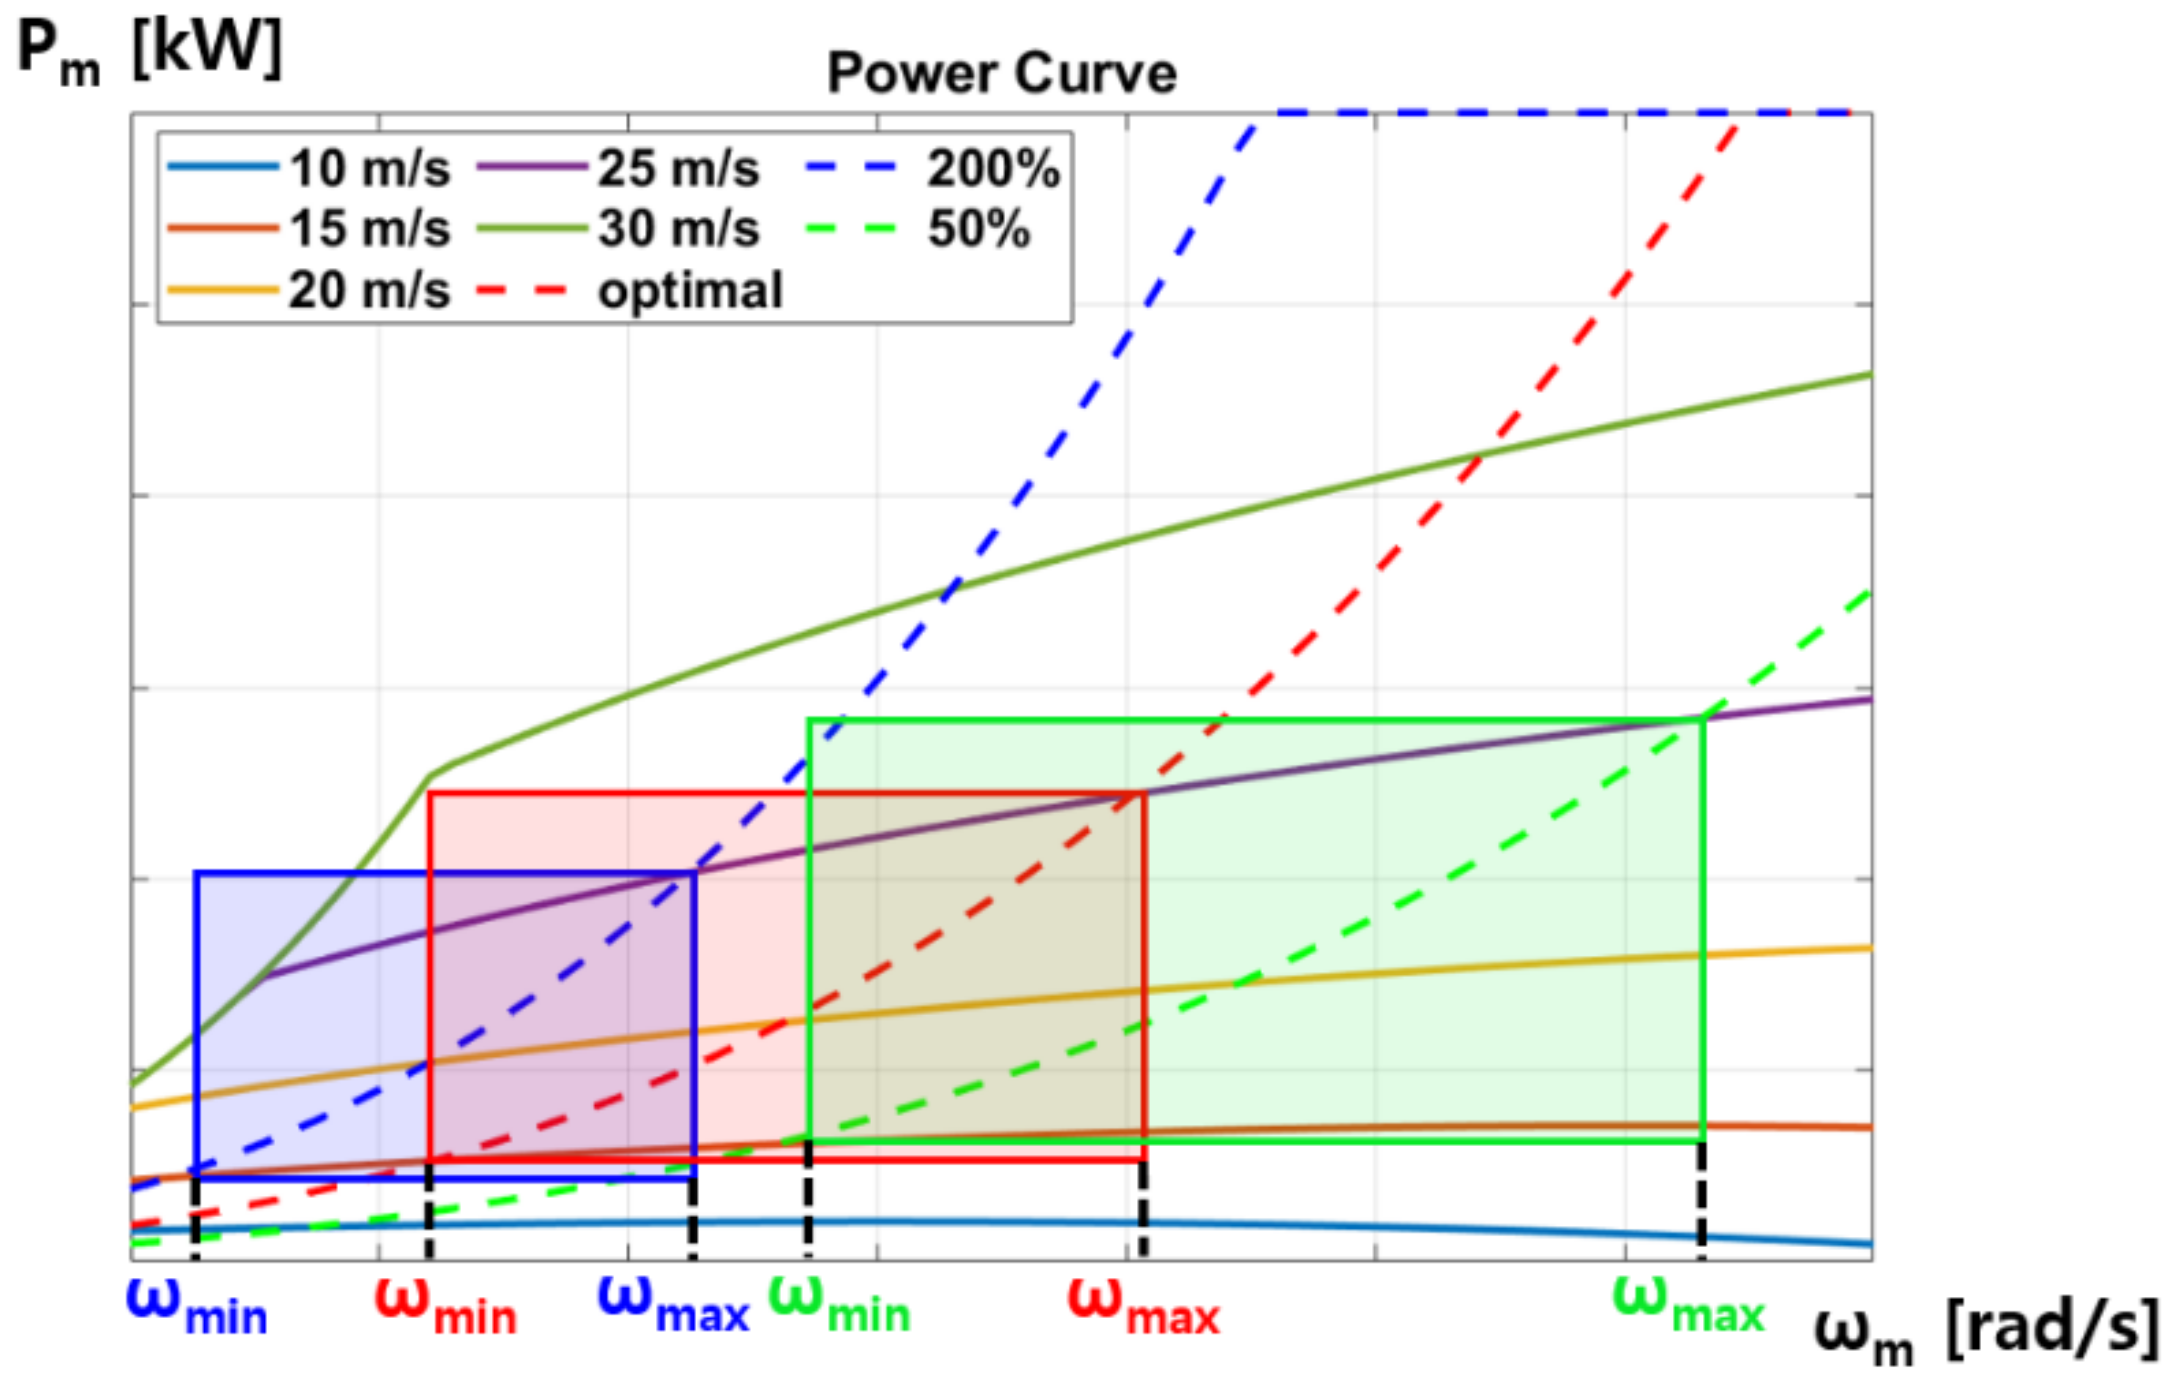
4. Maximum Power-Point Tracking Algorithm for OWC-WEC

An electric torque control algorithm of the generator is required to extract the maximum power of the OWC-WEC. As shown in Figure 7, the OWC-WEC needs control to maximize the efficiency of the turbine to recover energy at all velocities up to the rated velocity.
The OWC-WEC can perform MPPT control by adjusting the electrical torque of the generator. The efficiency of the turbine is a function of |Ø| as shown in Equation (4), and the |Ø| condition that can maximize the efficiency of the turbine can be confirmed in the turbine modeling part. That is, to maximize the efficiency of the turbine below the rated flow rate, |Ø| should be adjusted to a value close to 1. |Ø|, which affects the efficiency of the turbine, and it can be calculated as shown in Equation (5). However, because it is impossible to measure the input flow rate accurately, MPPT control cannot be performed.
When using the mechanical dynamic equation of the generator, the angular velocity fluctuates based on the mechanical torque and electrical torque, and the values of the two torques are the same under normal conditions. Thus, angular velocity must be converged to a value that satisfies the maximum recovery efficiency condition of the turbine system through electrical torque control.
First, mechanical power delivered by the turbine system can be calculated as:
P m = η T × P pne
where P pne is the amount of input pneumatic power, and it is the output power generated in the OWC chamber. The equation reflects the efficiency of the turbine system. Equation (19) is expressed as the pressure and flow rate constituting the pneumatic power by:
P m = η T × Δ p Q
Summarizing Equation (20) using Equation (1), the mechanical power can be expressed as:
P m = η T × C A × β × v x 3 × 1 + 1 2
The relationship between the mechanical power and mechanical torque using the rotational speed of the turbine is given as
T m = P m ω m = η T   ×   C A   ×   β   ×   1 + 1 2   ×   r t 3   ×   3   ×   ω m 2
Load control to obtain the maximum efficiency of the turbine can be obtained when the electrical torque is the optimum value of the mechanical torque shown in Equation (22). If the optimal value of Equation (22) is set as the load control reference value, the maximum efficiency of the turbine can be obtained as:
T e * = T m . opt = η T . max   ×   C A . opt   ×   β   ×   1 + 1 opt 2   ×   r t 3   ×   opt 3   ×   ω m 2
k opt = η T . max   ×   C A . opt   ×   β   ×   1 + 1 opt 2   ×   r t 3   ×   opt 3
Using Equations (21) and (16), the reference current value for load control of the power converter can be calculated as
i sq * = T e * 1.5 × N p Ψ pm
The MPPT curve can be found using Equation (21). When MPPT control is performed correctly, the turbine system can obtain the maximum efficiency under normal conditions [34]. In Figure 8, assuming that the current state is at the point where the maximum output extraction with a blue circle (A) is possible, the current turbine angular velocity is ωA and the extractable power obtained is PA. Then, if the flow velocity increases to 25 m/s, the angular speed of the turbine is accelerated and increased to ωB, and the transmitted power is PB. However, the point that satisfies the maximum efficiency of the turbine is the orange point (C) located in the maximum power extraction curve, where the extraction power is PC. That is, it moves to the orange point C through load control.
Although the maximum efficiency point of the turbine is not the maximum power of the turbine, the MPPT curve is controlled to the maximum efficiency point of the turbine depending on the characteristics and rated conditions of the impulse turbine. As shown in Figure 8b, the efficiency graph shows that the power of the PB is greater than that of PC; however, the efficiency is lower. Therefore, in this study, load control is applied to obtain the maximum efficiency of the turbine.
Figure 9 shows the relationship between the angular speed and the power performance based on the coefficient change of the MPPT curve for load control. It shows the change in the angular speed of the turbine and the change in power performance when the slope is increased by 200%; it is reduced to 50% compared to the load control curve that maximizes the efficiency of the turbine. This can be expressed as [20]
T e * = T 200 % = 2 k opt × ω m 2
T e * = T 50 % = 0.5 k opt × ω m 2
Assuming that the input flow velocity changes from 15 m/s to 25 m/s, increasing the slope decreases power performance. However, the amount of change in angular velocity also decreases. If you decrease the slope, it increases in terms of power performance. However, unlike the steady-state analysis, the actual wave energy fluctuates significantly, and therefore, if the angular velocity changes, load control may become difficult. Therefore, controlling the load of the OWC-WEC by reducing the variability of the angular speed rather than by increasing the instantaneous output power can be considered an approach to increase overall power performance. This was compared and analyzed by the change in the torque control coefficient using the PTO system integrated simulator.

5. Results

In the output power performance simulation of the OWC-WEC, the conditions under the rating power were considered to confirm output fluctuation. Therefore, control over the rating power was not considered. Table 1 summarizes the parameter values of the OWC type wave power generator.
The output power performance simulation of the OWC-WEC PTO system was conducted under various input conditions. To confirm the output power performance according to load control performance, an analysis according to the topology of the power converter was performed first, and then, an analysis of the MPPT algorithm was performed. The PTO system integration simulation used in this study is shown in Figure 10. Since this paper focuses on the study on the load control performance of the power converter, the characteristics of the chamber are assumed as shown in Figure 10 to obtain the same input conditions.

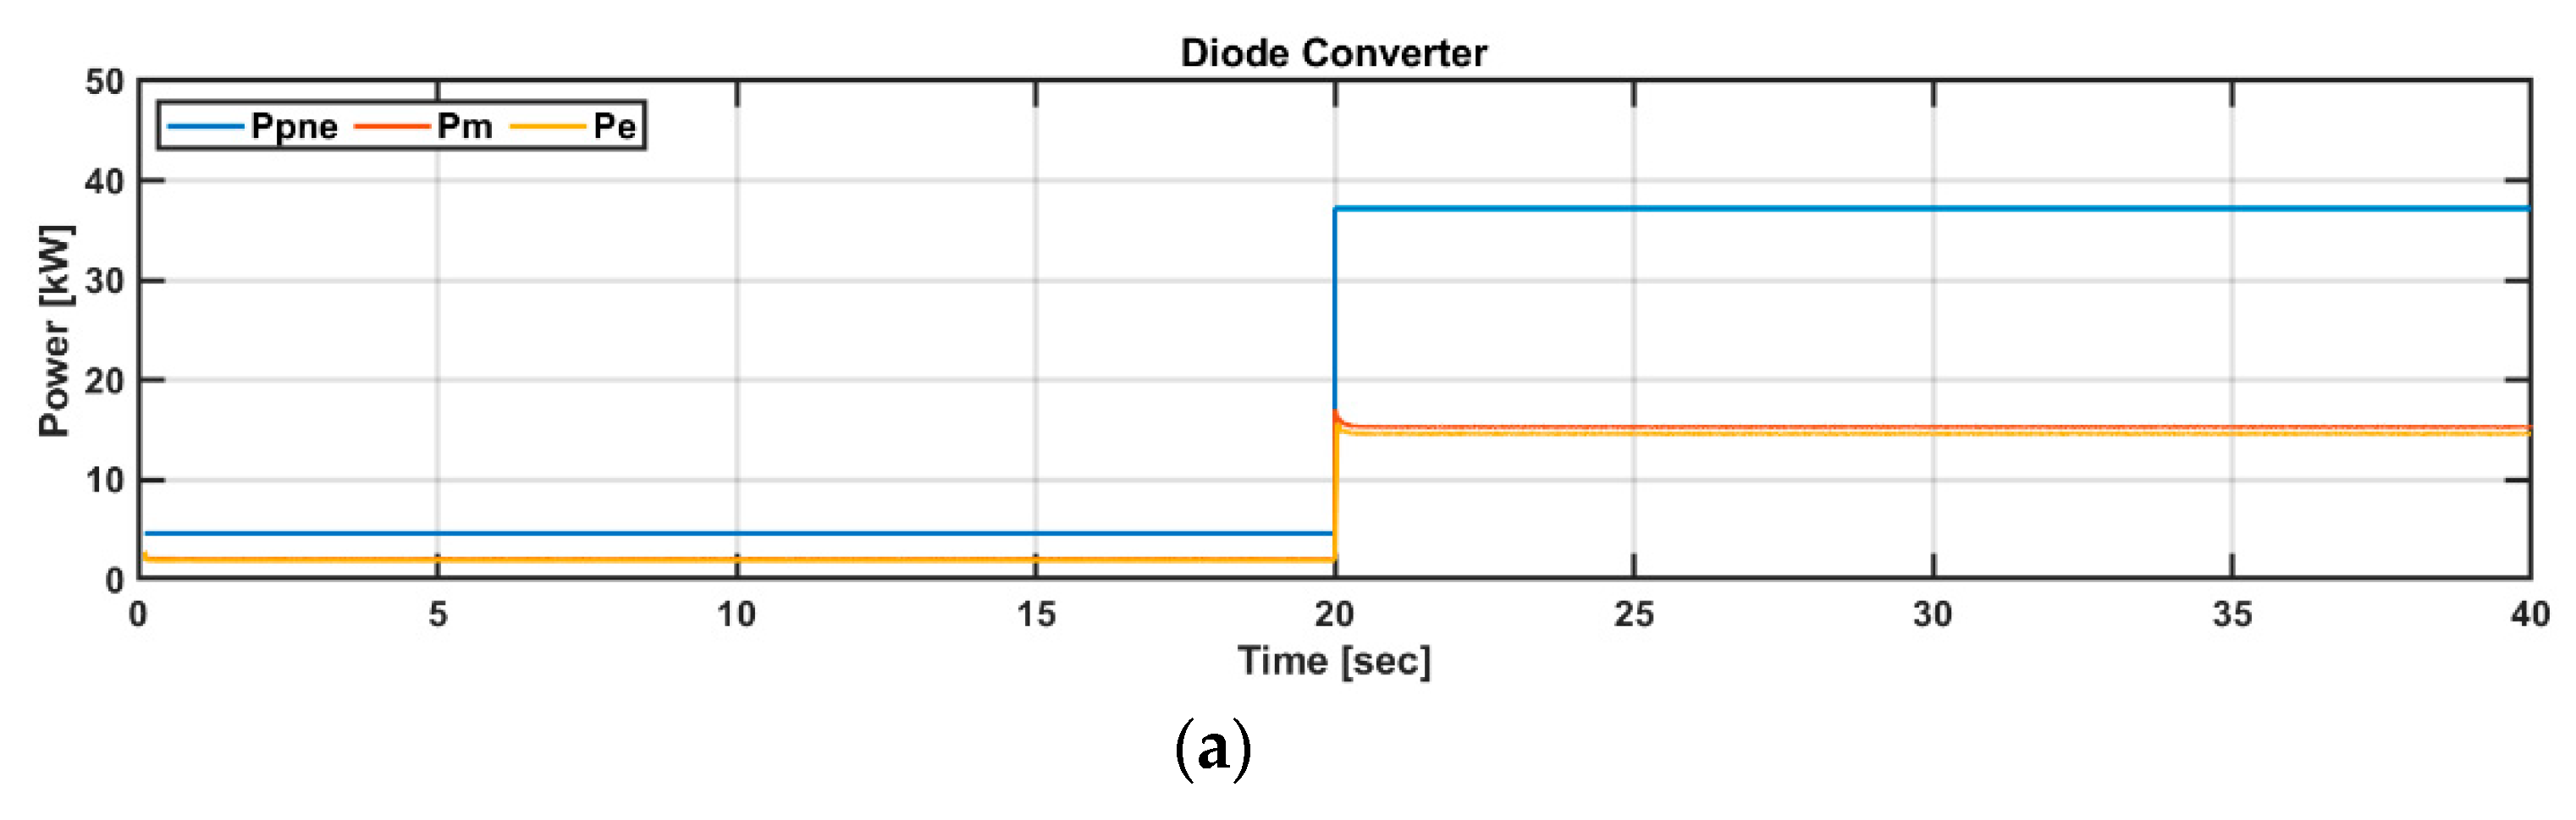
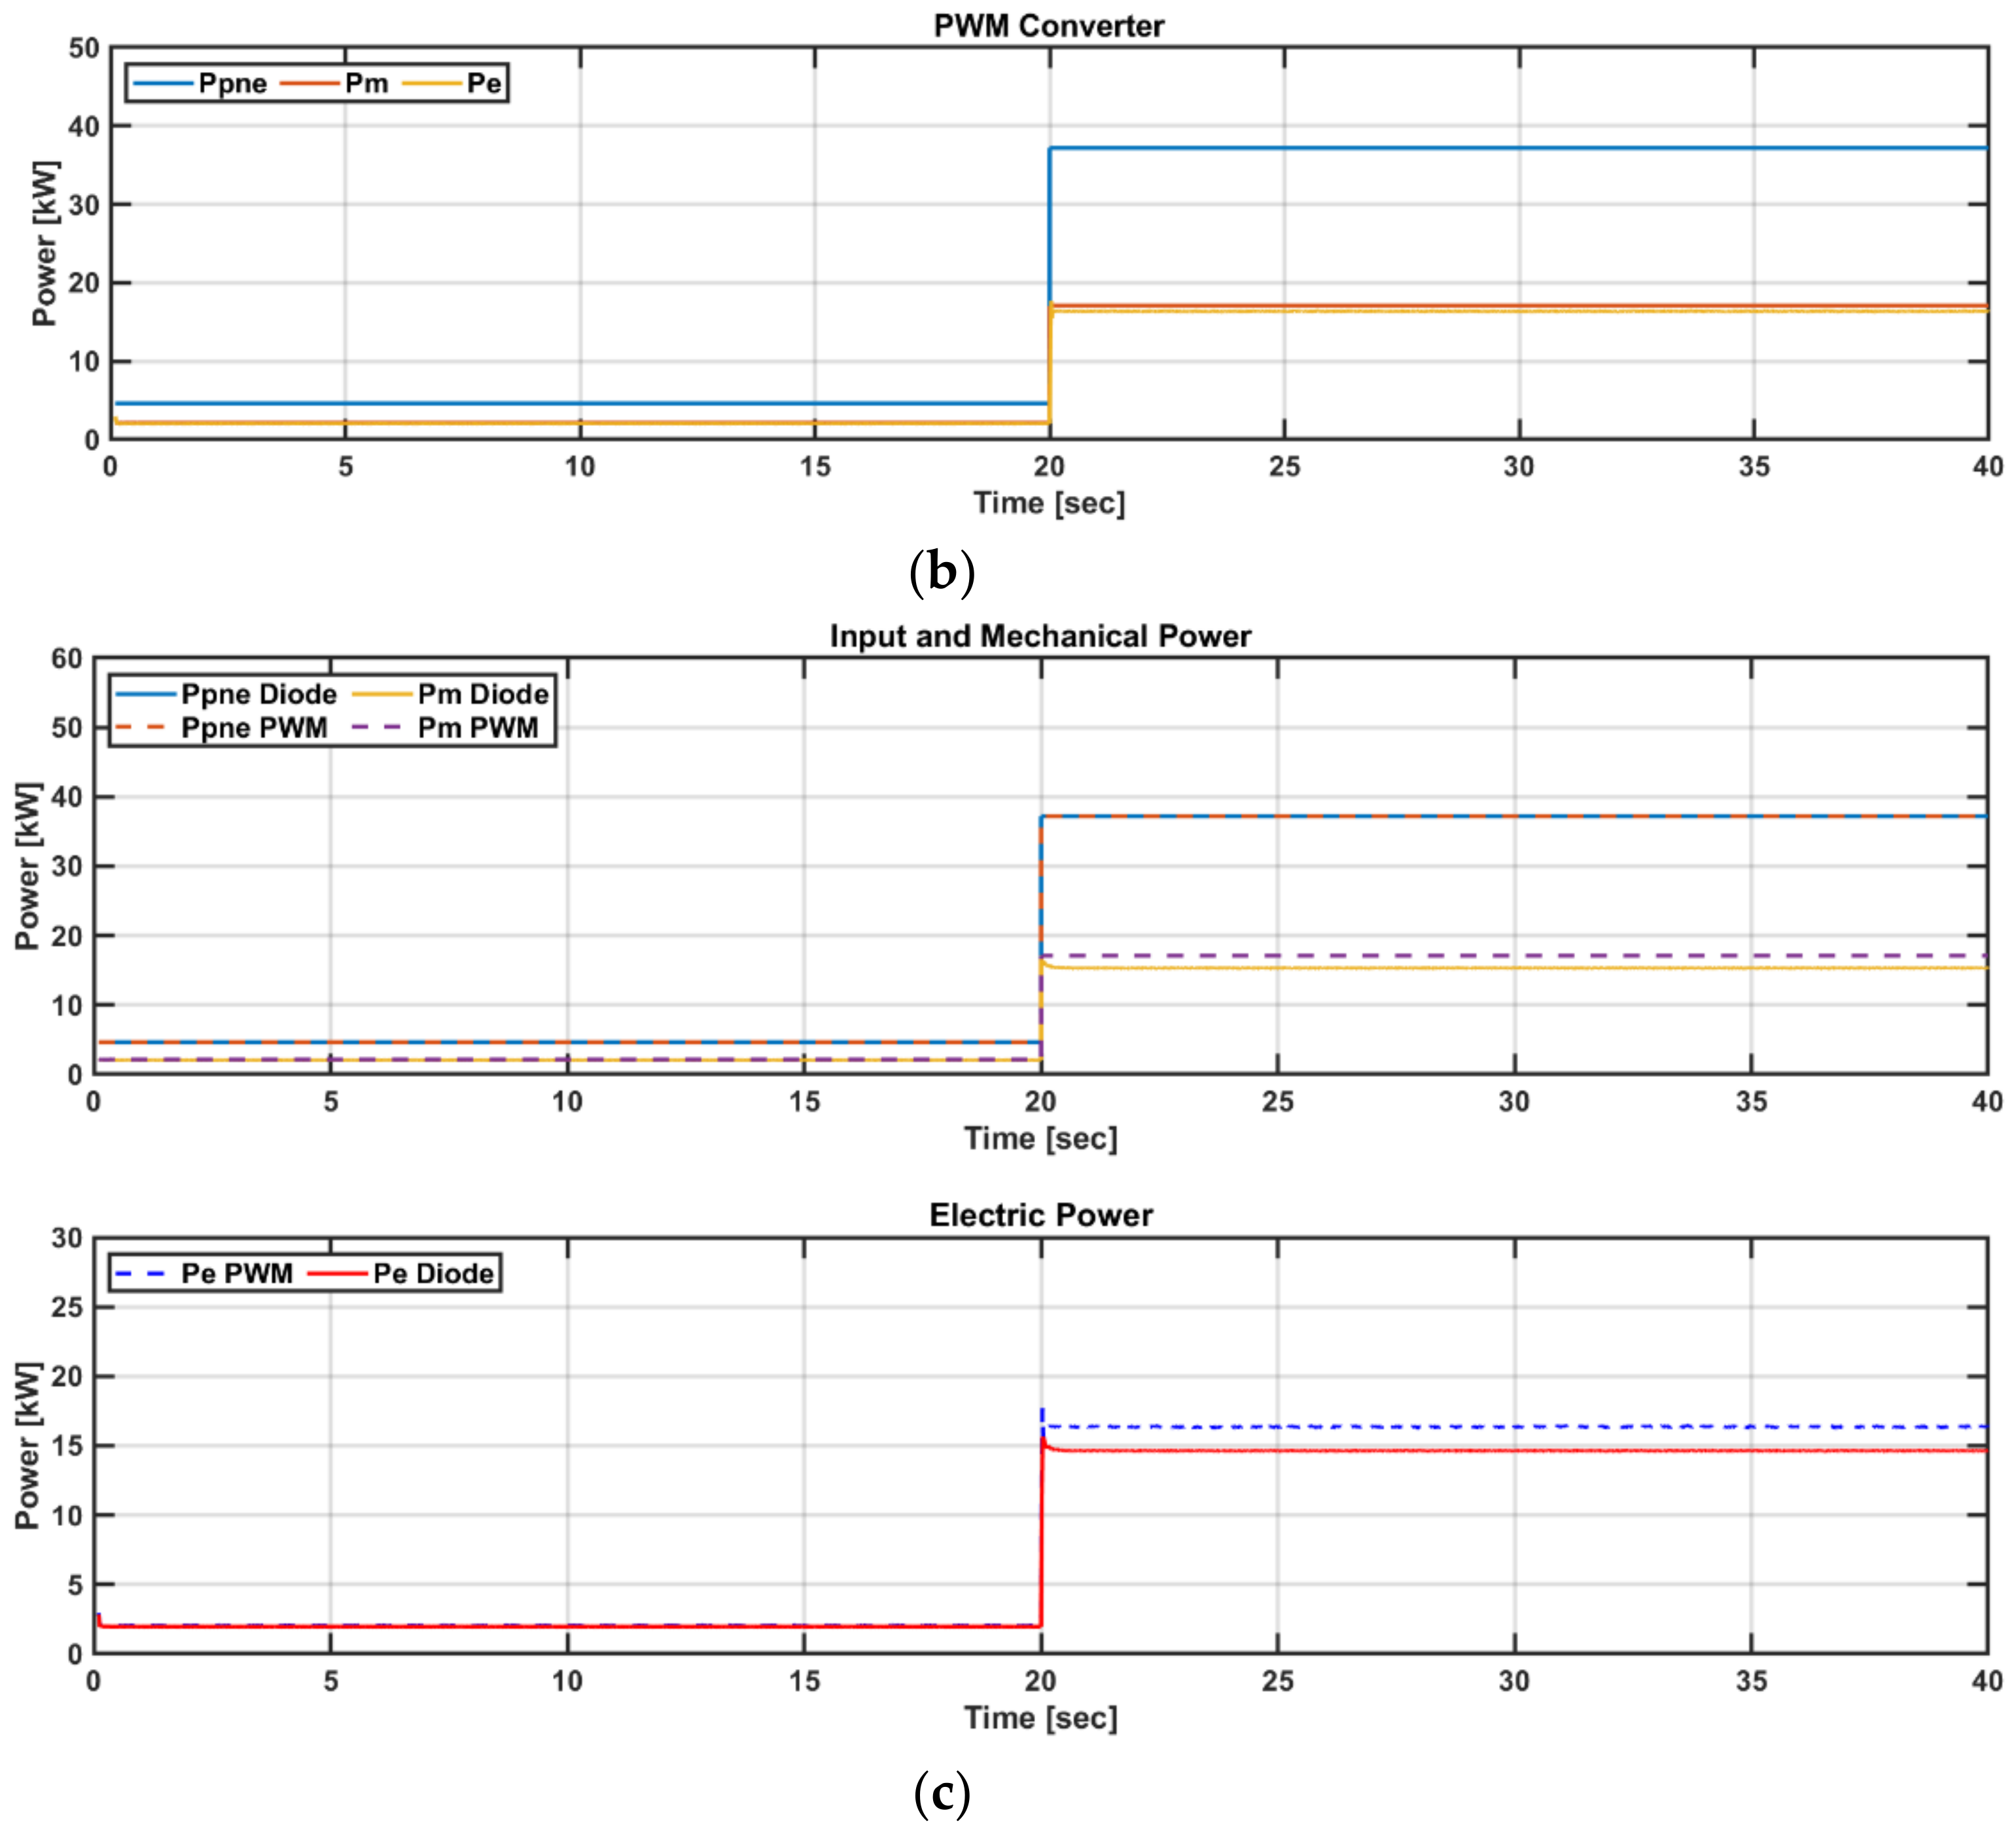
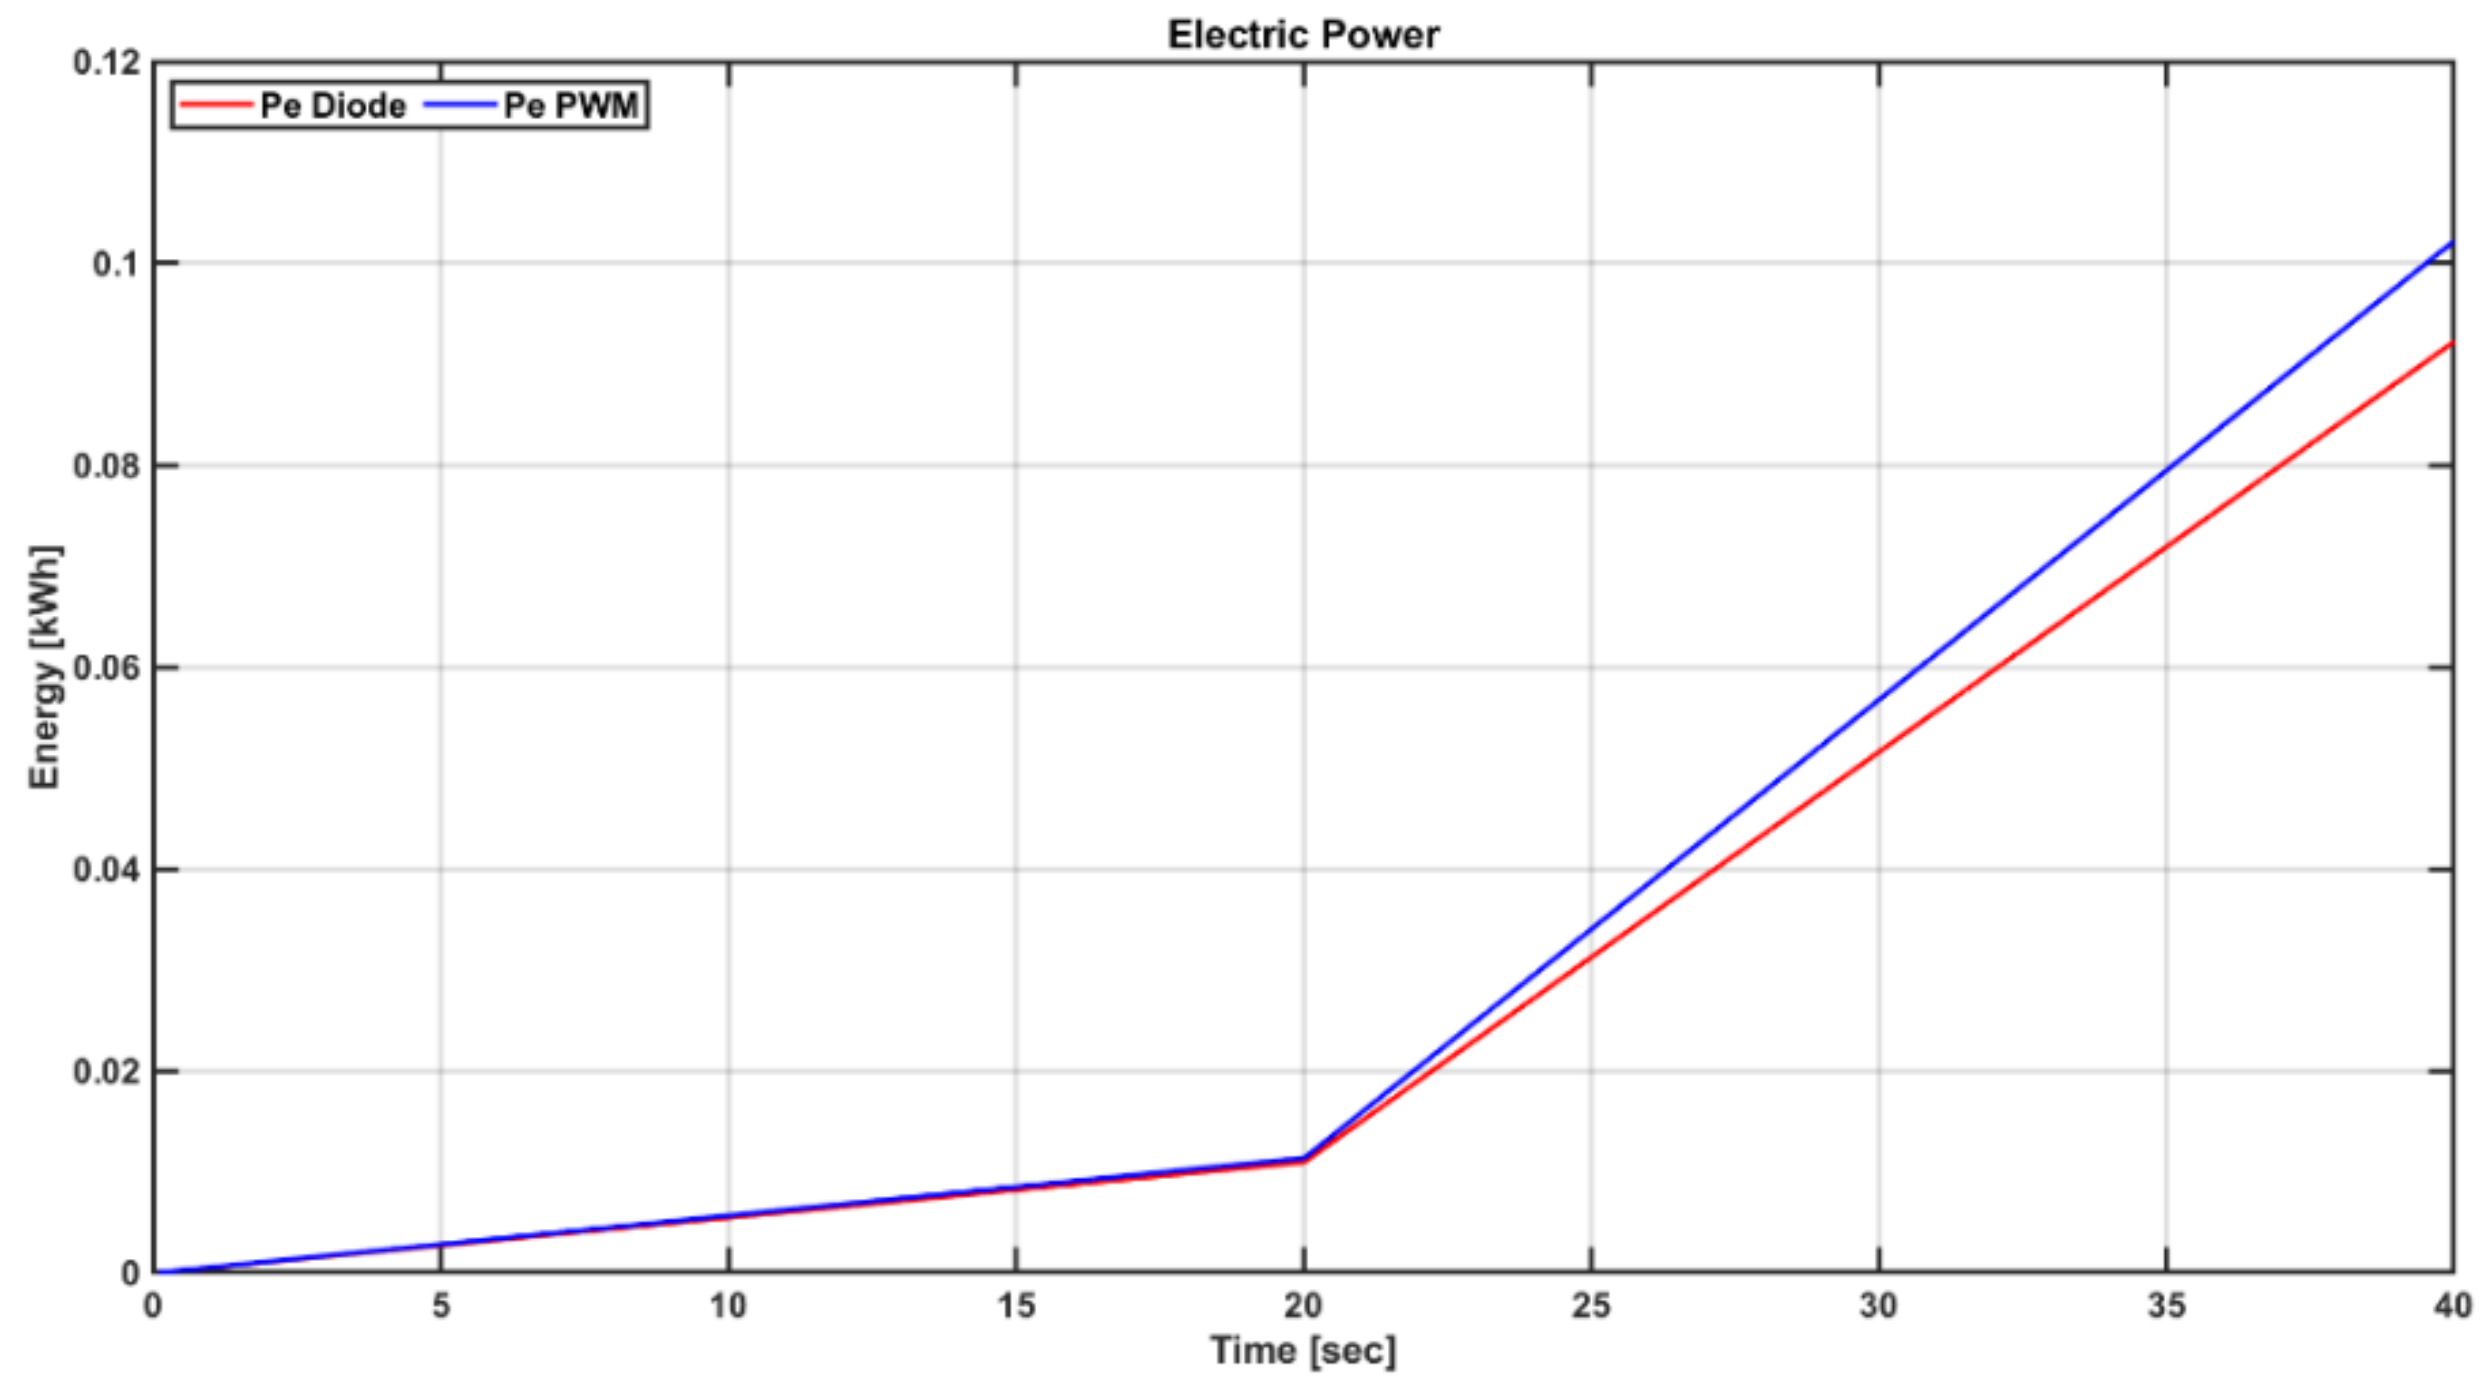
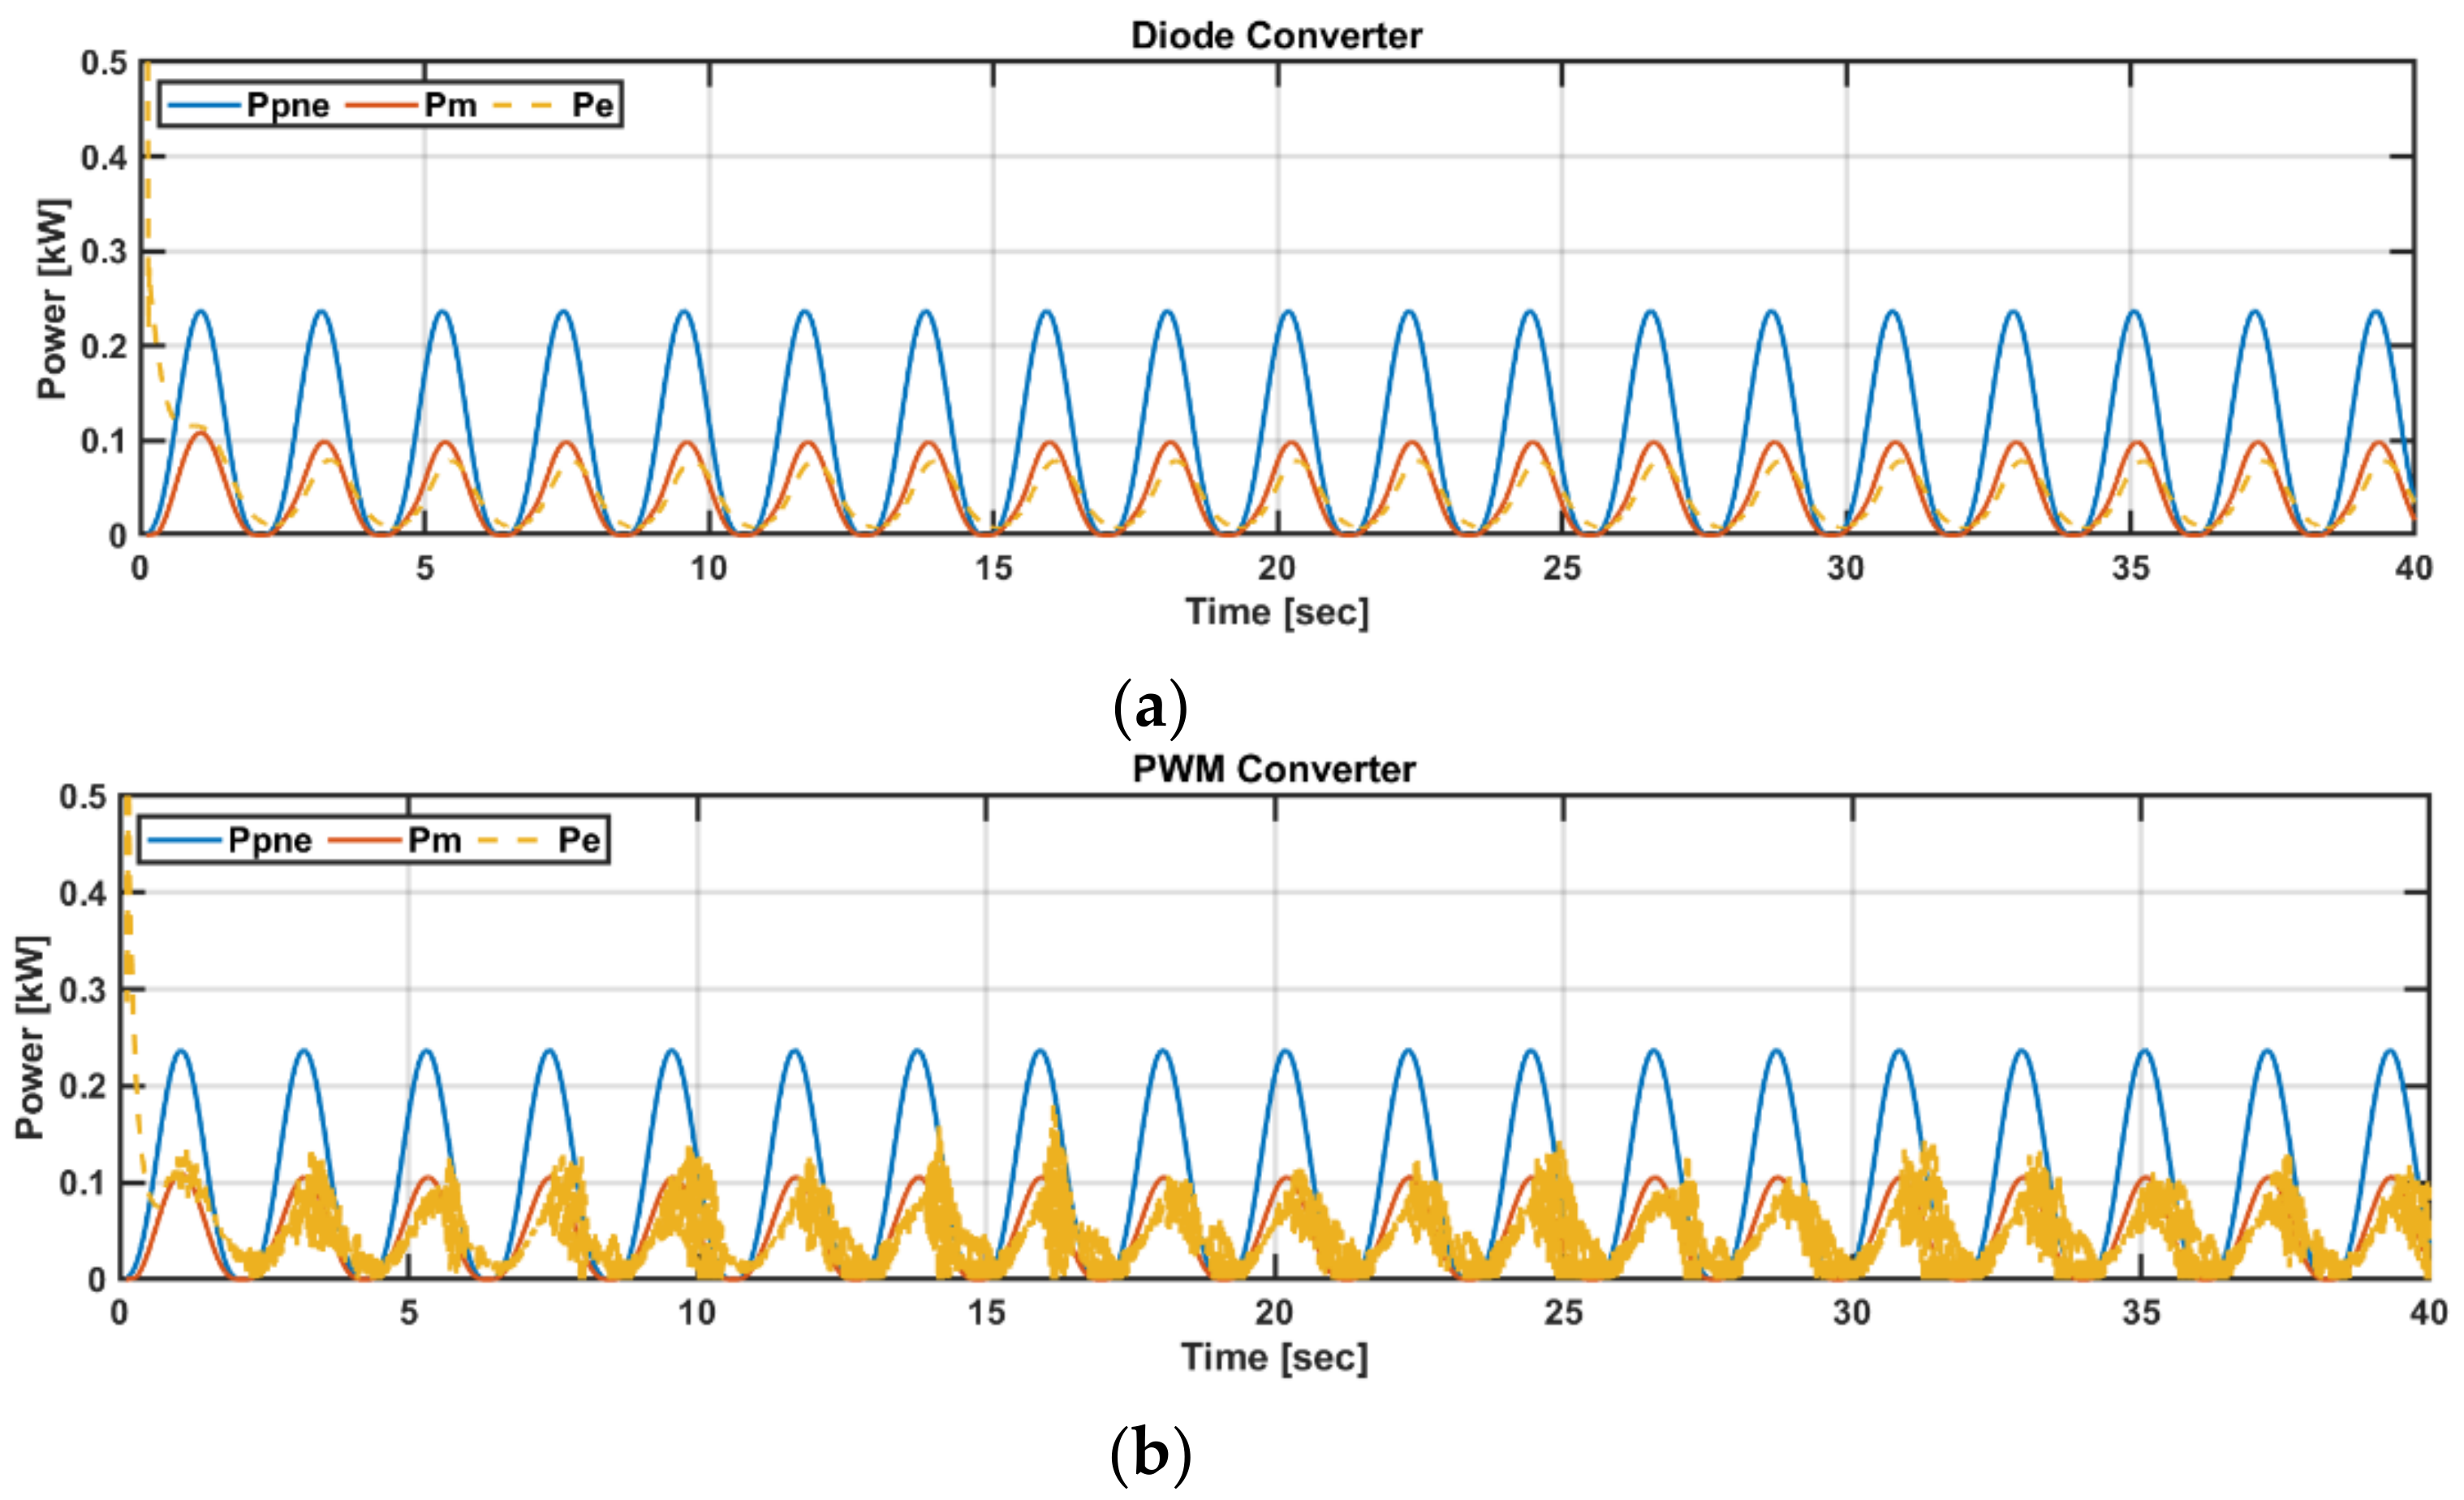
5.1. Dynamic Simulation in Steady and Transient States

Using the PTO system integrated simulation, the characteristics of each turbine system, generator, and power converter were analyzed when the input flow velocity changed from 14 m/s to 28 m/s. The angular speed of the turbine changes according to the load control performance of the power converter topology, which changes |Ø|. This causes the efficiency of the turbine system shown in Equation (3) to change, thereby causing a change in output power. In this simulation, the analyses of the steady state of each flow velocity and the rapid flow velocity change were performed; each flow velocity was constant for approximately 20 s.
Figure 11 shows the output power performance of the PTO system according to the topology of the power converter under constant input flow rate conditions. Figure 11a,b confirm that the input powers are the same. However, the mechanical power of the turbine and electrical power change according to the load control of each topology. Figure 11c indicates that the diode converter has lower mechanical and electrical power generation than the that of the PWM converter. Although there is no significant difference in efficiency between that of the generator and the power converter, and the amount of power is small because the performance of controlling the angular speed of the turbine according to the load control of the diode converter is relatively poor. This can be confirmed by the turbine performance graph shown in Figure 12.
Figure 12 shows the turbine performance of the PTO system according to the power converter topology at a constant input flow velocity. |Ø| can be calculated as a ratio according to the input flow velocity and angular velocity of the turbine. Thus, the angular speed control of the turbine according to the load control affects the performance of the turbine. Figure 12 indicates that the PWM converter can be controlled to operate at the highest efficiency (|Ø| = 1) of the turbine regardless of the flow velocity. This means that the turbine can achieve an efficiency of 46%, which is the highest efficiency in all sections.
However, it was confirmed that the diode converter had different load control performances depending on the flow rate. This changes |Ø|, which affects turbine efficiency, according to the flow velocity. Therefore, the diode converter has low efficiency at a high flow velocity; the diode converter is increased from rpm to obtain the optimum efficiency.
Figure 13 shows the output energy comparison of the PTO system in the integrated simulation at a constant input flow rate from 14 m/s to 28 m/s. The input energy is 20.96 kWh, the output power of the diode converter is 8.32 kWh, and the PWM converter is 9.22 kWh if the energy is continuously supplied. That is, the efficiency of the PTO system according to the power converter topology control is 36.9% and 43.9%, respectively. Thus, at the same constant input flow rate, the PWM converter can obtain approximately 9% higher power generation.

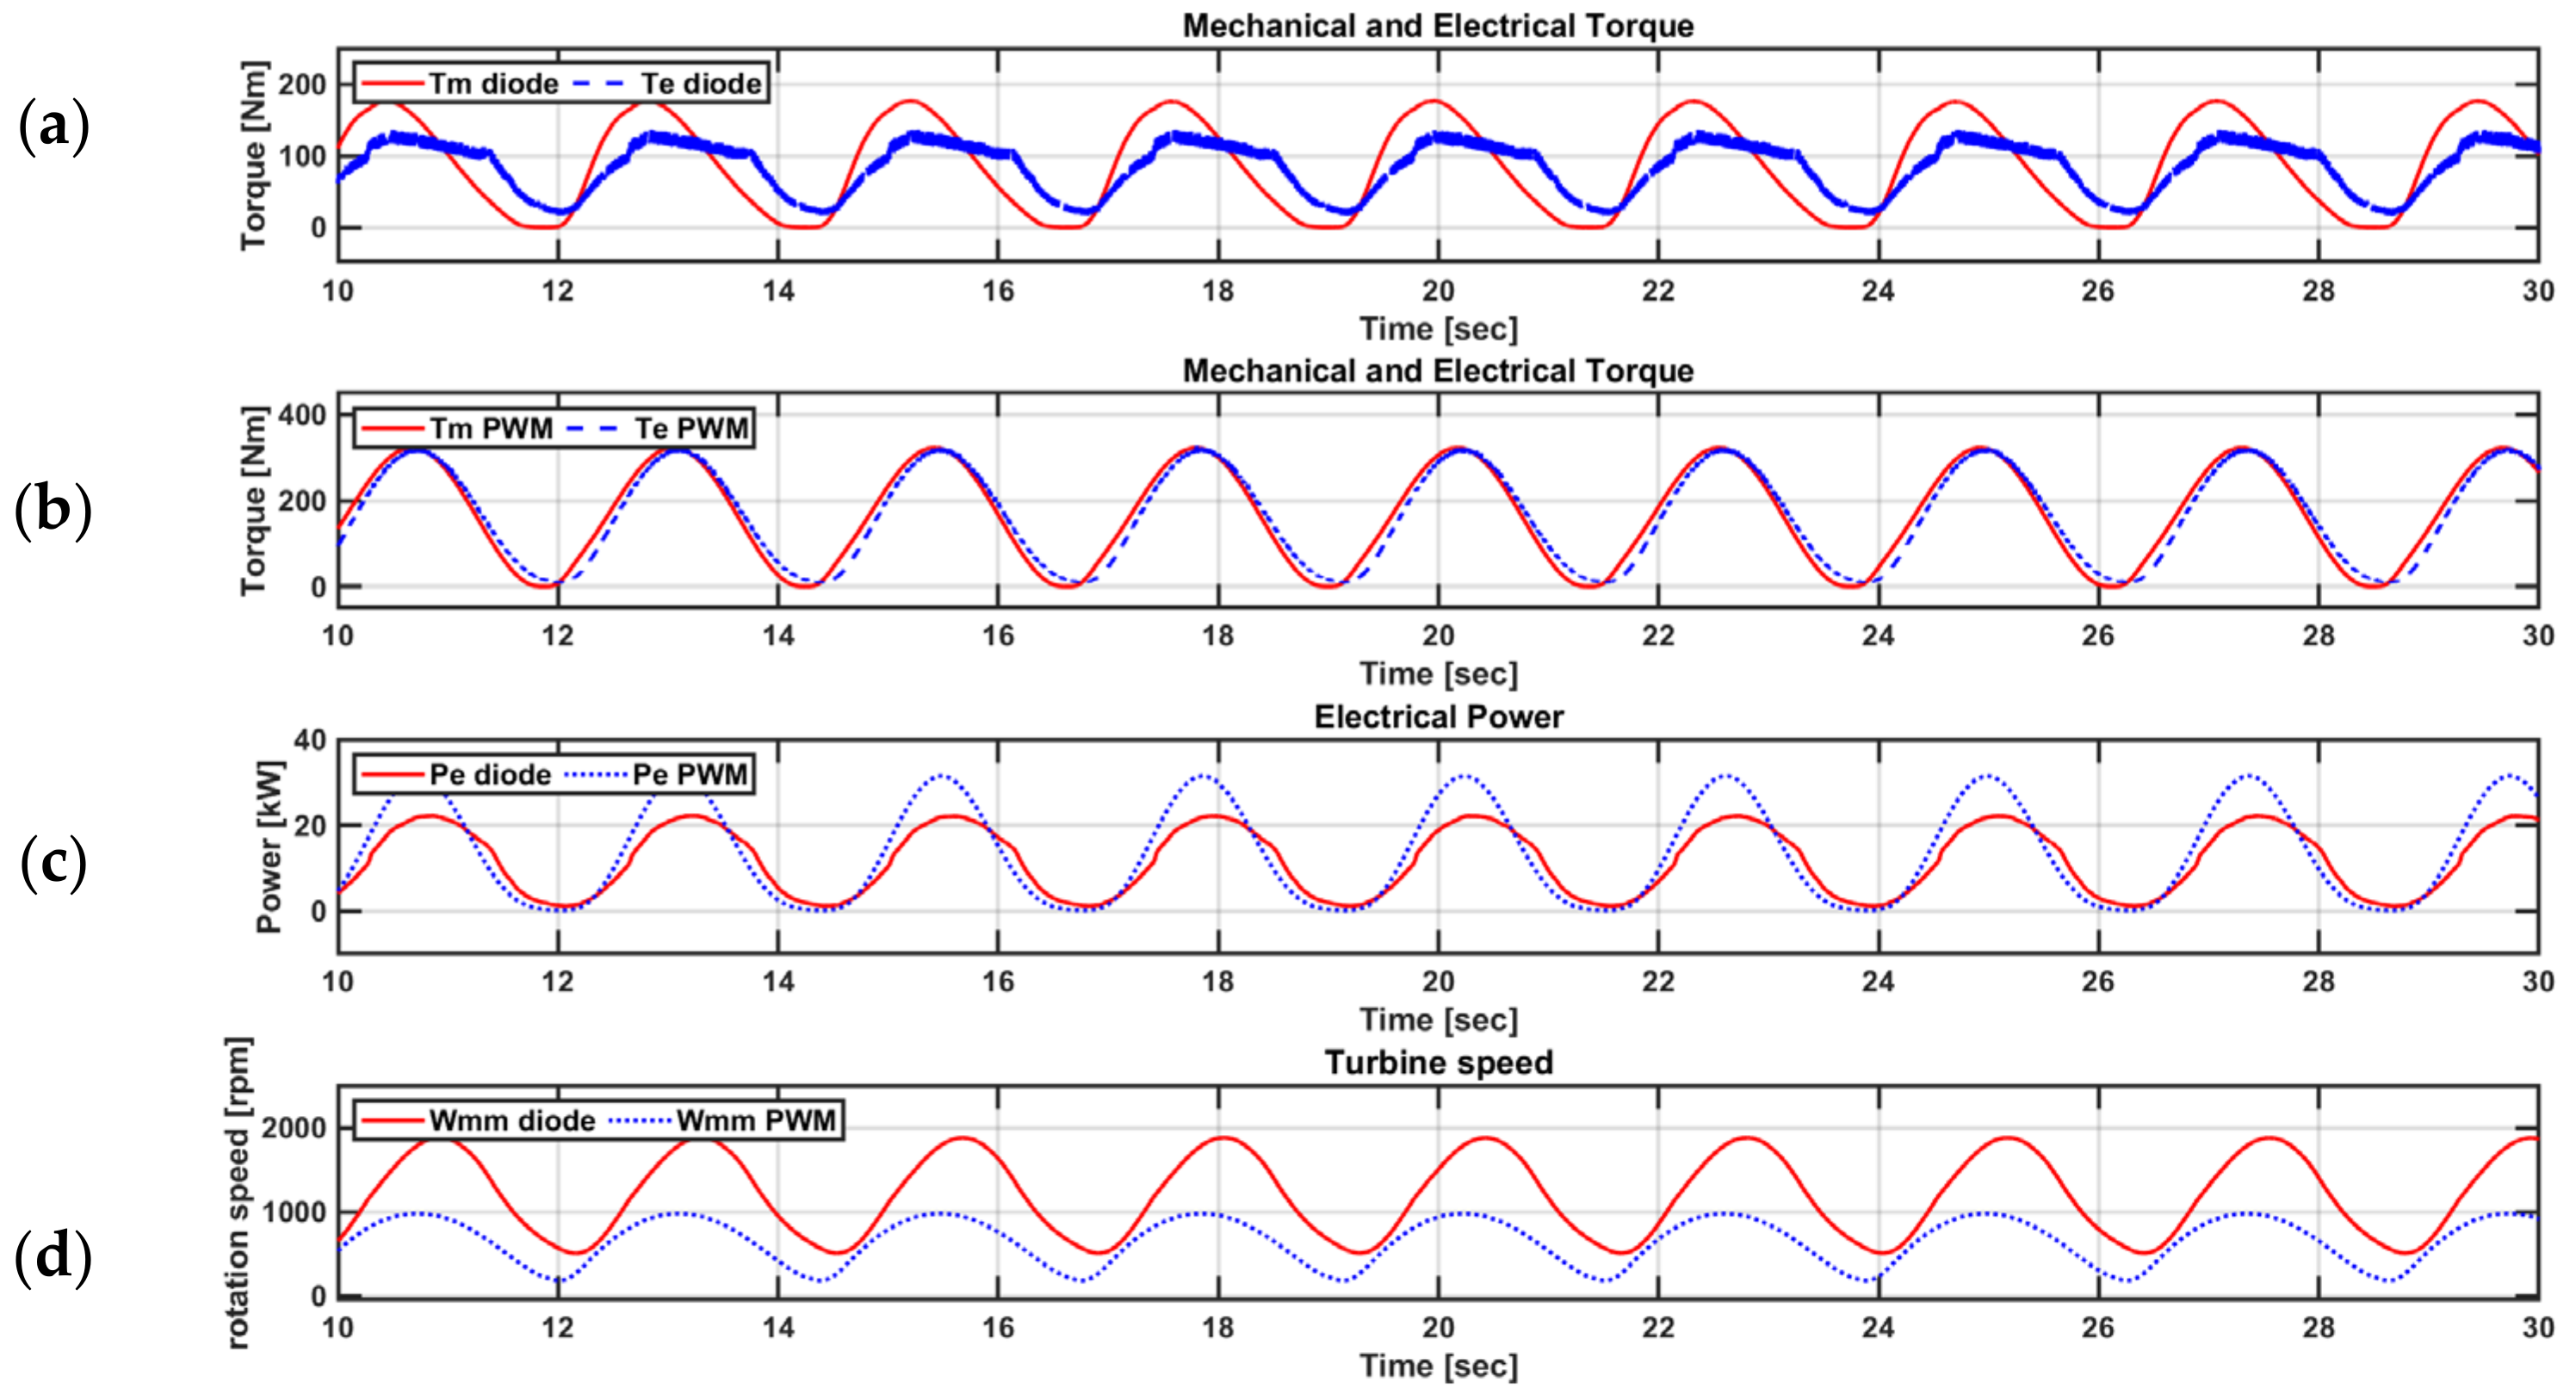
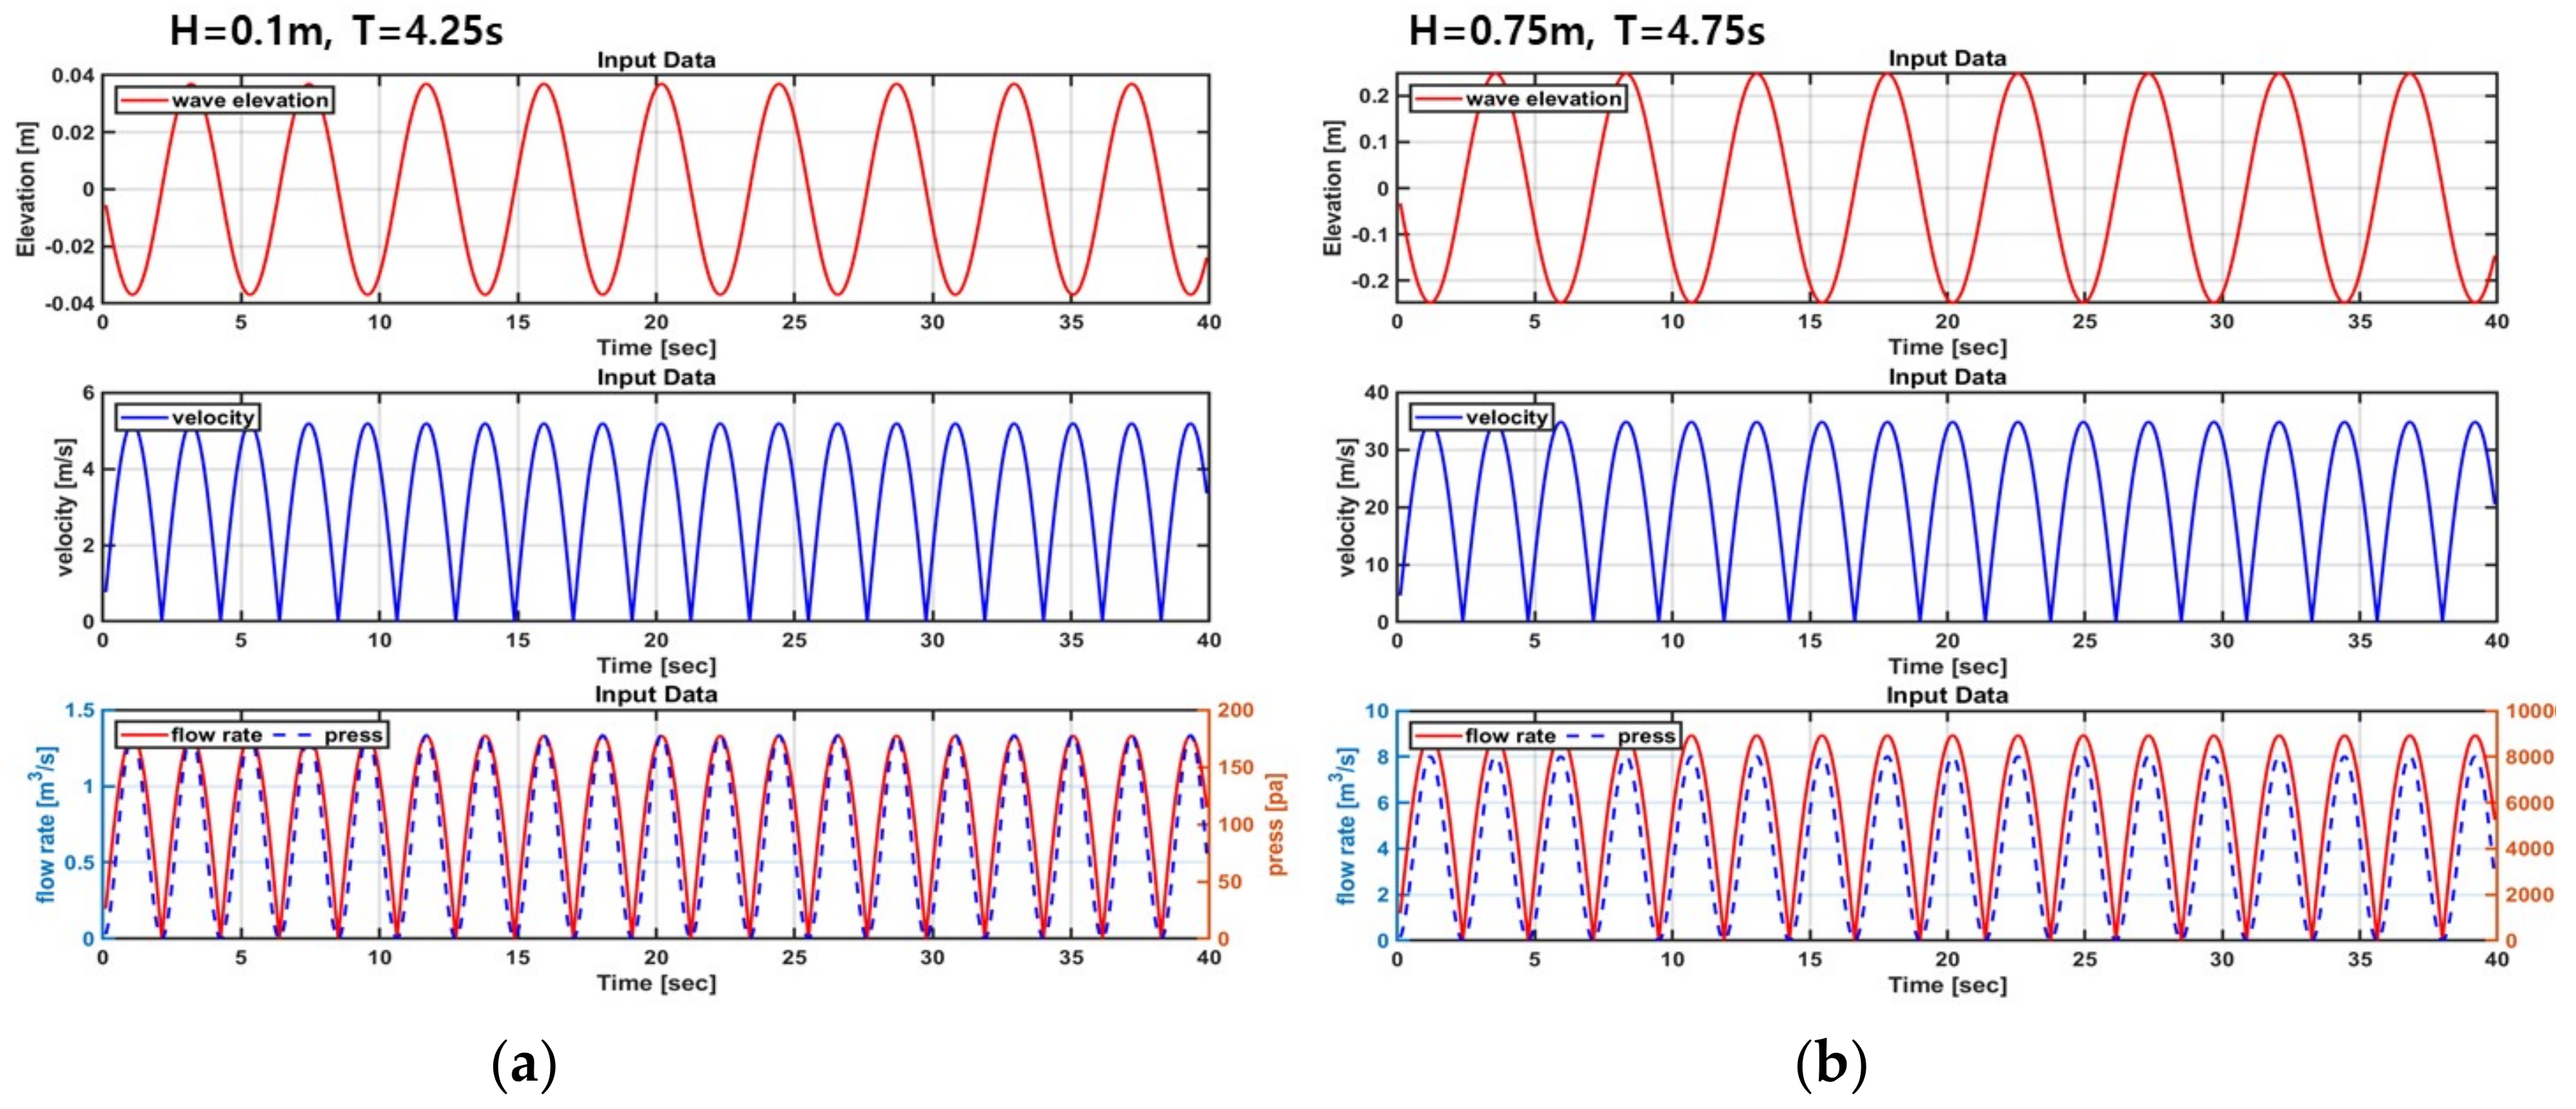
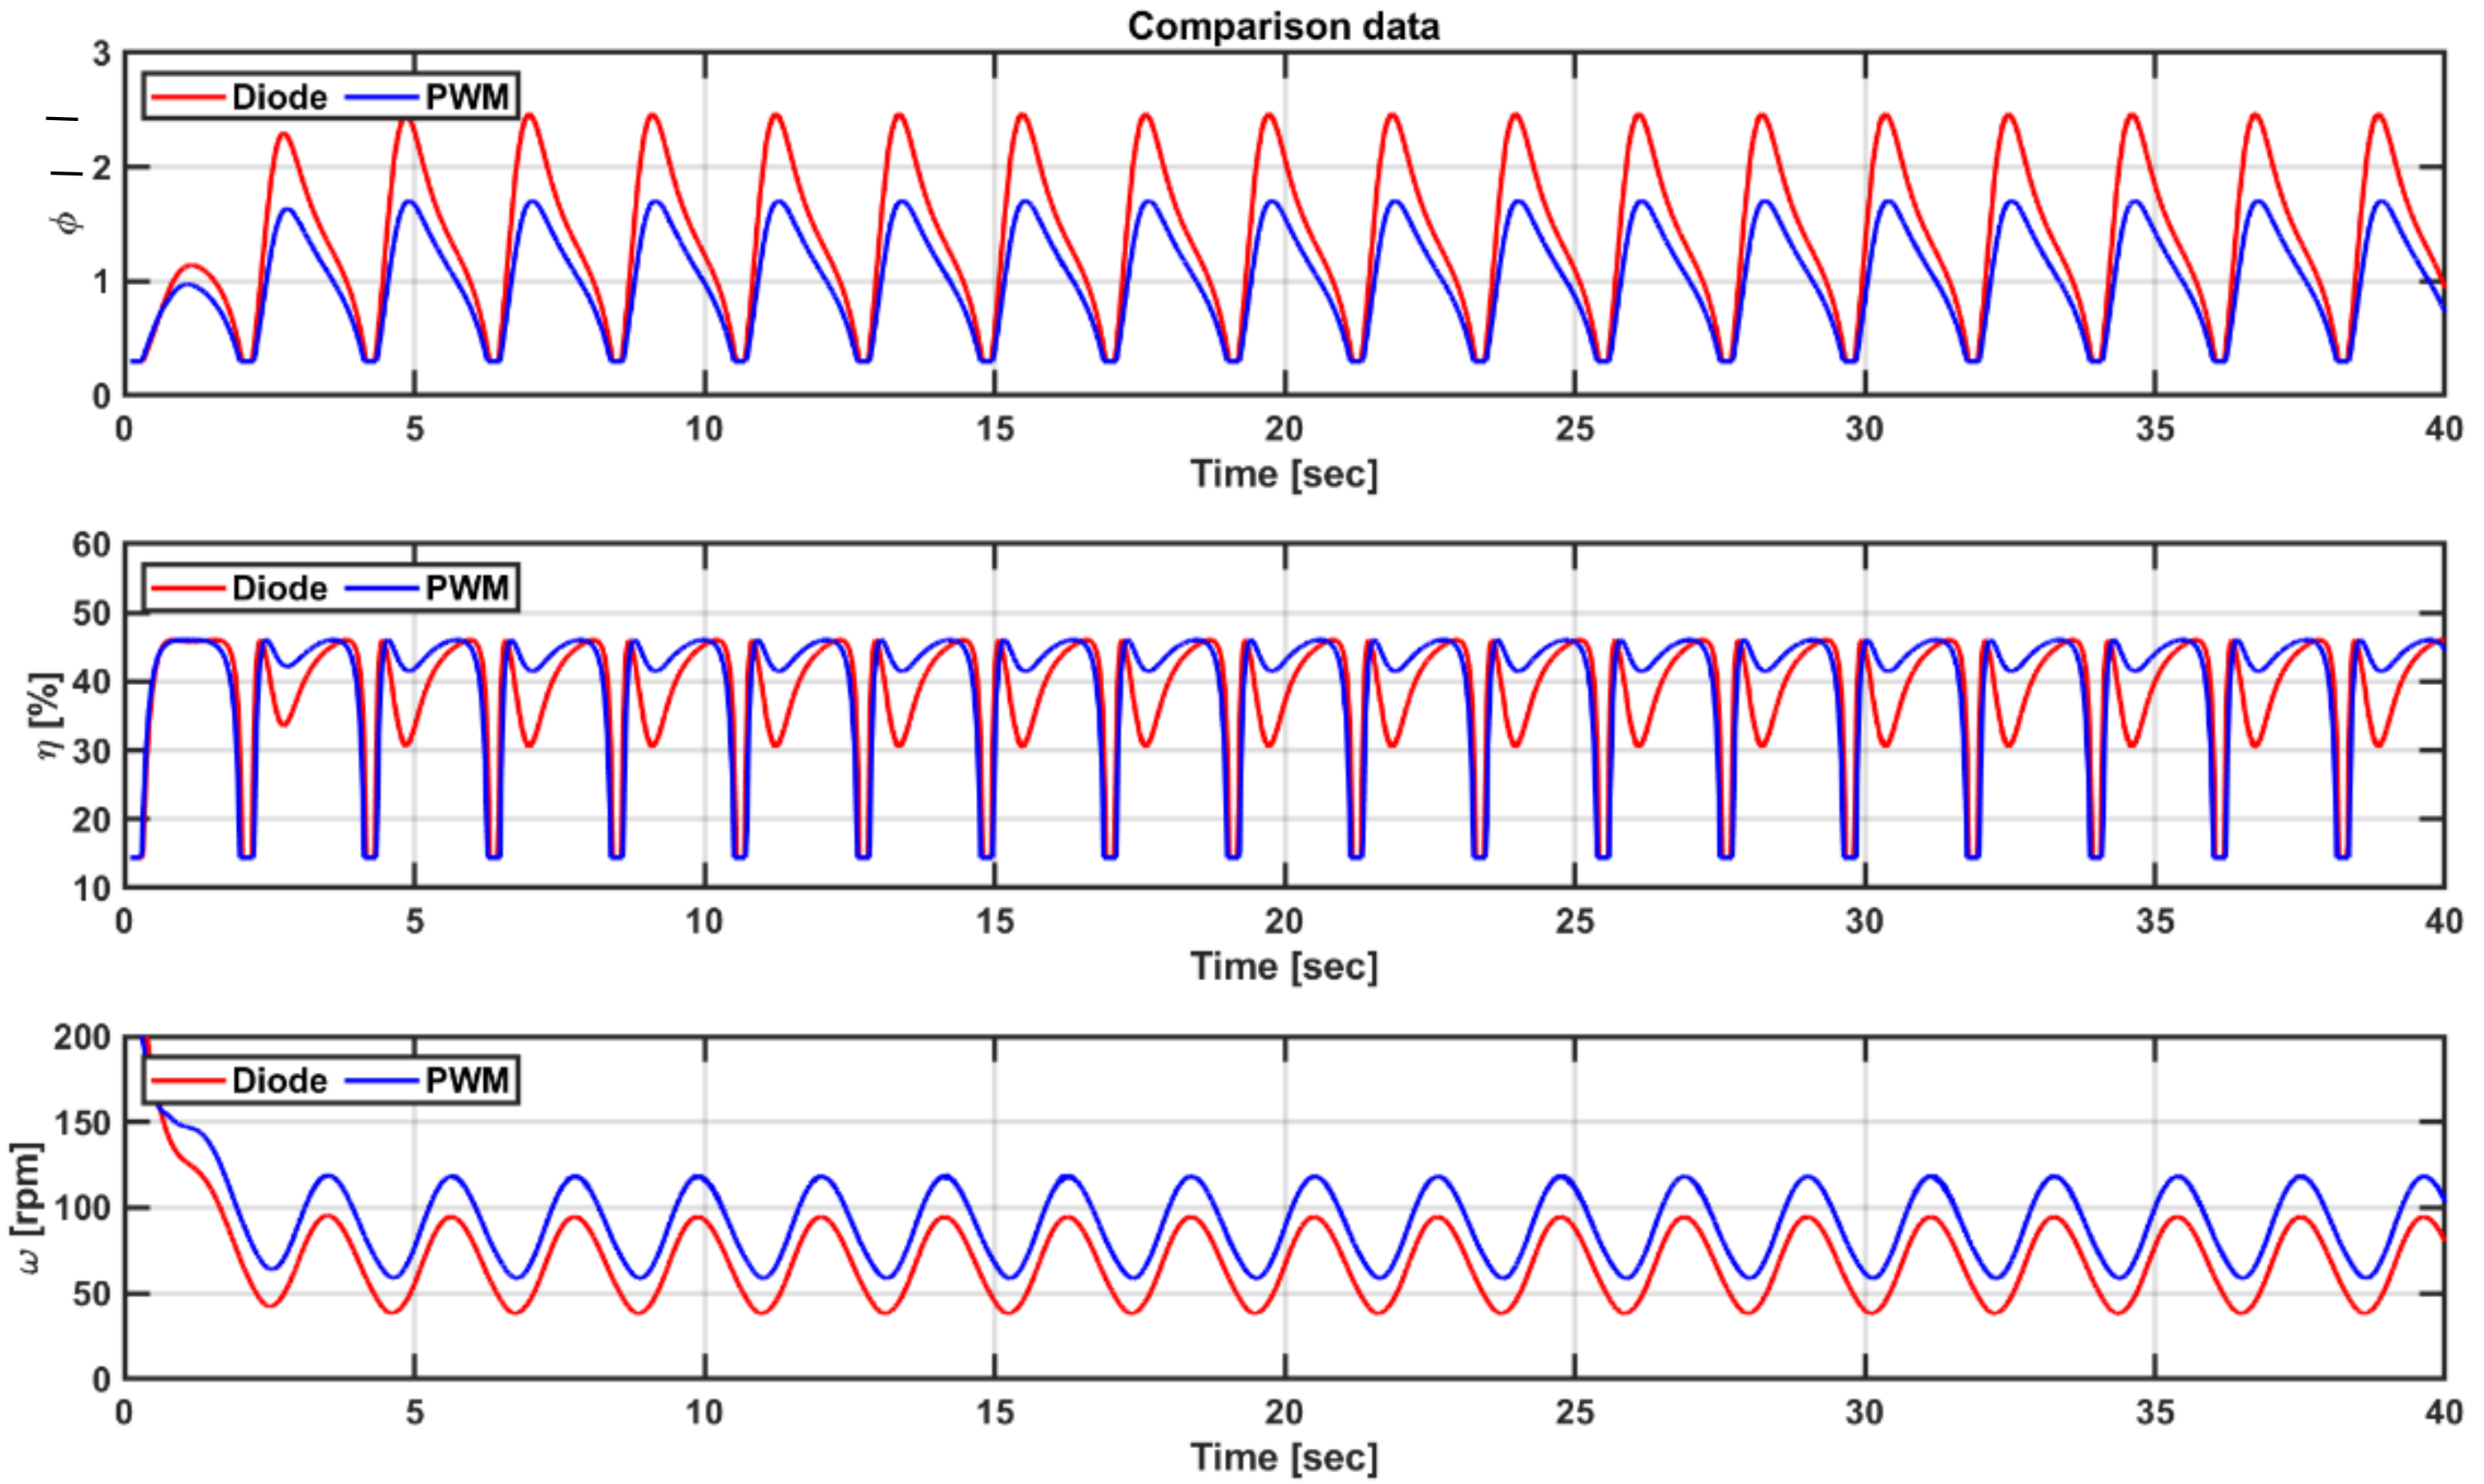
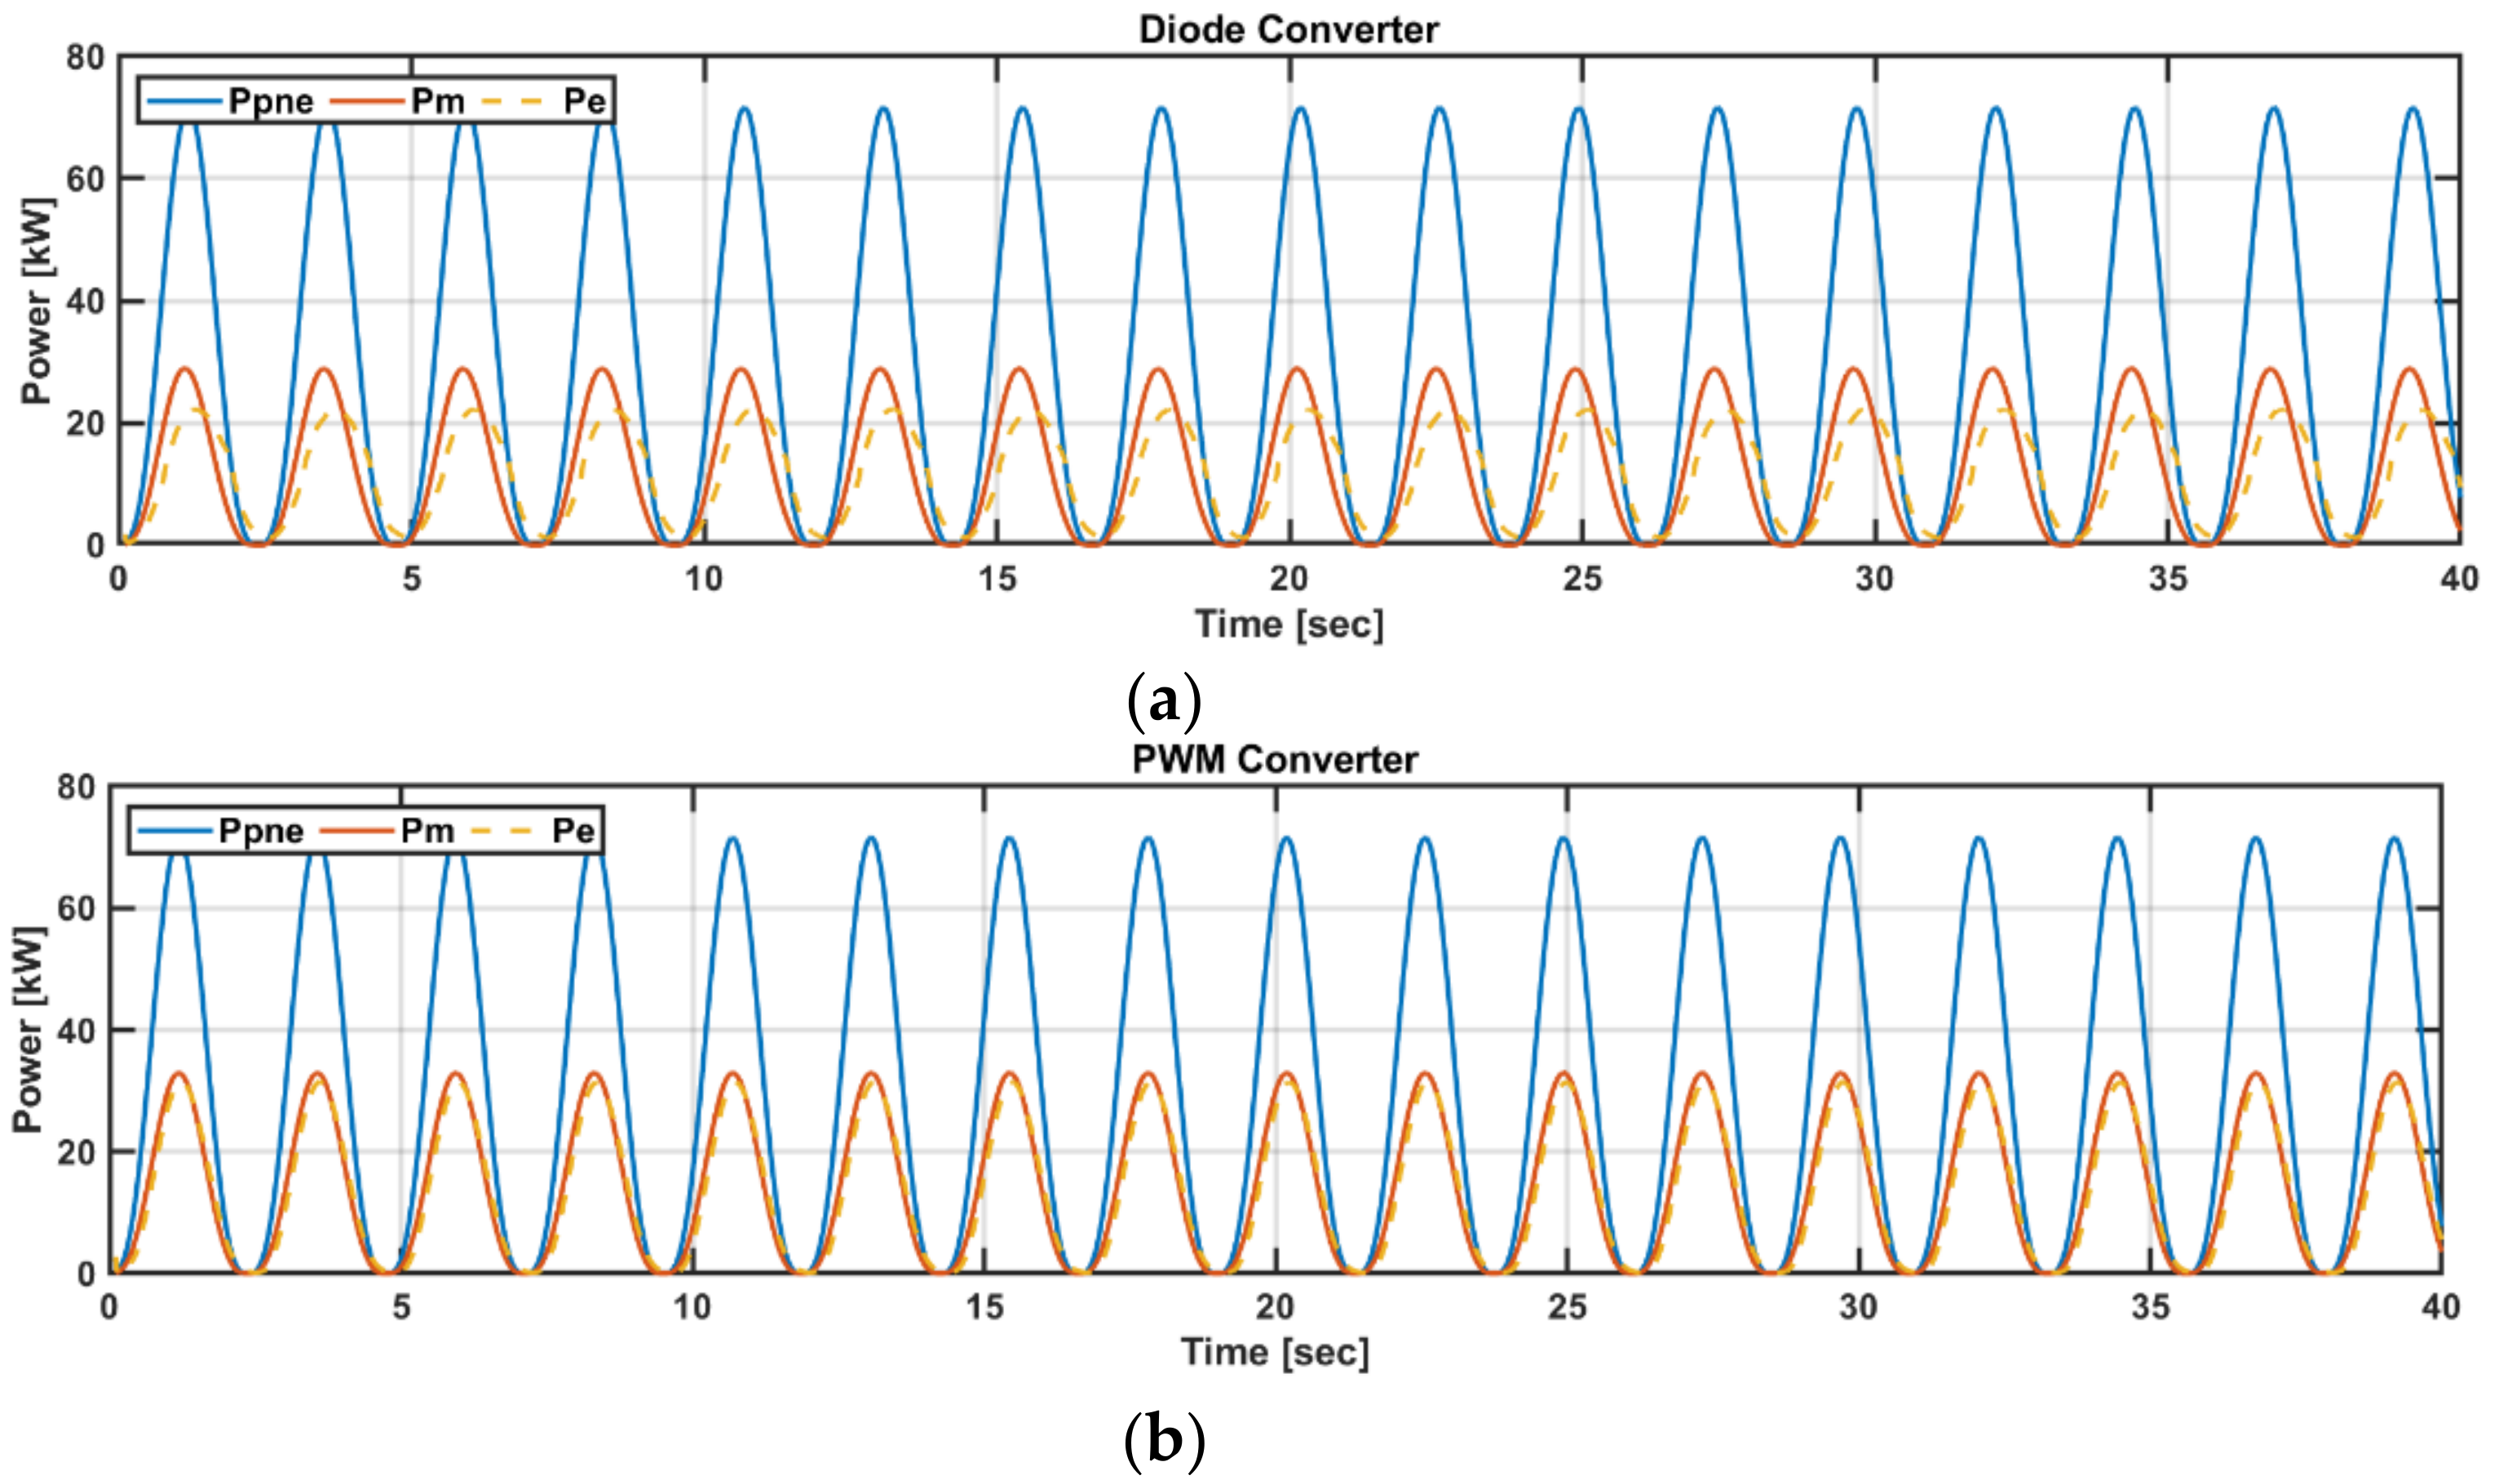
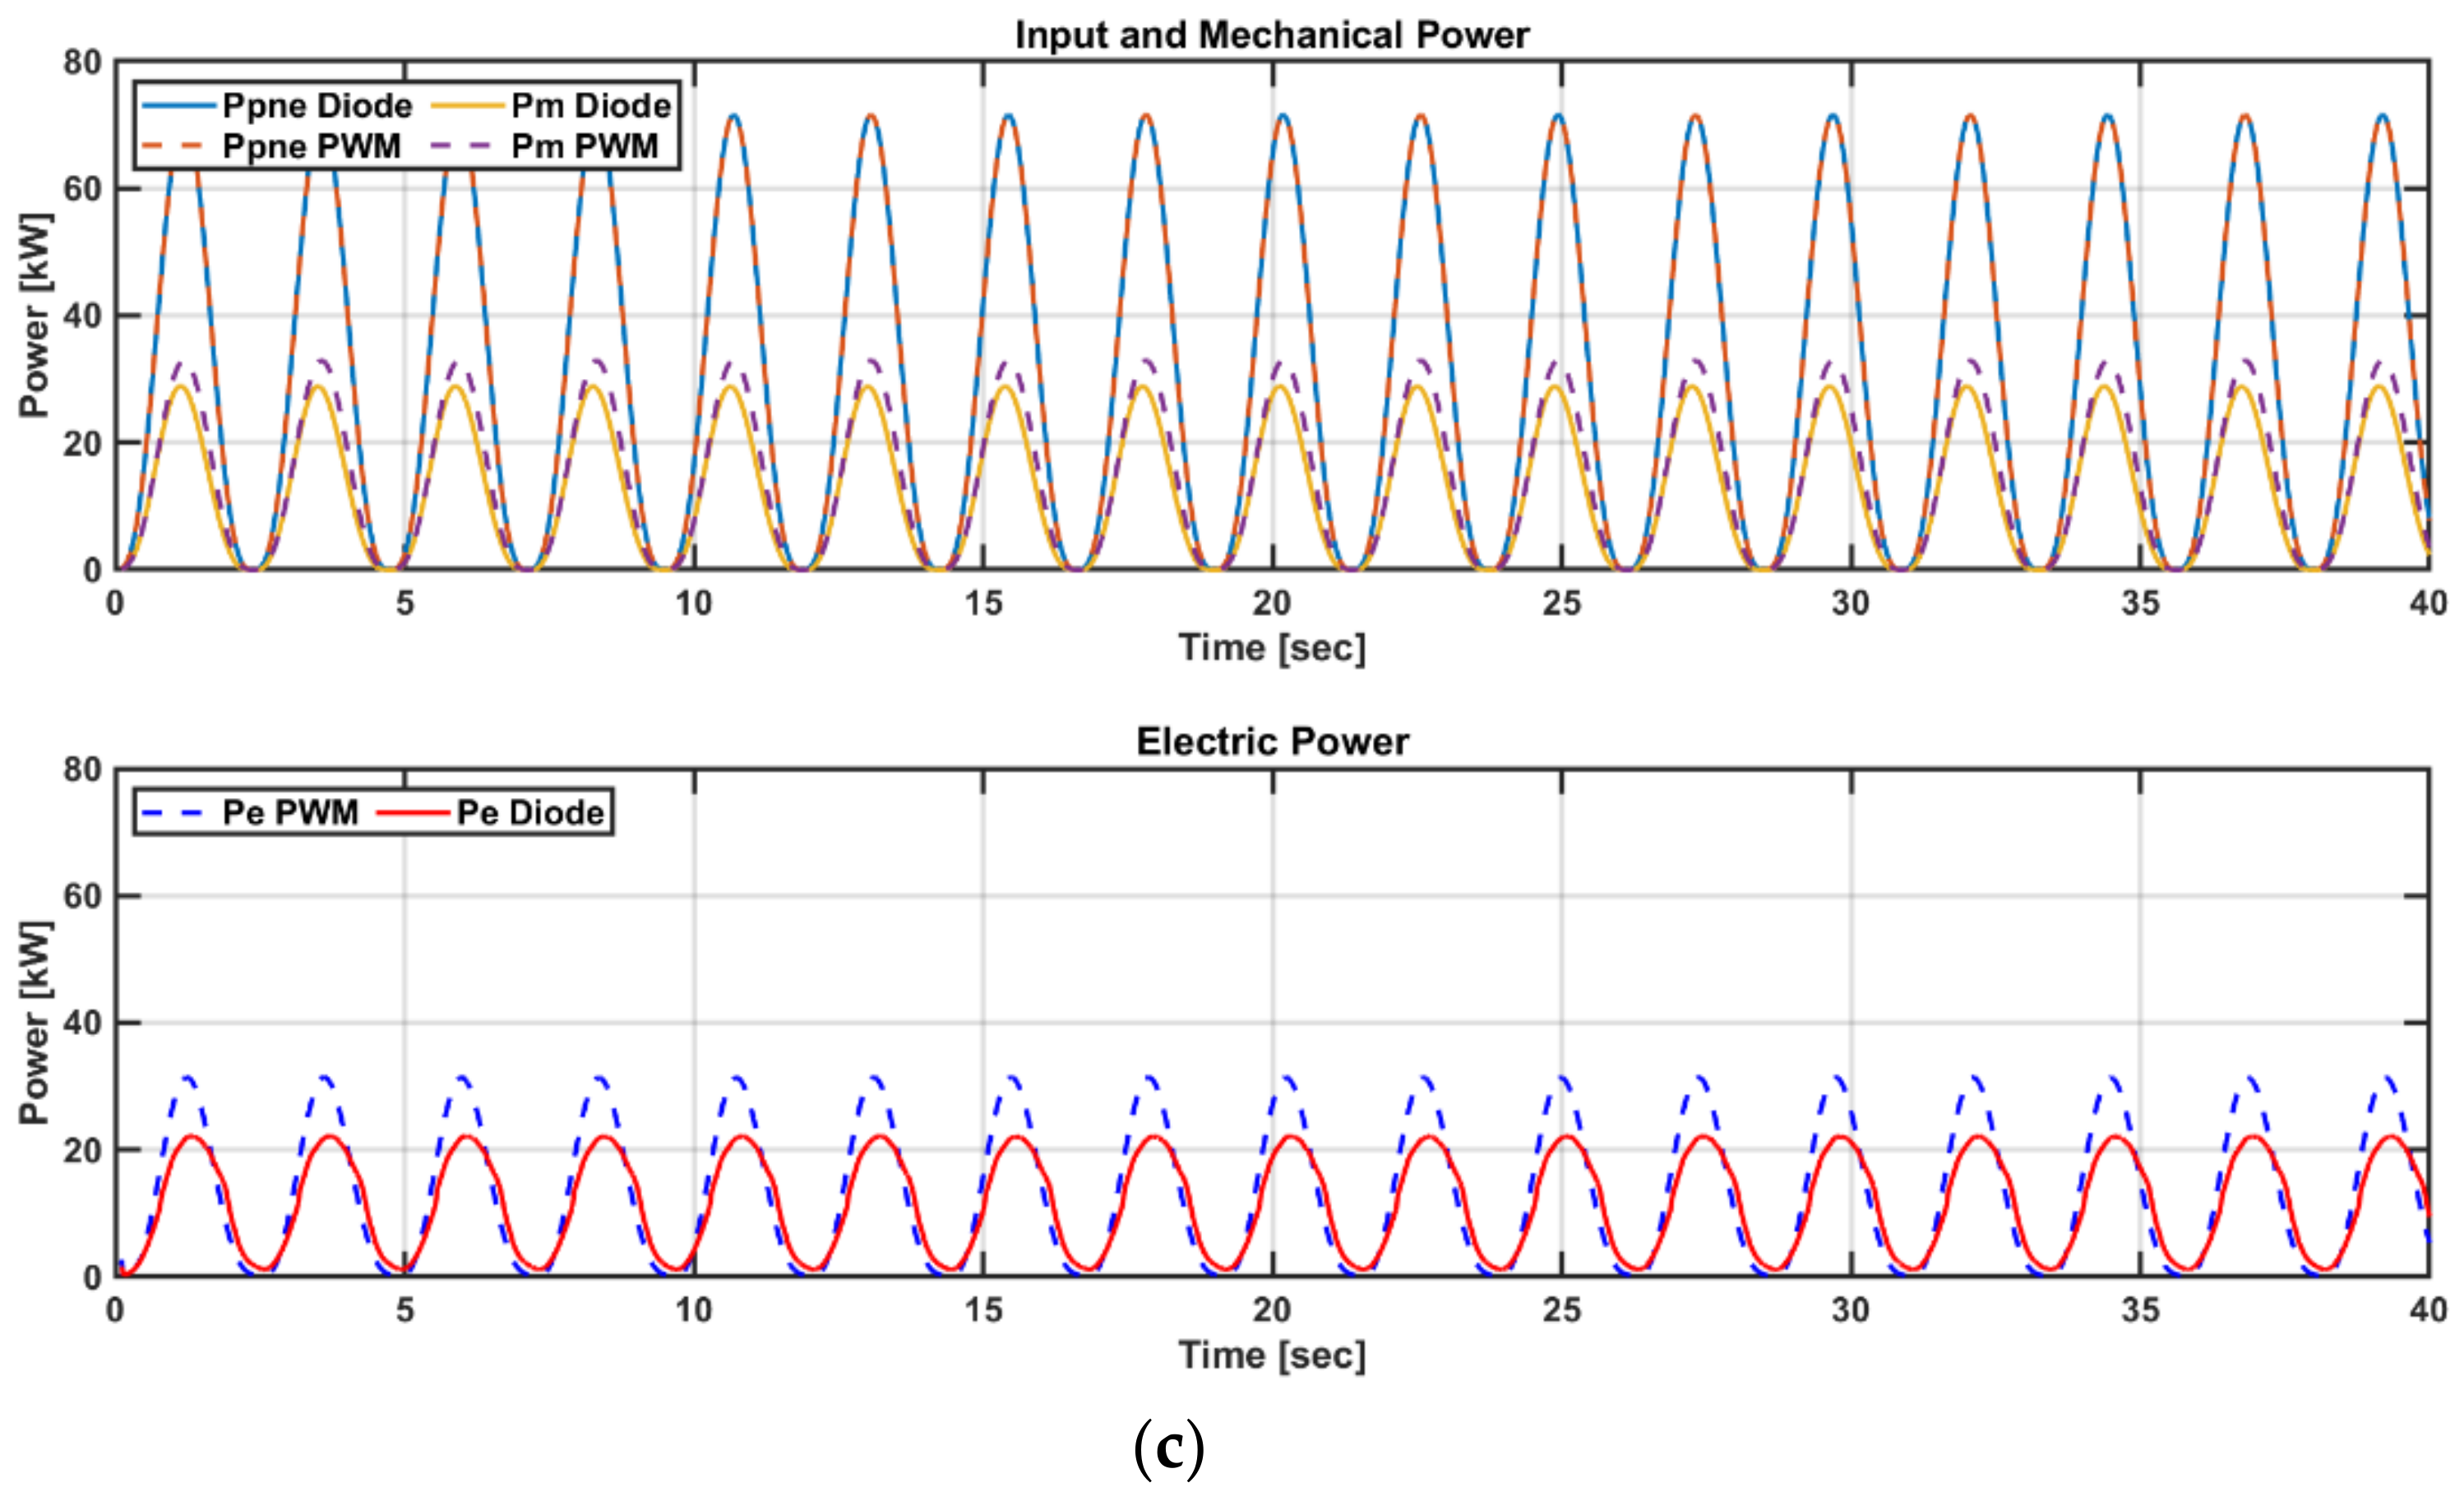
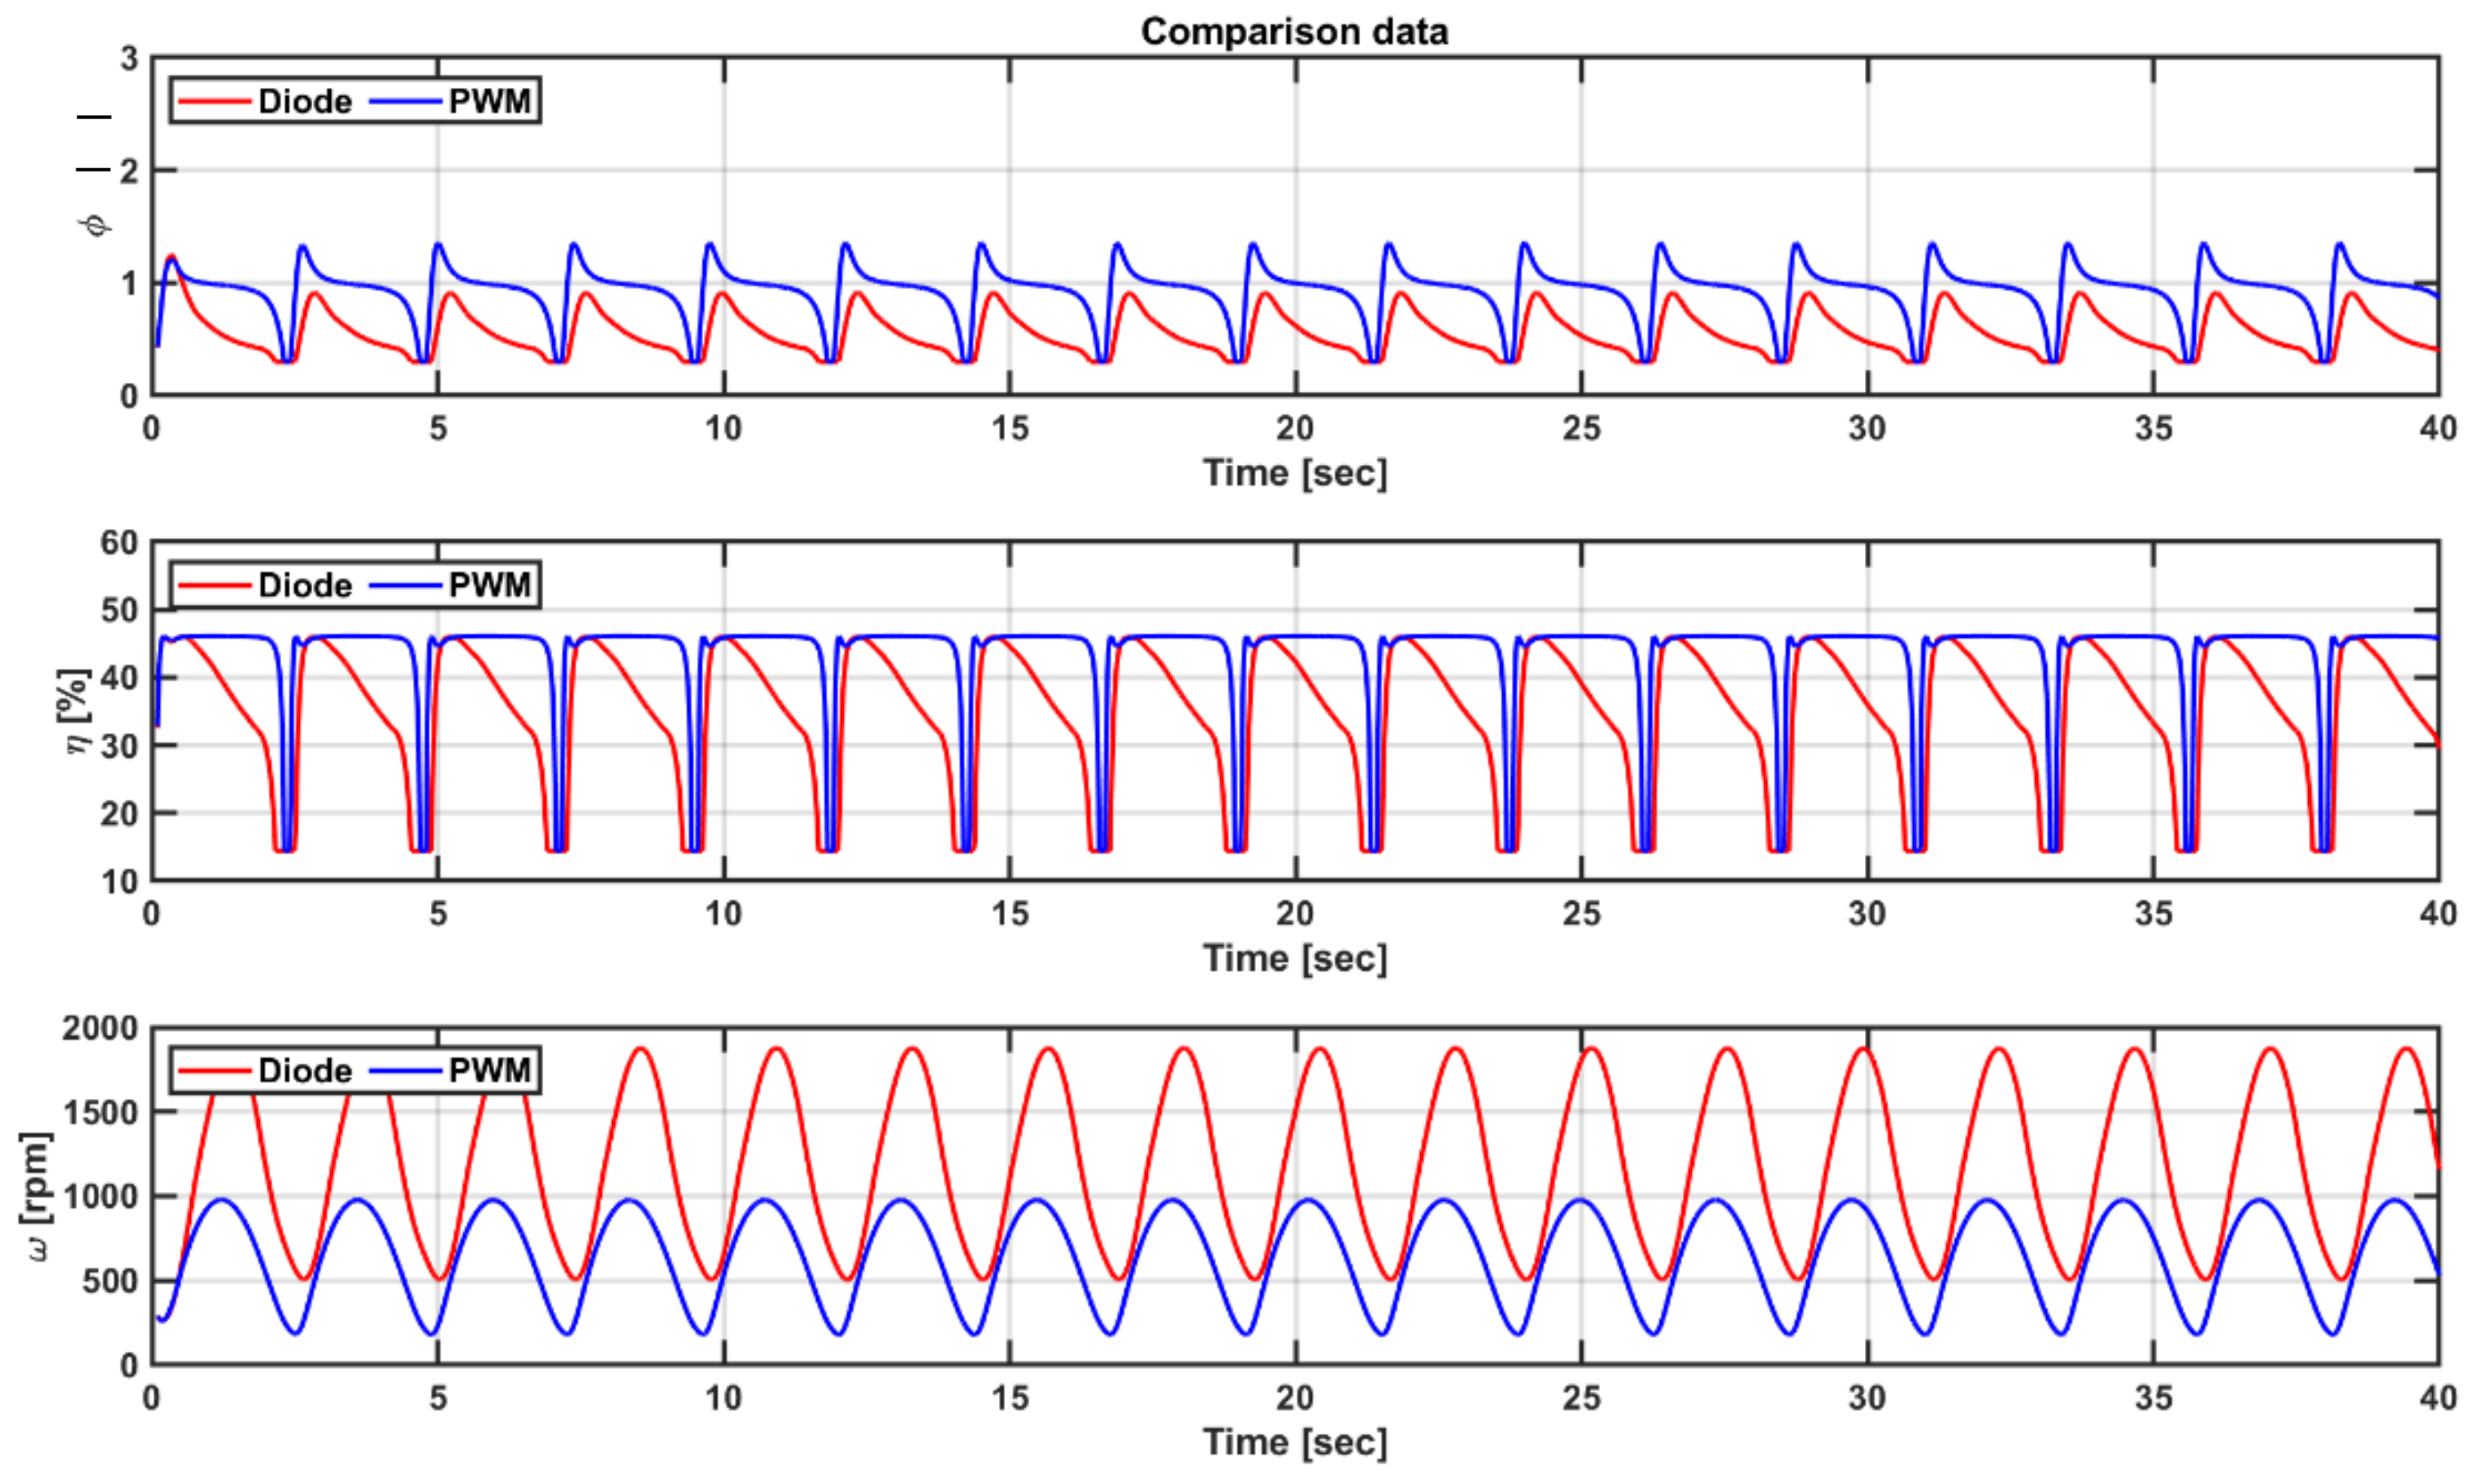
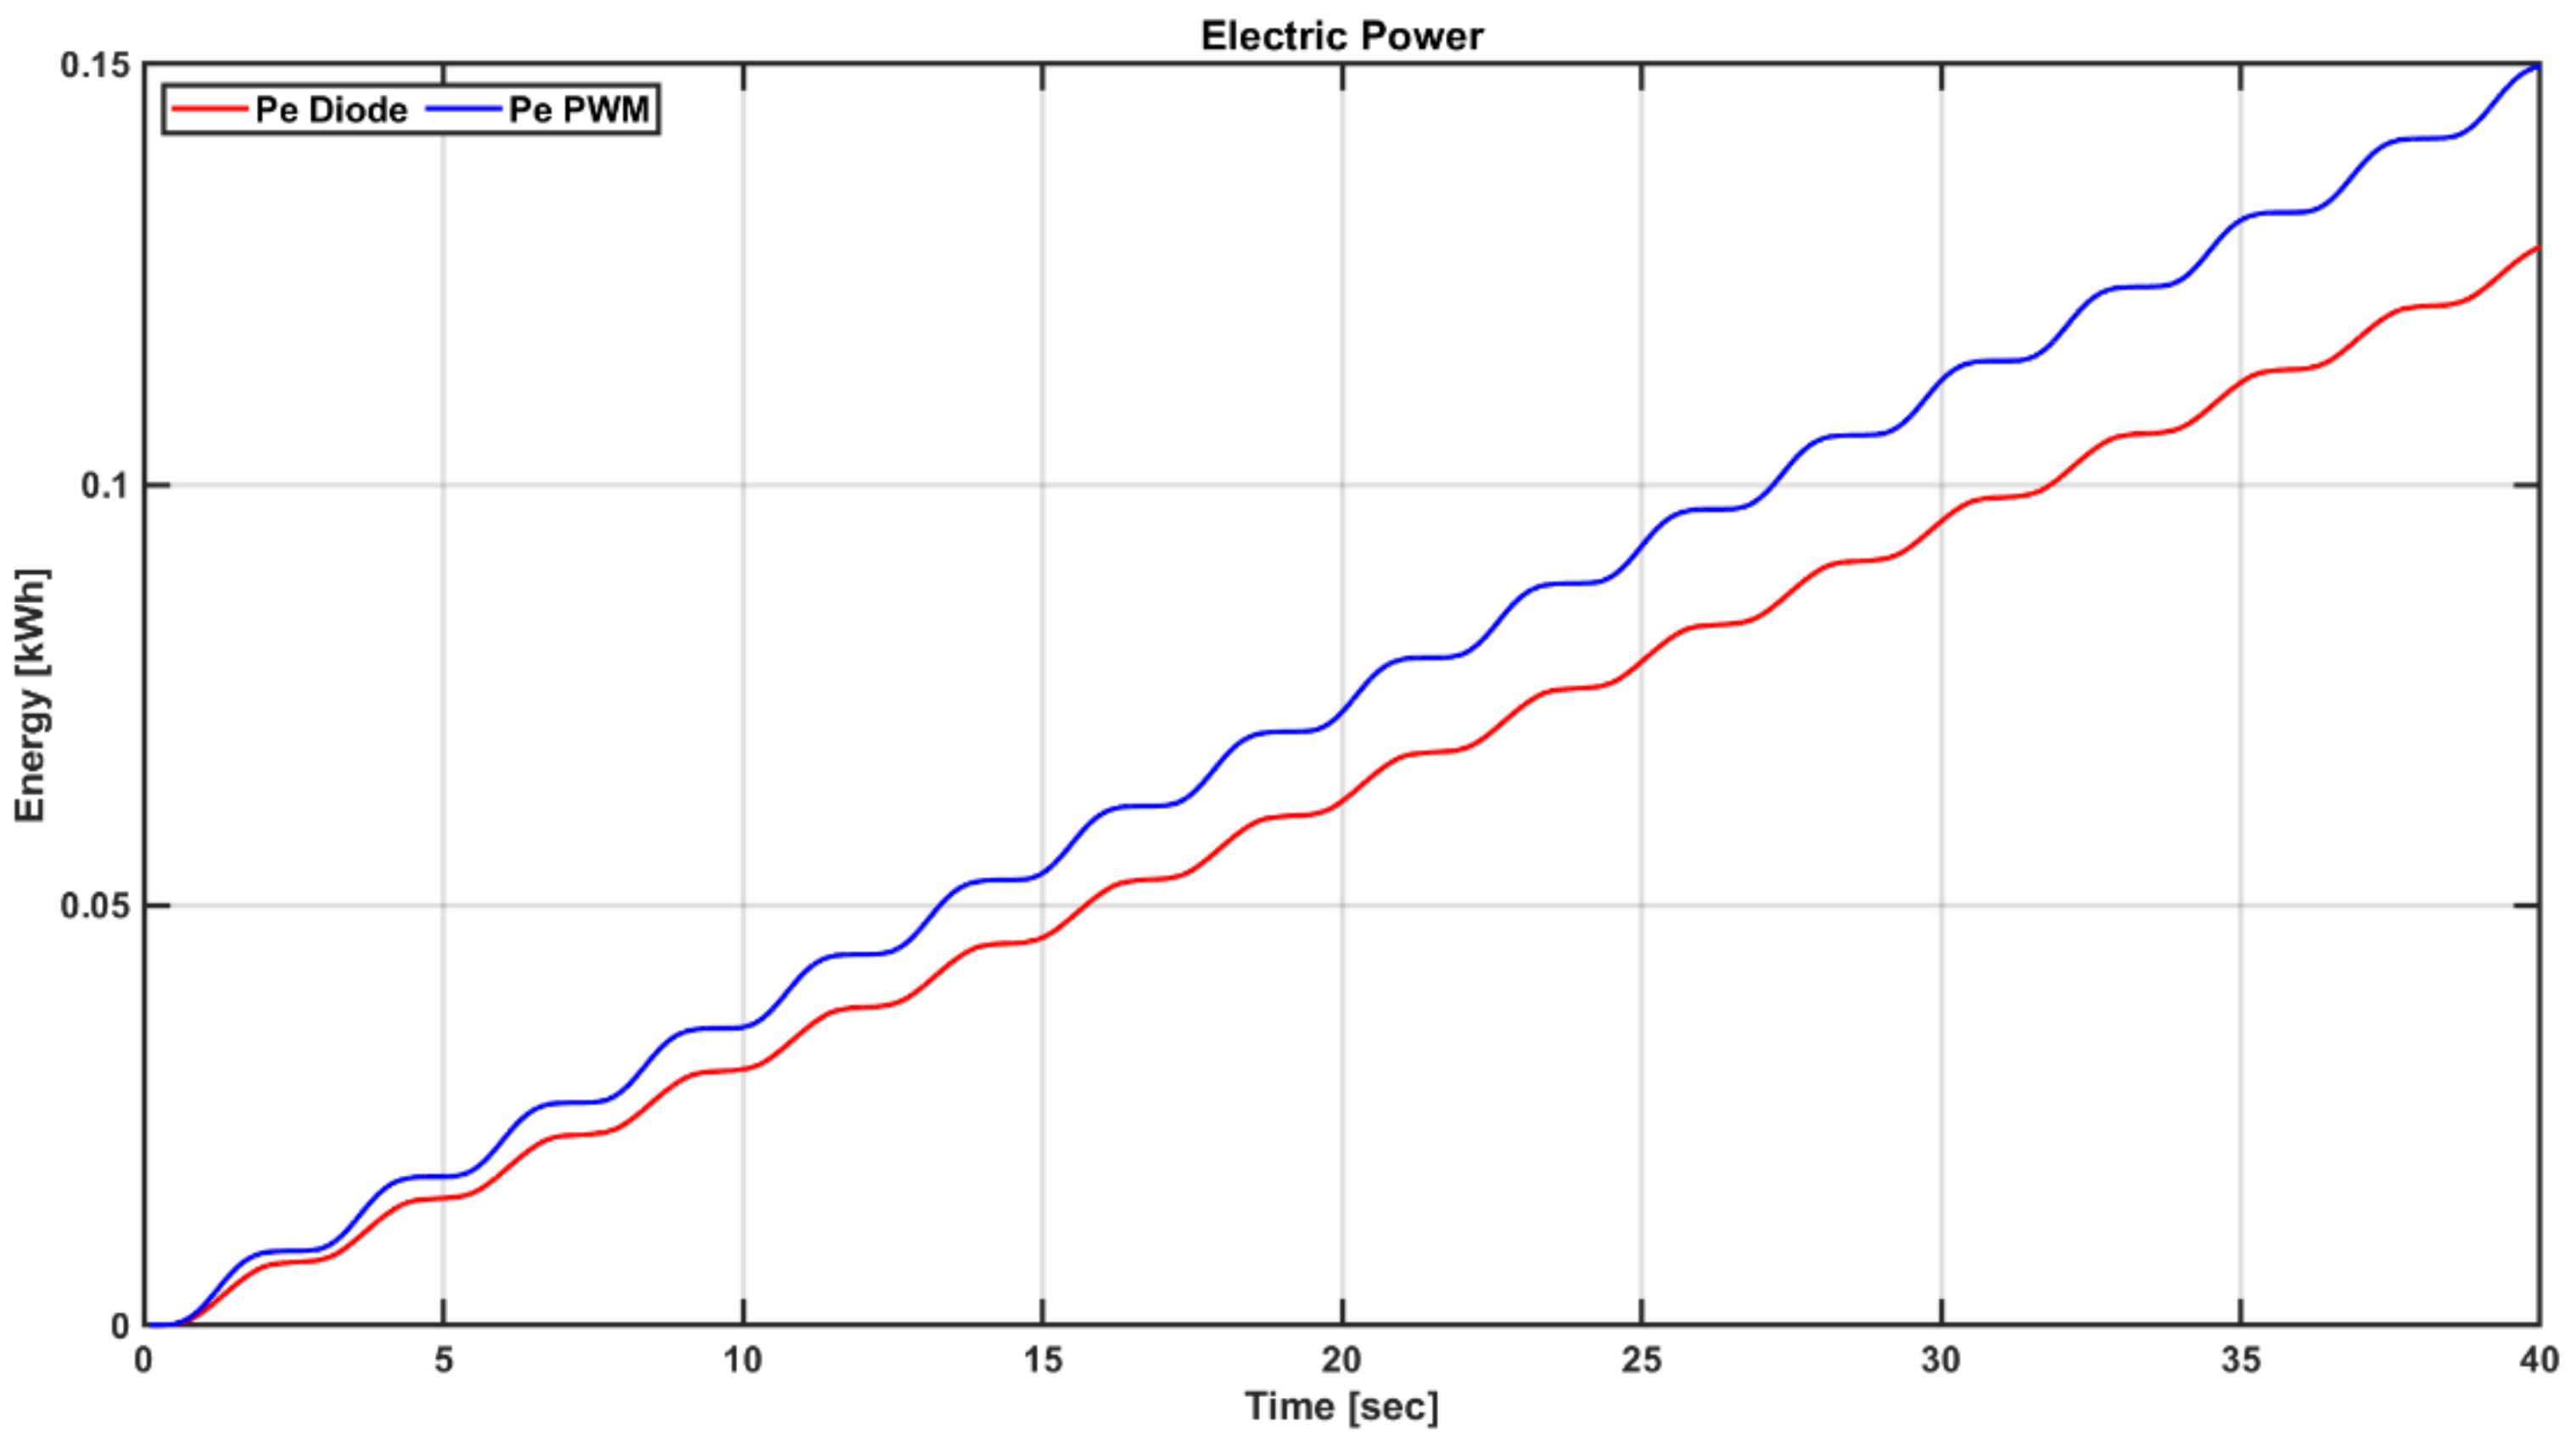
5.2. Dynamic Simulation in Regular Wave States

The characteristics of each turbine system, generator, and power converter under regular wave input conditions were analyzed using the PTO system in the integrated simulation. The angular speed of the turbine was changed according to the load control performance of the power converter topology in the same manner as the constant flow velocity condition, which changes the |Ø| value shown in Equation (5). This change alters the efficiency of the turbine shown in Equation (3), thereby affecting output power generation.
Input regular wave conditions were simulated for two cases of low and high amplitude conditions. The low input condition is the turbine flow velocity of 0~5 m/s and the wave period is 4.25 s; the high input condition is the turbine flow velocity of 0~35 m/s, and the wave period is 4.75 s. The input regular wave conditions are shown in Figure 14. Since the wave condition used in this paper was not subjected to hydrodynamic simulation, this simulation was conducted based on the input flow velocity on the turbine side, not the wave condition.
Figure 15 shows the output power performance of the PTO system according to the power converter topology under low regular wave conditions (vt = 0~5 m/s and T = 4.25 s). As shown in Figure 15a,b, the input power is the same. However, the mechanical power and electrical power changes according to the load control of each topology. Figure 15c shows that the diode converter has lower mechanical and electrical power performance than the PWM converter. However, when the input energy was small, there was no significant difference in performance in terms of power generation in both topologies. This confirms that there is no significant difference in output power generation even if the diode converter has poor performance when the input energy is small.
Figure 16 shows the turbine performance of the PTO system according to the power converter topology under low regular wave conditions (vt = 0~5 m/s and T = 4.25 s). As shown in Figure 16, the PWM converter can be controlled such that it operates at high efficiency (>40%), except for the section where the flow velocity is zero. This satisfies the efficiency of the turbine close to the highest efficiency in most sections. However, the accurate control of the load of the diode converter is difficult using flow velocity, which changes significantly depending on the flow velocity of the turbine.
Figure 17 shows the output energy comparison result per hour of the PTO system in the integration simulation under low regular wave conditions (vt = 0~5 m/s and T = 4.25 s). The regular wave input energy per hour is 101 Wh, and the output power generation per hour of the diode converter and the PWM converter is 42.9 Wh and 47.6 Wh, respectively. That is, the efficiency of the PTO system according to the topology load control performance is 42.4% and 47.1%, respectively. As a result, under the same low regular wave conditions, the PWM converter could obtain approximately 10% higher power generation.
Figure 18 shows the output power performance of the PTO system according to the topology of the power converter under high regular wave conditions (vt = 0~35 m/s and T = 4.75 s). As shown in Figure 18a,b, the input powers are the same for each topology, such as for the low regular wave condition. However, the mechanical power and electrical power change according to the load control of each topology.
Figure 18c shows that the diode converter is smaller than the PWM converter in both mechanical and electrical power generation. In addition, the larger the input energy than the lower input condition, the higher is the PWM converter in terms of power generation. This is because the larger the input energy, the greater is the performance of the turbine in power generation.
Figure 19 shows the turbine performance of the PTO system according to the topology of the power converter under high regular wave conditions (vt = 0~35 m/s and T = 4.75 s). As shown in Figure 19, the PWM converter can be controlled so that the turbine can operate at the highest efficiency except for the section where the flow velocity is zero. This means that the efficiency of the turbine can satisfy the highest efficiency in most sections. However, it is difficult to control the load according to the flow rate accurately, and it can be seen that the rpm changes significantly more than that for the PWM converter. Therefore, the diode converter has a relatively large change in |Ø|, which affects the turbine, depending on flow velocity. Therefore, even at a high input energy, the diode converter has a lower efficiency than the PWM converter. In addition, because of the high input energy, the PWM converter is considerably better in terms of power generation than that in the low-input condition.
Figure 20 shows the result of comparing the output energy per hour of the integrated simulation of the PTO system under high regular wave conditions (vt = 0~35 m/s and T = 4.75 s). The regular wave input energy per hour is 30.7 kWh, and the output power generation per hour of the diode converter and the PWM converter is 11.57 Wh and 13.51 Wh, respectively. That is, the efficiency of the PTO system according to topology control is 37.6% and 44%, respectively. Thus, at the same constant input flow velocity, the PWM converter can obtain a power generation of approximately 14.3%.
Under the regular wave input condition, it was confirmed that the load control of the PWM converter was superior to the diode converter regardless of the magnitude of the wave height, which confirms that the efficiency of the turbine was higher than that of the PWM converter. However, when the crest is low, even though the efficiency is low, the input energy itself is small; therefore, the PWM converter and the diode converter are not significantly different in terms of power generation.
However, when the wave height is low, the input energy itself is small even though the efficiency is low; therefore, the PWM converter and the diode converter are not significantly different in terms of power generation.

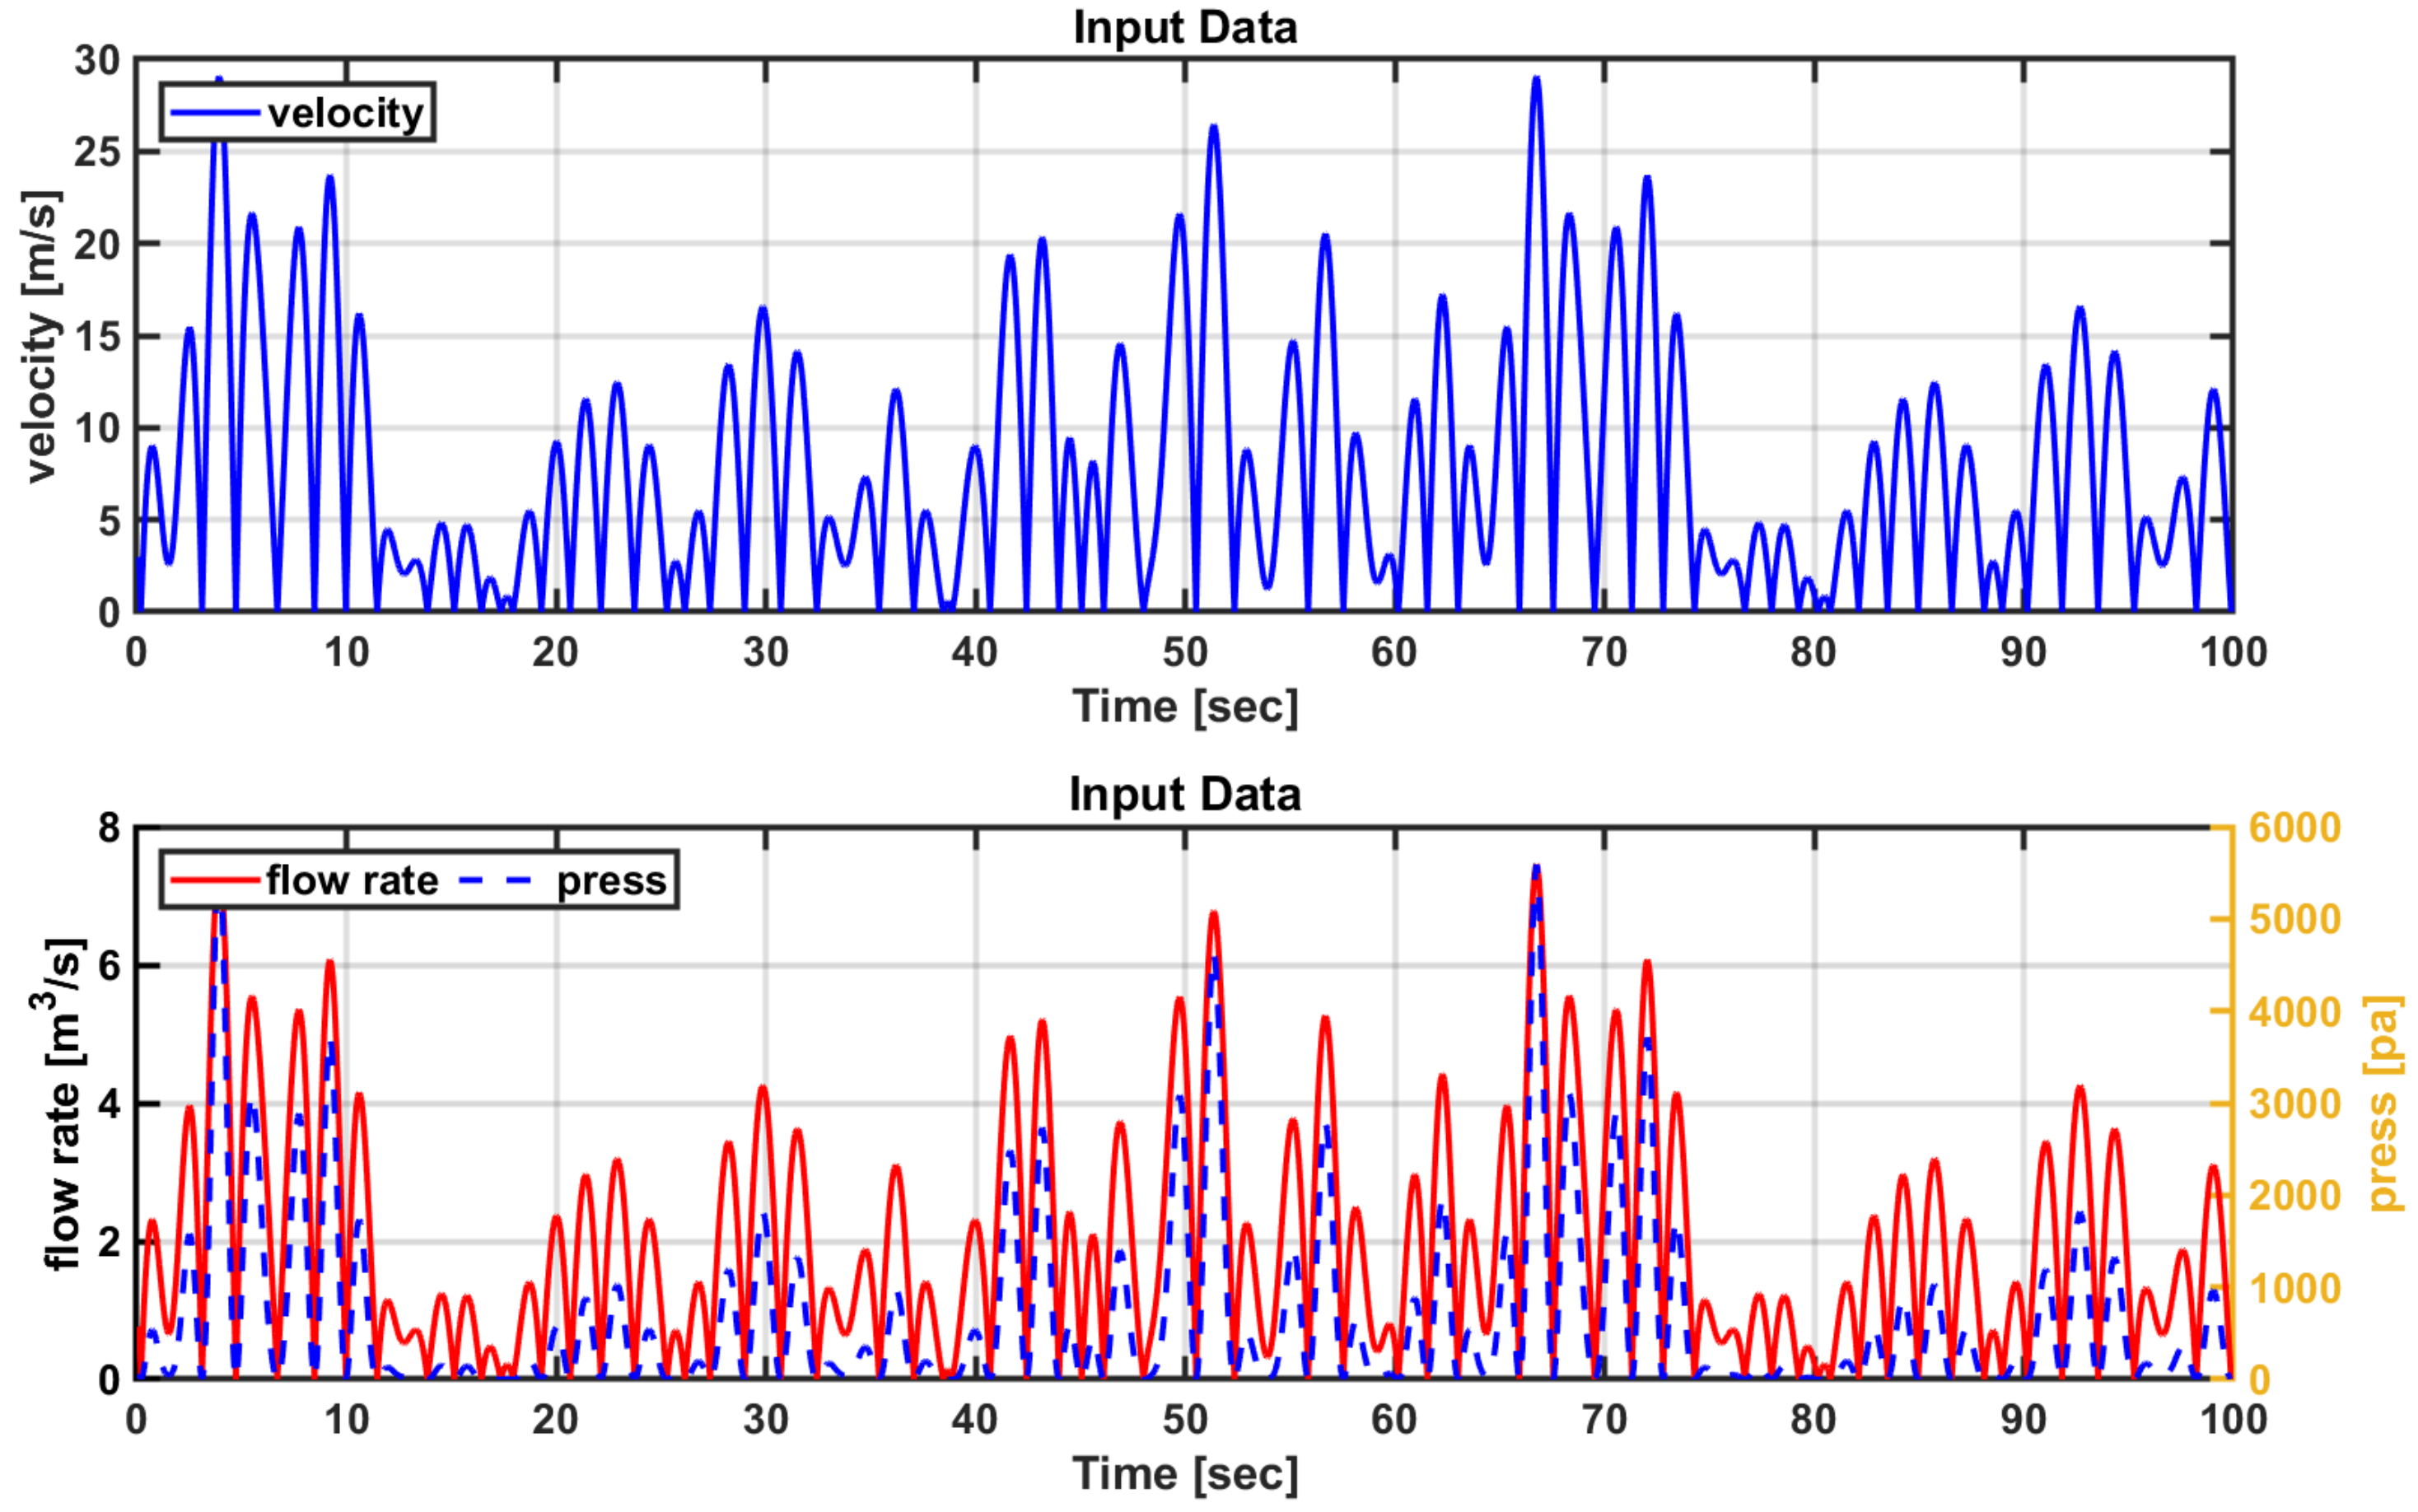
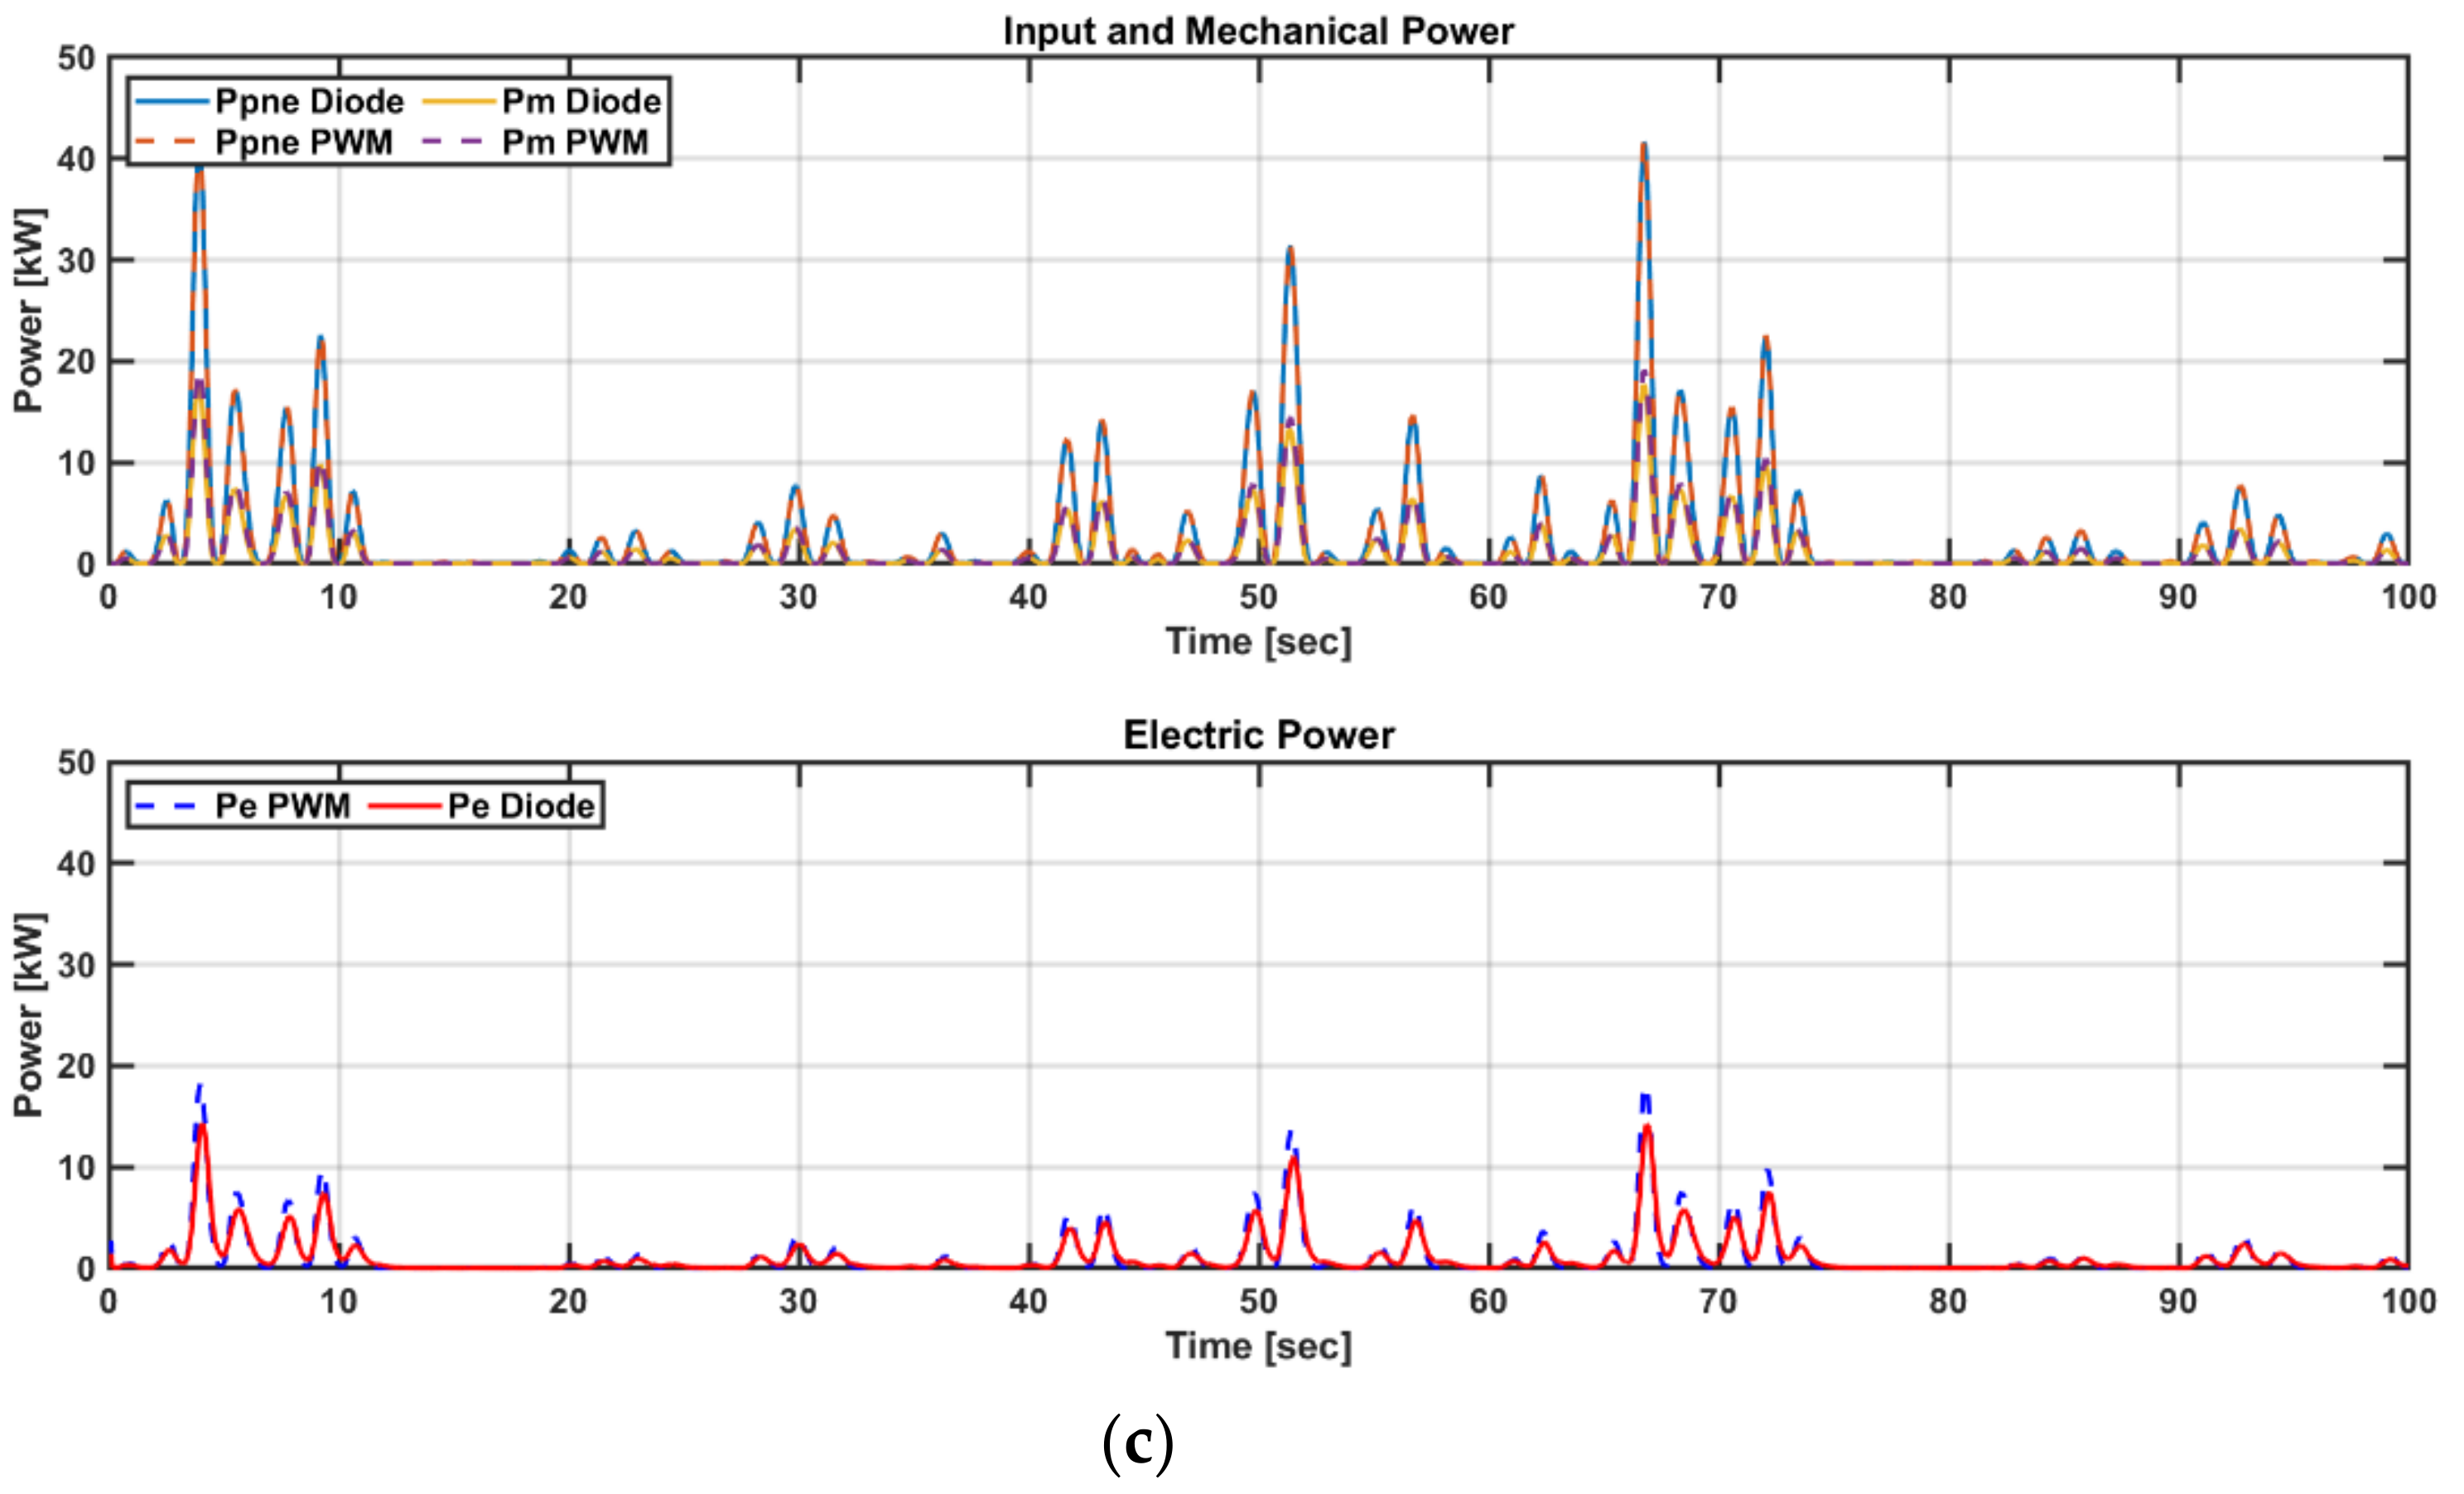
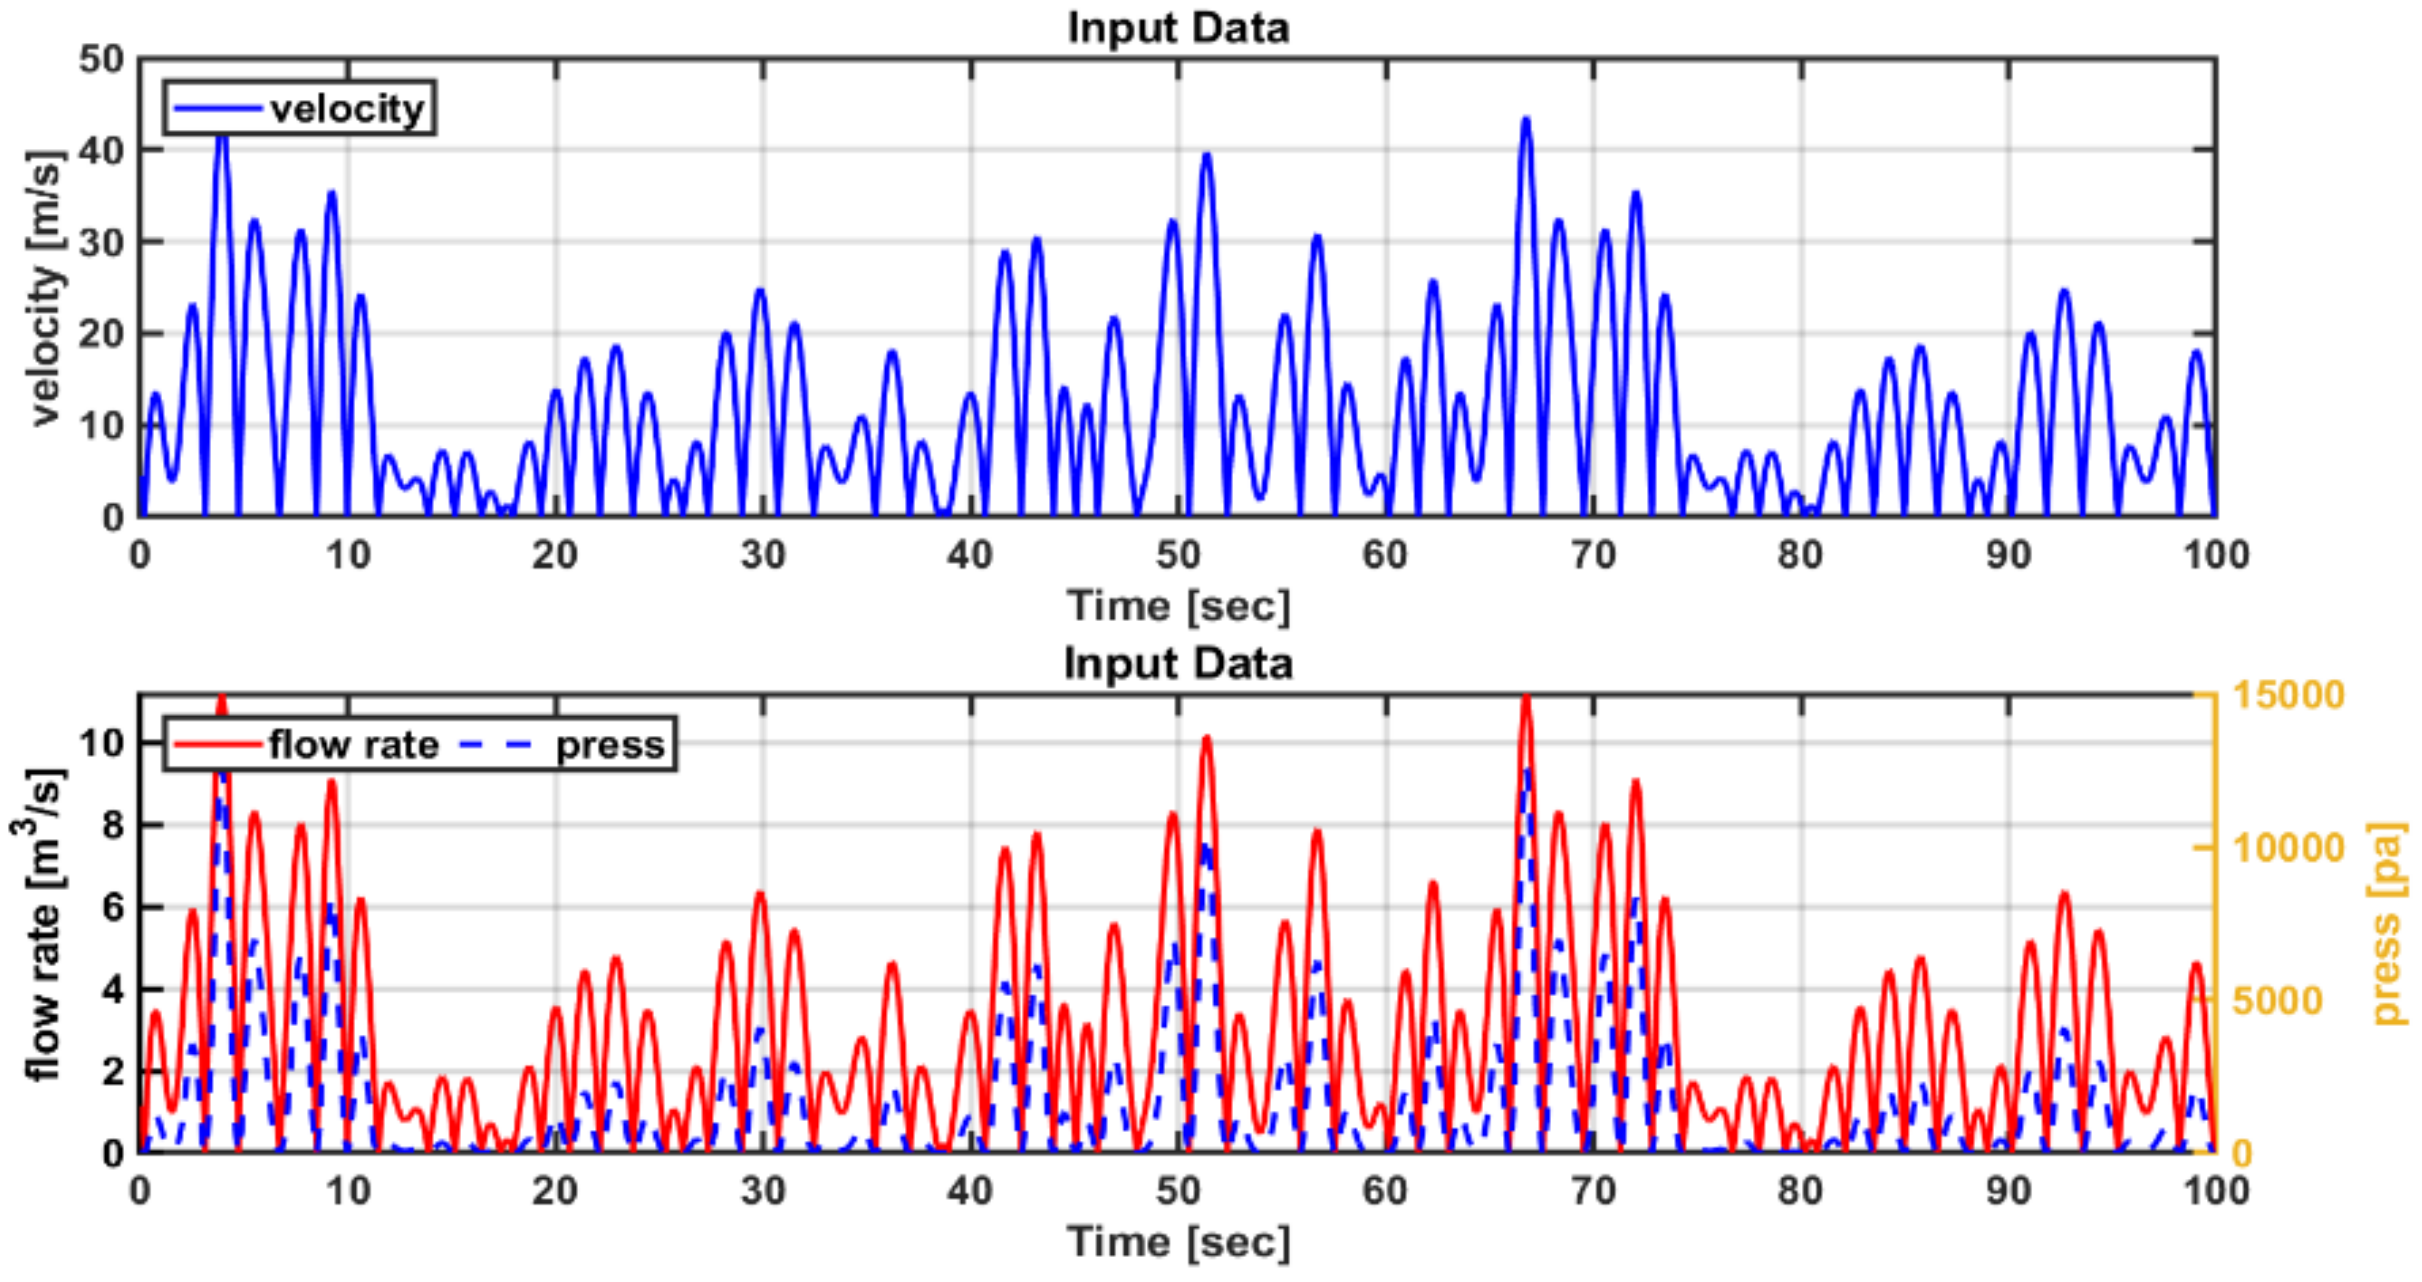
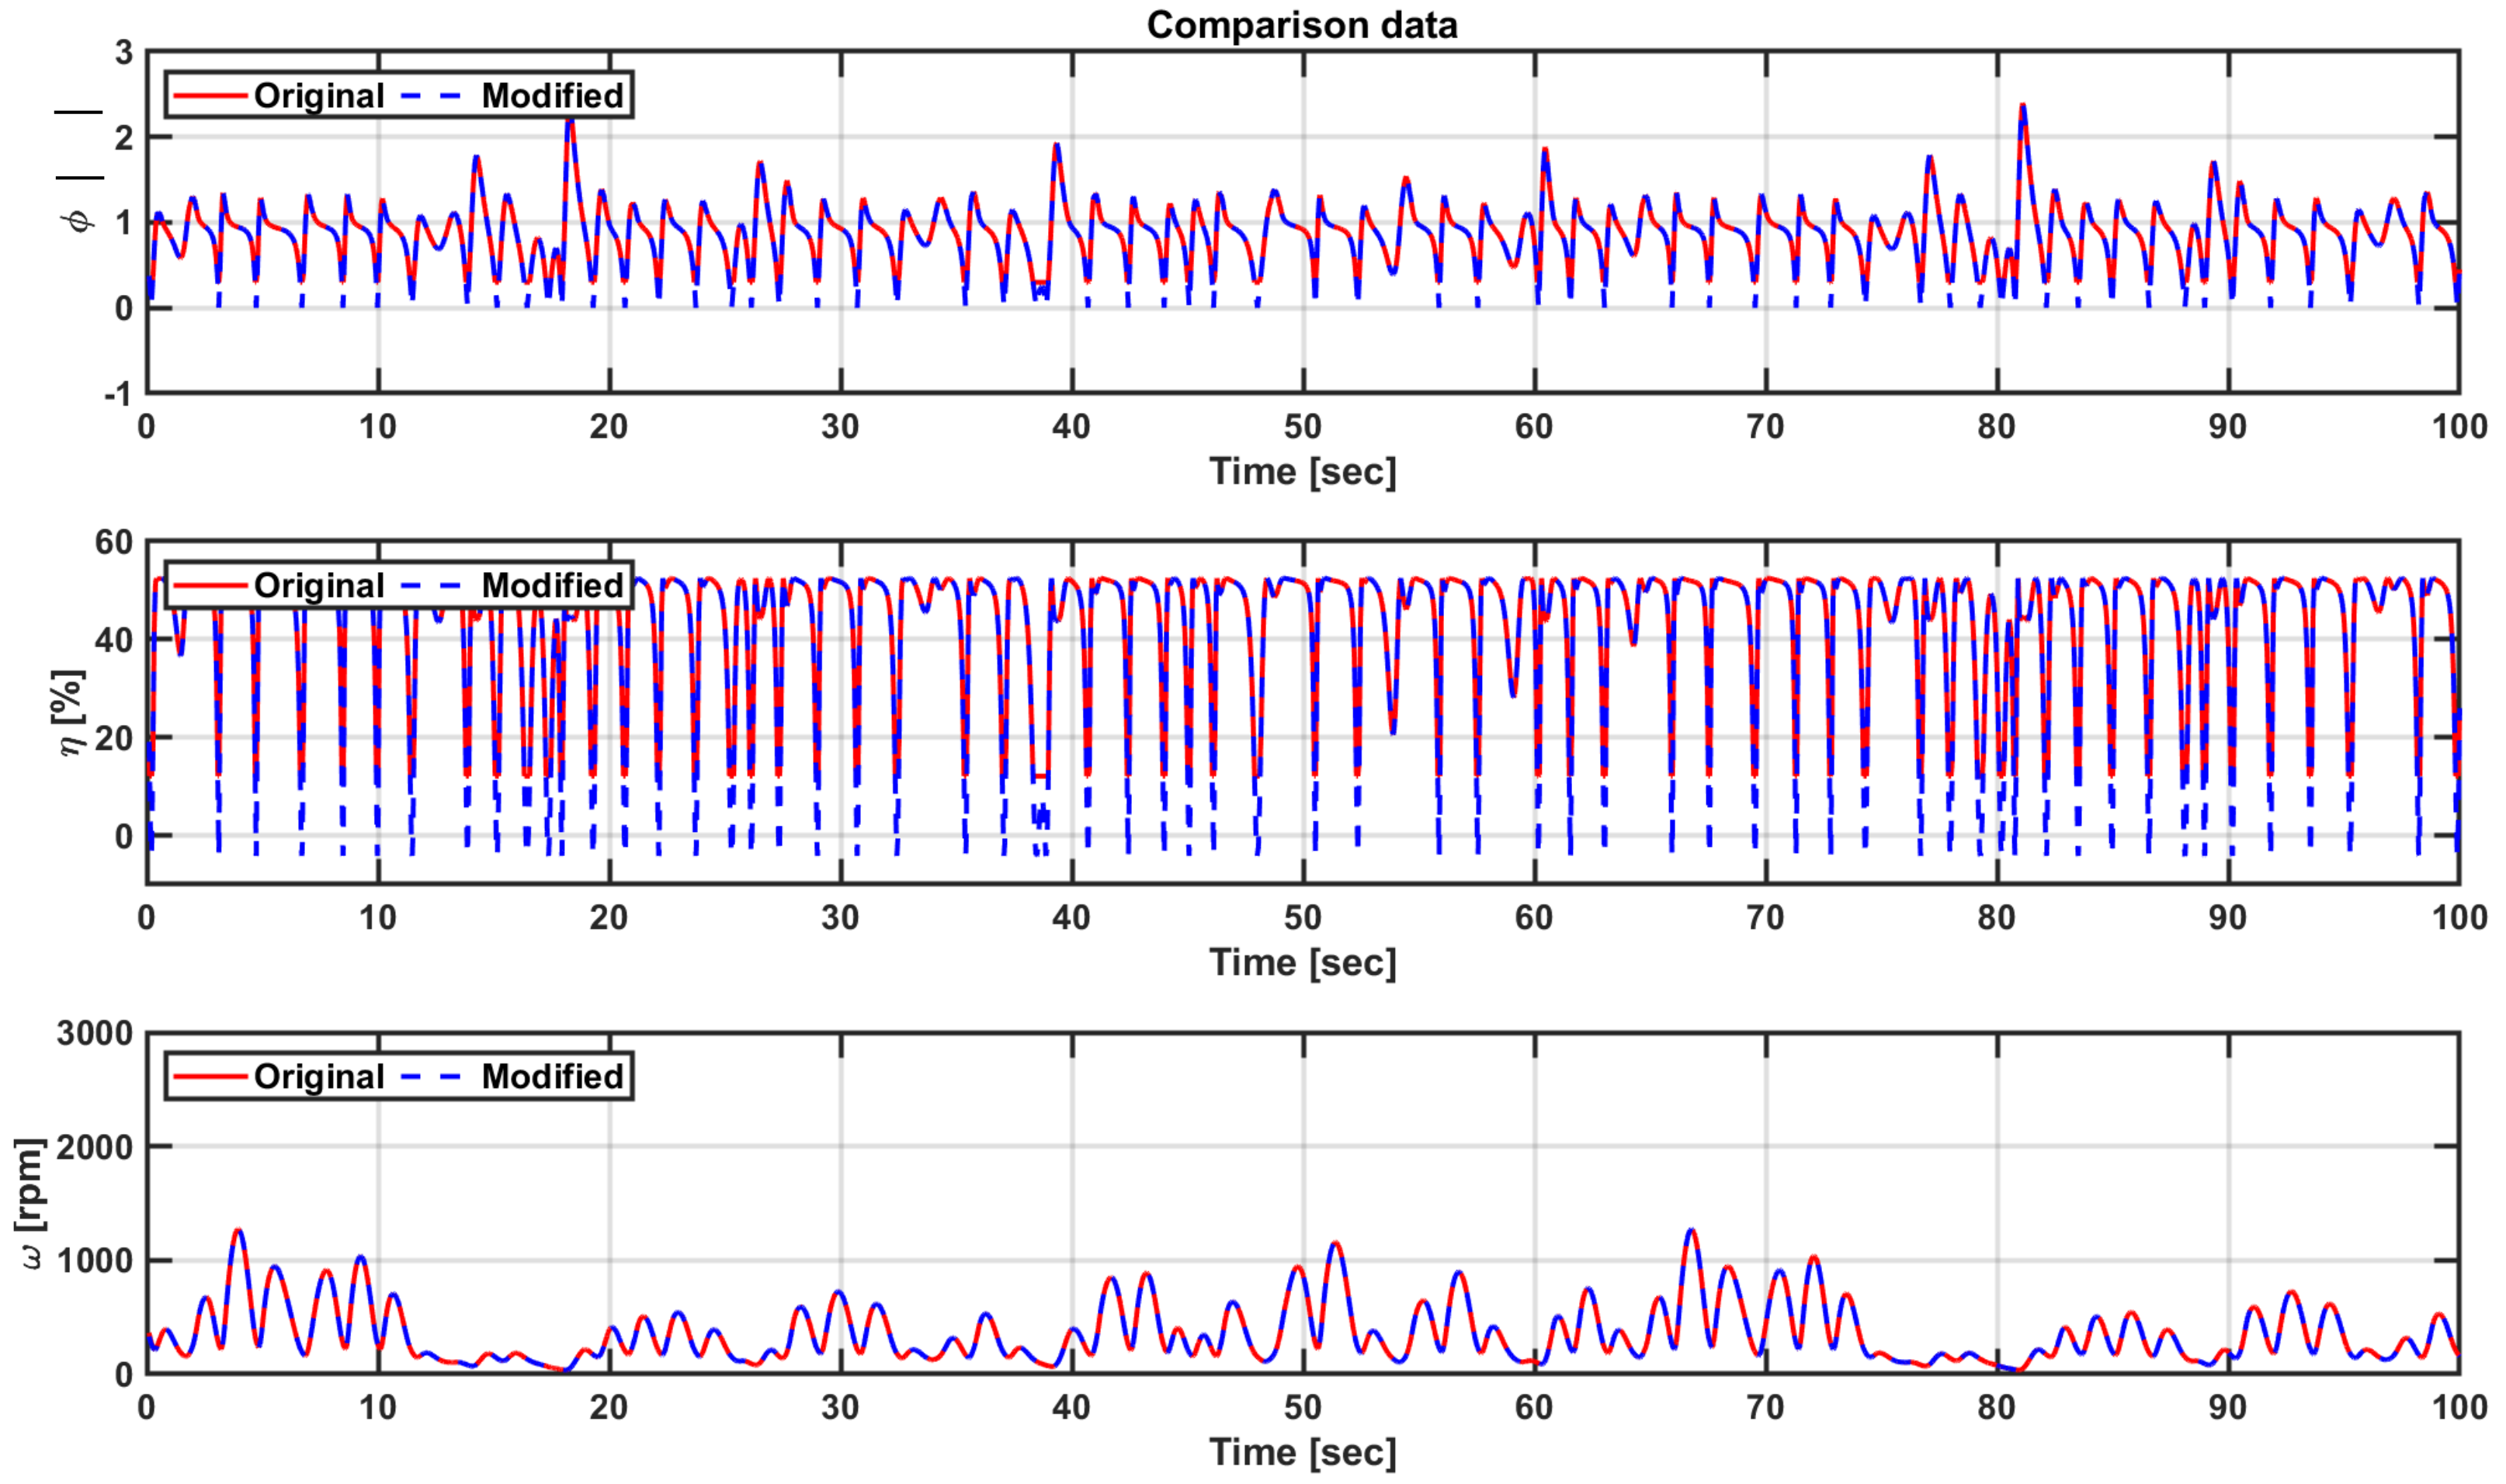
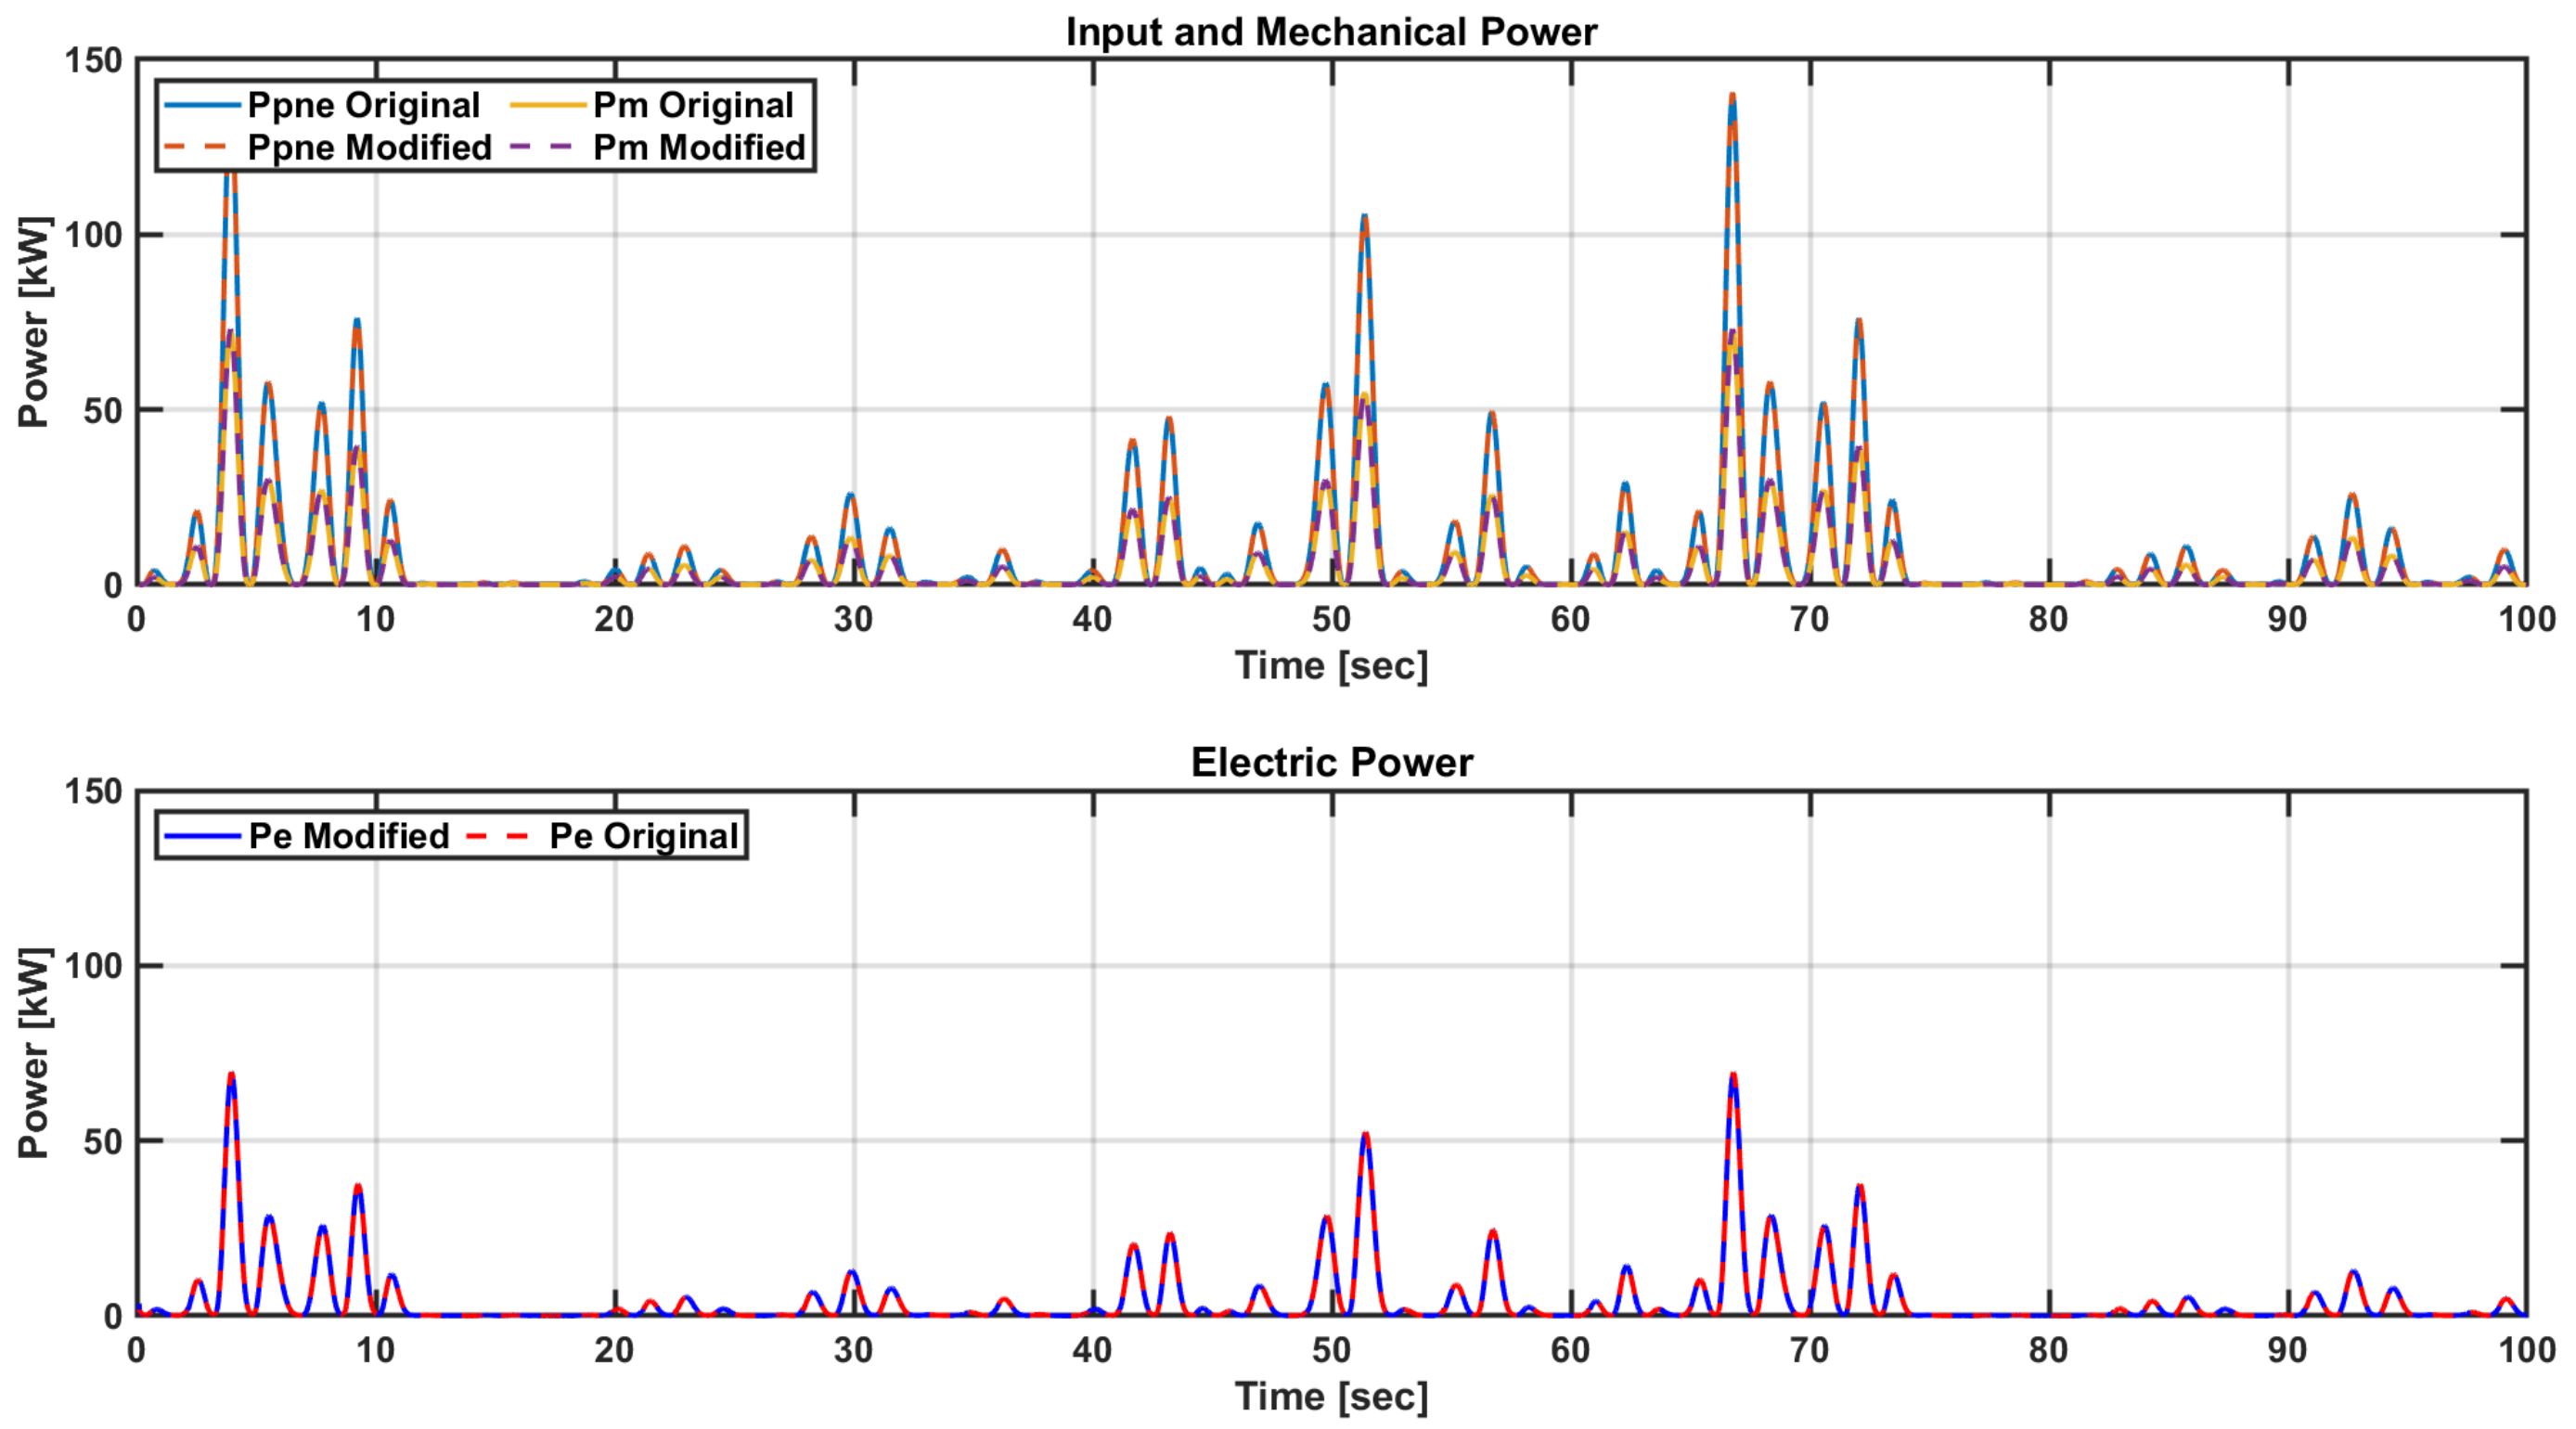
5.3. Dynamic Simulation in Irregular Wave States

The PTO system in the integrated simulation was used to analyze the characteristics of each turbine system, generator, and power converter under irregular wave input conditions. The angular speed of the turbine is changed according to the load control performance of the power converter topology in the same manner as the conditions analyzed above; the |Ø| value is also changed. These changes cause the efficiency of the turbine shown in Equation (3) to vary, thereby changing the output power generation. Because the actual sea state is an irregular input condition, the analysis of power generation enables the comparison of the exact power generation performance of the PTO system. The input irregular wave conditions are shown in Figure 21. Similar to the regular wave simulation, the simulation was conducted based on the input flow velocity on the turbine side, not the wave condition.
Figure 22 shows the output power generation performance of the PTO system according to the power converter topology under irregular wave conditions (vt = 0~30 m/s and T = 4.75 s). As shown in Figure 22a,b, in the regular wave condition, each topology has the same input energy. Similar to the regular wave analysis, there is no significant difference in power generation at low wave heights; however, it can be seen that power generation occurs at high wave heights. As shown in Figure 22c, the wave height is both large and small in the irregular wave input condition, and therefore, the difference in power generation may be less than that under the regular wave condition in which the wave height is large.
Figure 23 shows the turbine performance of the PTO system according to the power converter topology under an irregular wave (vt = 0~30 m/s and Tp = 4.75 s) conditions. Similar to the regular wave analysis as shown in Figure 23, the PWM converter can control the turbine with high efficiency, except for the section where the flow velocity becomes zero. However, it is difficult to control the load according to the flow velocity accurately, which means that the diode converter rapidly changes depending on the flow velocity of the turbine. Similar to the regular wave analysis, the PWM converter is excellent in terms of the efficiency of the turbine; however, because the input energy is not always large in terms of power generation, there is no significant difference compared to that for the high regular wave condition.
Figure 24 shows the result of comparing the output energy per hour of the PTO system in the integrated simulation under the condition of irregular wave (vt = 0~30 m/s and Tp = 4.75 s). The irregular wave input energy per hour is 2.72 kWh, and the output power per hour of the diode converter and the PWM converter is 1.1 Wh and 1.19 Wh, respectively. The efficiency of the PTO system according to topology control is 40.4% and 43.7%, respectively. Thus, at the same irregular input flow velocity, the PWM converter can obtain approximately 7.5% higher power generation.

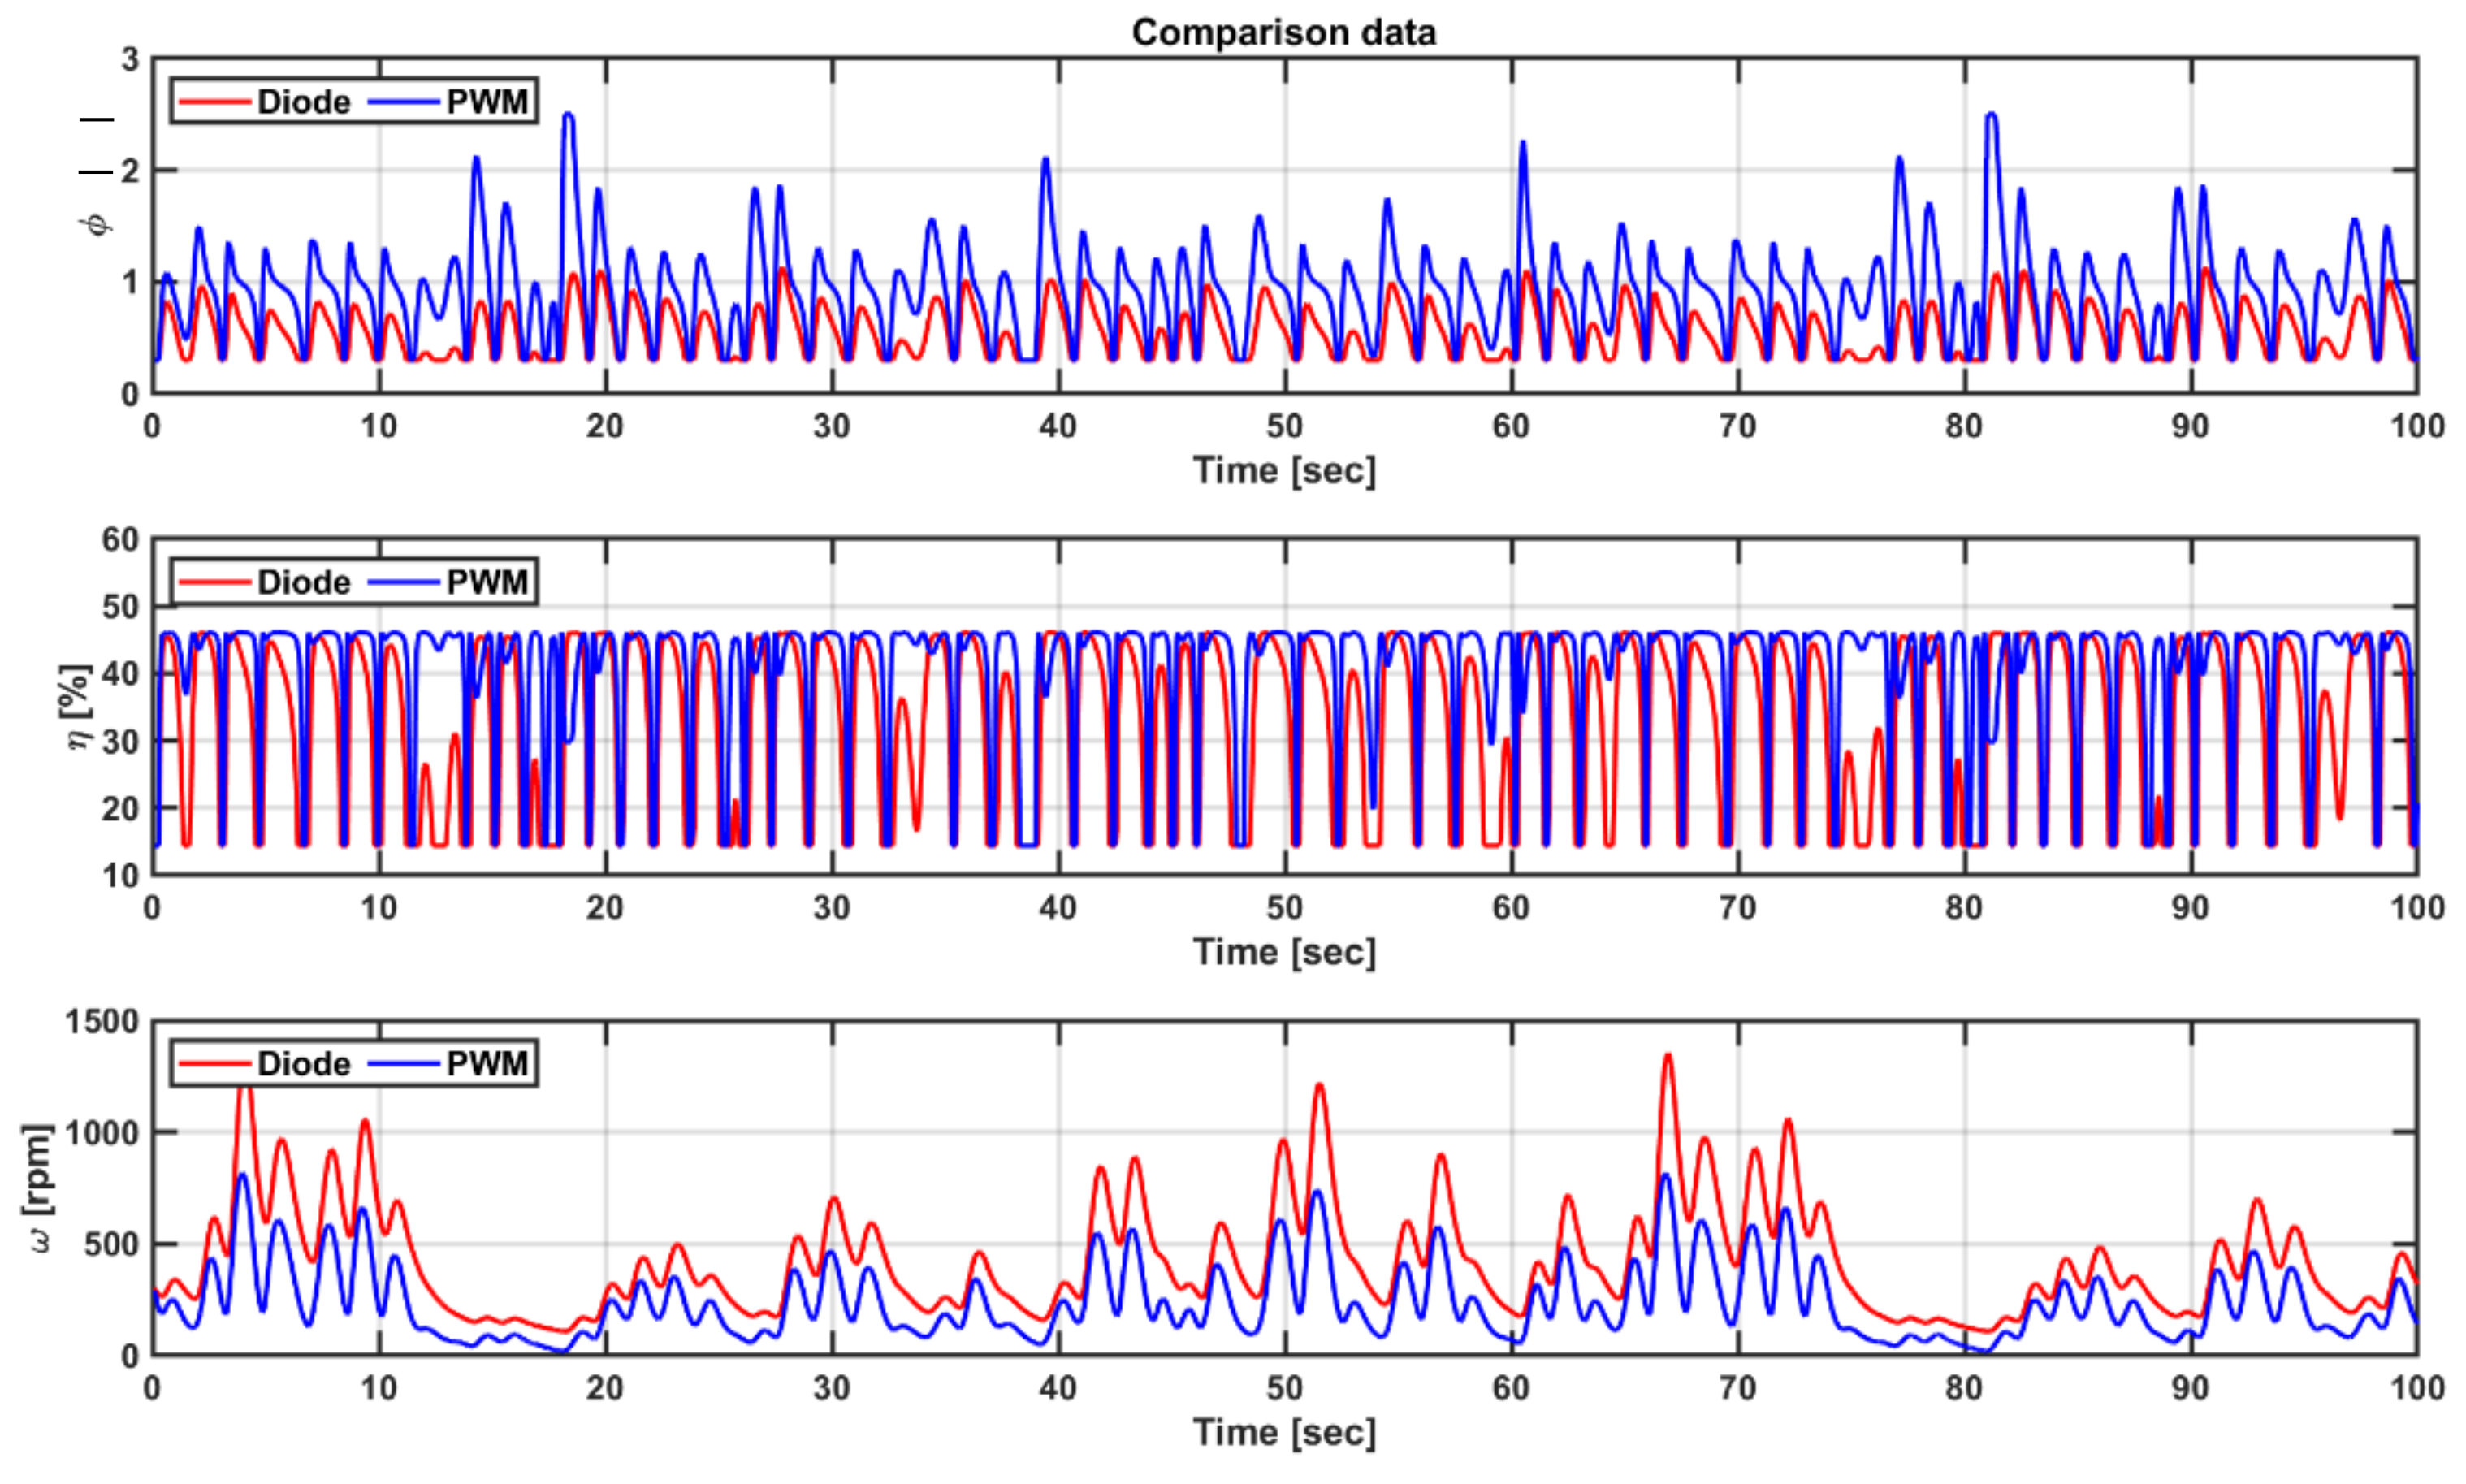
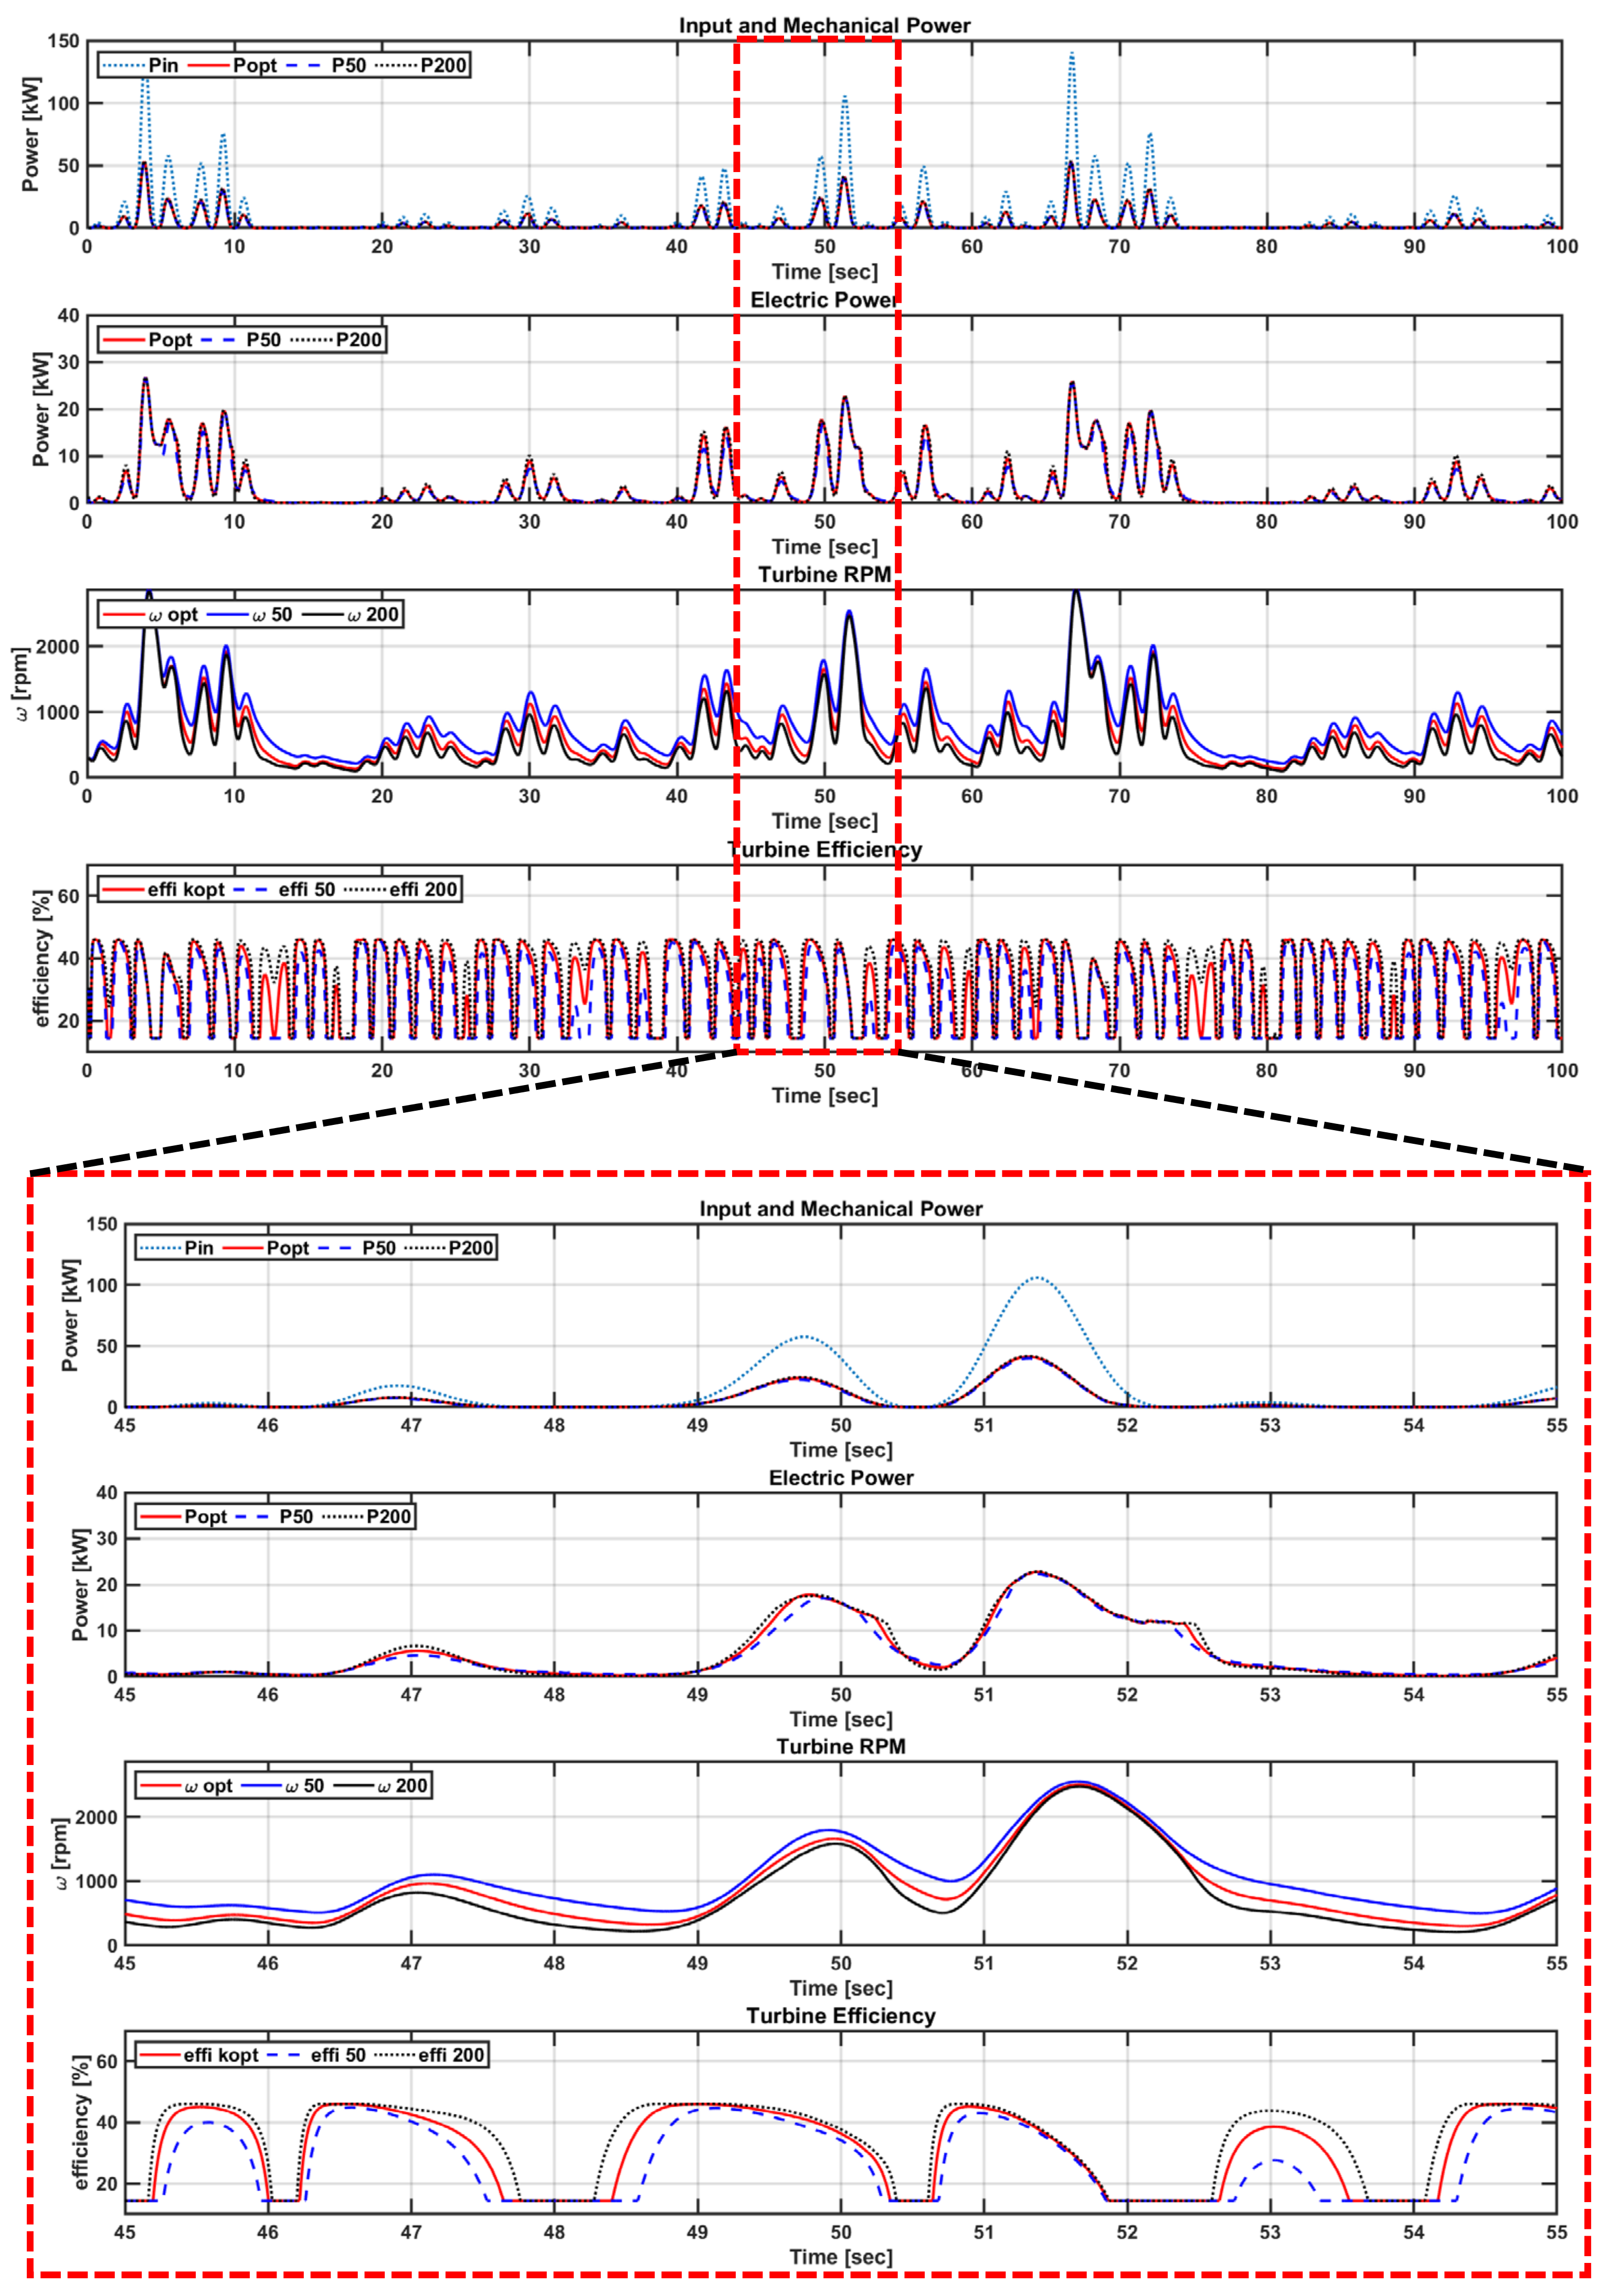
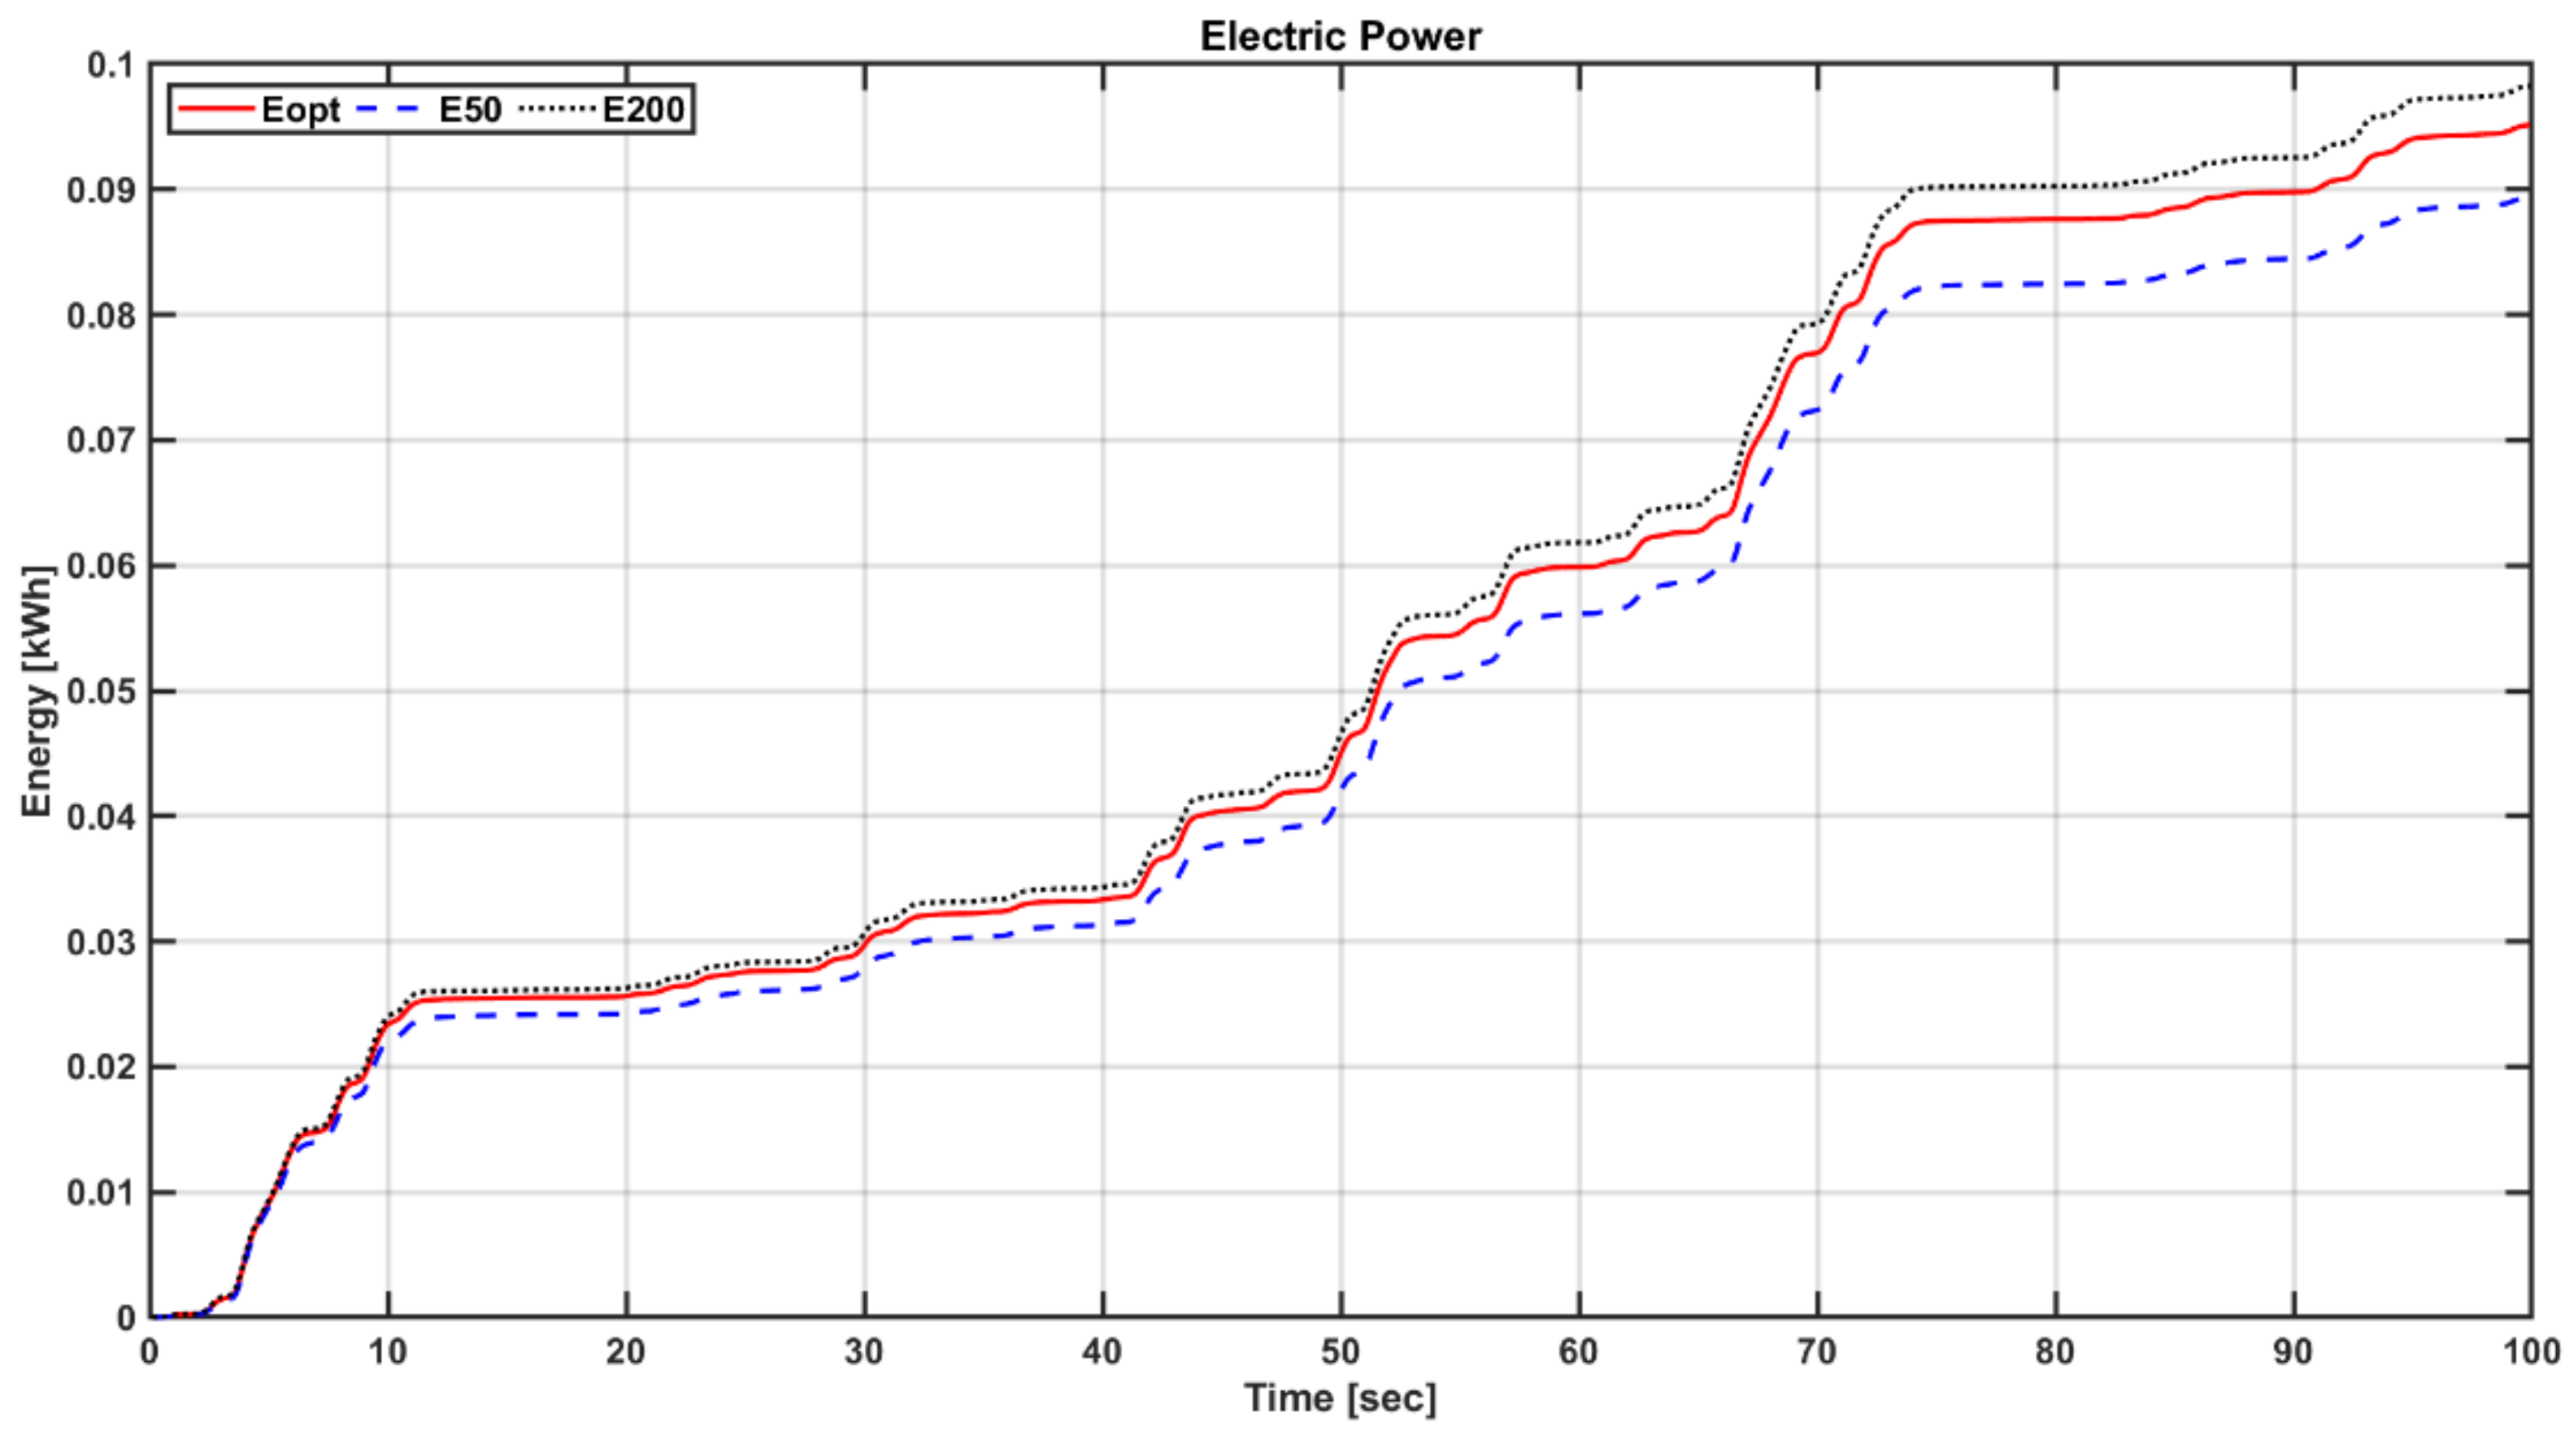
5.4. Comparison of Power Performance according to the Torque Factor of Load Control

The OWC-WEC was controlled to load according to Equation (23) to obtain the maximum efficiency of the turbine. However, owing to the OWC-WEC characteristics, the rpm was rapidly changed according to the irregular input, which could not always maximize the efficiency of the turbine. Therefore, in this study, the load control coefficients of 200% and 50% of the load control to obtain maximum efficiency, as shown in Equations (26) and (27); the load control to obtain the maximum efficiency are compared as shown in Figure 8. The characteristics and power generation of the PTO system according to each load control were analyzed, and a load control algorithm suitable for the OWC-WEC was analyzed.
To analyze the characteristics of load control, input conditions were performed in the simulation under irregular wave (vt = 0~42 m/s and Tp = 4.75 s) conditions, as shown in Figure 25.
Figure 26 shows the simulation results of the PTO system according to the torque factor of the PWM converter under the condition of the irregular wave (vt = 0~42 m/s and Tp = 4.75 s). Although there is a difference in the power generation depending on the torque coefficient, it is very small. However, when the torque coefficient is increased by 200%, the rpm fluctuation of the turbine decreases. In particular, owing to the characteristic of the wave energy, the energy may change rapidly. The larger the torque coefficient, the smaller is the variability of the rpm. Increasing the torque coefficient has an advantage in that it can increase the amount of power generation in terms of the OWC-WEC operation.
Figure 27 shows the result of comparing the output energy per hour of the PTO system in the integrated simulation under the irregular wave (vt = 0~42 m/s, Tp = 4.75 s) condition. The hourly irregular wave input energy is 9.2 kWh, the optimum torque control has the highest power generation, and the hourly power generation energy is 4.04 kWh. Note that 50% and 200% of the optimum torque control coefficient is slightly smaller in terms of power generation energy than the optimal torque control, the 50% torque coefficient is 3.98 kWh, and the 200% torque coefficient is 3.97 kWh. However, owing to the characteristics of the OWC-WEC, the lower the rpm fluctuation, the higher is the operating time can be increased; this will result in a further increase in terms of the overall power generation. In conclusion, the load control of the OWC-WEC may increase in terms of power generation when using a 200% torque factor than the load control that maximizes the efficiency of the turbine.
Figure 28 shows the simulation result of the PTO system according to the torque factor of the diode converter under the condition of the irregular wave (vt = 0~42 m/s and Tp = 4.75 s). Although there is a difference in power generation depending on the torque coefficient, it is very small. The diode converter has a lower load control performance than the PWM converter, and therefore, the rpm fluctuation is larger. Thus, in the case of the diode converter, the turbine efficiency of the load control with a 200% torque coefficient with relatively low rpm variability is the highest.
Figure 29 shows the results of comparing the output energy per hour of the PTO system in the integrated simulation under the irregular wave (vt = 0~42 m/s and Tp = 4.75 s) input condition. Similar to the PWM converter, the irregular wave input energy per hour is 9.2 kWh. However, unlike the PWM converter results, the generated energy of the 200% torque coefficient load control is the largest. This is because the rpm fluctuation is relatively small and the efficiency of the turbine is higher. The power generation of the 200% torque factor load control is 3.54 kWh, the optimum load control is 3.42 kWh, and the 50% torque factor load control is 3.22 kWh. In conclusion, in the case of diode converters, increasing the value of the torque coefficient is more suitable in terms of power generation and operation.

5.5. Comparison of Power Performance according to the Flow Coefficient Range

The input condition of OWC-WEC, there is a part where the flow condition becomes zero in every wave period. That is, in this study, the part that assumes the flow coefficient of the turbine as a specific range (0.3 ≤ |Φ| < 2.5) may exhibit different characteristics from the actual system. Therefore, this part compares and analyzes the load control algorithm and power generation performance according to the flow coefficient range. Through this, it can be confirmed that the performance of the load algorithm proposed in this paper is possible in all flow coefficient ranges.
Figure 30 shows the turbine efficiency graph. As shown in Figure 30, the results of the simulation using the existing flow coefficient range and the overall flow coefficient are compared. The efficiency graph shown in Figure 30 was obtained by extrapolating the efficiency graph obtained through the existing experiment. This can significantly reduce the error with the actual system rather than suggesting the existing flow coefficient range.
Figure 31 shows the turbine system characteristics of the conventional simulation and the modified simulation. Because the existing method limited the range of the flow coefficient of the turbine, it can be confirmed that the flow coefficient does not fall below a certain value (Φ ≤ 0.3). This means that the efficiency of the turbine does not fall below a certain value, so the efficiency may appear higher than that of the actual system. However, since the modified method uses a full range of flow coefficients, it can be seen that the flow coefficient appears to 0 and the efficiency also drops sharply. In other words, since there is a part where the flow rate becomes zero in the actual system, it can be further reduced than the turbine efficiency predicted in this study.
Figure 32 shows the power generation performance of the conventional simulation and the modified simulation. As shown in Figure 31, although the efficiency of the turbine is reduced, there is no significant difference in power generation performance because the part where the flow rate becomes zero is the part where small energy enters. In other words, under the same conditions, the power generation per hour of each simulation is 4.5548 kWh and 4.5543 kWh. Since the existing method used a limited range of the flow coefficient, it shows a slightly higher amount of power generation, but it can be seen that there is little difference.

6. Conclusions

An integrated turbine-generator-power converter was modeled in this study. The load control and output power performance based on the topology of the power converter that directly affects the load control were compared. Further, we analyzed the characteristics of the PTO system and the output power generation characteristics according to the performance of the load control under various flow velocity conditions such as constant velocity conditions, and regular and irregular waves.
The PWM converter showed excellent load control performance under all input energy conditions. This was confirmed based on the performance evaluation in terms of turbine efficiency, RPM fluctuation, and power generation. However, when the input energy was low, even though the load control performance of the diode converter was low, the size of the input energy was small; thus, there was no significant difference in terms of power generation. However, as the input energy increased, the difference in the load control performance increased in terms of the amount of power generation.
In addition, the load control performance according to the change in torque coefficient for MPPT control was compared. The torque factor of the optimal load control was the highest in terms of the amount of power generation; however, to cope with the sudden input energy caused by the characteristics of wave energy, increasing the torque factor of the load control will cause an increase in the operating time and the total amount of power generation. In particular, in the case of diode converters, increasing the torque factor of the load control not only reduces the rpm fluctuation but also increases the amount of power generation.
This study considered various factors affecting load control through the integrated modeling of the PTO system. Through this, the characteristics of the PTO system and the tendency of power generation performance were confirmed. The result will be used as the basic data for the load control design of the OWC-WEC installed in the real sea.
The purpose of this paper was to analyze the load control characteristics of the power converter, so the hydrodynamic characteristics of the turbine and chamber were not fully reflected. As future studies, load control and MPPT studies will be conducted by reflecting the hydrodynamic characteristics of turbines and chambers.

Author Contributions

K.-H.K. and J.-Y.P. managed the project; R.C., K.-W.K. and S.-W.P. performed the numerical simulation and analysis; R.C. drafted the paper; K.-H.K. and S.-S.K. edited the paper. All authors contributed to this study. All authors have read and agreed to the published version of the manuscript.

Funding

This research was supported by a grant from the Endowment Project of “Development of WECAN for the Establishment of Integrated Performance and Structural Safety Analytical Tools of Wave Energy Converter” funded by the Korea Research Institute of Ships and Ocean Engineering (PES3530). All support is gratefully acknowledged.

Conflicts of Interest

The authors declare no conflict of interest.

Abbreviations

The following abbreviations are used in this manuscript:
C A ,   C T Input and torque coefficients
Ac, AtCross-sectional area of the chamber and turbine duct
, opt Flow coefficient and optimal value at the maximum turbine efficiency
ρ a Air density
b t Blade span
l t Chord length of the turbine rotor blade
z Number of turbine rotor blades
P m Mechanical power
P pne Pneumatic incident power
Δ p Pressure drop across the turbine
Q Flow rate
r t Turbine rotor mean radius
v x Airflow speed at the turbine duct
ω m Mechanical angular frequency
T m Mechanical torque
T e Electrical torque
θ m Turbine angular velocity
JInertia of the turbine and generator rotors
V sd ,   V sq d-q voltage of generator
L sd , L sq d-q inductance of generator
i d ,   i q d-q current of generator
Ψ pm Generator flux linkage
ω e Electrical angular frequency
R s Phase resister of generator
P e Electric power
N p Number of generator pole pair
V in Input voltage of DC/DC converter
V out Output voltage of DC/DC converter
D Duty ration for power converter
T Control sampling time for power converter
P opt Output power according to the optimal torque factor
P 50 Output power according to 50% of the optimal torque factor
P 200 Output power according to 200% of the optimal torque factor
TsimulationSimulation sampling time

References

  1. Kester, G.; Clym, S.W. Quantifying the global wave power resource. Renew. Energy 2012, 44, 296–304. [Google Scholar]
  2. Arena, F.; LaFace, V.; Malara, G.; Romolo, A.; Viviano, A.; Fiamma, V.; Sannino, G.; Carillo, A. Wave climate analysis for the design of wave energy harvesters in the Mediterranean Sea. Renew. Energy 2015, 77, 125–141. [Google Scholar] [CrossRef]
  3. Falcão, A.F.D.O.; Henriques, J.C. Oscillating-water-column wave energy converters and air turbines: A review. Renew. Energy 2016, 85, 1391–1424. [Google Scholar] [CrossRef]
  4. Lindroth, S.; Leijon, M. Offshore wave power measurements—A review. Renew. Sustain. Energy Rev. 2011, 15, 4274–4285. [Google Scholar] [CrossRef]
  5. Evans, D.V. Power from Water Waves. Annu. Rev. Fluid Mech. 1981, 13, 157–187. [Google Scholar] [CrossRef]
  6. Falnes, J. Optimum control of oscillation of wave-energy converters. Int. J. Offshore Polar Eng. 2002, 12, 1–12. [Google Scholar]
  7. Falnes, J. Ocean Waves and Oscillating Systems: Linear Interactions Including Wave-Energy Extraction; Cambridge University Press: Cambridge, UK, 2002. [Google Scholar]
  8. Falcão, A.F.D.O.; Sarmento, A.J.; Gato, L.; Crowley, S. The Pico OWC wave power plant: Its lifetime from conception to closure 1986–2018. Appl. Ocean Res. 2020, 98, 102104. [Google Scholar] [CrossRef]
  9. Heath, T.; Whittaker, T.J.T.; Boake, C.B. The design, construction and operation of the LIMPET wave energy converter (Islay, Scotland). In Proceedings of the 4th European Wave Energy Conference, Aalborg, Denmark, 4–6 December 2000; pp. 49–55. [Google Scholar]
  10. Zhang, D.; Li, W.; Lin, Y. Wave energy in China: Current status and perspectives. Renew. Energy 2009, 34, 2089–2092. [Google Scholar] [CrossRef]
  11. Gomes, R.; Henriques, J.; Gato, L.; Falcão, A. Hydrodynamic optimization of an axisymmetric floating oscillating water column for wave energy conversion. Renew. Energy 2012, 44, 328–339. [Google Scholar] [CrossRef]
  12. Falcão, A.F.D.O.; Henriques, J.C.; Cândido, J.J. Dynamics and optimization of the OWC spar buoy wave energy converter. Renew. Energy 2012, 48, 369–381. [Google Scholar] [CrossRef]
  13. McCormick, M.E. A Theoretical Analysis of a Self-Propelled Backward-Bent Duct Wave Energy Conversion System. J. Energy Resour. Technol. 1991, 113, 94–100. [Google Scholar] [CrossRef]
  14. Hong, D.; Hong, S. Numerical study on the reverse drift force of floating BBDB wave energy absorbers. Ocean Eng. 2004, 31, 1257–1294. [Google Scholar] [CrossRef]
  15. Washio, Y.; Osawa, H.; Nagata, Y.; Fujii, F.; Furuyama, H.; Fujita, T. The offshore floating type wave power device “Mighty Whale”: Open sea tests. In Proceedings of the Tenth International Offshore and Polar Engineering Conference, Seattle, WA, USA, 28 May–2 July 2000; pp. 373–380. [Google Scholar]
  16. Jefferys, R.; Whittaker, T.; Falcão, A.F.D.O. Latching control of an oscillating water column device with air compressibility. In Hydrodynamics of Ocean Wave-Energy Utilization; Springer: Berlin, Germany, 1986; pp. 281–291. [Google Scholar]
  17. Hoskin, R.E.; Count, B.M.; Nichols, N.K.; Nicol, D.A.C.; Falcão, A.F.D.O. Phase Control for the Oscillating Water Column. In Hydrodynamics of Ocean Wave-Energy Utilization; Springer: Berlin, Germany, 1986; pp. 257–268. [Google Scholar]
  18. Falcão, A.F.D.O.; Henriques, J.; Gato, L.; Gomes, R.P.F. Air turbine choice and optimization for floating oscillating-water-column wave energy converter. Ocean Eng. 2014, 75, 148–156. [Google Scholar] [CrossRef]
  19. Falcão, A.F.D.O.; Rodrigues, R. Stochastic modelling of OWC wave power plant performance. Appl. Ocean Res. 2002, 24, 59–71. [Google Scholar] [CrossRef]
  20. Falcão, A.F.D.O. Control of an oscillating-water-column wave power plant for maximum energy production. Appl. Ocean Res. 2002, 24, 73–82. [Google Scholar] [CrossRef]
  21. Song, S.K.; Park, J.B. Control Strategy of an Impulse Turbine for an Oscillating Water Column-Wave Energy Converter in Time-Domain Using Lyapunov Stability Method. Appl. Sci. 2016, 6, 281. [Google Scholar] [CrossRef] [Green Version]
  22. Yu, Z.; Jiang, N.; You, Y. Load control method and its realization on an OWC wave power converter. In OMAE; ASME: New York, NY, USA, 1994; Volume 1. [Google Scholar]
  23. Justino, P.A.P.; Falcão, A.F.D.O. Rotational Speed Control of an OWC Wave Power Plant. J. Offshore Mech. Arct. Eng. 1999, 121, 65–70. [Google Scholar] [CrossRef]
  24. Falcão, A.F.D.O.; Henriques, J.; Gato, L. Rotational speed control and electrical rated power of an oscillating-water-column wave energy converter. Energy 2017, 120, 253–261. [Google Scholar] [CrossRef]
  25. Amundarain, M.; Alberdi, M.; Garrido, A.; Garrido, I. Neural rotational speed control for wave energy converters. Int. J. Control. 2011, 84, 293–309. [Google Scholar] [CrossRef]
  26. Mishra, S.K.; Purwar, S.; Kishor, N. An optimal and non-linear speed control of oscillating water column wave energy plant with wells turbine and DFIG. Int. J. Renew. Energy Res. 2016, 6, 995–1006. [Google Scholar]
  27. Mishra, S.K.; Purwar, S.; Kishor, N. Event-triggered nonlinear control of OWC ocean wave energy plant. IEEE Trans. Sustain. Energy 2018, 9, 1750–1760. [Google Scholar] [CrossRef]
  28. Henriques, J.; Lemos, J.M.; Eça, L.; Gato, L.M.; Falcão, A.F.D.O. A high-order Discontinuous Galerkin Method with mesh refinement for optimal control. Automatica 2017, 85, 70–82. [Google Scholar] [CrossRef]
  29. Vicinanza, D.; Di Lauro, E.; Contestabile, P.; Gisonni, C.; Lara, J.L.; Losada, I.J. Review of Innovative Harbor Breakwaters for Wave-Energy Conversion. J. Waterw. Port Coast. Ocean Eng. 2019, 145, 03119001. [Google Scholar] [CrossRef]
  30. Carrelhas, A.; Gato, L.; Henriques, J.; Falcão, A.; Varandas, J. Test results of a 30 kW self-rectifying biradial air turbine-generator prototype. Renew. Sustain. Energy Rev. 2019, 109, 187–198. [Google Scholar] [CrossRef]
  31. Kim, S.H.; Ryu, W.J.; Shin, S.H.; Hong, K.Y.; Kim, Y.D.; Kim, G.W. Application of the Orifice as A Turbine Substitute of OWC Wave Energy Converter. Available online: http://www.dbpia.co.kr/Article/NODE02040148 (accessed on 28 September 2016).
  32. Ma, M.; Liu, X.; Lee, K.Y. Maximum Power Point Tracking and Voltage Regulation of Two-Stage Grid-Tied PV System Based on Model Predictive Control. Energies 2020, 13, 1304. [Google Scholar] [CrossRef] [Green Version]
  33. Markel, P.; John, V.R. A review of wave-to-wire models for wave energy converters. Energies 2016, 9, 506. [Google Scholar]
  34. Huang, H.; Mao, C.; Lu, J.; Wang, D. Small-signal modelling and analysis of wind turbine with direct drive permanent magnet synchronous generator connected to power grid. IET Renew. Power Gener. 2012, 6, 48–58. [Google Scholar] [CrossRef]
Figure 1. Model of the oscillating water column (OWC).
Energies 13 06415 g001
Figure 2. Turbine characteristics: (a) Input and torque coefficients; (b) turbine efficiency.
Energies 13 06415 g002
Figure 3. Power converter topologies for wave energy converter: (a) Diode converter; (b) PWM converter.
Energies 13 06415 g003
Figure 4. Block diagram of DC/DC boost converter.
Energies 13 06415 g004
Figure 5. Block diagram of PWM converter for generator side.
Energies 13 06415 g005
Figure 6. (a) Mechanical/electrical torque of the diode converter; (b) Mechanical/electrical torque of the PWM converter; (c) Electric power; (d) Turbine angular velocity depending on load control performance.
Energies 13 06415 g006
Figure 7. Power curve of OWC-WEC.
Energies 13 06415 g007
Figure 8. (a) Angular velocity and mechanical output characteristic curve according to flow velocity; (b) Angular velocity and turbine efficiency.
Energies 13 06415 g008
Figure 9. Relationship between angular speed and power generation according to the coefficient change of the MPPT curve.
Energies 13 06415 g009
Figure 10. OWC-WEC PTO System integrated simulation configuration diagram.
Energies 13 06415 g010
Figure 11. Power result of PTO system in integrated simulation for steady and transient state at constant input flow velocity from 14 m/s to 28 m/s: (a) Diode converter, (b) PWM converter, (c) Comparison of power performance according to topology.
Energies 13 06415 g011aEnergies 13 06415 g011b
Figure 12. Turbine performance results of a PTO system in integrated simulation during steady and transient conditions at a constant input flow velocity form 14 m/s to 28 m/s.
Energies 13 06415 g012
Figure 13. Comparison of output energy of PTO system in integrated simulation at constant input flow velocity from 14 m/s to 28 m/s.
Energies 13 06415 g013
Figure 14. The flow velocity of the turbine(vt), flow rate, and pressure of the turbine. Under the input regular wave condition (a) vt = 0~5 m/s and T = 4.25 s; (b) vt = 0~35 m/s and T = 4.75 s.
Energies 13 06415 g014
Figure 15. Power performance results of the PTO system in the integrated simulation under the low regular wave condition (vt = 0~5 m/s and T = 4.25 s): (a) Diode converter; (b) PWM converter; (c) Comparison of power performance according to topology.
Energies 13 06415 g015aEnergies 13 06415 g015b
Figure 16. Comparison of turbine performance results using the PTO system in an integrated simulation at low regular wave conditions (vt = 0~5 m/s and T = 4.25 s).
Energies 13 06415 g016
Figure 17. Output energy comparison using PTO system in integrated simulation at low regular wave conditions (vt = 0~5 m/s and T = 4.25 s).
Energies 13 06415 g017
Figure 18. Power generation result using the integrated simulation of the PTO system under high regular wave conditions (vt = 0~35 m/s and T = 4.75 s): (a) Diode converter; (b) PWM converter; (c) Power performance comparison according to topology.
Energies 13 06415 g018aEnergies 13 06415 g018b
Figure 19. Turbine performance comparison using PTO system in integrated simulation under high regular wave conditions (vt = 0~35 m/s and T = 4.75 s).
Energies 13 06415 g019
Figure 20. Output energy comparison using integrated simulation of PTO system under high regular wave conditions (vt = 0~35 m/s and T = 4.75 s).
Energies 13 06415 g020
Figure 21. Water level in the OWC chamber, turbine flow velocity, turbine flow rate, and pressure in the condition of input irregular wave (vt = 0~30 m/s and Tp = 4.75 s).
Energies 13 06415 g021
Figure 22. Power generation result of the PTO system in an integrated simulation under irregular wave conditions (vt = 0~30 m/s and Tp = 4.75 s): (a) Diode converter; (b) PWM converter; (c) Comparison of power generation performance according to topology.
Energies 13 06415 g022aEnergies 13 06415 g022b
Figure 23. Turbine performance results of PTO system in the integration simulation under irregular waves (vt = 0~30 m/s and Tp = 4.75 s).
Energies 13 06415 g023
Figure 24. Output energy comparison of PTO system integrated simulation under irregular wave (vt = 0~30 m/s and Tp = 4.75 s).
Energies 13 06415 g024
Figure 25. Water level in the OWC chamber, turbine flow rate, and turbine flow rate and pressure in irregular wave (vt = 0~42 m/s and Tp = 4.75 s) input condition.
Energies 13 06415 g025
Figure 26. PTO system results in integrated simulation according to the torque factor of PWM converter under irregular wave (vt = 0~42 m/s and Tp = 4.75 s) input conditions: Input instantaneous power generation, mechanical instantaneous power generation, electrical instantaneous power generation, turbine rpm, and efficiency.
Energies 13 06415 g026
Figure 27. Output energy results of the PTO system in integrated simulation according to the torque factor of load control under irregular wave (vt = 0~42 m/s and Tp = 4.75 s) input condition.
Energies 13 06415 g027
Figure 28. PTO system results in integrated simulation according to the torque factor of diode converter under irregular wave (vt = 0~42 m/s and Tp = 4.75 s) conditions: Input instantaneous power generation, mechanical instantaneous power generation, electrical instantaneous power generation, turbine rpm, and efficiency.
Energies 13 06415 g028
Figure 29. Output energy results of PTO system in integrated simulation according to the torque factor of load control under irregular wave (vt = 0~42 m/s and Tp = 4.75 s).
Energies 13 06415 g029
Figure 30. Turbine efficiency curve (0 ≤ |Φ| < 3).
Energies 13 06415 g030
Figure 31. Simulation comparison results of turbine system about flow coefficient(|Φ|), efficiency and rotation speed according to flow coefficient range change under irregular wave (vt = 0~42 m/s and Tp = 4.75 s) input condition.
Energies 13 06415 g031
Figure 32. Power generation performance comparison results according to flow coefficient range change under irregular wave (vt = 0~42 m/s and Tp = 4.75 s) input condition.
Energies 13 06415 g032aEnergies 13 06415 g032b
Table 1. Parameters and values in the simulations.
ParameterValueUnit
Ac36m2
ηc50%
At0.25635m2
bt0.12m
lt0.16m
nt30
rt0.34m
J32.12kg m2
ρa1.226kg/m3
opt1
Np28pole
ωrate800rpm
Vp.rate306.8V
Prate30kW
Tsimulation5µsec
Publisher’s Note: MDPI stays neutral with regard to jurisdictional claims in published maps and institutional affiliations.

