Article

Behavior of Piston Wind Induced by Braking Train in a Tunnel

1
Key Laboratory of Transportation Tunnel Engineering, Ministry of Education, Southwest Jiaotong University, Chengdu 610031, China
2
School of Civil Engineering, Southwest Jiaotong University, Chengdu 610031, China
3
Sichuan Communication Surveying & Design Institute, Chengdu 610031, China
*
Authors to whom correspondence should be addressed.
Energies 2020, 13(23), 6420; https://doi.org/10.3390/en13236420
Submission received: 12 November 2020 / Revised: 27 November 2020 / Accepted: 2 December 2020 / Published: 4 December 2020

Abstract

:
It is critical to discover the behavior of piston wind induced by a braking train in a tunnel, but there is little research on the theoretical derivation for piston wind behavior. Predicting piston wind behavior as an unsteady airflow by a theoretical formula is hard work due to the complexity of train running states and airflow fields. Herein, we develop a mathematical model to investigate the behavior of piston wind as an unsteady airflow, considering the variation of wind direction in the annular area. In general, the theoretical model is validated by experiments. However, experimental studies about piston wind are scarce. In this study, we simulated the emergent braking process of a train to validate the mathematical model by establishing a 1/50 scaled experimental configuration. The piston wind data tested in the experiment have good agreement with the results calculated by theoretical formulas. In addition, sensitivity analysis of the effect parameters of piston wind (i.e., tunnel length, train length, train speed and blockage ratio) was conducted. The theoretical formulas derived in this paper are applicable to similar train running conditions in railway tunnels or subway tunnels.

1. Introduction

A moving train is the pressure source of the piston effect in a tunnel. The pressure source causes the redistribution of flow field in the tunnel. Effectively utilizing piston wind is conducive to the tunnel environment and energy saving [1,2,3]. In addition, piston wind has a significant effect on the smoke flow in a tunnel, especially in the rescue station after a train stops there [4]. In order to ventilate the evacuation area appropriately, it is critical to discover the piston wind behavior of the urgent process of the train’s braking to the rescue station.
Theoretical formulas are very effective to predict piston wind behavior. However, deducing the theoretical formula of unsteady flow is extremely difficult due to the complexity of train running states and airflow fields; as a result, there is little research on theoretical derivations for piston wind. Tong et al. [5] obtained a theoretical formula for the mean air velocity of the roof opening in urban vehicular tunnels based on energy conservation and mass conservation. Nevertheless, they did not deduce a prediction formula for piston wind in a main tunnel. Wang et al. [6] proposed a theoretical model to calculate piston wind on a subway platform but did not focus on piston wind in the entire tunnel. Zhang et al. [7] developed mathematical equations to calculate the piston wind velocity in a metro tunnel and contrasted their results with experimental data from the literature. However, they did not consider the variation of wind direction in the annular area, and their mathematical model was entirely based on the experimental model from the literature, which has limitations for theoretical deduction. Currently, theoretical research on piston wind is incomplete.
The airflow field can be accurately simulated by CFD software. [8,9]. In early studies, researchers simulated the airflow field of the piston wind in tunnels by solving Navier–Stokes equations [10,11,12]. The dynamic mesh technique in Fluent can realize the train’s movement in the numerical simulation, so researchers adopted it to predict the airflow induced by the moving train in a tunnel [13,14,15,16,17]. In addition, Liu et al. [18] used a two-dimensional model to simulate and study the three-dimensional flow of piston wind in a tunnel. A great deal of research shows that the piston effect greatly influences comfort, efficiency of the ventilation system and energy savings [19,20,21]. Furthermore, the blockage ratio, tunnel length, train length and train velocity influence the behavior of the unsteady airflow generated by train movement and the smoke characteristics under fire conditions [22,23,24]. In general, numerical simulation methods have been extensively utilized to investigate piston wind characteristics, nevertheless, the method generally requires a large number of grids, high-performance computer configurations, highly qualified technical personnel and a long calculation time.
Experiments are effective at verifying the reliability of theoretical methods and numerical simulation methods [25,26]. However, experimental studies on piston wind are not very comprehensive since it is extremely difficult to operate an urgently braking train in an experiment to induce piston wind. Chen et al. [27] researched the piston effect on tunnel ventilation in a 1/20 scaled tunnel and discovered that the airflow field weakly relies on the vehicle velocity, spacing and size. Kim and Kim [28] discovered the behavior of pressure and wind by conducting an experimental analysis of piston wind in a 1/20 scaled model tunnel. Gilbert et al. [29] tested the three-dimensional wind velocity components at numerous positions inside a 1/25 scaled experiment and found that the tunnel length had a considerable effect on the flow characteristics. Xue et al. [30] utilized experimental data and the CFD method to research the unstable wind in a subway station and tunnel. Ma et al. [31] developed a one-dimensional model using the IDA Simulation Environment based on an actual metro line and tested the wind velocity in the actual tunnel to validate the results. Liu et al. [32] created a 1/16 scaled subway tunnel model to develop and validate a three-dimensional computational model. Krasyuk et al. [33] carried out a field measurement of piston wind in an actual subway and refined the network calculation model based on the measured results.
These studies on piston wind in high-speed railway tunnels and subway tunnels have some shortcomings. Most scholars have studied piston wind in single-tube tunnels at a fixed speed and the calculation model is generally short, but this cannot represent piston wind behavior in most extra-long tunnels. In addition, research on piston wind behavior in tunnels has not been conducted in the circumstance of a train urgently running to a rescue station in an extra-long railway tunnel.
This paper aims to provide a theoretical method to uncover piston wind behavior induced by a train’s urgent braking to a rescue station in a railway tunnel. Herein, we develop a mathematical model to calculate the piston wind velocity during the emergent process that considers the variation of wind direction in the annular area. We realize the emergent running process of the train to validate the mathematical model by establishing a 1/50 geometric scale experimental configuration that is 65 m long with a circular cross-section. A sensitivity analysis for effect parameters was also carried out. The results offer a beneficial reference for tunnel ventilation design. The results can also be applied to a subway tunnel because the running states of the train in this paper are the same as those of a train in a subway tunnel.

2. Theoretical Model

Piston wind in a railway tunnel is formed by the head of the train pushing the air, the rear of the train pulling the air and the constraint of the tunnel wall [34,35]. The piston wind in the tunnel is the result of the pressure source induced by the running train, and its initial direction is the same as that of the running train. There are two methods to calculate the analytical solution for piston wind in tunnels: piston wind is regarded as a constant airflow or an unsteady airflow. For convenience in calculation, many researchers have calculated piston wind as a steady airflow. Nevertheless, for a long tunnel, piston wind velocity gradually converges to a certain value as train velocity is stable and the airflow gradually reaches a steady state, that is, piston wind induced by the running train varies with time. Thus, piston wind should be calculated as an unsteady airflow.

2.1. Assumptions

As cross-passage doors are closed, the process of a train running to a rescue station can be regarded as the process by which a train runs to and stops in the middle of a single tube. According to train running states and locations, the process can be simplified into four phases, as shown in Figure 1:
(1)
Entering tunnel: the train travels into the tunnel; its velocity is unchanged.
(2)
Uniform motion: the whole train is traveling in the tunnel; its velocity is unchanged.
(3)
Uniformly decelerated motion: the train decelerates in the tunnel at a constant deceleration.
(4)
Stationary: the piston wind decays gradually after the train stops.
The above phase division is based on the following conditions:
(1)
The piston wind in the tunnel is considered a one-dimensional unsteady airflow. As the Mach number of the piston wind is less than 0.3, it can be considered an incompressible flow [36].
(2)
The cross-passage doors are closed.
(3)
The variation of the cross-section area of the main tunnel is ignored.
(4)
The natural wind is ignored, i.e., the initial wind velocity in the tunnel is zero.
(5)
In the decelerated motion phase, the deceleration of the train is constant.
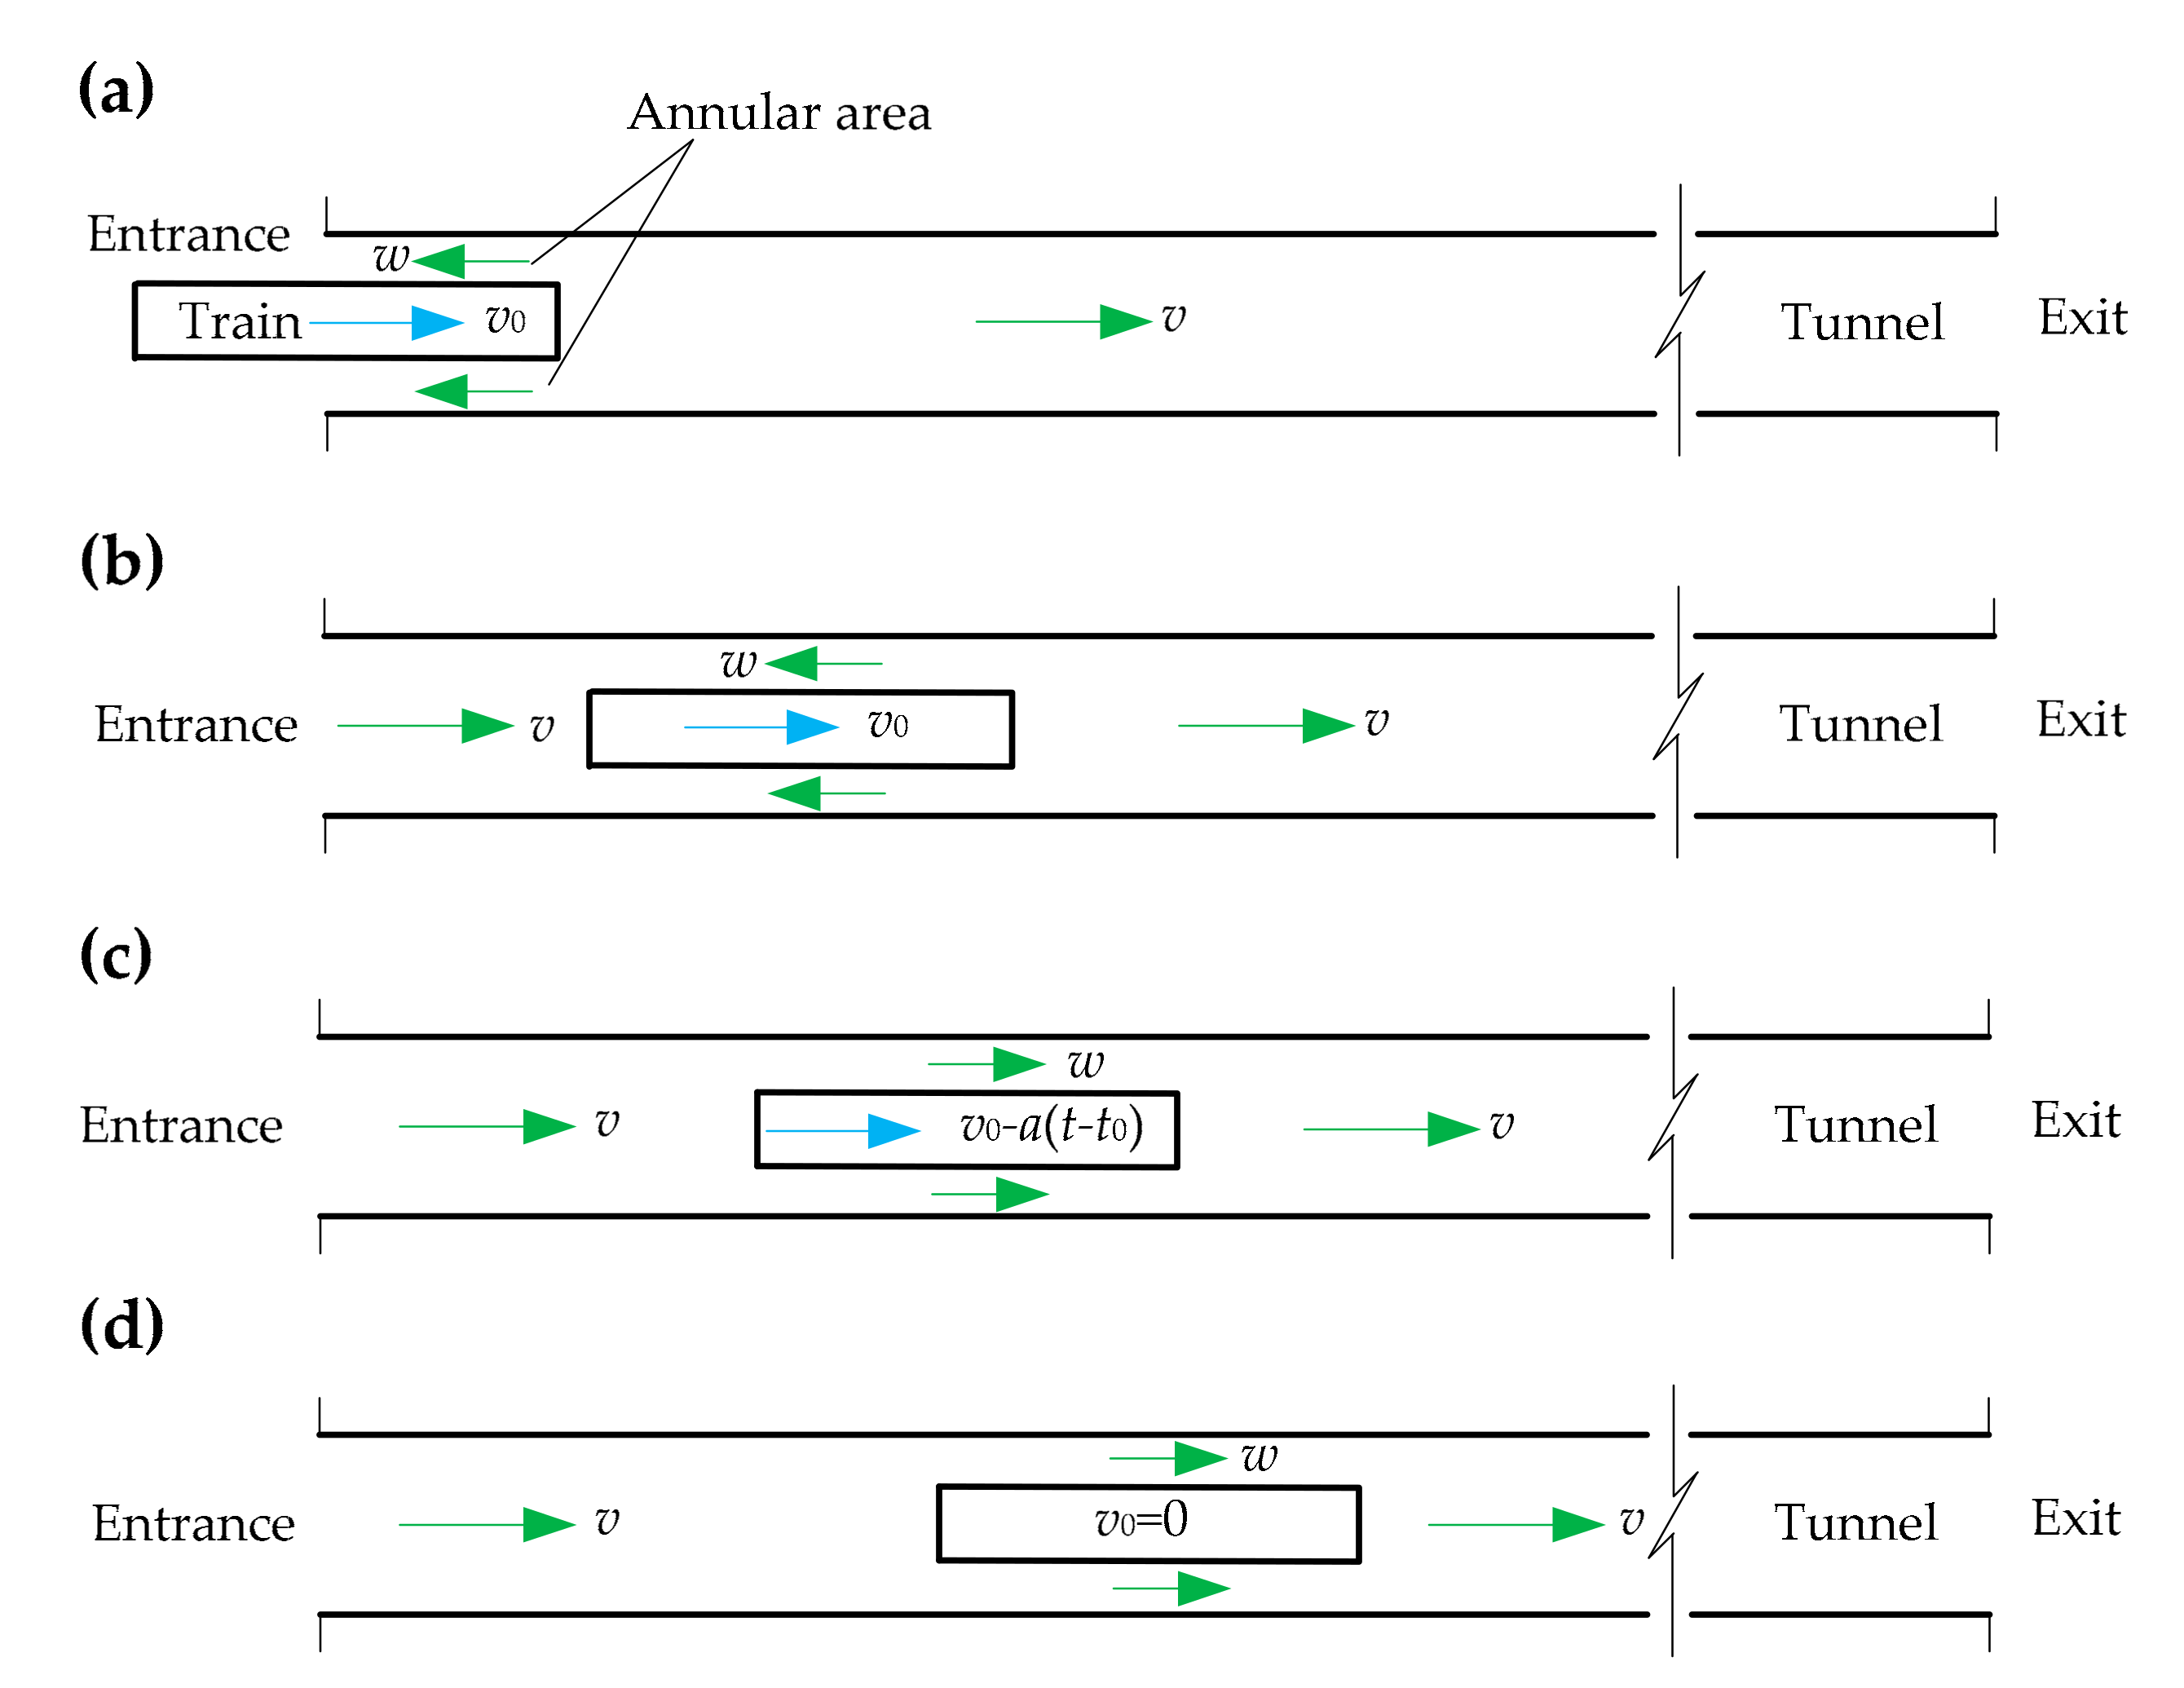
Figure 1. The process of a train urgently running to a rescue station. (a) Entering tunnel. (b) Uniform motion. (c) Uniformly decelerated motion. (d) Stationary.
Energies 13 06420 g001

2.2. Basic Equations

2.2.1. Bernoulli’s Principle

In this paper, the derivation for the behavior of piston wind as an unsteady flow is based on Bernoulli’s equation. Between cross-section i and cross-section j, Bernoulli’s equation can be expressed as follows:
v i 2 2 + p i ρ + g Z i = v j 2 2 + p j ρ + g Z j + h f i j + j i γ V t d S
where v i indicates the mean air velocity of the cross-section i (m/s); v i indicates the mean air velocity of the cross-section j (m/s); p i indicates the air pressure of the cross-section i (Pa); p j indicates the air pressure of the cross-section j (Pa); Z i indicates the altitude of the cross-section i (m); Z j indicates the altitude of the cross-section j (m); ρ indicates the air density (kg/m3); g indicates the gravity acceleration (m/s−2); h f i j indicates the drag loss from cross-section i to cross-section j (m2/s2); j i γ V t d S indicates the inertia head for unit mass fluid; γ indicates the modified coefficient of uneven airflow, which is 1 in this paper; S indicates the distance from cross-section i to cross-section j (m); t indicates time (s) and V indicates air velocity (m/s).
For the annular area, the air velocity should be the relative velocity between the wind and the train.

2.2.2. Continuity Equation

The train surface and tunnel wall form an annular area. The wind direction in the annular area varies depending on the train’s running state. Within time d t , the air volume squeezed out by the running train is A 0 v 0 d t . It flows in two parts: one is pushed out from the tunnel by the running train ( A T v d t ), and the other is squeezed into the annular area that flows to the train’s rear ( A T A 0 w d t ). The continuity equation is
A T v d t + A T A 0 w d t = A 0 v 0 d t
where A T is the tunnel’s cross-sectional area (m2); A 0 is the train’s cross-sectional area (m2); v is the wind velocity in the non-train area (i.e., piston wind velocity) (m/s); w is the wind velocity in the annular area (m/s), and v 0 is train velocity (m/s).

2.3. Theoretical Derivation for Piston Wind

2.3.1. Entering Tunnel Phase

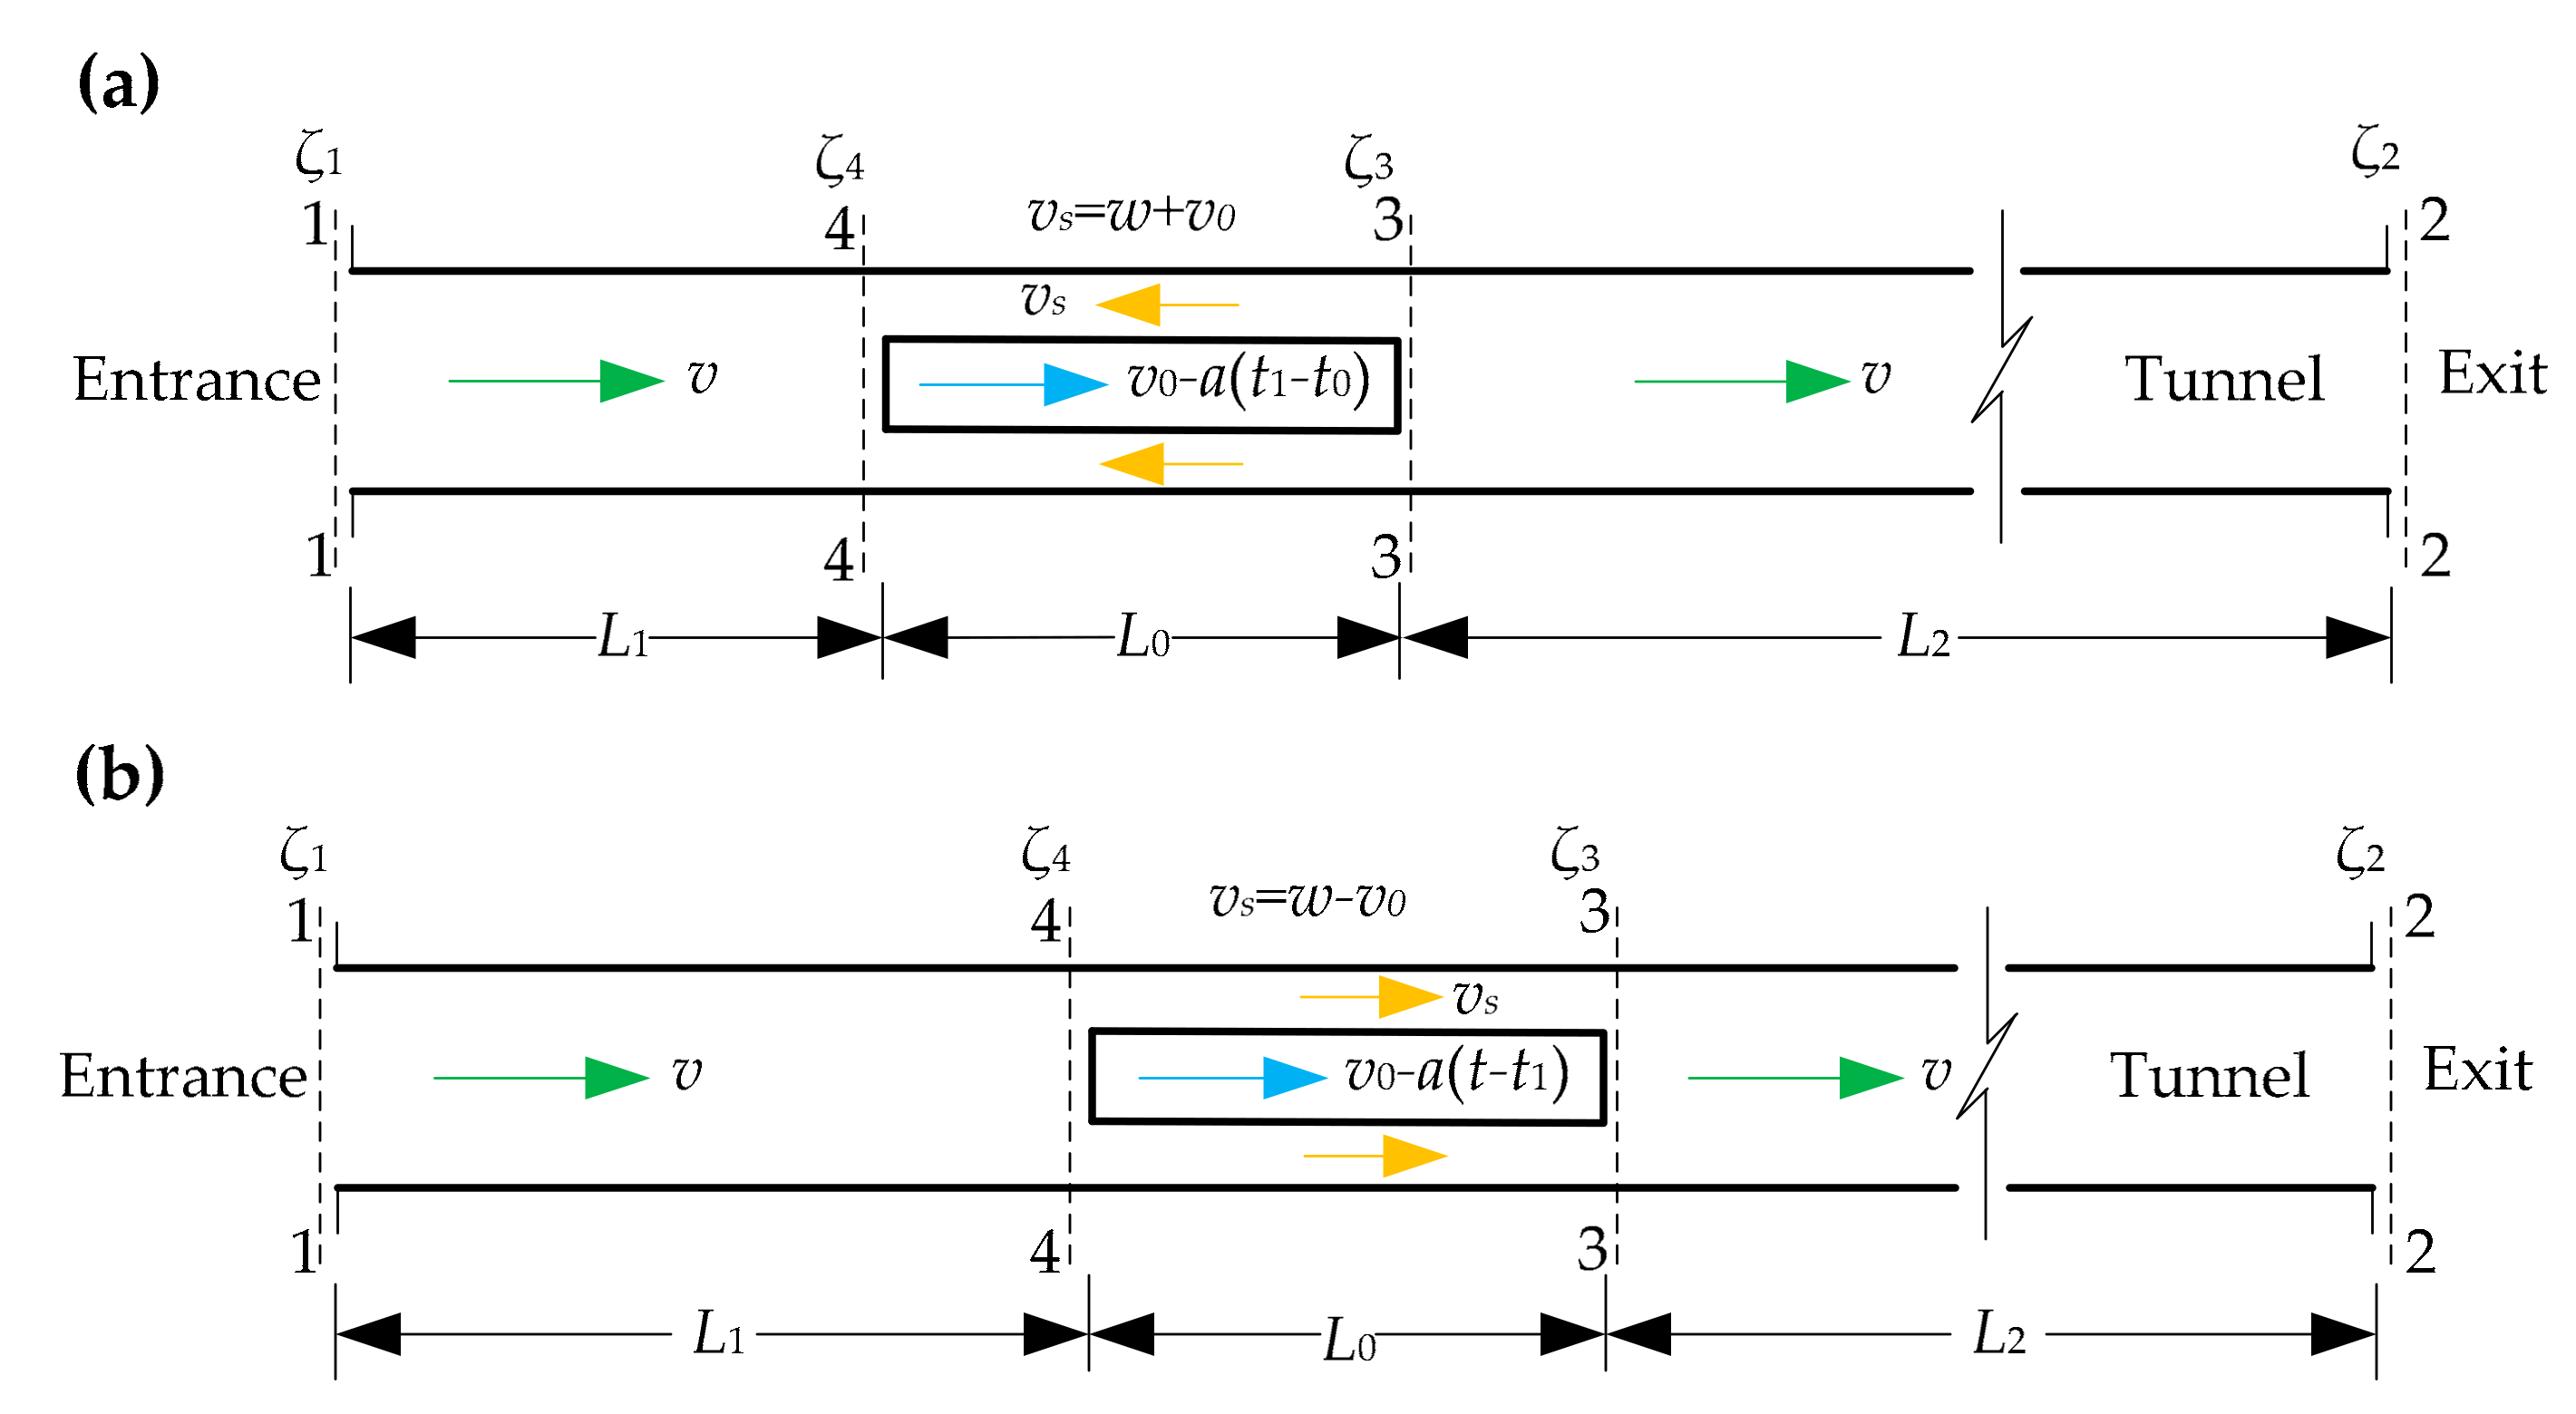
In the entering tunnel phase, the train runs at a constant velocity ( v 0 ), and the wind in the annular area flows relatively from the train’s head to the train’s rear, as shown in Figure 2. Applying Bernoulli’s principle for the wind’s relative movement between cross-sections 1–1 and 3–3:
v v 0 2 2 + p 3 ρ = p a ρ + ζ 3 + λ 0 l 0 D 0 + ζ 0 v s 2 2 + l 0 d v s d t
where cross-section 1–1 is the tunnel entrance and cross-section 3–3 is always in front of the train’s head; p 3 is the air pressure of cross-section 3–3 (Pa); p a is atmospheric pressure outside of the tunnel (Pa); ζ 3 is the local loss coefficient of cross-section 3–3; ζ 0 is the local loss coefficient of the wind in the annular area that flows to the tunnel entrance; λ 0 is the frictional loss coefficient along the annular area; D 0 is the equivalent diameter of the annular area (m); l 0 is the train length in the tunnel (m), l 0 = v 0 t ; v s is the relative velocity between the wind and the train in the annular area [m/s], it can be expressed as follows by combining Equation (2):
v s = w + v 0 = v 0 v 1 β
where β is the blockage ratio, β = A 0 / A T .
Bernoulli’s equation for the wind’s movement between cross-sections 2–2 and 3–3 can be expressed as:
v 2 2 + p 3 ρ = p a ρ + ζ 2 + λ L l 0 D T v 2 2 + L l 0 d v d t
where cross-section 2–2 is the tunnel exit; ζ 2 is the local loss coefficient at the tunnel exit; L is tunnel length (m); λ is the frictional loss coefficient along the tunnel and D T is the equivalent diameter of the tunnel (m).
The following equation can be obtained by combining Equations (3)–(5):
d v d t = A t v 2 B t v + C t t ϵ 0 , L 0 v 0 v 0 = 0
where A t = N v 0 t / 1 β 2 λ L v 0 t / D T ζ 2 / 2 L + 2 β v 0 t / 1 β ; B t = N v 0 2 t / 1 β 2 v 0 / L + β v 0 t / 1 β ; C t = N v 0 3 t / 1 β 2 v 0 2 / 2 L + 2 β v 0 t / 1 β ; N is the train resistance coefficient, N l 0 = ζ 3 + λ 0 l 0 / D 0 + ζ 0 and N = 0.807 β 2 1.332 β + 1.008 + λ 0 l 0 / D 0 / L 0 [37], and L 0 is train length (m).

2.3.2. Uniform Motion Phase

In this phase, the whole train is inside the tunnel, and it travels at constant velocity v 0 . In the uniform motion prophase, the wind in the annular area flows relatively from the train’s head to the train’s rear, as shown in Figure 3.
Applying Bernoulli’s principle for the wind’s movement between cross-sections 1–1 and 4–4:
p a ρ = v 2 2 + p 4 ρ + ζ 1 + λ l 1 D T v 2 2 + L 1 d v d t
where cross-section 4–4 is always behind the train’s rear; p 4 is the air pressure of cross-section 4–4, which is always behind the train (Pa); ζ 1 is the local loss coefficient at the tunnel entrance and L 1 is the distance from the tunnel entrance to the train’s rear (m).
Applying Bernoulli’s principle for the wind’s movement between cross-sections 2–2 and 3–3:
v 2 2 + p 3 ρ = p a ρ + ζ 2 + λ l 2 D T v 2 2 + L 2 d v d t
where L 2 is the distance from the tunnel exit to the train head [m].
Applying Bernoulli’s principle for the wind’s relative movement between cross-sections 3–3 and 4–4:
v v 0 2 2 + p 3 ρ = v v 0 2 2 + p 4 ρ + N L 0 v s 2 2 + L 0 d v s d t
where v s is still expressed as Equation (4) in the uniform motion prophase. In the late phase of uniform motion, the wind in the annular area has the same direction as the running train ( β v 0 < v < v 0 ). Equation (4) changes to be:
v s = w v 0 = v 0 v 1 β
The following equation can be obtained by combining Equations (7)–(10):
d v d t = A v 2 + B v + C t ϵ L 0 v 0 , t 0
where A = K ζ t / 2 L + 2 α L 0 / 1 β ; B = K v 0 / L + β L 0 / 1 β ; C = K v 0 2 / 2 L + 2 β L 0 / 1 β ; K is the impact factor of piston wind, K = N L 0 / 1 β 2 ; ζ t is the local loss coefficient of non-annular area in the tunnel, ζ t = ζ 1 + ζ 2 + λ L l 0 / D T and t 0 is the time when the train begins to decelerate (s).

2.3.3. Uniformly Decelerated Motion Phase

In this phase, the deceleration is a and the train’s velocity is v 0 a t t 0 . Bernoulli’s equations are the same as Equations (7)–(9). However, the results will change with the variation of v s .

The Prophase of Uniformly Decelerated Motion

The wind in the annular area has the same direction as the running train but flows relatively from the train’s head to the train’s rear, as shown in Figure 4a. The relative velocity can be expressed as:
v s = v 0 a t t 0 v 1 β
where a is the rate of deceleration for the train (m/s2).
The following equation can be obtained by combining Equations (7)–(9) and (12):
d v d t = A v 2 + B t v + C t t ϵ t 0 , t 1 v t = t 0 = v t 0
where A = K ζ t / 2 L + 2 β L 0 / 1 β ; B t = K v 0 a t t 0 / L + β L 0 / 1 β ; C t = K v 0 a t t 0 2 2 a L 0 / 1 β / 2 L + 2 β L 0 / 1 β ; t 1 is the time when the train’s velocity equals the piston wind velocityand v t 0 can be obtained from Equation (11).

The Late Phase of Uniformly Decelerated Motion

The wind in the annular area has the same direction as the running train but flows relatively from the train’s rear to the train’s head ( v > v 0 ), as shown in Figure 4b. The relative velocity can be expressed as:
v s = v + a t t 0 v 0 1 β
Equation (9) changes to be:
v v 0 2 2 + p 4 ρ = v v 0 2 2 + p 3 ρ + N L 0 v s 2 2 + L 0 d v s d t
The following equation can be obtained by combining Equations (7), (8), (14) and (15):
d v d t = A v 2 + B t v + C t t ϵ t 1 , t 0 + v 0 a v t = t 1 = v t 1
where A = K + ζ t / 2 L + 2 β L 0 / 1 β ; B t = K v 0 a t t 0 / L + β L 0 / 1 β and C t = K v 0 a t t 0 2 + 2 a L 0 / 1 β / 2 L + 2 β L 0 / 1 β .

2.3.4. Stationary Phase

In this phase, the train stops. The piston wind continues to flow due to inertia, and its velocity decays gradually due to the loss of friction in the tunnel, as shown in Figure 5. Bernoulli’s equations are the same as Equations (7), (8) and (15). The relative velocity of the wind in the annular area can be expressed as:
v s = v 1 β
The following equation can be obtained by combining Equations (7), (8), (15) and (17):
d v d t = A v 2 t ϵ t 0 + v 0 a ,   + v t = t 0 + v 0 a = v t 0 + v 0 a
where A = K + ζ t / 2 L + 2 β L 0 / 1 β .

3. Experiment Verification

3.1. Experiment Configuration

3.1.1. Similarity Scale

Model tests are a vital part of practical engineering. An experimental configuration based on an actual railway tunnel is created with the geometric scale 1/50. The Reynolds similarity is not suitable to this experiment. The Reynolds number is expressed as:
R e = ρ v d μ
where μ is the viscosity coefficient of fluid and d is the length of the fluid.
In both the practical tunnel and the experimental model, ρ and μ are considered standard values. Therefore, the velocity scale will reach 50/1 if the Reynolds number is to be maintained. Obviously, it is impractical to achieve 1666.5 m/s in a model test corresponding to an actual train velocity of 120 km/h (a typical velocity). In the low-velocity experiment, as long as there is no local supersonic region, the Reynolds number mainly affects the friction resistance and has no effect on the flow pattern of the fluid. In this experiment, the frictional loss is not the main research object, so the Reynolds similarity can be ignored.
Based on the Strouhal number (Equation (20)) and the practical conditions of the test, the similarity scales in this experiment are shown in Table 1.
S t = v t d

3.1.2. Experimental Apparatus

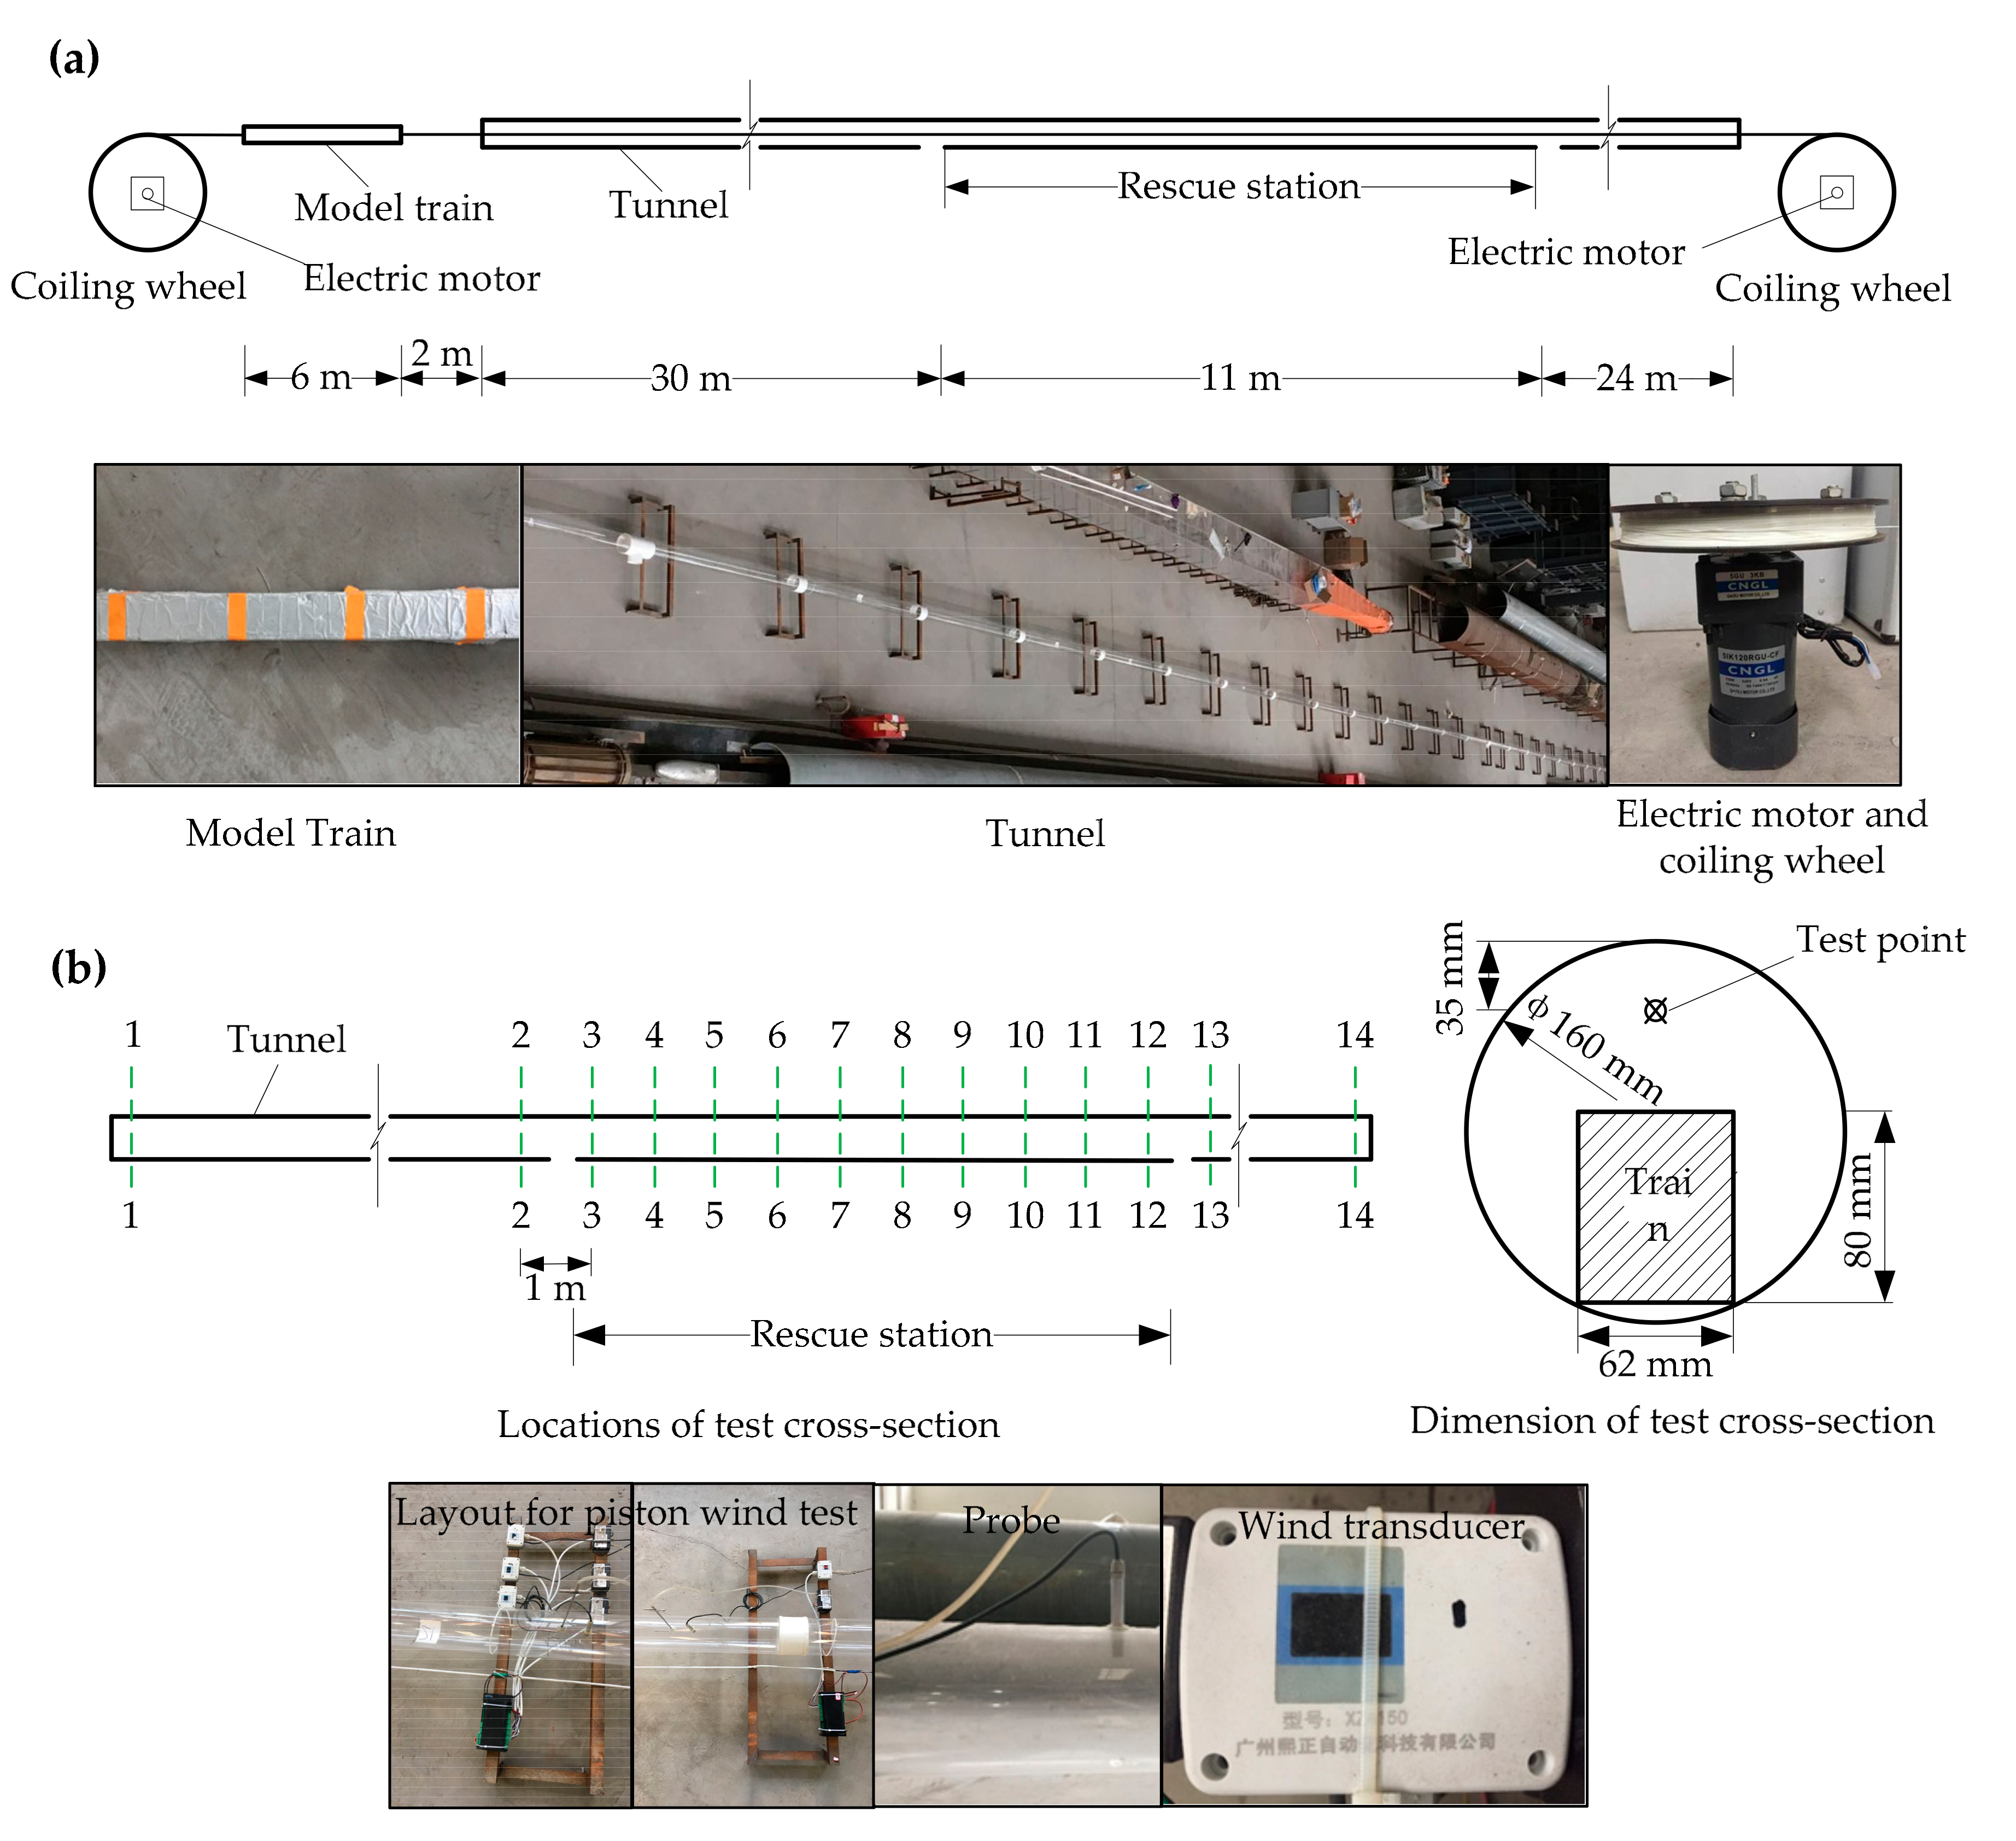
As displayed in Figure 6a, the experimental configuration is composed of a model train, a model tunnel, an electric motor and two coiling wheels. The tunnel length is 65 m: the rescue station is 11 m long, the tunnel in front of the rescue station is 30 m long and the tunnel behind the rescue station is 24 m long. The cross-section of the tunnel is circular, with a diameter of 160 mm. The tunnel is made up of plexiglass pipes connected by elbow heads, and the seam is sealed with glass cement. The train is a cuboid, 6 m long, 62 mm wide and 80 mm high. The initial position of the train is 2 m outside the tunnel entrance. Traction force for the train is provided by a power traction apparatus, which consists of a power device and a traction device. The power device uses a frequency conversion electric motor. The traction device includes two traction lines and two coiling wheels. The coiling wheels are connected to the train’s head and rear by traction lines.

3.1.3. Layout of Test Cross-Sections

It is necessary to arrange several test cross-sections to collect the piston wind velocity data in the non-train space because the train keeps moving. As shown in Figure 6b, fourteen test cross-sections are arranged in the model tunnel. The distance between cross-section 1 and the tunnel entrance is 1 m, the distance between cross-section 2 and the tunnel entrance is 30 m, the distance between cross-section 13 and the tunnel exit is 24 m and the distance between cross-section 14 and the tunnel exit is 1 m. Test cross-sections 3–12 are set in the rescue station at a spacing of 1 m. To avoid hindering the model train’s running, a probe of a wind transducer (hot film type) is installed 35 mm below the tunnel in each test cross-section. The response time of the wind transducer is 0.1 s, the full-scale reading is 0–2 m/s and the accuracy is 3%.
Numerous repeated tests were carried out to obtain the ratio of the wind velocity at the measuring point to the mean wind velocity of the cross-section, which was 1.08–1.12. In this experiment, the average coefficient 1.10 was adopted to obtain the mean wind velocity of the cross-section by testing the wind velocity at the measuring point.

3.1.4. Test Conditions

The piston wind velocities are tested under two conditions: (1) the initial train velocity is 3 m/s and (2) the initial train velocity is 4 m/s. During the tests, wind velocity measurements are recorded at 0.5 s intervals. The running states of the model train are shown in Table 2.
For each test condition, the power traction apparatus and wind transducer work simultaneously when the test starts: the electric motor turns the coiling wheel in front of the train under different revolution velocities based on Table 1, and the traction line pulls the model to move; all wind transducers collect data synchronously. After the test is complete, the electric motor behind the train pulls it back to the initial position in preparation for the next test. Each test condition is repeated several times. Before every test, the wind in the pipe is dissipated entirely.

3.2. Results

The piston wind velocities in the actual tunnel can be obtained by using the model test results and velocity scale. Meanwhile, the piston wind velocity in the actual tunnel is calculated using the theoretical model developed in Section 2. The velocity of the train is expressed in Equation (21), and the same parameters as the actual tunnel are used in the theoretical calculation, which is shown in Table 3 [37].
v 0 t ϵ 0 , L 0 v 0 v 0 a t L 0 v 0 t ϵ L 0 v 0 , v 0 a 0 t ϵ v 0 a , +
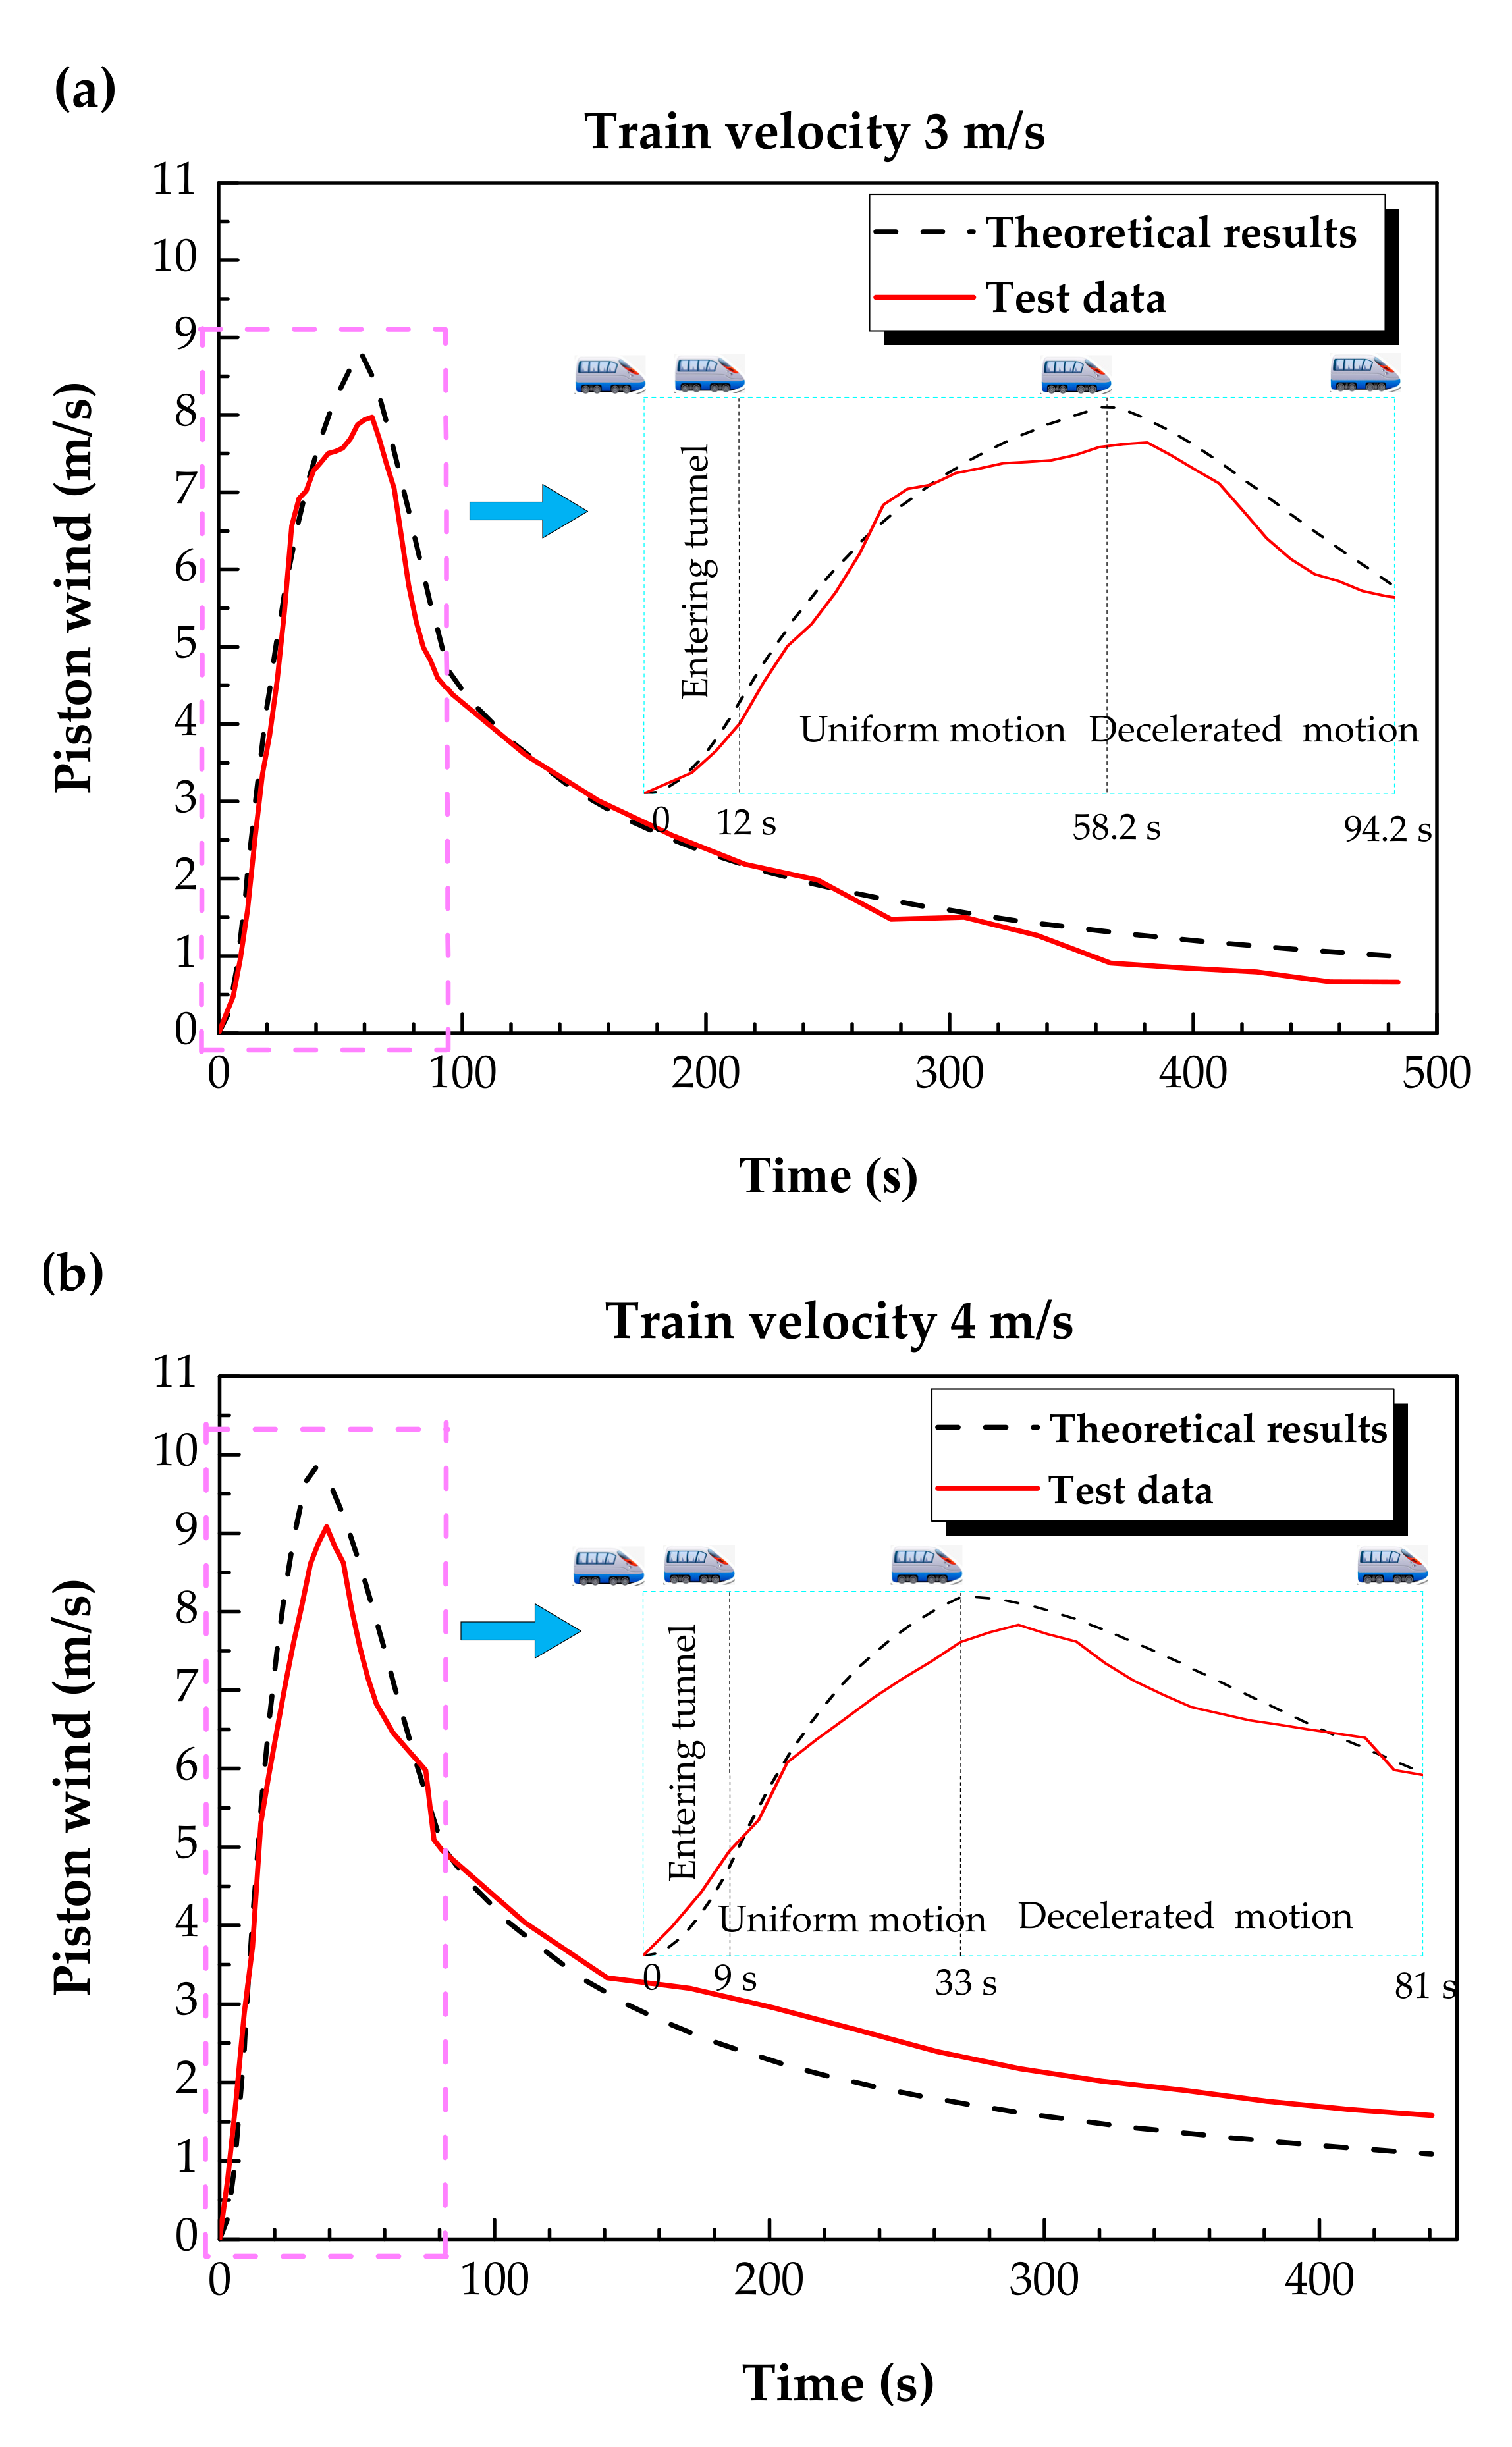
Figure 7 demonstrates the comparison between the theoretical results and the test results. Note that the test data of the wind velocities are tested from the cross-sections in the non-annular area at different times.
For the condition displayed in Figure 7a, the train’s velocity is 3 m/s. During the entering tunnel phase, from 0 to 12 s, the piston wind velocity increases gradually from 0 to 2.08 m/s and the growth rate goes up, reaching 0.3 m/s2. During the uniform motion phase, from 12 s to 58.2 s, the piston wind velocity reaches its peak value of 8.8 m/s and the growth rate first increases and then decreases. At 58.2 s, the piston wind begins to decelerate as the train begins to decelerate, reducing to 4.71 m/s at 94.2 s; the rate of decrement is almost a constant value of −0.13 m/s2. After the train stops at 94.2 s, the piston wind decays gradually to 0. The difference between the theoretical peak value and the test peak value is 0.83 m/s, and the relative error is 9.45%.
For the condition displayed in Figure 7b, the train’s velocity is 4 m/s. During the entering tunnel phase, from 0 to 9 s, the piston wind velocity increases from 0 to 2.44 m/s and the growth rate goes up, reaching 0.47 m/s2. During the uniform motion phase, from 9 s to 33 s, the piston wind velocity reaches its peak value of 9.85 m/s, and the growth rate first increases and then decreases. At 33 s, the piston wind begins to decelerate as the train begins to decelerate, reducing to 5.01 m/s at 81 s; the rate of decrement is almost a constant value of −0.12 m/s2. After the train stops at 81 s, the piston wind decays gradually to 0. The difference between the theoretical peak value and the test peak value is 0.76 m/s, and the relative error is 7.76%.
The theoretical calculation curves and the test data curves have the same trends, but they still have some differences. The peak value of the test data is lower than the calculation peak value, and there is a short delay. These differences caused by random error are acceptable. The following reasons may explain the differences between the theoretical calculation results and the test results:
(1)
The results concluded by prediction formulas may have some errors because the formulas are based on some reasonable assumptions.
(2)
Because the Reynolds similarity cannot be realized, the frictional loss coefficient in the model tunnel is larger than its theoretical value. This results in a certain deviation between the test results in the model tunnel and the piston wind in an actual tunnel.
(3)
The geometric scale is 1/50 and the velocity ratio is 1/8.33, resulting in a small random error that will be significantly amplified in the converted test results.
(4)
Errors are caused by the test instruments.
(5)
There are 14 transducers to collect wind velocity data in the non-train space, and the delay from synchronization of the transducers may also be amplified in the converted test results.
At present, piston wind is regarded as a steady flow in most of the relevant literature [38]. A comparison between the calculation results for steady flow and unsteady flow for the condition of train velocity 4 m/s is shown in Figure 8. There is a significant difference between the two results: the steady result is larger than the unsteady result in the entering tunnel phase, uniform motion phase and prophase of uniformly decelerated motion; it is smaller in the late phase of uniformly decelerated motion. Calculated as a steady flow, piston wind increases rapidly in the entering tunnel phase and reaches a constant value of approximately 13 m/s (i.e., peak value) when the whole train travels into the tunnel; the peak value lasts for 24 s in the uniform motion phase, begins to decrease as the train begins to decelerate and reduces to 0 when the train stops. Calculated as an unsteady flow, piston wind increases gradually to 2.44 m/s and continues to increase in the uniform motion phase, but the growth rate gradually decreases; it reaches the peak value of 9.85 m/s as the train begins to decelerate at 33 s and continually decreases in the uniformly decelerated motion to 5.08 m/s at the time the train stops (81 s). It then continues to decay for several minutes (Figure 7b). The difference between the maximum value calculated as steady flow and unsteady flow is 3.15 m/s, and the relative error is 24.2%. Obviously, the result of the unsteady flow calculation is more reasonable, and the behavior of the piston wind is closer to the actual situation.
In summary, the theoretical results and the test results are in good agreement, and the unsteady flow calculation result is closer to the actual situation. The theoretical derivation in this paper is reliable and accurate, and the theoretical formulas presented here can accurately predict piston wind behavior induced by a braking train in a railway tunnel.

4. Discussion

The accuracy of the prediction formulas was validated by the model test. It was noticed that the piston wind velocity in the condition of train velocity 4 m/s was larger than that in the condition of train velocity 3 m/s (Figure 7). Piston wind was significantly affected by train velocity. In addition, piston wind was significantly influenced by the tunnel length, train length, train velocity and blockage ratio.
A railway tunnel more than 10 km in length is defined as an extra-long railway tunnel; the longest existing railway tunnel exceeds 35 km. The length of a train carriage is approximately 25 m. In China, the velocity of a general express train is 90–110 km/h, the velocity of a fast train is 100–120 km/h, the velocity of an express train is 140–160 km/h, the velocity of an EMU (Electric Multiple Units) train is 200–250 km/h and the velocity of a high-speed train is 300–360 km/h. For most circular or horseshoe tunnels, the blockage ratio is rarely more than 0.7. Based on the above values, as listed in Table 4, 26 calculation cases were performed to analyze parameter sensitivity using the prediction formulas we deduced.
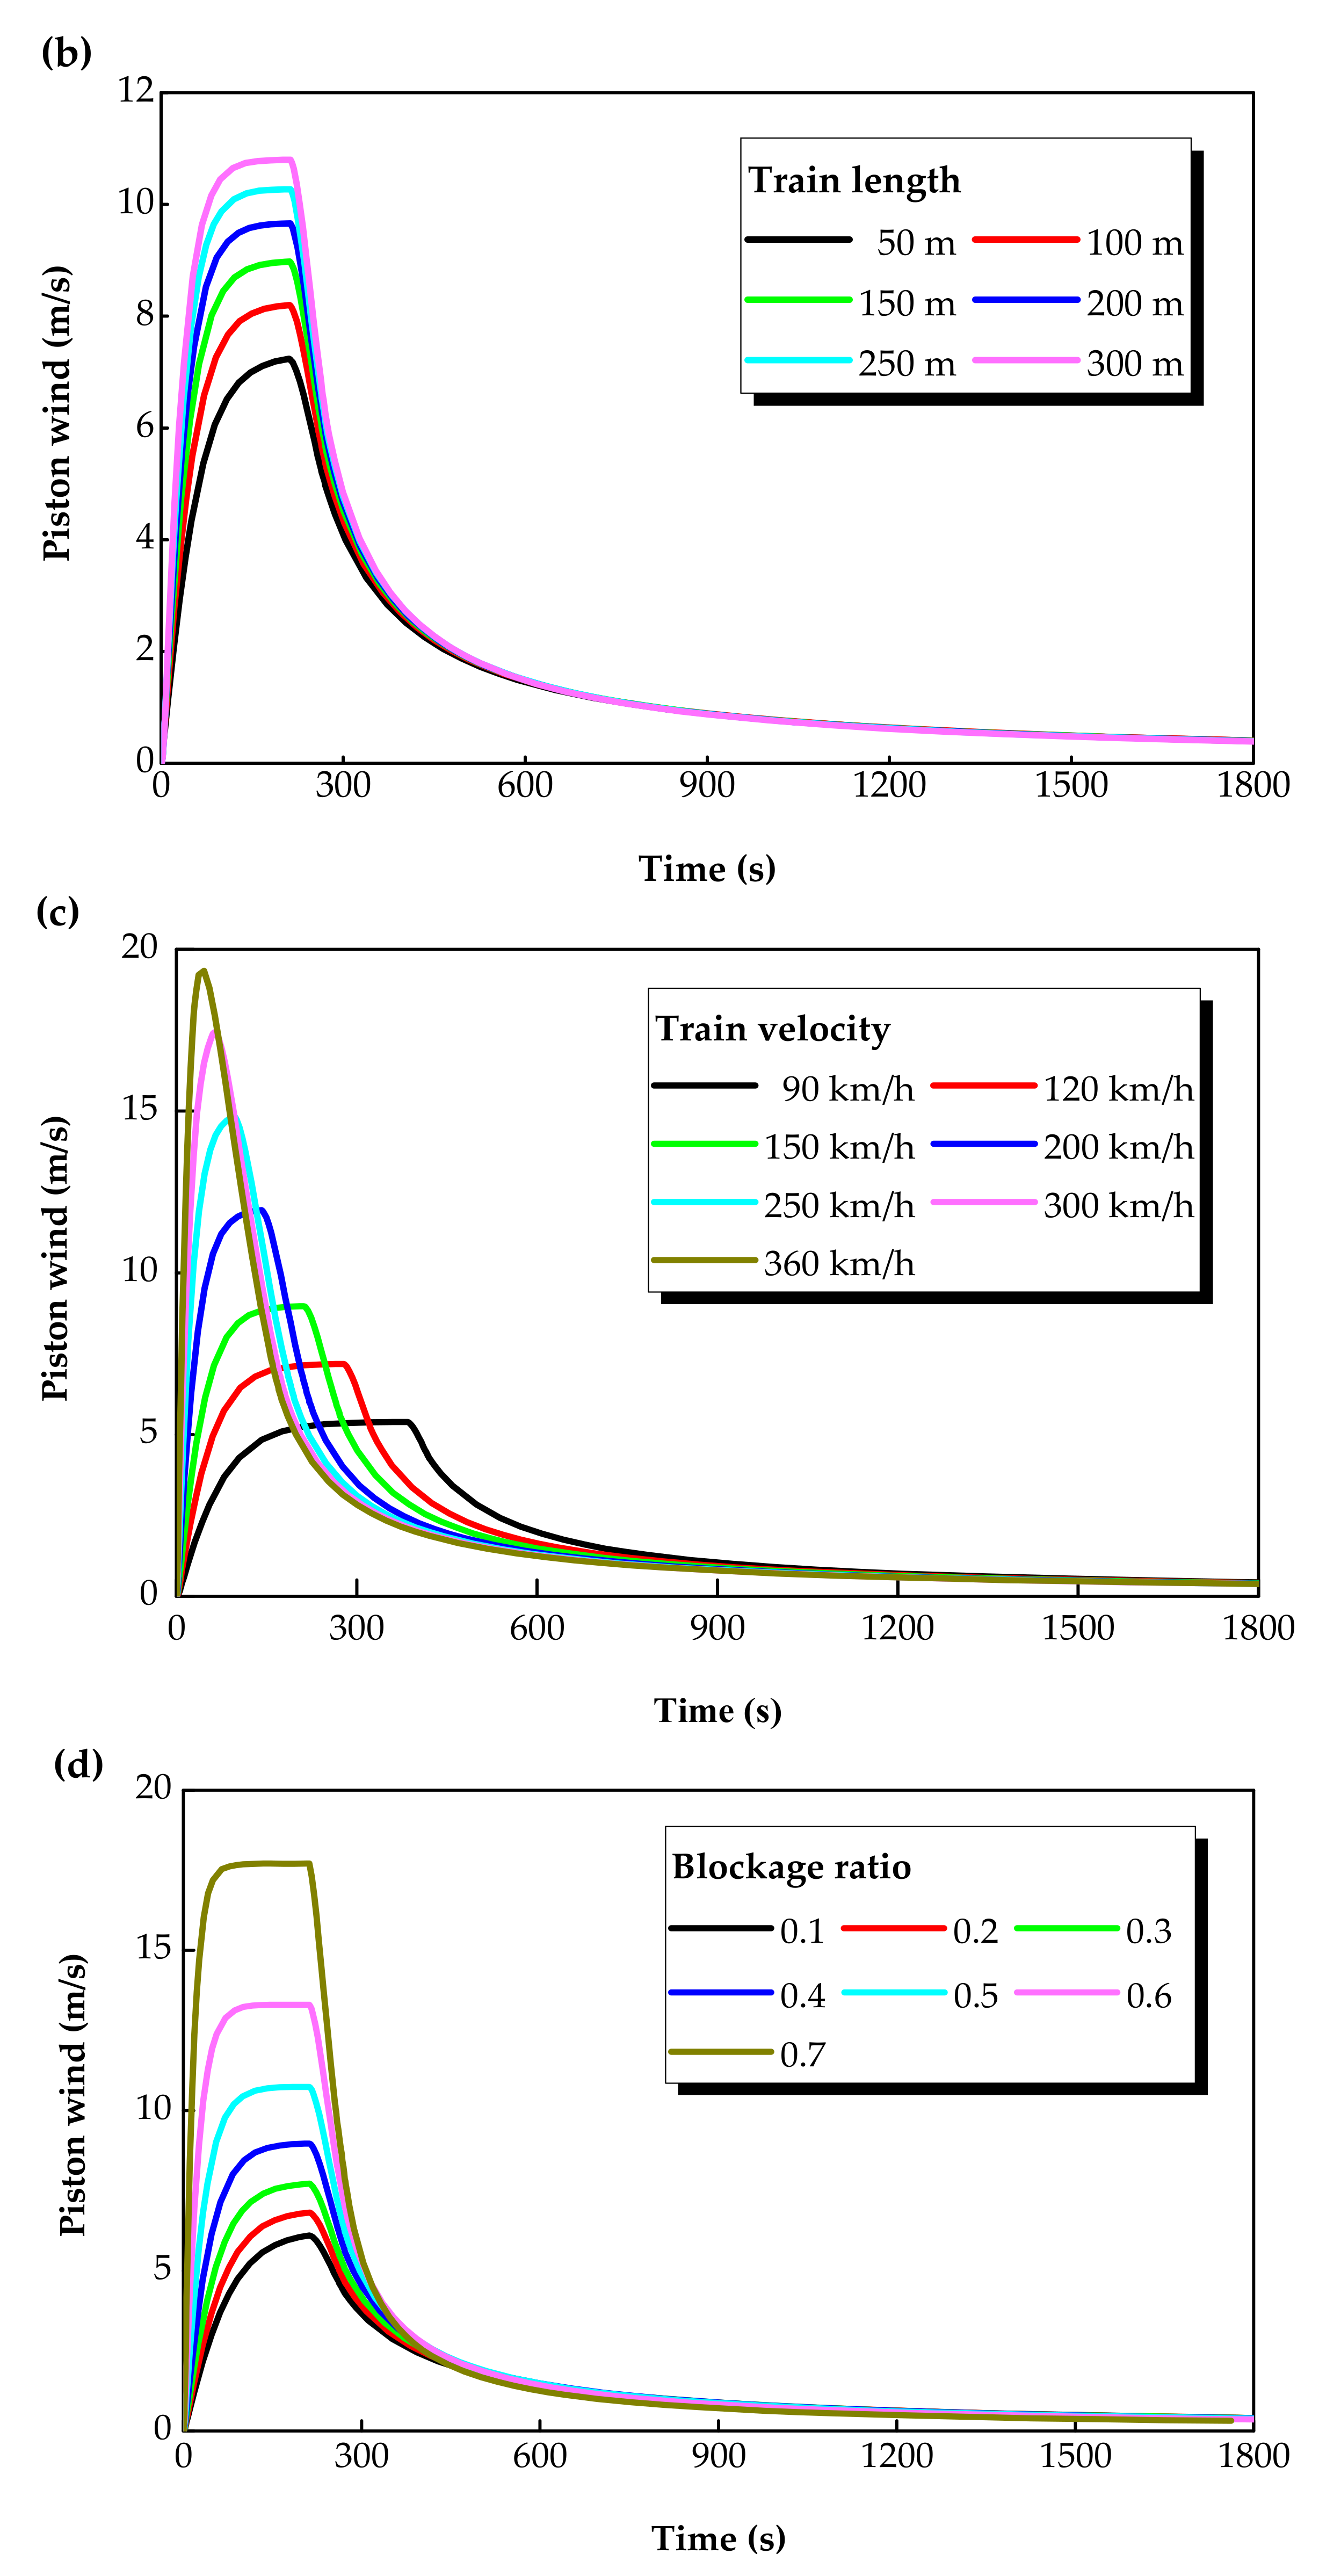
Figure 9 demonstrates the piston wind behavior induced by a braking train in a railway tunnel in different calculation cases.
(1)
The longer the tunnel, the weaker the piston wind due to the larger frictional loss. The length of time the piston wind velocity is at its peak is longer as the tunnel is longer because the time of the train’s uniform motion is longer. The longer the tunnel, the faster the piston wind decays.
(2)
The longer the train’s length, the stronger the piston wind owing to the smaller train resistance. The length of time the piston wind velocity is at its peak changes slightly with increasing length of the train because the time of the train’s uniform motion changes little. The decay time of the piston wind is nearly the same for each of the six different lengths of the train.
(3)
The faster the train, the stronger the piston wind owing to the greater momentum transferred to the air from the train. The length of time the piston wind velocity is at its peak is longer as the train’s velocity is faster because the time of the train’s uniform motion is shorter. The faster the train, the more slowly the piston wind decays.
(4)
The larger the blockage ratio, the stronger the piston wind owing to the greater momentum transferred to the air from the train. The length of time the piston wind velocity is at its peak is slightly longer because the hindering effect of the train on the air is slightly enhanced. The decay time of the piston wind is nearly the same for each of the seven kinds of blockage ratios.

5. Conclusions

In this paper, a mathematical model of unsteady airflow was developed to discover the piston wind behavior induced by a braking train in a railway tunnel. To validate the mathematical model, a test was performed in a 1/50 scale experimental configuration. In addition, parameter sensitivity analysis was performed using prediction formulas we deduced. The following conclusions were drawn:
(1)
The theoretical formulas in this paper can accurately predict piston the wind behavior induced by a braking train in a railway tunnel. The theoretical formulas are suitable for similar train running conditions in super-long railway tunnels or subway tunnels.
(2)
Piston wind increases continuously in the entering tunnel phase and the uniform motion phase, decreases continuously in the decelerated motion phase, and decays gradually to zero after the train stops. It reaches the peak value as the train begins to decelerate.
(3)
The wind direction in the annular area varies in different train running phases. The wind flows relatively to the train’s rear before the time the train velocity equals the piston wind velocity, and it flows relative to the train’s head after that time.
(4)
Piston wind was significantly influenced by tunnel length, train length, train velocity and blockage ratio. Tunnel length and train velocity significantly affected the duration time of peak piston wind velocity, while train length and blockage ratio slightly affected the duration time.

Author Contributions

X.Y. investigation, formal analysis, writing original draft, data curation. L.T. conceptualization, methodology, writing review and editing. J.P. investigation, data curation, formal analysis. Y.Z. project administration, methodology, funding acquisition, writing review and editing. Y.F. conceptualization, methodology, writing original draft. Y.B. investigation. All authors have read and agreed to the published version of the manuscript.

Funding

The National Natural Science Foundation of China (Grant 51678502) is gratefully acknowledged for the financial support.

Conflicts of Interest

The authors declare that there is no conflict of interest.

Nomenclature

p Air pressure [Pa].
ρ Air density [kg/m3].
g Gravity acceleration [m/s−2].
h f Gravity acceleration [m/s−2].
ζ Local loss coefficient.
λ Frictional loss coefficient.
N Train drag coefficient.
K Impact factor of piston wind.
v 0 Train velocity [m/s].
v Piston wind velocity [m/s].
w Wind velocity in the annular area [m/s].
v s Relative velocity of wind in the annular area [m/s].
a Rate of deceleration for the train [m/s2].
β Blockage ratio.
C Scale.
L Length [m].
D Equivalent diameter [m].
t Time [s].
μ Viscosity coefficient of fluid.
A Cross-sectional area [m2].

References

  1. Zhang, H.; Zhu, C.; Zheng, W.; You, S.; Ye, T.; Xue, P. Experimental and numerical investigation of braking energy on thermal environment of underground subway station in China’s northern severe cold regions. Energy 2016, 116, 880–893. [Google Scholar] [CrossRef]
  2. Zhang, H.; Cui, T.; Liu, M.; Zheng, W.; Zhu, C.; You, S.; Zhang, Y. Energy performance investigation of an innovative environmental control system in subway station. Build. Environ. 2017, 126, 68–81. [Google Scholar] [CrossRef]
  3. Zhou, X.; Zeng, Y.; Fan, L. Temperature field analysis of a cold-region railway tunnel considering mechanical and train-induced ventilation effects. Appl. Therm. Eng. 2016, 100, 114–124. [Google Scholar] [CrossRef]
  4. Zhong, W.; Tu, R.; Yang, J.P.; Liang, T.S. A study of the fire smoke propagation in subway station under the effect of piston wind. J. Civ. Eng. Manag. 2015, 21, 514–523. [Google Scholar] [CrossRef] [Green Version]
  5. Tong, Y.; Wang, X.; Zhai, J.; Niu, X.; Liu, L. Theoretical predictions and field measurements for potential natural ventilation in urban vehicular tunnels with roof openings. Build. Environ. 2014, 82, 450–458. [Google Scholar] [CrossRef]
  6. Wang, Z.; Tao, H.; Du, X.; Dai, R.; Huang, C. Theoretical modeling of the platform piston wind wall jet using field measurements and model testing. Tunn. Undergr. Space Technol. 2015, 45, 1–9. [Google Scholar] [CrossRef]
  7. Zhang, H.; Zhu, C.; Liu, M.; Zheng, W.; You, S.; Li, B.; Xue, P. Mathematical modeling and sensitive analysis of the train-induced unsteady airflow in subway tunnel. J. Wind Eng. Ind. Aerodyn. 2017, 171, 67–78. [Google Scholar] [CrossRef]
  8. Juraeva, M.; Lee, J.-H.; Song, D.-J. A computational analysis of the train-wind to identify the best position for the air-curtain installation. J. Wind Eng. Ind. Aerodyn. 2011, 99, 554–559. [Google Scholar] [CrossRef]
  9. Lanchava, O.; Ilias, N.; Nozadze, G.; Radu, S.; Moraru, R.; Khokerashvili, Z.; Arudashvili, N. Modelling the piston effect in subway tunnels using fire dynamics simulator. Environ. Eng. Manag. J. 2019, 18, 865–872. [Google Scholar] [CrossRef]
  10. Fujii, K.; Ogawa, T. Aerodynamics of high speed trains passing by each other. Comput. Fluids 1995, 24, 897–908. [Google Scholar] [CrossRef]
  11. Kim, J.-Y.; Kim, K.-Y. Effects of vent shaft location on the ventilation performance in a subway tunnel. J. Wind Eng. Ind. Aerodyn. 2009, 97, 174–179. [Google Scholar] [CrossRef]
  12. Shin, C.-H.; Park, W.-G. Numerical study of flow characteristics of the high speed train entering into a tunnel. Mech. Res. Commun. 2003, 30, 287–296. [Google Scholar] [CrossRef]
  13. Huang, Y.-D.; Gong, X.-L.; Peng, Y.-J.; Lin, X.-Y.; Kim, C.-N. Effects of the ventilation duct arrangement and duct geometry on ventilation performance in a subway tunnel. Tunn. Undergr. Space Technol. 2011, 26, 725–733. [Google Scholar] [CrossRef]
  14. Huang, Y.; Gong, X.-L.; Peng, Y.-J.; Kim, C.N. Effects of the solid curtains on natural ventilation performance in a subway tunnel. Tunn. Undergr. Space Technol. 2013, 38, 526–533. [Google Scholar] [CrossRef]
  15. Izadi, T.; Mehrabian, M.A.; Abouali, O.; Ahmadi, G. 3-D numerical analysis of train-induced flow inside four ventilated underground subway stations and connecting tunnels. J. Wind Eng. Ind. Aerodyn. 2019, 193, 103974. [Google Scholar] [CrossRef]
  16. Wang, F.; Wang, M.; Wang, Q.; Zhao, D. An improved model of traffic force based on CFD in a curved tunnel. Tunn. Undergr. Space Technol. 2014, 41, 120–126. [Google Scholar] [CrossRef]
  17. Khaleghi, M.; Talaee, M.R. Analysis of unsteady airflow in a subway station influenced by train movement. Sci. Technol. Built Environ. 2020, 26, 210–218. [Google Scholar] [CrossRef]
  18. Liu, M.; Zhu, C.; Cui, T.; Zhang, H.; Zheng, W.; You, S. An alternative algorithm of tunnel piston effect by replacing three-dimensional model with two-dimensional model. Build. Environ. 2018, 128, 55–67. [Google Scholar] [CrossRef]
  19. González, M.L.; Vega, M.G.; Oro, J.M.F.; Marigorta, E.B. Numerical modeling of the piston effect in longitudinal ventilation systems for subway tunnels. Tunn. Undergr. Space Technol. 2014, 40, 22–37. [Google Scholar] [CrossRef]
  20. Yang, Z.; Su, X.; Ma, F.; Yu, L.; Wang, H. An innovative environmental control system of subway. J. Wind Eng. Ind. Aerodyn. 2015, 147, 120–131. [Google Scholar] [CrossRef]
  21. Zarnaghsh, A.; Abouali, O.; Emdad, H.; Ahmadi, G. A numerical study of the train-induced unsteady airflow in a tunnel and its effects on the performance of jet fans. J. Wind Eng. Ind. Aerodyn. 2019, 187, 1–14. [Google Scholar] [CrossRef]
  22. Cross, D.; Hughes, B.; Ingham, D.; Ma, L. A validated numerical investigation of the effects of high blockage ratio and train and tunnel length upon underground railway aerodynamics. J. Wind Eng. Ind. Aerodyn. 2015, 146, 195–206. [Google Scholar] [CrossRef] [Green Version]
  23. Cross, D.; Hughes, B.; Ingham, D.; Ma, L. Enhancing the piston effect in underground railway tunnels. Tunn. Undergr. Space Technol. 2017, 61, 71–81. [Google Scholar] [CrossRef] [Green Version]
  24. Zhang, N.; Lu, Z.; Zhou, D. Influence of train speed and blockage ratio on the smoke characteristics in a subway tunnel. Tunn. Undergr. Space Technol. 2018, 74, 33–40. [Google Scholar] [CrossRef]
  25. Liu, X.; Han, Y.; Li, D.; Tu, Y.; Deng, Z.; Yu, C.; Wu, X. Anti-pull mechanisms and weak interlayer parameter sensitivity analysis of tunnel-type anchorages in soft rock with underlying weak interlayers. Eng. Geol. 2019, 253, 123–136. [Google Scholar] [CrossRef]
  26. Zeng, Y.; Liu, K.; Zhou, X.; Fan, L. Tunnel temperature fields analysis under the couple effect of convection-conduction in cold regions. Appl. Therm. Eng. 2017, 120, 378–392. [Google Scholar] [CrossRef]
  27. Chen, T.Y.; Lee, Y.T.; Hsu, C.C. Investigations of piston-effect and jet fan-effect in model vehicle tunnels. J. Wind Eng. Ind. Aerodyn. 1998, 73, 99–110. [Google Scholar] [CrossRef]
  28. Kim, J.Y.; Kim, K.Y. Experimental and numerical analyses of train-induced unsteady tunnel flow in subway. Tunn. Undergr. Space Technol. 2007, 22, 166–172. [Google Scholar] [CrossRef]
  29. Gilbert, T.; Baker, C.J.; Quinn, A. Gusts caused by high-speed trains in confined spaces and tunnels. J. Wind Eng. Ind. Aerodyn. 2013, 121, 39–48. [Google Scholar] [CrossRef] [Green Version]
  30. Xue, P.; You, S.; Chao, J.; Ye, T. Numerical investigation of unsteady airflow in subway influenced by piston effect based on dynamic mesh. Tunn. Undergr. Space Technol. 2014, 40, 174–181. [Google Scholar] [CrossRef]
  31. Ma, J.; Zhang, X.; Li, A.; Deng, B.; Lv, W.; Guo, Y.; Zhang, W.; Huang, L. Analyses of the improvement of subway station thermal environment in northern severe cold regions. Build. Environ. 2018, 143, 579–590. [Google Scholar] [CrossRef]
  32. Liu, M.; Zhu, C.; Zhang, H.; Zheng, W.; You, S.; Campana, P.E.; Yan, J. The environment and energy consumption of a subway tunnel by the influence of piston wind. Appl. Energy 2019, 246, 11–23. [Google Scholar] [CrossRef]
  33. Krasyuk, A.M.; Lugin, I.V.; Pavlov, S.A. Experimental research into air distribution in a terminal subway station. Tunn. Undergr. Space Technol. 2019, 85, 21–28. [Google Scholar] [CrossRef]
  34. Zeng, Y.; Bai, Y.; Zhou, X.; Ruan, L. Numerical simulation analysis of piston wind change during train stopping at rescue station in railway tunnel. China Railw. Sci. 2016, 37, 128–133. (In Chinese) [Google Scholar]
  35. Bai, Y.; Zeng, Y.; Zhang, X.; Yan, X.; Ruan, L.; Zhou, X. Numerical and experimental study on the flow field induced by a train urgently speeding to the rescue station. Tunn. Undergr. Space Technol. 2016, 58, 74–81. [Google Scholar] [CrossRef]
  36. Zhou, G. Fluid Mechanics; Higher Education Press: Beijing, China, 1992. [Google Scholar]
  37. Ministry of Railways of the People’s Republic of China. Code for design on operating ventilation of railway tunnel. In TB10068-2010; China Railway Press: Beijing, China, 2010. [Google Scholar]
  38. Luo, Z.; Han, G.; Zhao, K.; Huang, S. Piston wind speed calculation method and analysis of influence factors for subway tunnel. J. Northeast. Univ. Nat. Sci. 2019, 40, 694–699. (In Chinese) [Google Scholar]
Figure 2. Schematic of train entering tunnel phase.
Energies 13 06420 g002
Figure 3. Schematic of uniform motion.
Energies 13 06420 g003
Figure 4. Schematic of uniformly decelerated motion phase. (a) Prophase. (b) Late phase.
Energies 13 06420 g004
Figure 5. Schematic of the stationary phase.
Energies 13 06420 g005
Figure 6. Schematic of experiment layout. (a) Top view of the experimental platform. (b) Locations and dimension of test cross-sections.
Energies 13 06420 g006
Figure 7. Comparison for theoretical results and test data of piston wind. (a) Train velocity 3 m/s. (b) Train velocity 4 m/s.
Energies 13 06420 g007
Figure 8. Comparison between the steady flow calculation result and the unsteady flow calculation result.
Energies 13 06420 g008
Figure 9. The effect of different parameters on piston wind behavior induced by a train emergently running to a rescue station. (a) Tunnel length. (b) Train length. (c) Train velocity. (d) Blockage ratio.
Energies 13 06420 g009aEnergies 13 06420 g009b
Table 1. Similarity scales in the model test.
TypeSymbolValueAccording toRemarks
Length scale C l 1/50Comprehensive factorsConsider indoor site and materials
Velocity scale C v 1/8.33Comprehensive factorsConsider the result error
Area scale C A 1/2500 C A = C l 2
Flow quantity scale C Q 1/20,825 C Q = C A C v
Time scale C t 1/6 C t = C l / C v Strouhal similarity
Density scale C ρ 1Same fluid (air), gas compression is ignored
Viscosity scale C V 1
Table 2. Running states of the model train.
Initial Train Velocity (m/s)Duration (s)
Entering TunnelUniform MotionUniformly Decelerated MotionStationary
327.7665
41.54860
Table 3. Parameters for theoretical calculation for piston wind.
Calculation parameterL (m)AT (m2)D (m) β λλ0ζ1ζ2L0 (m)v0 (m/s)a (m/s2)
Value325043.747.230.28350.020.020.51.030024.99/33.330.6944
Table 4. Effect parameter values for calculating piston wind.
CaseTunnel Length L (km)Train Length L0 (m)Train Velocity v0 (km/h)Blockage Ratio β
1101501500.4
2151501500.4
3201501500.4
4251501500.4
5301501500.4
6351501500.4
720501500.4
8201001500.4
9201501500.4
10202001500.4
11202501500.4
12203001500.4
1320150900.4
14201501200.4
15201501500.4
16201502000.4
17201502500.4
18201503000.4
19201503600.4
20201501500.1
21201501500.2
22201501500.3
23201501500.4
24201501500.5
25201501500.6
26201501500.7
Publisher’s Note: MDPI stays neutral with regard to jurisdictional claims in published maps and institutional affiliations.