Article

A Parametric Study of a Hybrid Photovoltaic Thermal (PVT) System Coupled with a Domestic Hot Water (DHW) Storage Tank

1
Faculty of Power Engineering, University Politehnica of Bucharest, 60042 Bucharest, Romania
2
INSA Strasbourg ICUBE, University of Strasbourg, 67200 Strasbourg, France
*
Author to whom correspondence should be addressed.
Energies 2020, 13(24), 6481; https://doi.org/10.3390/en13246481
Submission received: 13 November 2020 / Revised: 3 December 2020 / Accepted: 5 December 2020 / Published: 8 December 2020

Abstract

:
Photovoltaic-thermal panels are hybrid systems that combine the two types of conventional solar energy technologies (photovoltaic and thermal panels) and simultaneously generate both thermal and electrical energy in a micro-cogeneration system. Like any co-generation system, there is an optimal balance that can be achieved between the thermal and electrical energy produced. For this reason, it is important to establish the relationship and inter-connection between the two. Limited research is available on the cogeneration interaction in a PVT system, so the novelty of this article lies in the consideration of the entire energy system connected to the PVT panel, including the storage tank and the consumer demand curve, and the investigation of the thermal parametric variation. This study analyses the impact of the variation of some thermal parameters of a domestic hot water tank on the electrical efficiency of a photovoltaic-thermal panel. A model of a system of photovoltaic-thermal panels is built in a transient systems simulation program (TRNSYS) and a one-factor-at-a-time analysis is carried out for the cold-water main temperature, tank size, tank outlet flow and consumer demand curve. The results show that the variation of the outlet flow to the consumer has the highest impact on the electrical efficiency, of about 6.8%. The next highest impact factor is the size of the tank with a variation of 4.7%. Matching the profile of the consumer is also an important aspect. It was observed that the peak electrical efficiency occurs during peak consumer demand. Finally, the instantaneous variation of the thermal and electrical power of the system was analysed as a function of the temperature at the inlet of the photovoltaic-thermal panel.

1. Introduction

A PVT panel combines the benefits of a solar thermal (ST) and a photovoltaic (PV) panel in a single piece of equipment (Figure 1). It simultaneously produces heat and electricity, saving roof space, installation/transportation, and maintenance costs [1]. A system of PVT panels can be classified as a micro-cogeneration system. As in any cogeneration system, there is a tight relationship between the electrical and thermal energy production.
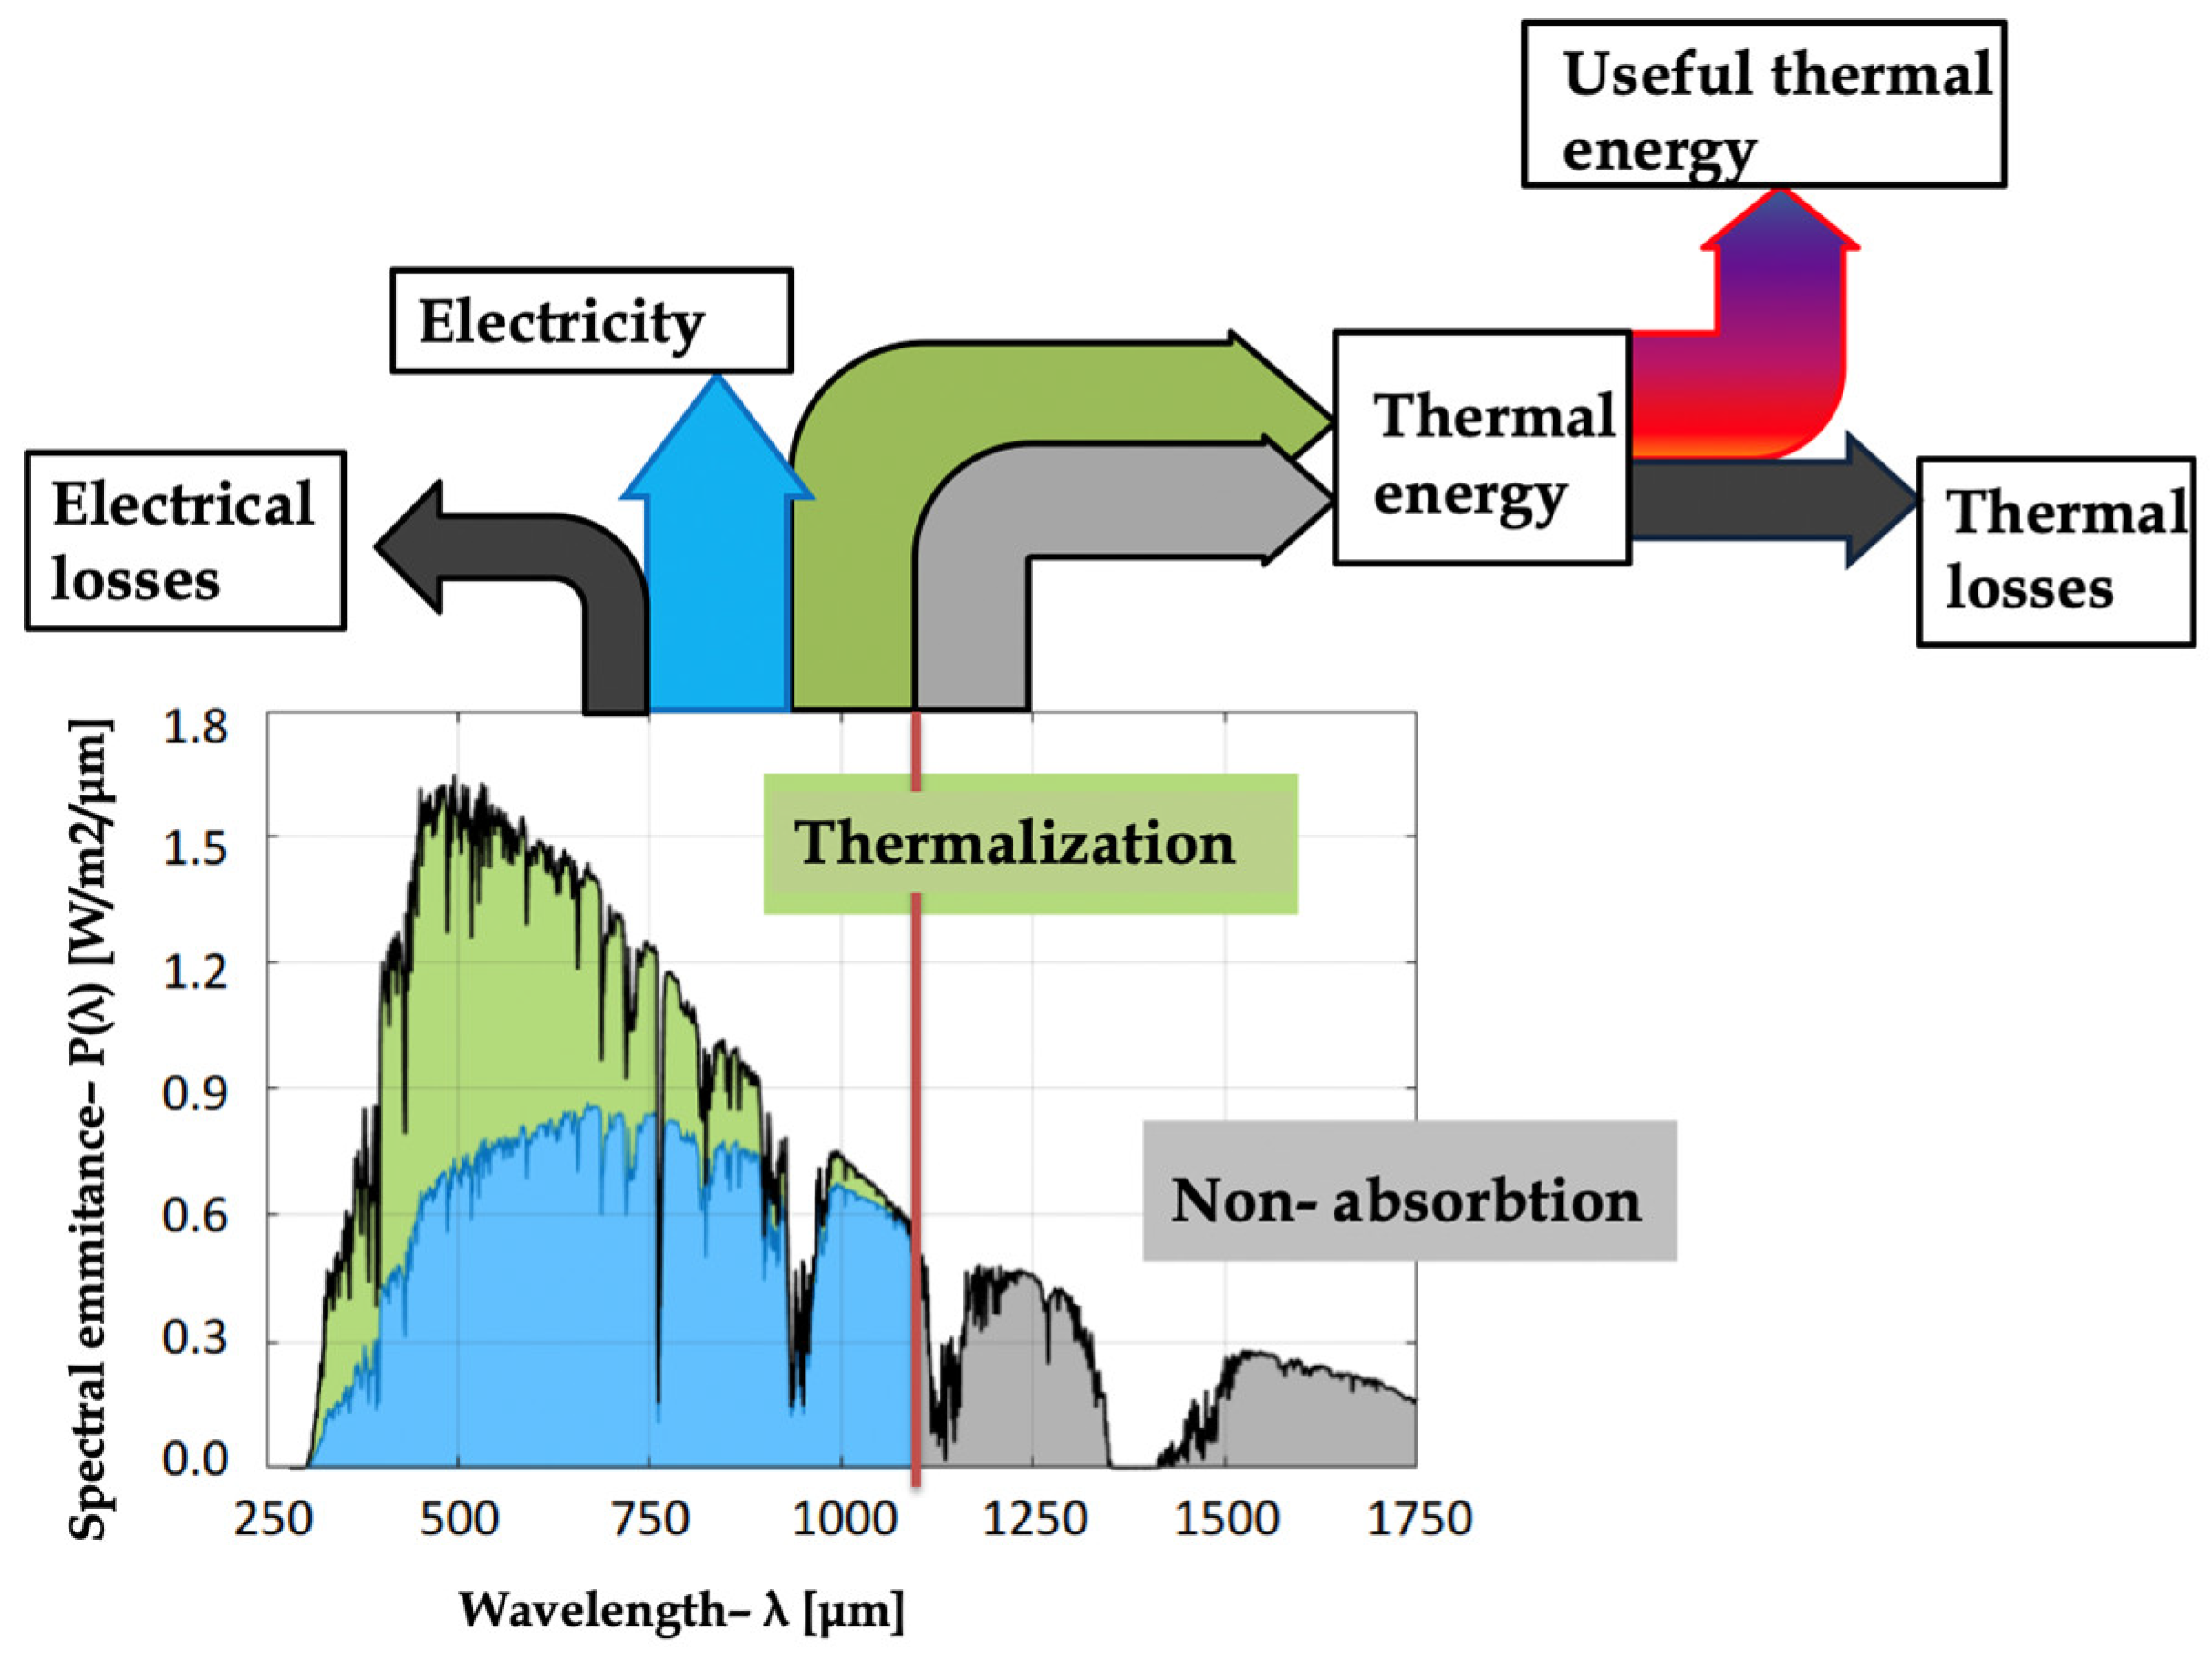
There are some significant advantages of a PVT panel over the stand-alone photovoltaic (PV) panels. First, substantial heat losses occur in a PV panel. The flux of energy in a PVT panel is shown in Figure 2. The losses occur through the thermalization (shown in green) of photons that carry a higher energy than the bandgap of the semiconductor material (shown as the red line), and through non-absorption of the photons that do not carry enough energy, respectively (shown in grey) [2]. Additional electrical losses occur, which cannot be recovered. However, by recovering the thermal losses, the overall solar energy conversion efficiency is improved, and useful thermal energy is produced, that can be utilized for various applications, e.g., heating, cooling, and domestic hot water.
Also, the PV side shows an increased electrical efficiency compared to a standard PV panel [3]. This occurs due to the fact that the PV electrical efficiency decreases with the increase of the operating temperature of the cell. In other words, as the cell material heats up, the electrical power output is reduced. Thus, by removing the heat of the cell through a cooling agent, useful thermal energy is obtained, and the PV efficiency is improved. Many analytical models have been proposed for expressing the dependence of the electrical efficiency on the operating temperature of various cells, and a comprehensive review has been carried out by Dubey et al. [3]. One of the most commonly used correlations for the efficiency-temperature relationship was proposed by Evans and Florschuetz [4] and is expressed in Equation (1). The electrical efficiency of a PV cell decreases by 0.3–0.6%, depending on the type of cell [3], for each degree Celsius above the standard operating conditions (STC), typically 25 °C.
η e l = η r e f [ 1 β r ( T c T r ) ]
where 𝜂 is the cell efficiency at the investigated cell temperature 𝑇𝑐, 𝜂𝑟𝑒𝑓 is the cell efficiency evaluated at the reference temperature 𝑇𝑟, and 𝛽𝑟 is a property called temperature coefficient.
As a result, if the temperature of the cell Tc increases, the electrical efficiency decreases. In contrast, a decrease in Tc leads to a better electrical efficiency.
For this reason, it is important to study the main factors that influence the value of this temperature. This paper investigates how is the photovoltaic side influenced by some of the main thermal parameters of the global PVT system. This issue of the thermal-electrical relationship is of importance in any cogeneration system. For example, when looking at any combined heat and power (CHP) system, the electrical energy production is improved when there is a sufficient thermal energy dissipation source [5]. Similarly, in a PVT system, if the recovered heat is not dissipated to a suitable consumer, the PV cell is not cooled down, and there is a significant drop in the electrical energy efficiency of up to 15% [6]. While for traditional CHP systems the relationship between the thermal and electrical production has been widely studied [7], in the case of PVT systems, there is limited research on this topic.
The study and development of PVT panels started in the 1970s [8]. Since then, significant research work has been dedicated towards the advancement and efficiency improvement of the PVT technologies, by studying and optimizing some of the main parameters that influence its efficiency.
The meteorological condition (solar radiation, ambient temperature and wind speed), and the constructive parameters of the PVT panel (insulation, channel type and width, glazing, packing factor) are some of the factors that influence the temperature of the cell and implicitly the electrical efficiency. The geometrical design of a PVT panel is also an important factor in the energy output. Significant research has been carried out to investigate the impact of various geometrical configurations (direct flow, serpentine design, parallel serpentine design, oscillatory flow, spiral flow, web design) on the electrical and thermal efficiencies, and consequently the overall energy efficiency [9,10]. An interesting development is the application of fractal geometry for the PVT heat exchanger, which has been tested and showed up to 400% less pressure drop in the channels compared to traditional geometries [11]. Also, several parametric studies have been carried out on individual PVT panels, varying other constructive parameters, such as the flow rate [12], packing factor [13], tilt angle [13], tube spacing [14], thickness of insulation [14], and glazing [15]. The results show that the best performance is achieved with a compromise between the electrical and thermal performance. Another study [16] looked at the optimization of a single panel from the point of view of exergetic efficiency with a muti-objective optimization in terms of mass flow rate, inlet temperature, air gap thickness and insulation thickness, and found the optimum values for three types of PVT functioning modes: Electric-driven, Thermal exergy-driven and trade-off solution. A study performed a sensibility analysis on a PV panel integrated with a phase changing material (PCM), and showed that every 100 W/m² increase in solar radiation can lead to about a 5 °C increase in peak temperature, so the melting point of the PC should be higher than ambient temperature [17]. These types of studies are typically a numerical model of an individual isolated PVT panel.
Other important factors that influence the cell temperature are the thermal characteristics of the entire PVT system, mainly the temperature of the liquid at the inlet of the panel, which acts as a cooling medium for the cell, and which in turn is based on the temperature of the liquid at the outlet of the tank heat exchanger if we assume negligible pipe losses. The tank temperature depends on several factors, such as the type of tank, volume, rate of domestic hot water (DHW) consumption of the end user and initial temperature of the cold water that is injected in the tank [15]. One of the most interesting factors is the rate of consumption of the end user, not only quantitatively, but also its daily distribution (the consumption curve). Depending on the type of consumer (domestic, industrial, offices, schools), the daily consumption curve can vary significantly. This study will help to better understand the impact of the type of consumer on the efficiency of the system and give an insight into the most efficient fit.
An interesting study [18] looked at the impact of the consumer behavior on the performance of a solar thermal system in South Africa and showed how little behavioral changes can bring significant efficiency improvements. A paper by Nhut [19], who carried out a systemic parametric study of a solar-assisted house heating system with a seasonal underground thermal energy storage tank, looked at system parameters, such as the size of the tank and the insulation thickness of the tank, in terms of annual energy production. Another system parametric study [20] looks at a solar-heating-and-cooling system for a detached single-family household in hot climates in terms of cost savings. Another type of system parametric analysis that has been carried out in the literature refers to a PV system and is done from a technical-economical point of view [21]. This study looks at the impact of the location, weather, price of electricity, feed-in tariff, system cost, and electrical specifications on the economic feasibility of a grid-connected PV-battery systems. A parametric study on a solar cooling system was performed for the meteorological conditions of Athens, Greece [22], optimizing it to achieve a solar coverage ratio up to 89.85%.
A research gap was found when looking at the systemic analysis of a building connected to a PVT system. Most models found in the literature only considered a numerical model of the isolated PVT panel when carrying out the sensibility analysis. Also, the few studies that looked at the entire system were applied to different solar technologies, such as ST or PV, not PVT panels.
In this given framework, the novelty of this research is the consideration of the entire energy system connected to the PVT panel, including the DHW storage tank and the consumer demand curve, and the investigation of the variation of thermal parameters. The parametric study is done at a system level, focusing on the influence of some of the thermal aspects on the electrical efficiency. As with any cogeneration system, there is a tight relationship between the electrical and thermal production, so it is interesting to see how the electrical efficiency is influenced by the thermal parameters of the system. The consumer demand is also an interesting aspect to investigate, as some demand curves will be more compatible with a PVT system than others.
This paper aims to investigate some of the main thermal factors and the amount of influence they have on the electrical energy production of the system. This is achieved by developing a transient model of a basic PVT system and carrying out a parametric sensibility analysis on the thermal characteristics of the model. The results are important for establishing how the electrical efficiency of a PVT system can be improved in the design stage based on the thermal characteristics of the model.

2. Methods and Materials

In the next section, a numerical model of the relationship between the tank outlet temperature and the electrical efficiency of an isolated PVT panel will be outlined. Next, a model of the entire system will be defined, carrying out a parametric analysis based on thermal factors. Finally, the results will be interpreted in terms of percentage variation and annual electrical energy production.

2.1. Numerical Model of a PVT System

In order to establish the relation between the electrical efficiency and the temperature at the outlet of the tank heat exchanger, two intermediate relationships are evaluated: first, the relationship between the operating temperature of the cell Tc and the electrical efficiency η e l (Equation (2)). Secondly, the relationship between the temperature at the inlet of the PVT panel TinPVT and the operating temperature of the cell Tc (Equation (3)). Additionally, for the purpose of this study, it is assumed that the heat losses along the pipes from the outlet of the tank to the inlet of the PVT are negligible. Thus, the temperature at the outlet of the tank heat exchanger Ttank can be replaced with the temperature at the inlet of the PVT panel (Equation (4)).
f ( T c ) = η e l
f ( T i n P V T ) = T c
T i n P V T = T t a n k
From Equations (2)–(4), the relationship between the electrical efficiency and the temperature at the outlet of the tank heat exchanger can be established:
f ( T t a n k ) = η e l
Next, the equations will be expanded based on a thermal numerical model [23,24] and based on the cross-sectional scheme in Figure 3. Equation (6) describes the relationship between the cell temperature and the electrical efficiency [23].
η e l = η r e f [ 1 β r ( T c T r ) ]
The temperature of the cell can be expressed as [23]:
T c = τ G [ α c β c + α T ( 1 β c ) ] I ( t ) η c I ( t ) β c + U t T a + U T T b s U t + U T
where τ G is the transmissivity of the glass, α c is the absorptivity of the cell, β c is the packing factor, α T is the absorptivity of the Tedlar layer, I ( t ) is the incident solar intensity, η c is the cell efficiency, U t is the overall heat transfer coefficient from the solar cell to the ambient through glass, T a is the ambient temperature, U T is the conductive heat transfer coefficient from the solar cell to the water, and T b s is the temperature on the back surface of the panel and can be expressed as [23]:
T b s = h p 1 ( α τ ) e f f I ( t ) + U t T T a + h T T w U t T + h T
where h p 1   and h p 2 are penalty factors, U t T is the overall heat transfer coefficient from glass to Tedlar through solar cell, h T is the Tedlar heat transfer coefficient, and T w is the water temperature.
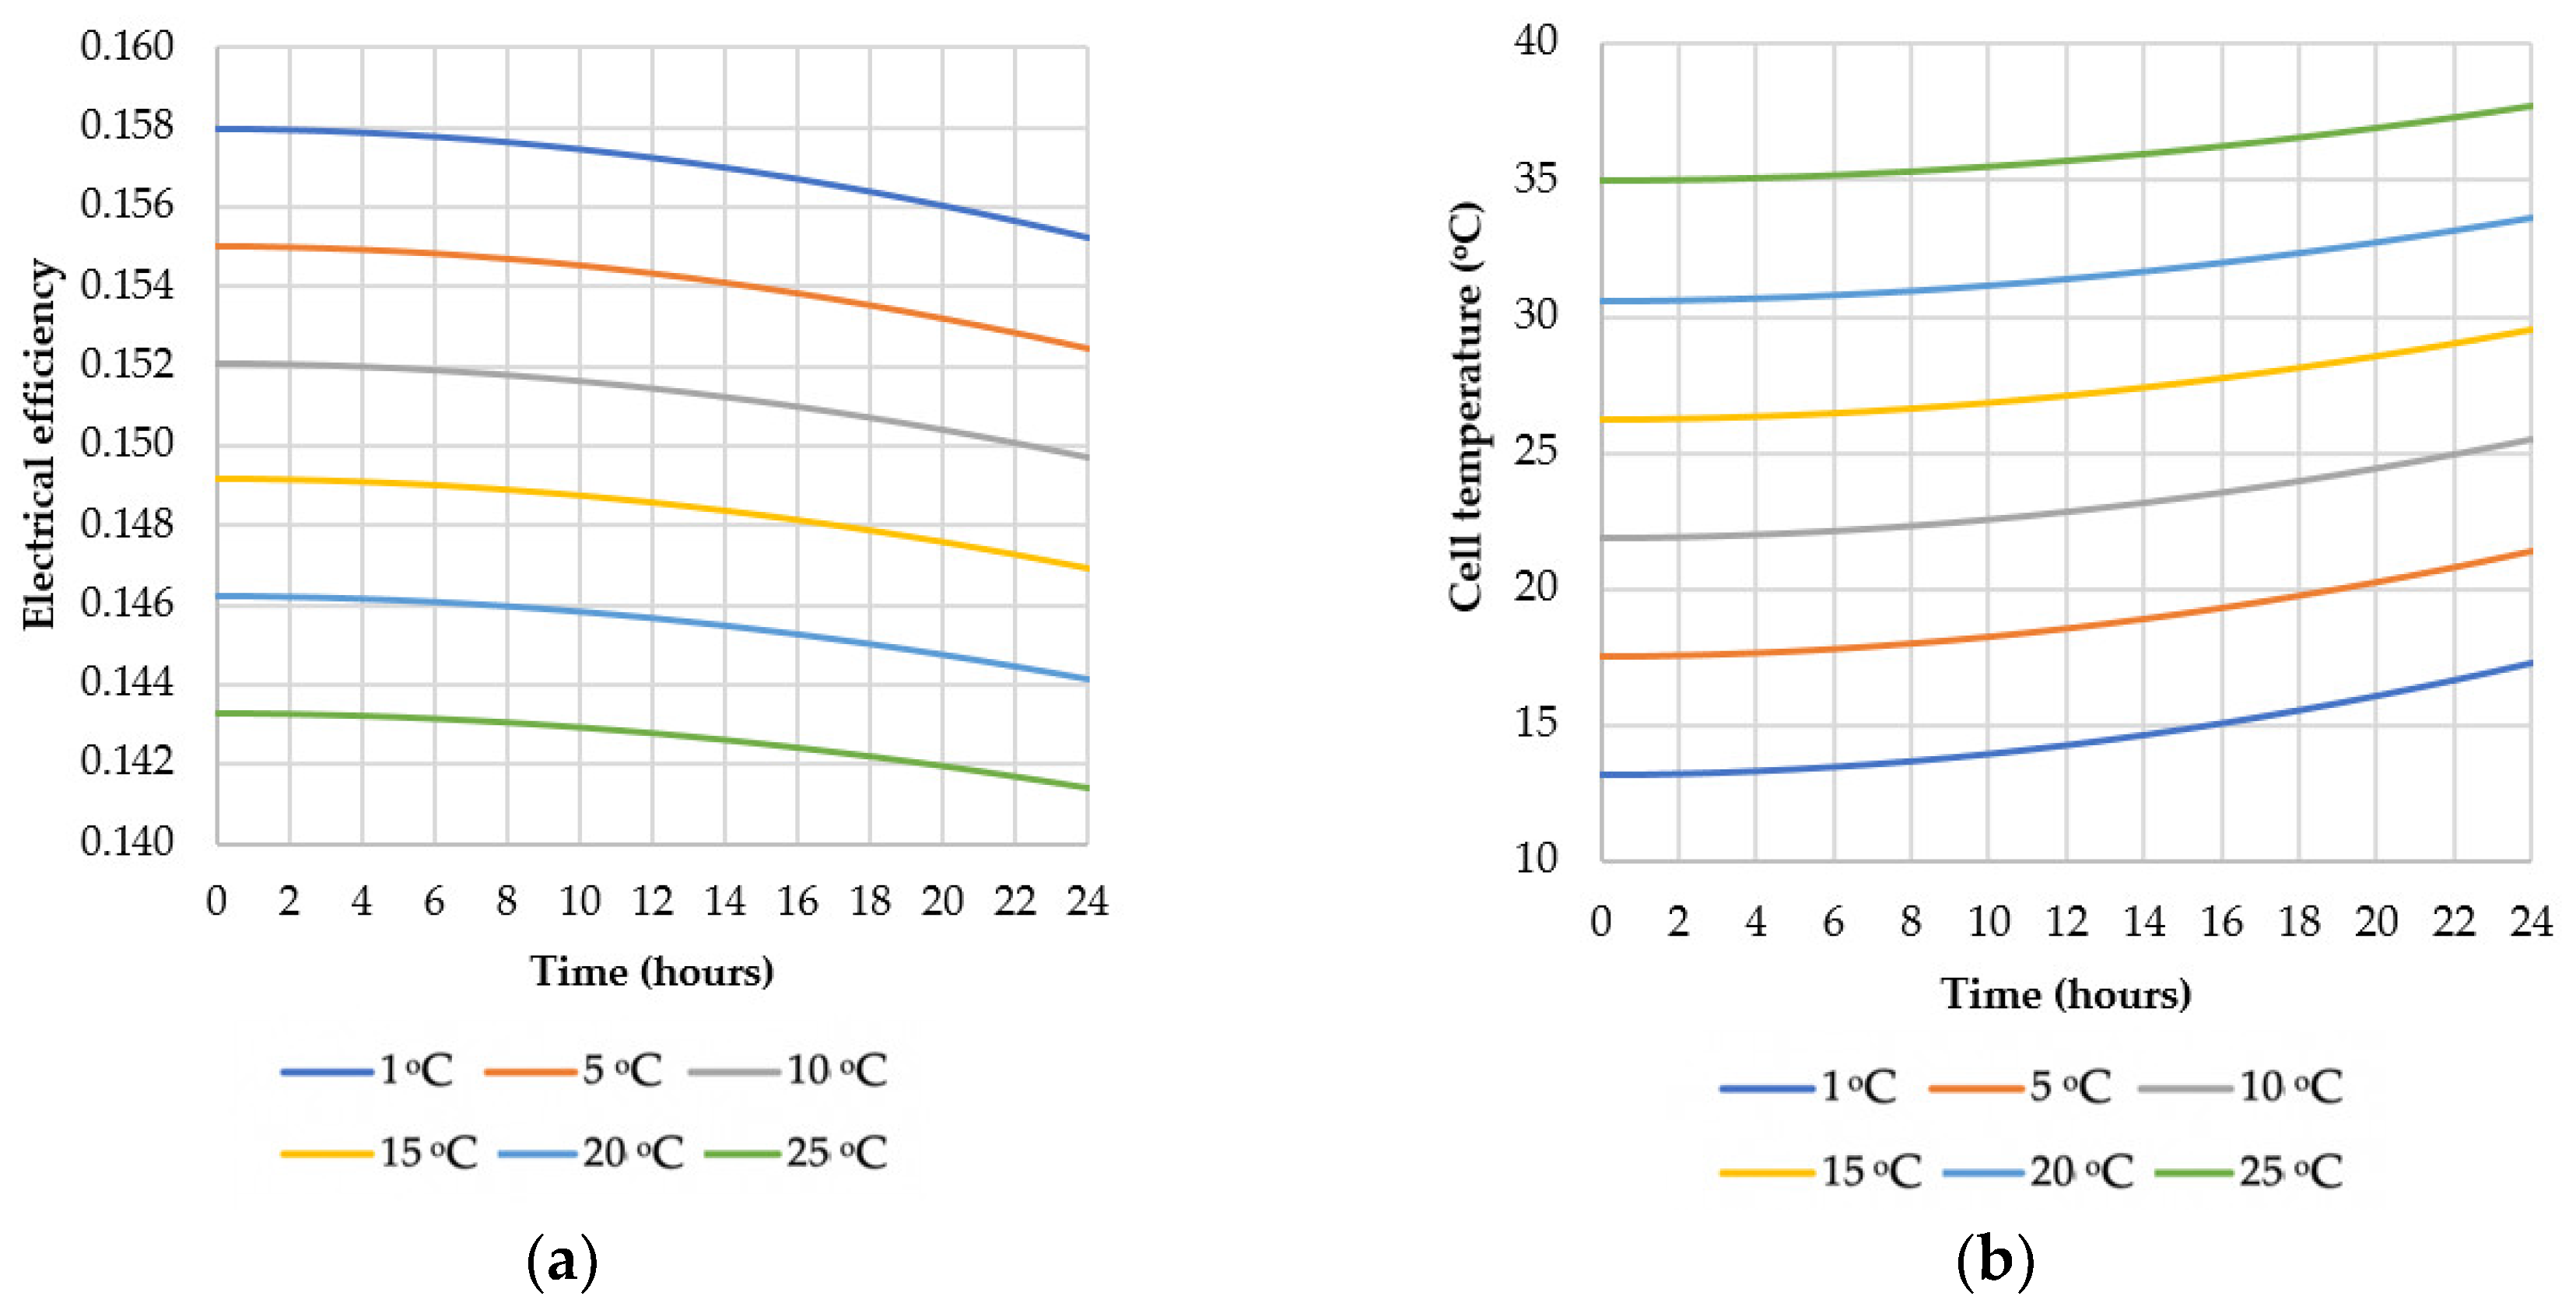
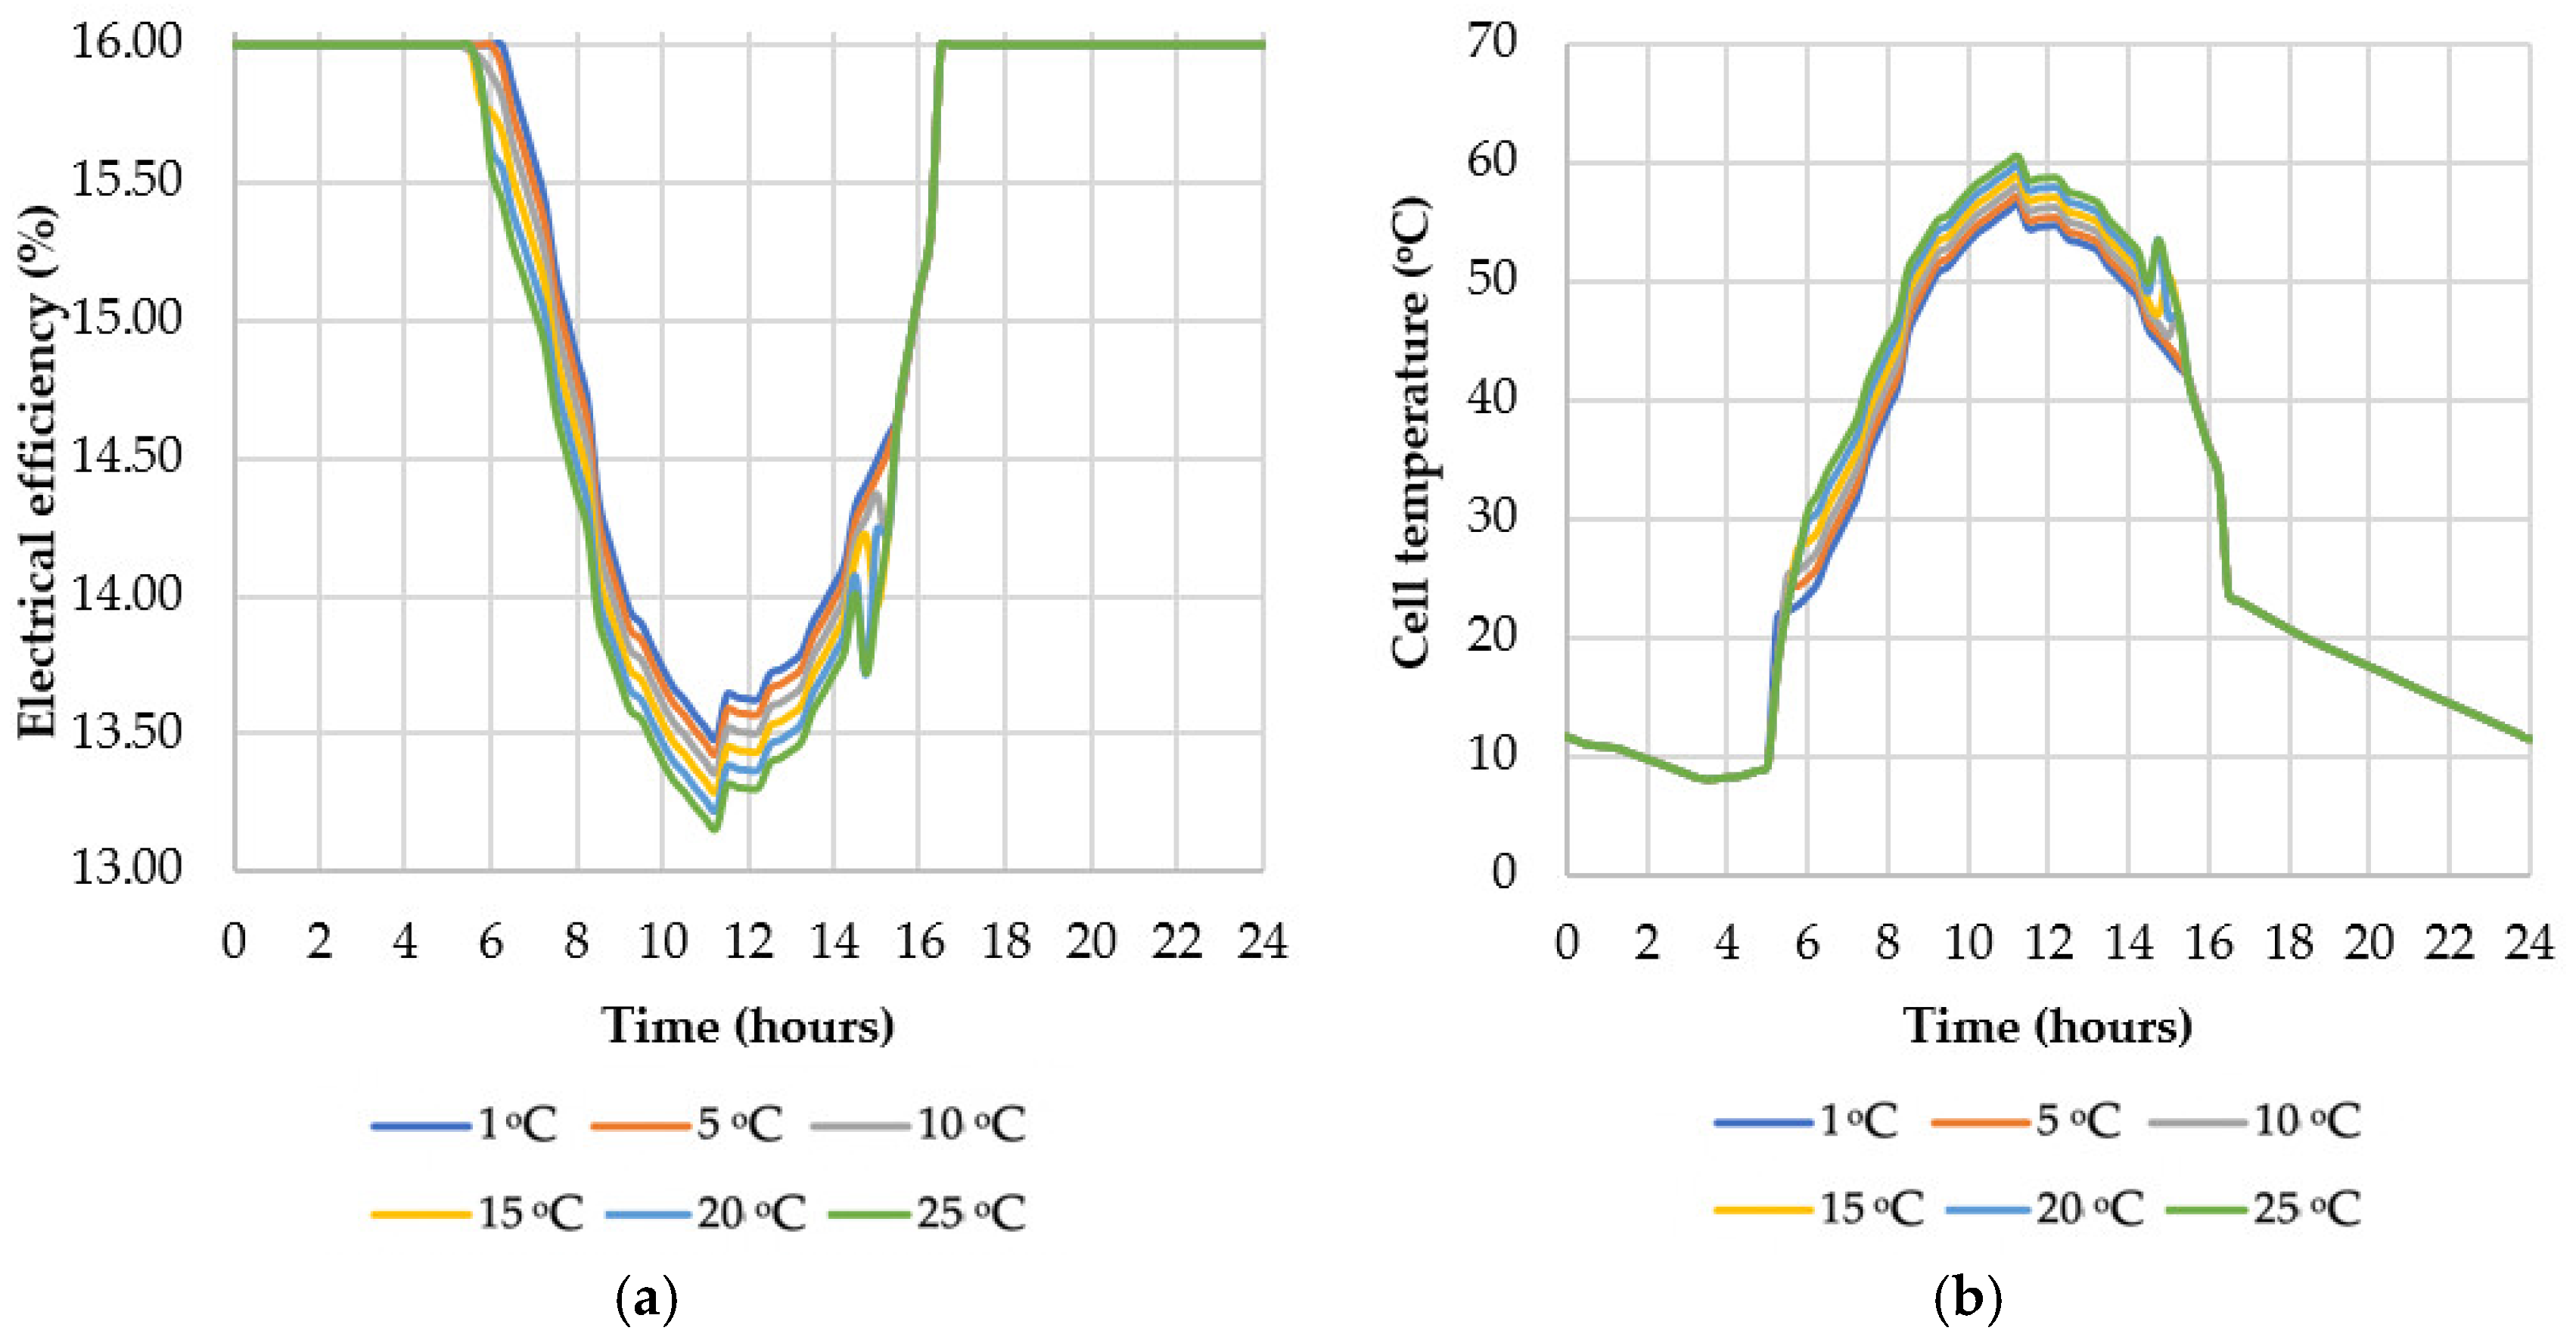
From the relationships above, the dependence of the electrical efficiency on the tank temperature can be computed. The simulation was run for a tank heat exchanger outlet temperature variation from 1 °C to 25 °C and the results are shown in Figure 4. As expected, as the temperature in the tank increases, there is an increase in the cell temperature and a decrease in the electrical efficiency.
However, the shortcoming of this analysis is the fact that tank temperature is not a parameter that can be set in the design process, but is in turn a function of various other factors relating to the tank. This simple simulation only takes into account a limited number of factors at the micro level of the panel. The interaction with the system parameters is not taken into account. To this end, in the next section, a system simulation was carried out in TRNSYS, with a PVT system connected to a storage tank.

2.2. Transient Model of a PVT System

A simple PVT system is shown in Figure 5. It consists of a PVT collector connected to a storage tank with a coiled heat exchanger, a circulation pump, an inlet for the cold water main, and outlet to the consumer and an inverter/regulator for the electrical energy.
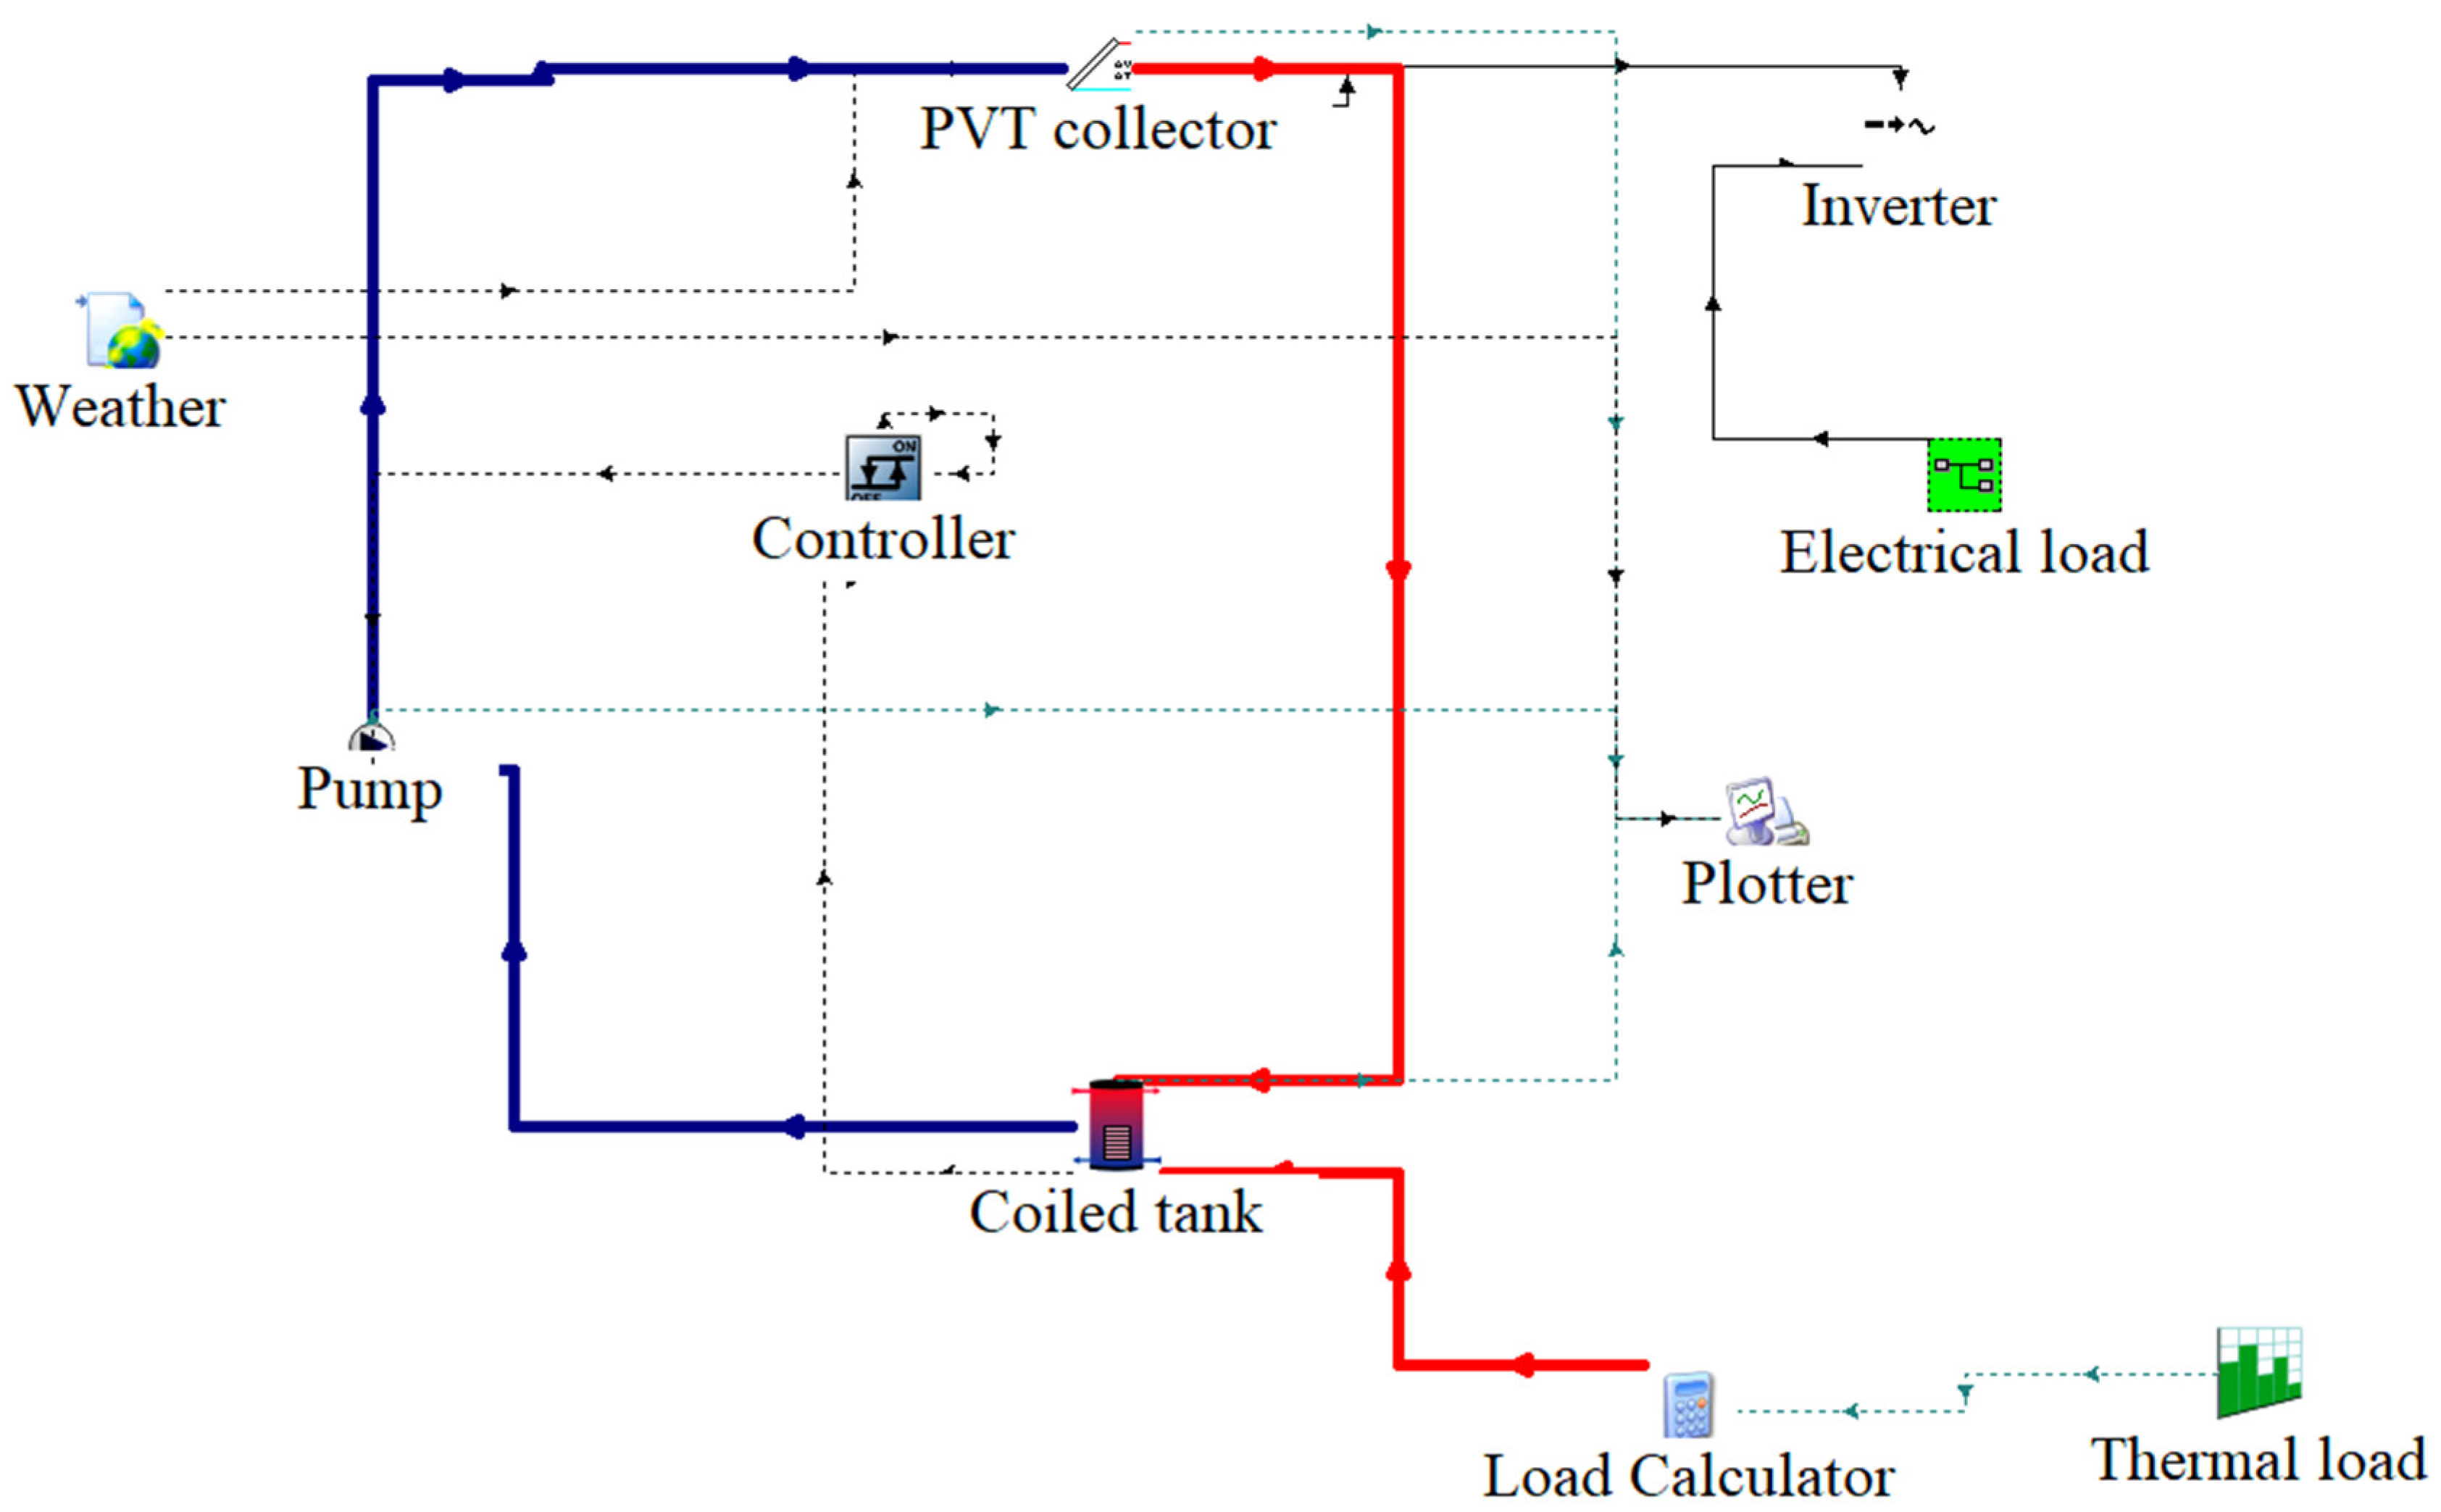
A TRNSYS model was developed to replicate the system in Figure 4, and it includes:
  • PVT collector Type 50d, modelled after DualSun Spring Hybrid panel. This type is a hybrid model that adds a PV module to the standard flat-plate collector. It simulates a combined collector and incorporates the analysis and work of Florschuetz [4] for flat plate collectors operated at peak power [26].
  • Coiled Water Storage Tank Type 534. The tank was modelled after a commercial boiler Viessman Vitocell 340-M. It is a constant volume storage tank with immersed heat exchangers. This component models a cylindrical tank with a vertical configuration. The fluid in the storage tank interacts with the fluid in the immersed heat exchanger, with the environment (through thermal losses from the top, bottom and edges) and with the flow streams at the inlet and outlet of the storage tank [26].
  • Controller Type 2b. The on/off differential controller generates a control function which can have a value of 1 or 0. The value of the control signal is chosen as a function of the difference between upper and lower temperatures Th and Tl, compared with two dead band temperature differences DTh and DTl. The new value of the control function depends on the value of the input control function at the previous timestep. The controller is normally used with the input control signal connected to the output control signal, providing a hysteresis effect [26].
  • Circulation pump Type114. A single (constant) speed pump that is able to maintain a constant fluid outlet mass flow rate. It sets the downstream flow rate based on its rated flow rate parameter and the current value of its control signal input [26].
  • Inverter/Regulator 48d. Models both the regulator and inverter, operates in Mode 1: Peak-power tracking collector, monitoring state of charge [26].
  • Output online and offline printer Type 65c. The online graphics component is used to display selected system variables while the simulation is progressing. Data sent to the online plotter are automatically printed, once per time step, to a user defined external file [26].
  • Forcing function for defining the demand curve Type 14h. This is a repeated pattern. The pattern of the forcing function is established by a set of discrete data points input by the user which indicate the value of the function at various times in a cycle. Linear interpolation is done for generating a continuous function from the discrete data [26].
  • Weather data Type 15. It reads data from the Meteonorm database at regular time intervals, interpolating the data at the required timestep and transmits it to other TRNSYS components [26].
The TRNSYS PVT component Type 50 was developed using the Hottel–Whillier–Bliss equations based on the work of based Florschuetz [4]. The useful thermal output of the Type 50 is defined as:
Q u = A c F R [ S U L ( T f , i T a ) ]
where Ac is the area of the collector (m2), FR is the heat removal factor (-) and Tf,i is the inlet temperature of the fluid (°C). The electrical output of the system is defined as:
Q e = A c S η a α { 1 η r β r η a [ F R ( T f , i T a ) + S U L ( 1 F R ) ] }
where ηa is the efficiency of the cell at ambient temperature (%), α is the effective absorbance of the cell (-), ηr is the reference cell efficiency (%), and βr is the temperature coefficient of the cell (%/K).
The alternative modelling method to Type 50 is a 3d heat transfer model that accounts for the heat transfer mechanisms in the layers of a PVT panel. However, for the purpose of a quantitative analysis energy production and efficiency, the TRNSYS model was validated with experimental data in a number of studies [27,28]. This particular system was not found replicated in the literature in an experimental set-up. As a result, validation with real data was not possible. This is an interesting topic for further research.
The simulation assumes that the optical properties of materials are constant, heat pipe losses are negligible, and no surrounding partial shading or dusting is considered. Thermal losses occur in the heat exchanger of the tank, which has an overall efficiency of 90%, as well as through top, edge and bottom losses, with a thermal loss coefficient of 5 kJ/(hm2K). The inverter has an electrical efficiency of 98%. The TRNSYS system is shown in Figure 6.

2.3. Parametric Analysis

The parametric analysis is performed according to the one factor at a time method (OFAT). The goal of this analysis is to identify the impact that each of the parameters has on the electrical efficiency of the panel. The ‘default’ parameters are listed in Table 1 below. The PVT area is equivalent to that of a system consisting of two PVT panels, assumed to be connected in series.
For the analysis, one of the parameters is varied according to Table 2 below, while the rest are kept constant to ‘default’ values. The simulations are run for 24 h, and they are the equivalent of an indoor experimental set up.

3. Results and Discussion

In this section, the result of the OFAT analysis will be presented and discussed.

3.1. Tank Inlet Temperature

The inlet temperature in the tank is dependent on the temperature of the cold water main, which can vary on the Globe up to 25 °C, with an optimum of 7 °C [29]. For this study, the temperature was varied from 1 to 25 °C to see the magnitude of the effect on the electrical efficiency of the panel. It’s expected that colder water will lead to better cooling of the system and better cell efficiency.
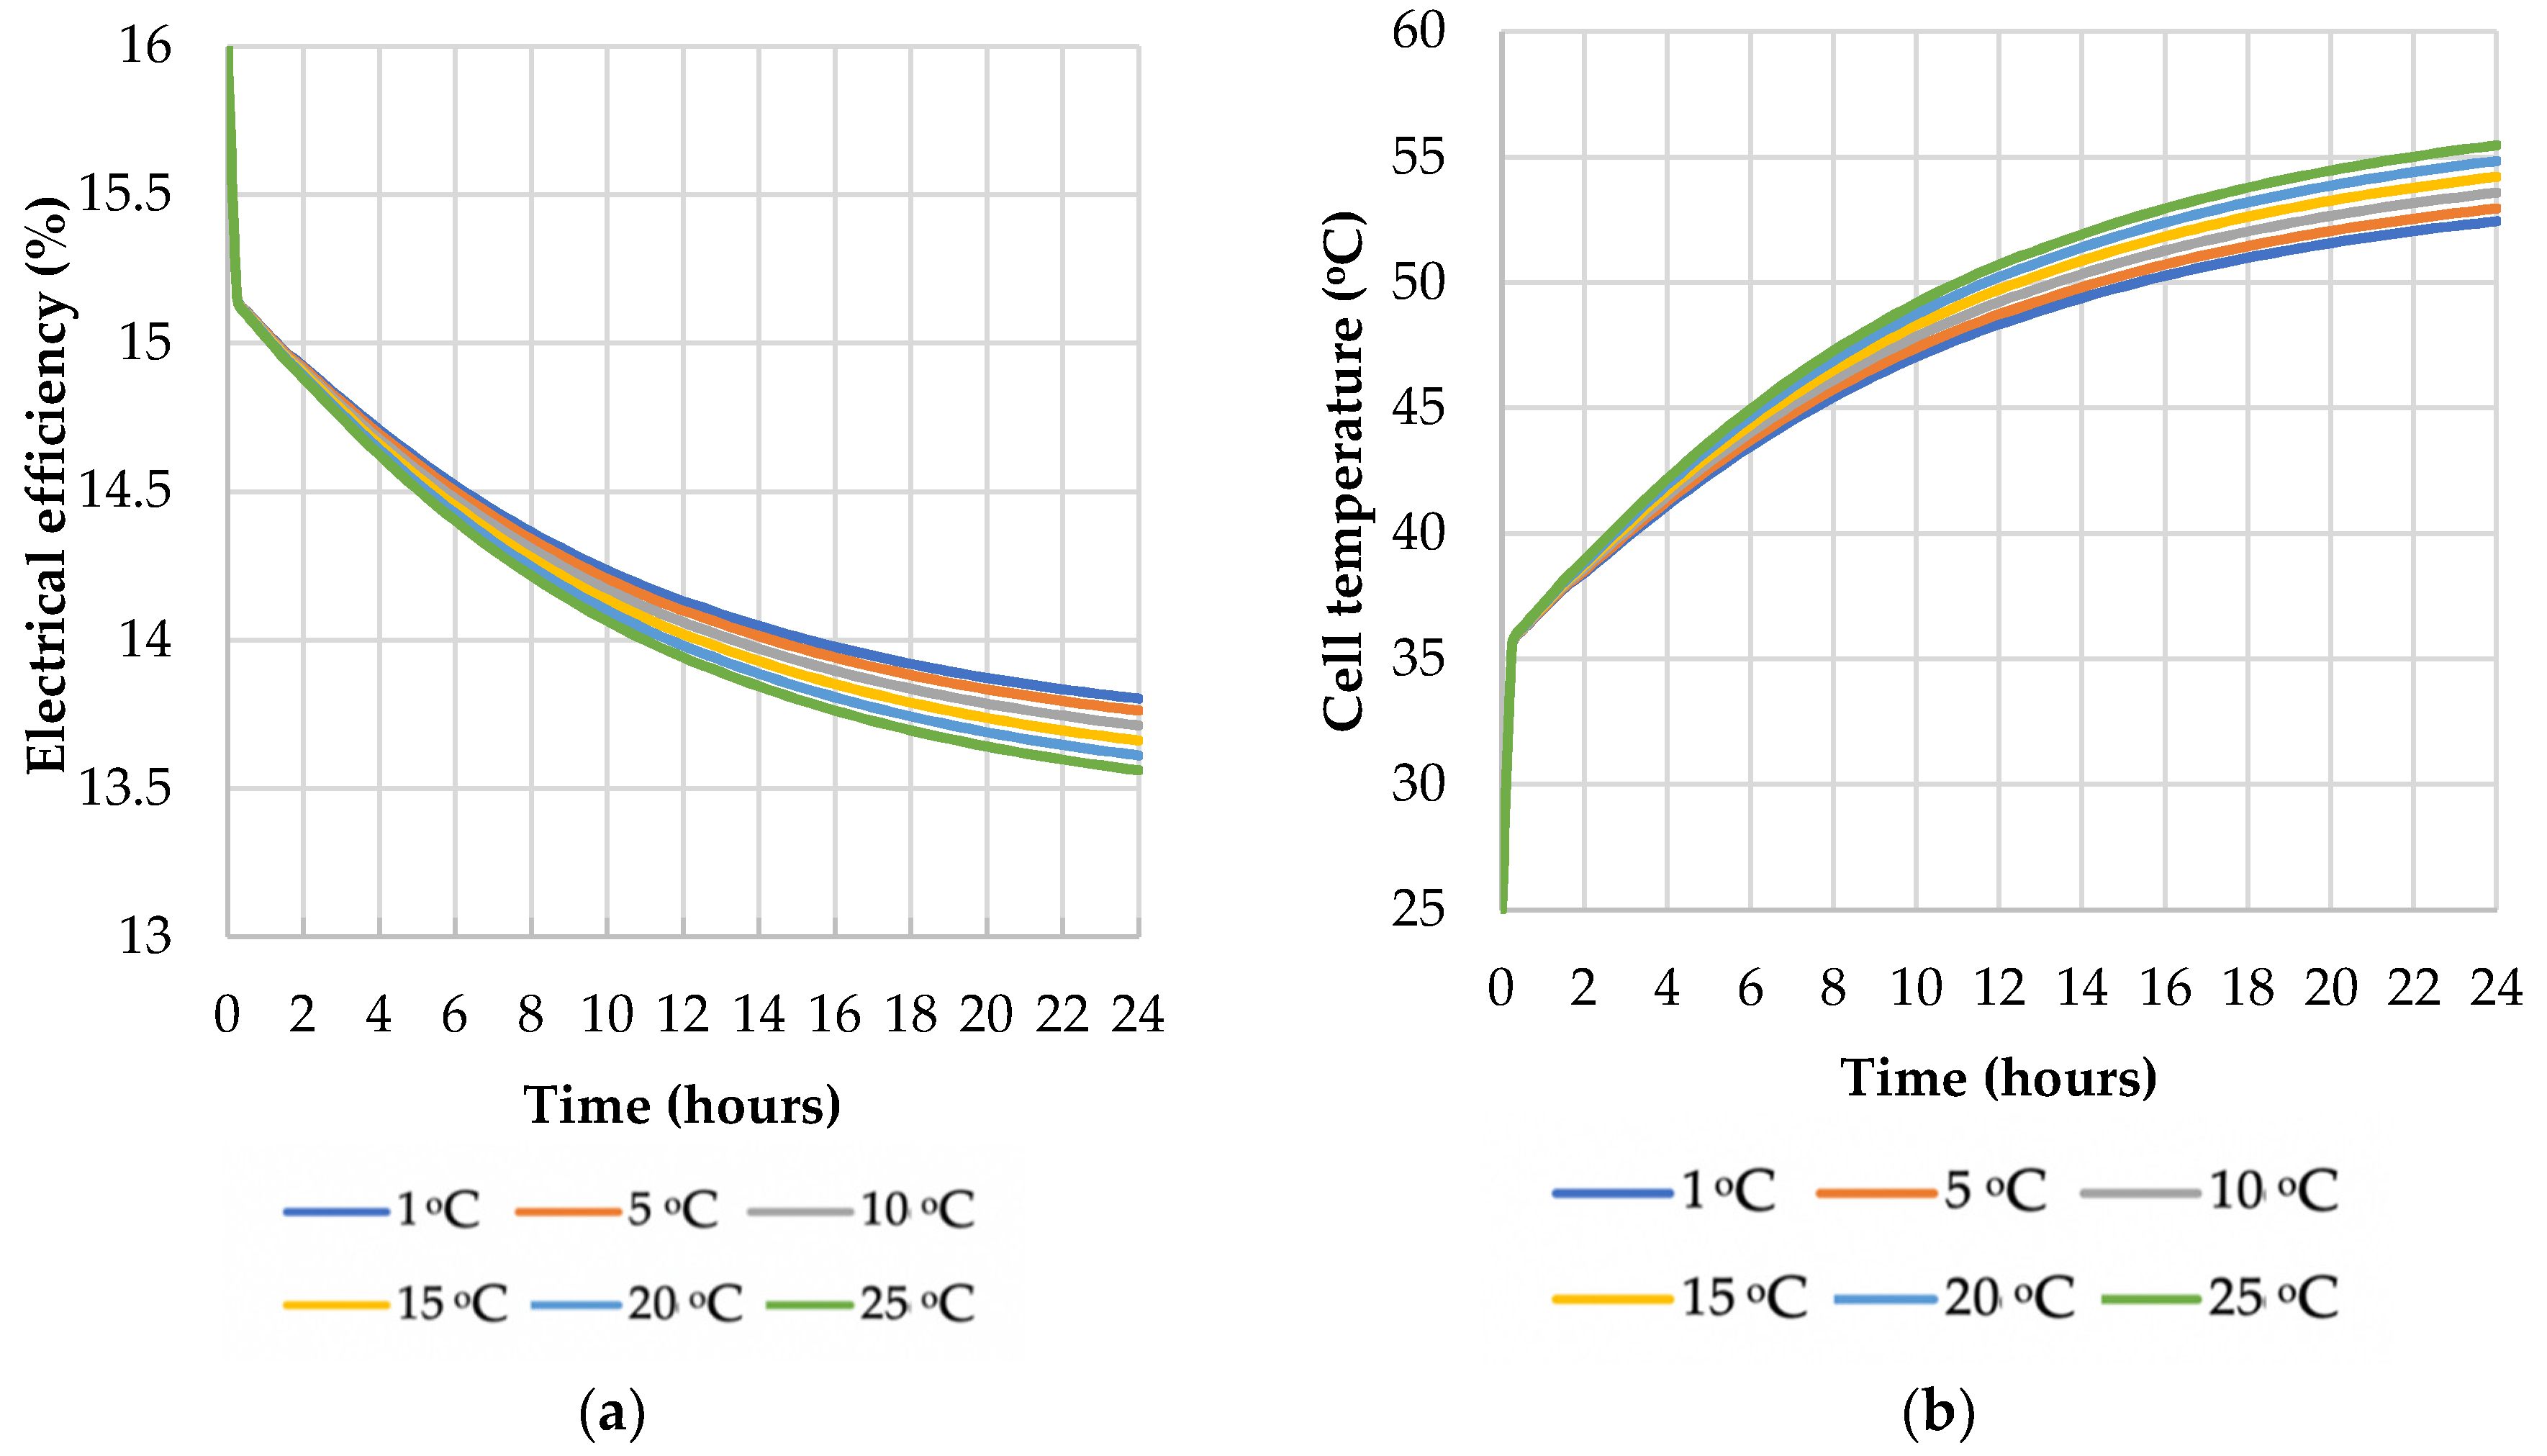
The graphs in Figure 7 illustrate the results of the simulation in terms of electrical efficiency and cell temperature. In the initial state, before the temperature rise, the electrical efficiency of the PVT panel is shown to have the default value of 16%. However, this is only theoretical as there is no electricity production before the beginning of the solar radiation. As the temperature in the cell begins to rise above the STC of 25 °C and the solar radiation begins, the production of electrical energy starts and the temperature of the cell rises. The results indicate a small and proportional decrease in the electrical efficiency with higher tank inlet temperatures, with a variation of only 0.2%. That being said, the inlet temperature from the cold-water main is a constant in any given location of the system, so this analysis can only be applied when comparing equivalent systems in various locations.
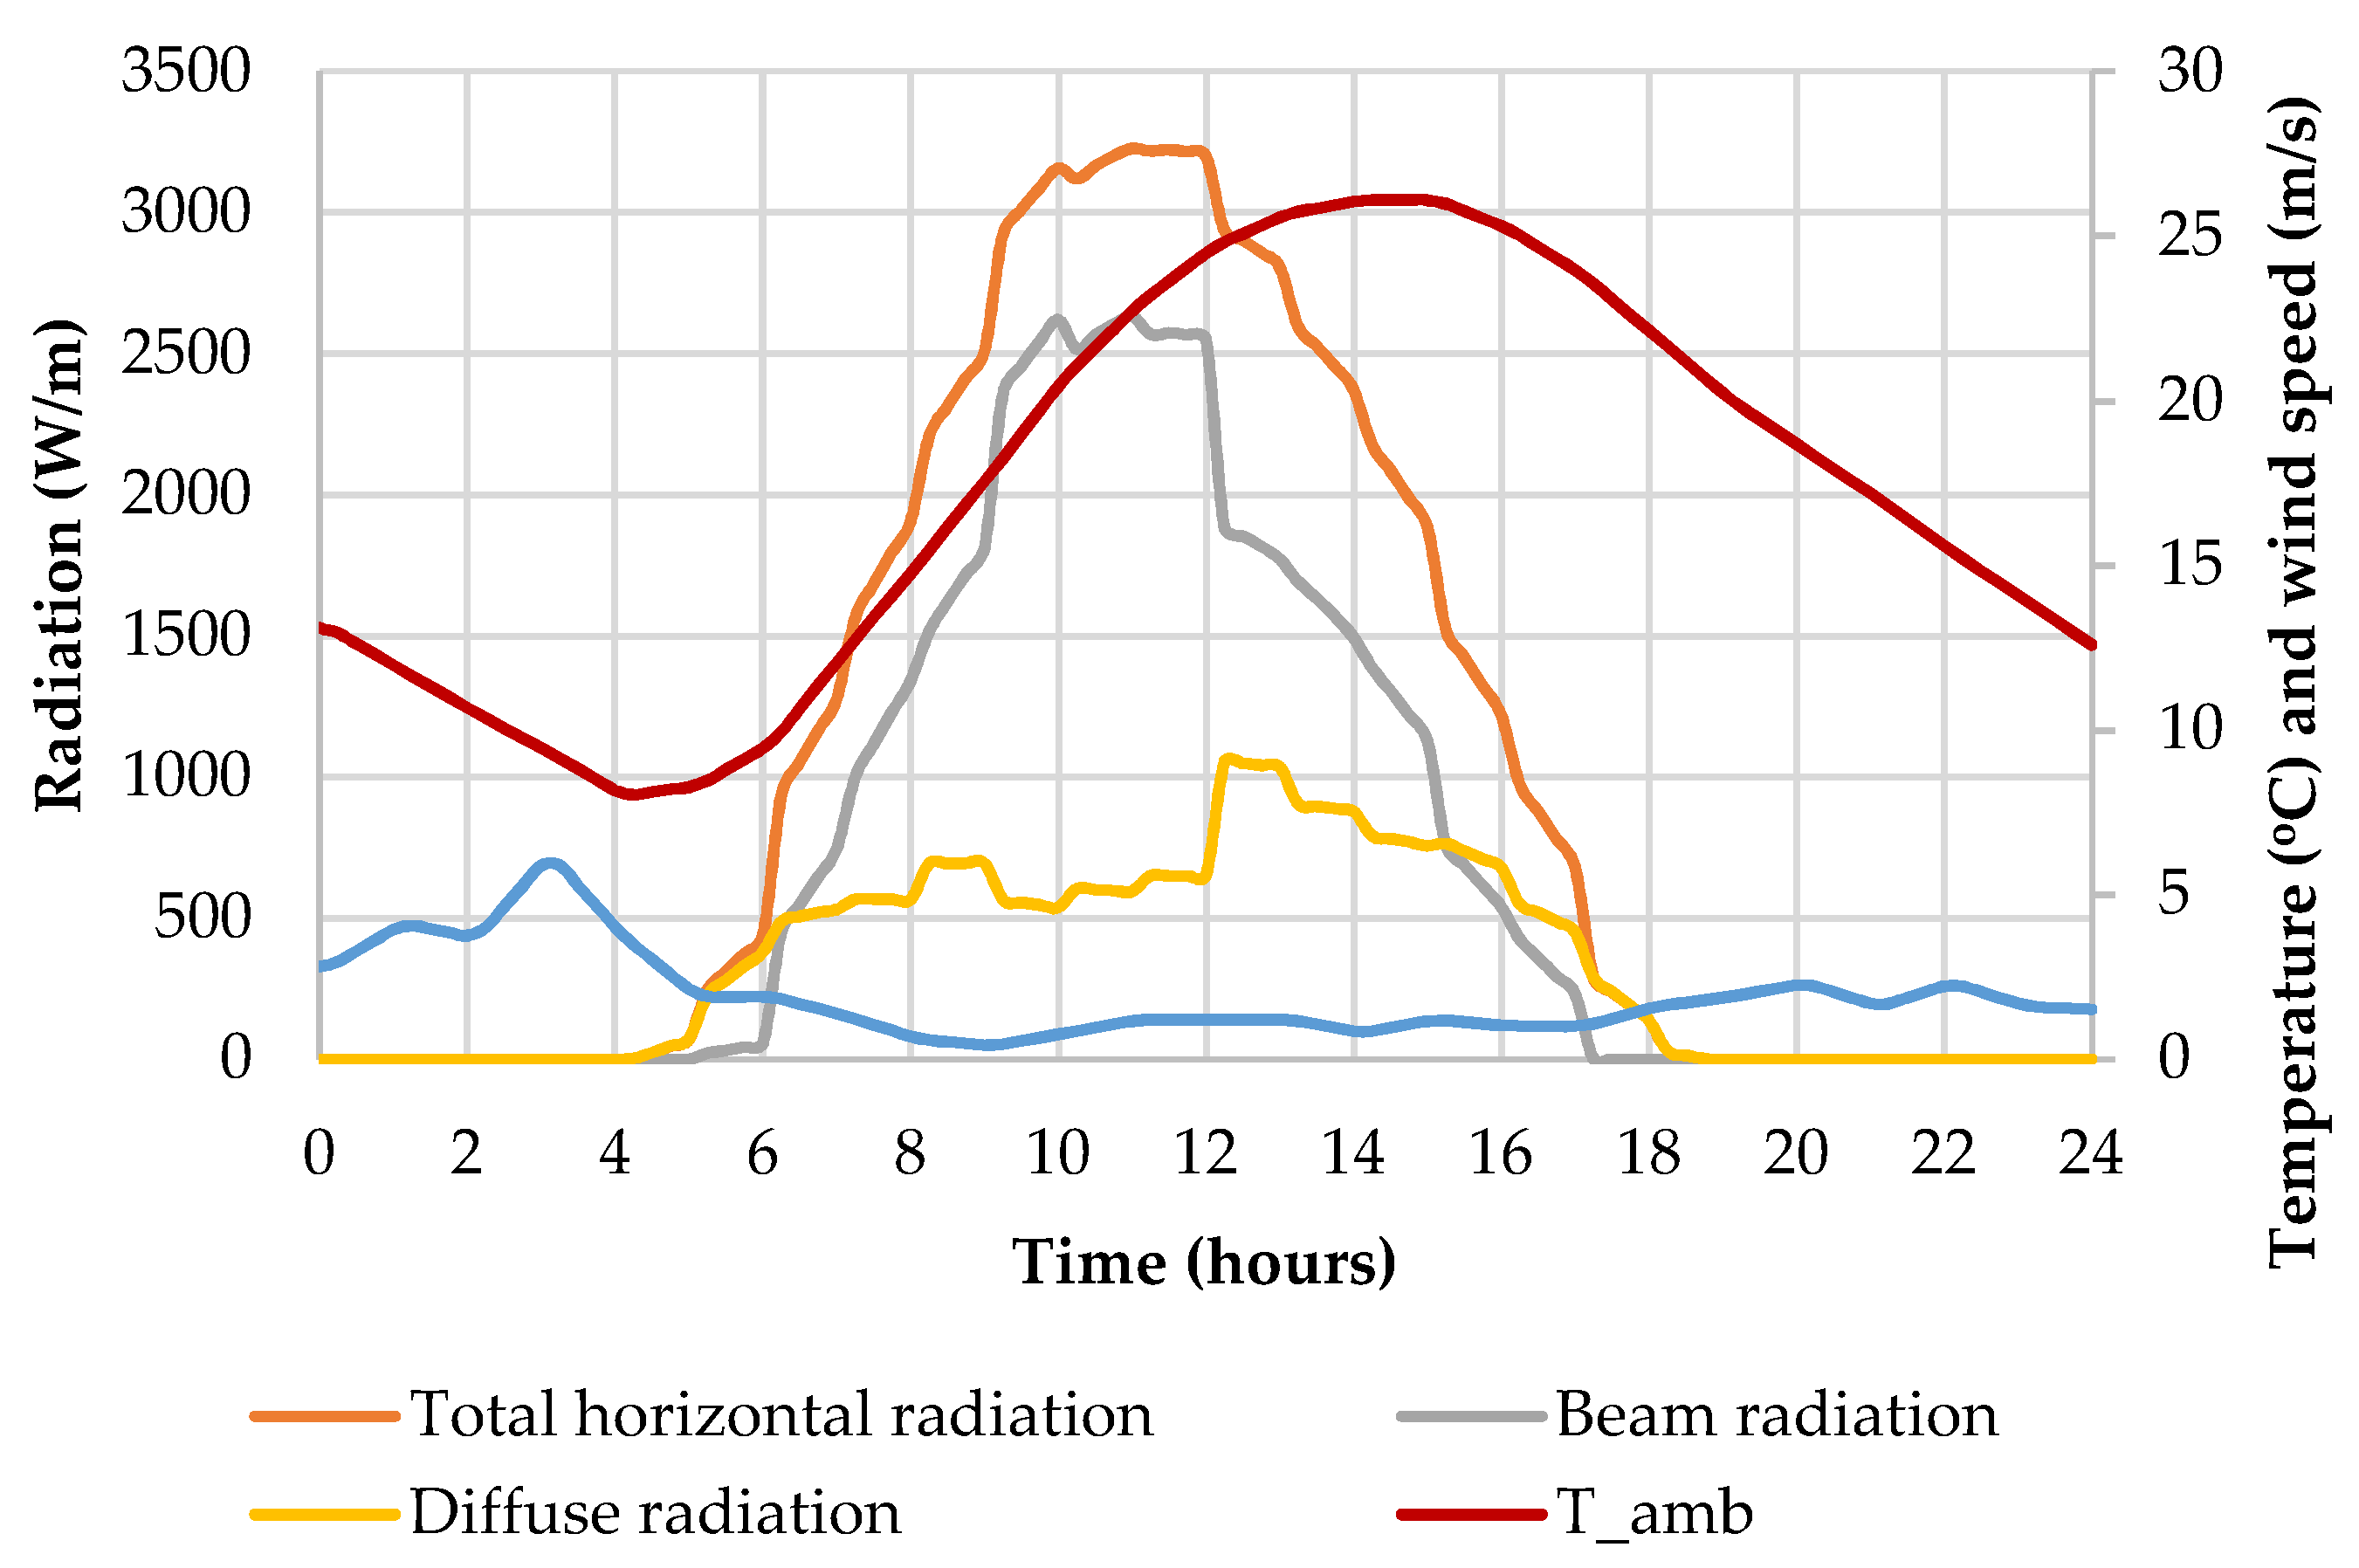
As a comparison and in order to ensure the theoretical constant parameter simulation would also work for actual meteorological conditions, the same simulation was run for a typical summer day in Bucharest, Romania. In this case, the solar radiation and temperature were no longer constant according to Table 1, but varied according to Figure 8. The results are shown in Figure 9. It can be observed that the same proportional difference as in the OFAT analysis is kept between the steps, but the efficiency drops even lower to 15.7% with a cell temperature of 60 °C due to temperatures and radiation being higher that the STC at midday. The peak occurs at maximum radiation around noon, with an additional spike around 16 due to the peak ambient temperature. The rest of the simulation results are run for constant STC conditions.

3.2. Tank Volume

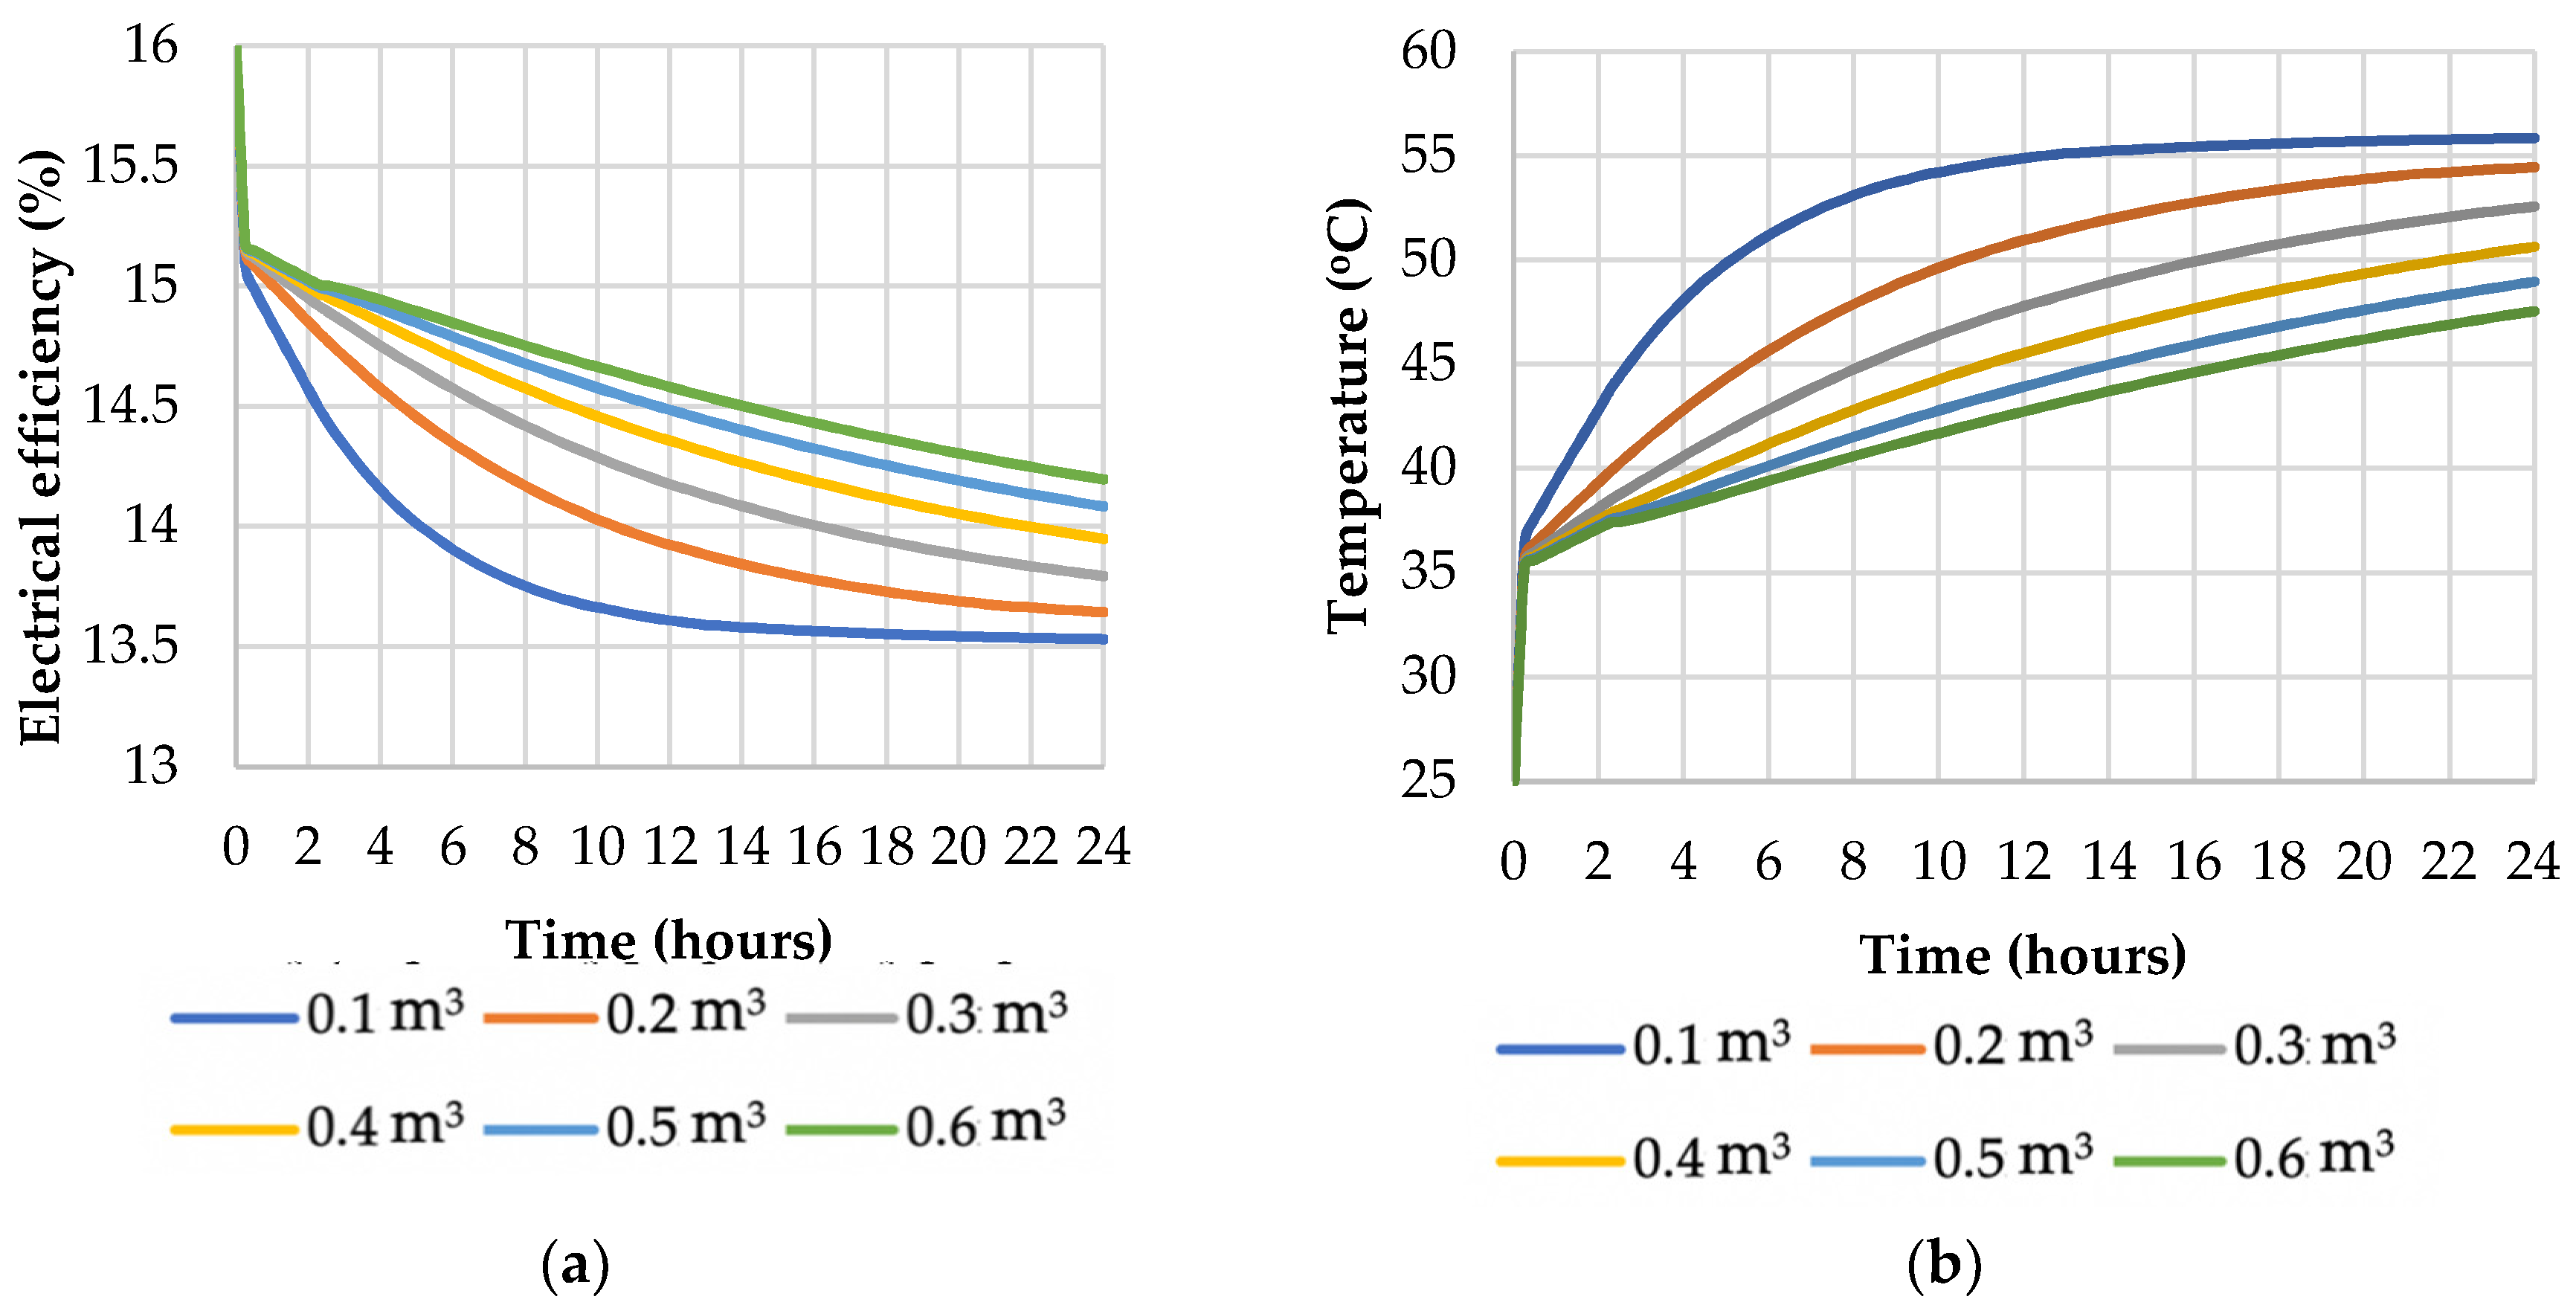
The default volume of the modelled tank is 600l. For the parametric variation, the tank is scaled down to 100l, with increments of 100l up to 600l. The results of the simulations are shown in Figure 10. In this case, the difference between the steps is not proportional as observed for the inlet temperature. With the smallest tank size, a steep decrease in efficiency occurs, followed by a flat curve down to 13.5%. As the tank size increases, the efficiency also increases as the temperature in the tank is lower, and also the shape of the curve changes to a constant slope. The difference between the highest and lowest step is more significant than in the previous simulation, with a value of about 0.7%. With the smallest tank size of 100l, the curve flattens to a value of 13.5% for electrical efficiency, and after this point there is no further decrease.

3.3. Flow Rate to Consumer

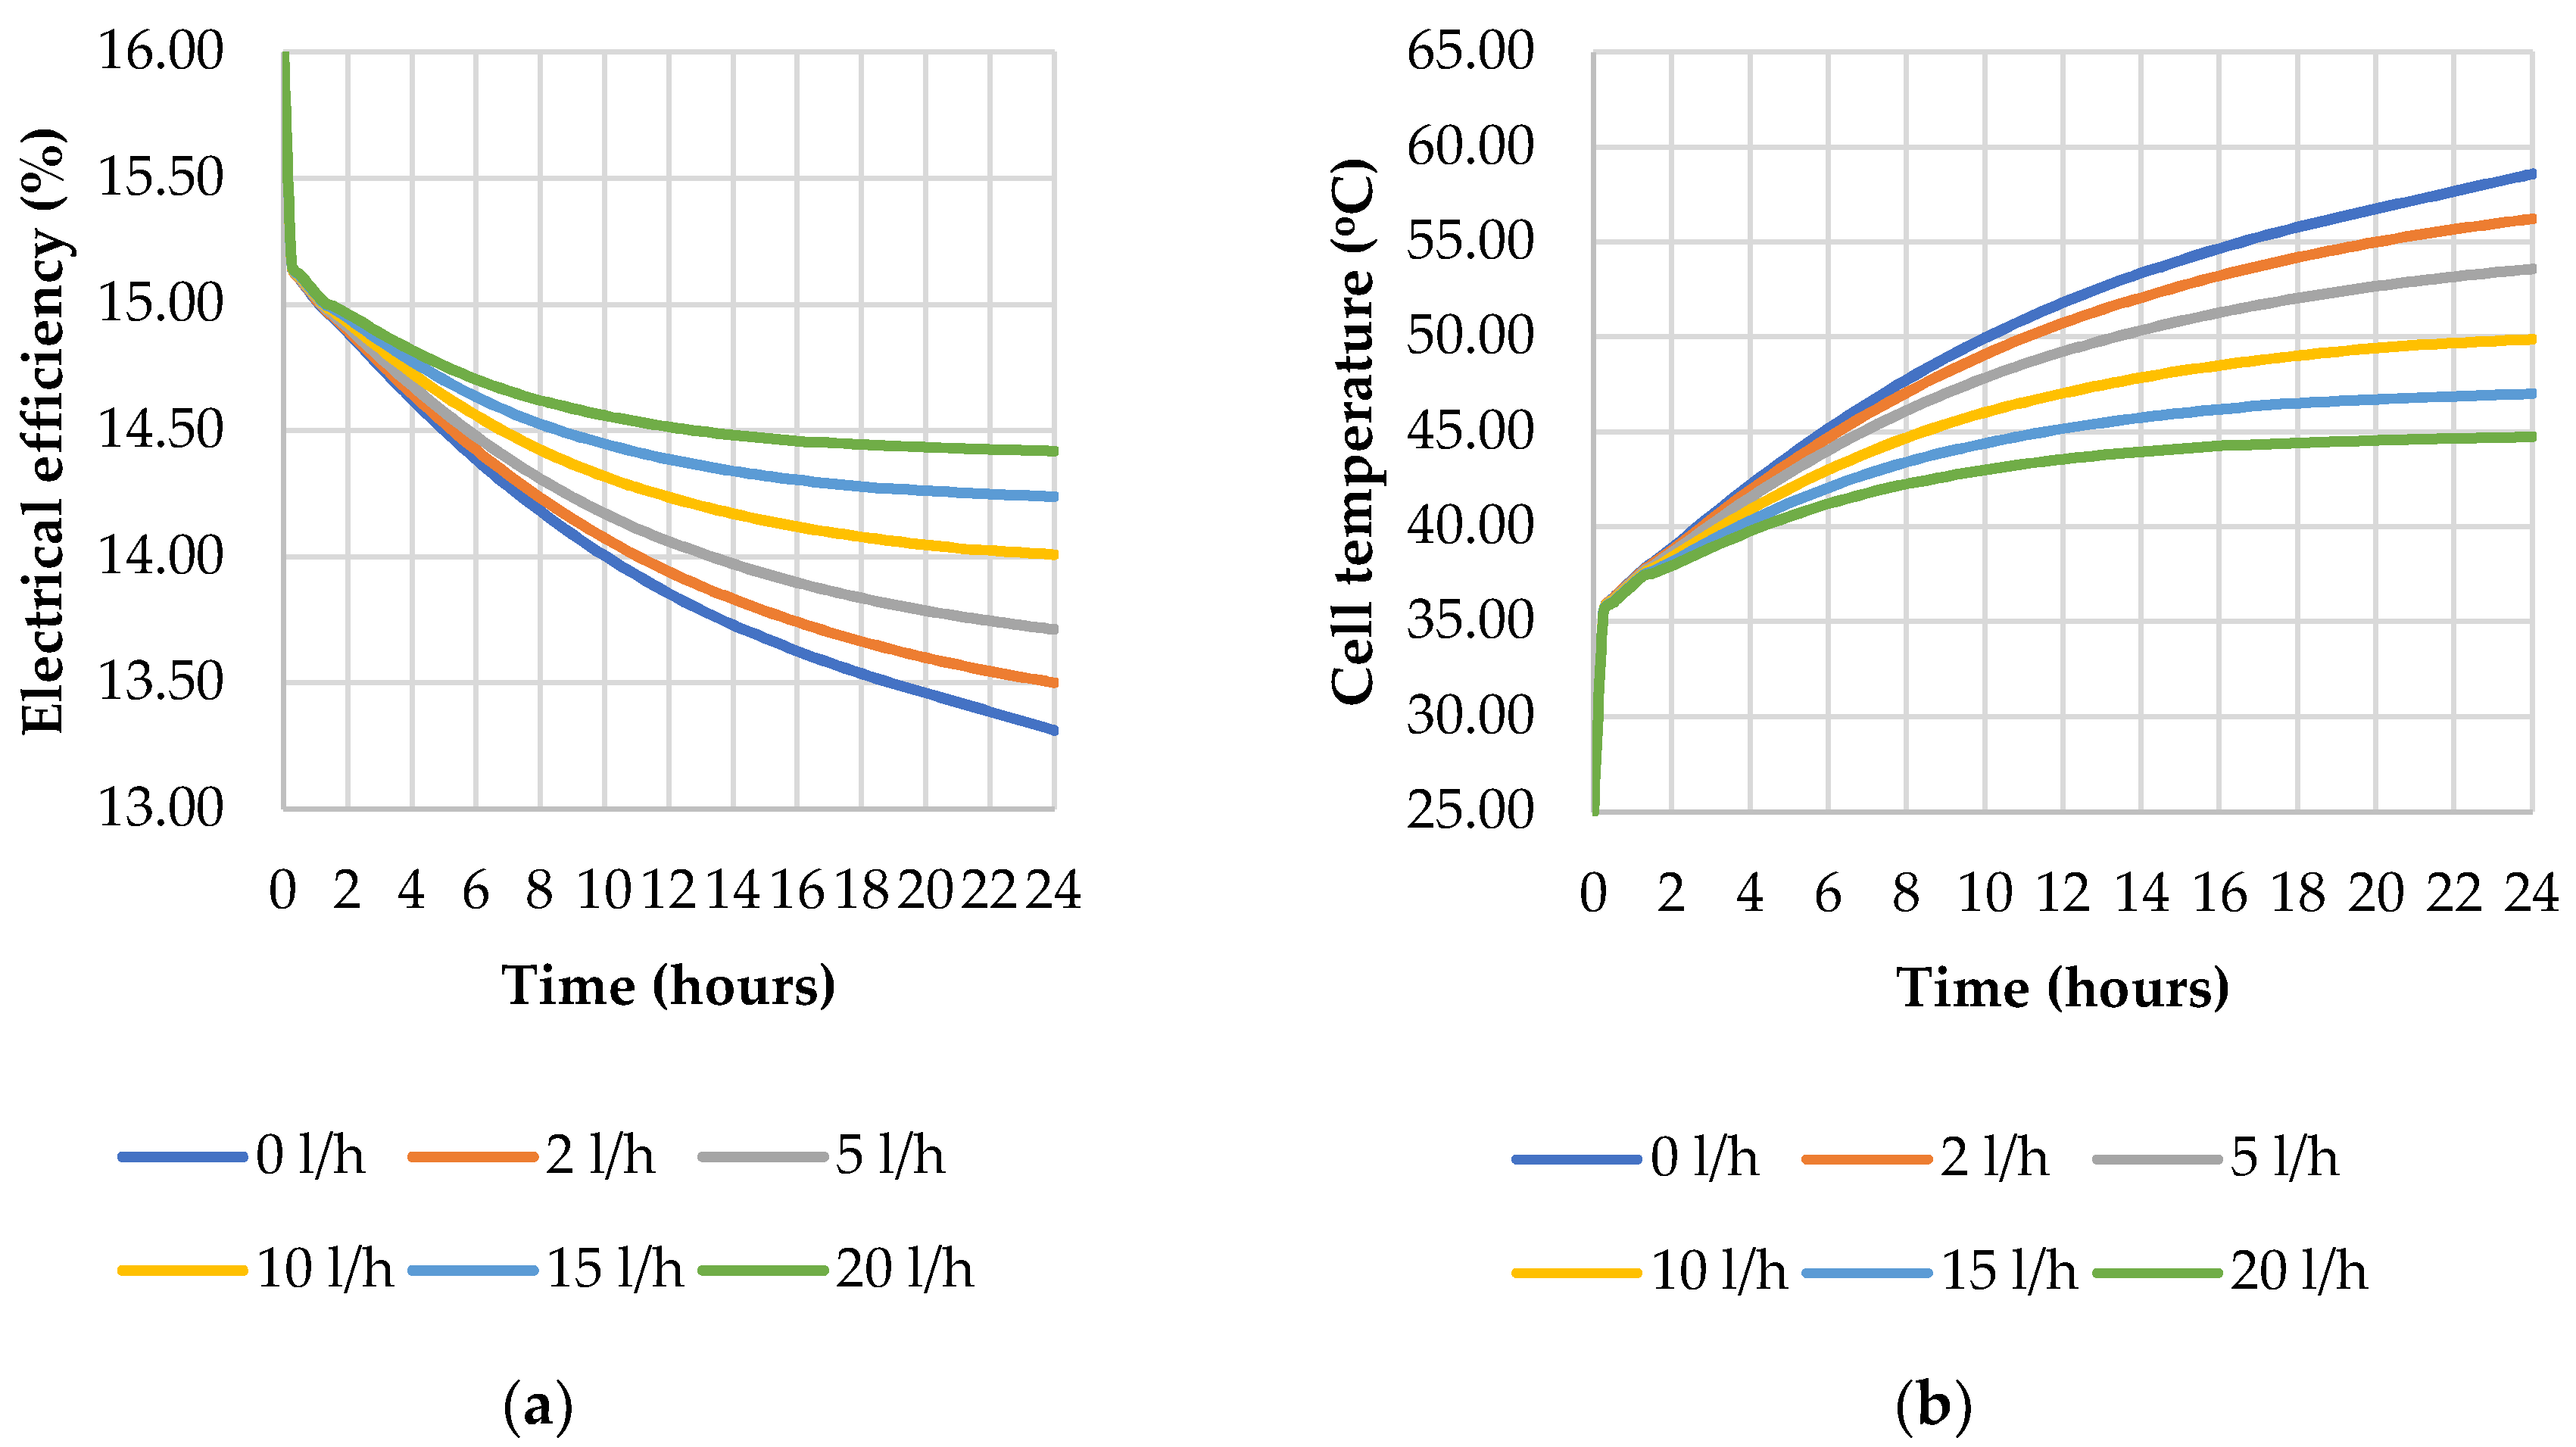
The flow rate at the outlet of the tank is equivalent to the rate of consumer demand. In this case, the simulation was run for volumes of 0–20L/h. This is the equivalent of 0–480 L/day.
The results in Figure 11 indicate that the higher the water draw, the better the electrical efficiency. This is due to the fact that hot water in the tank is replaced with cold water from the main at a higher rate and the cell is better cooled. The difference between the maximum and minimum simulation step is 1.1%. With a lower flow rate, the curve is steeper, and the stabilization point is further along in time.

3.4. Various Demand Curves

The daily profile of hot water is dependent upon various parameters: type of building, the number of end-users, appliances, ambient condition, seasonal variations, the average daily hot water volume and the yearly demand [30].
The default household hot water demand was obtained using the DHW-calc software, which can generate realistic DHW profiles for European countries for any required period of time and timestep [31,32]. A number of initial parameters are defined (total mean daily water volume, probability distribution, holidays).
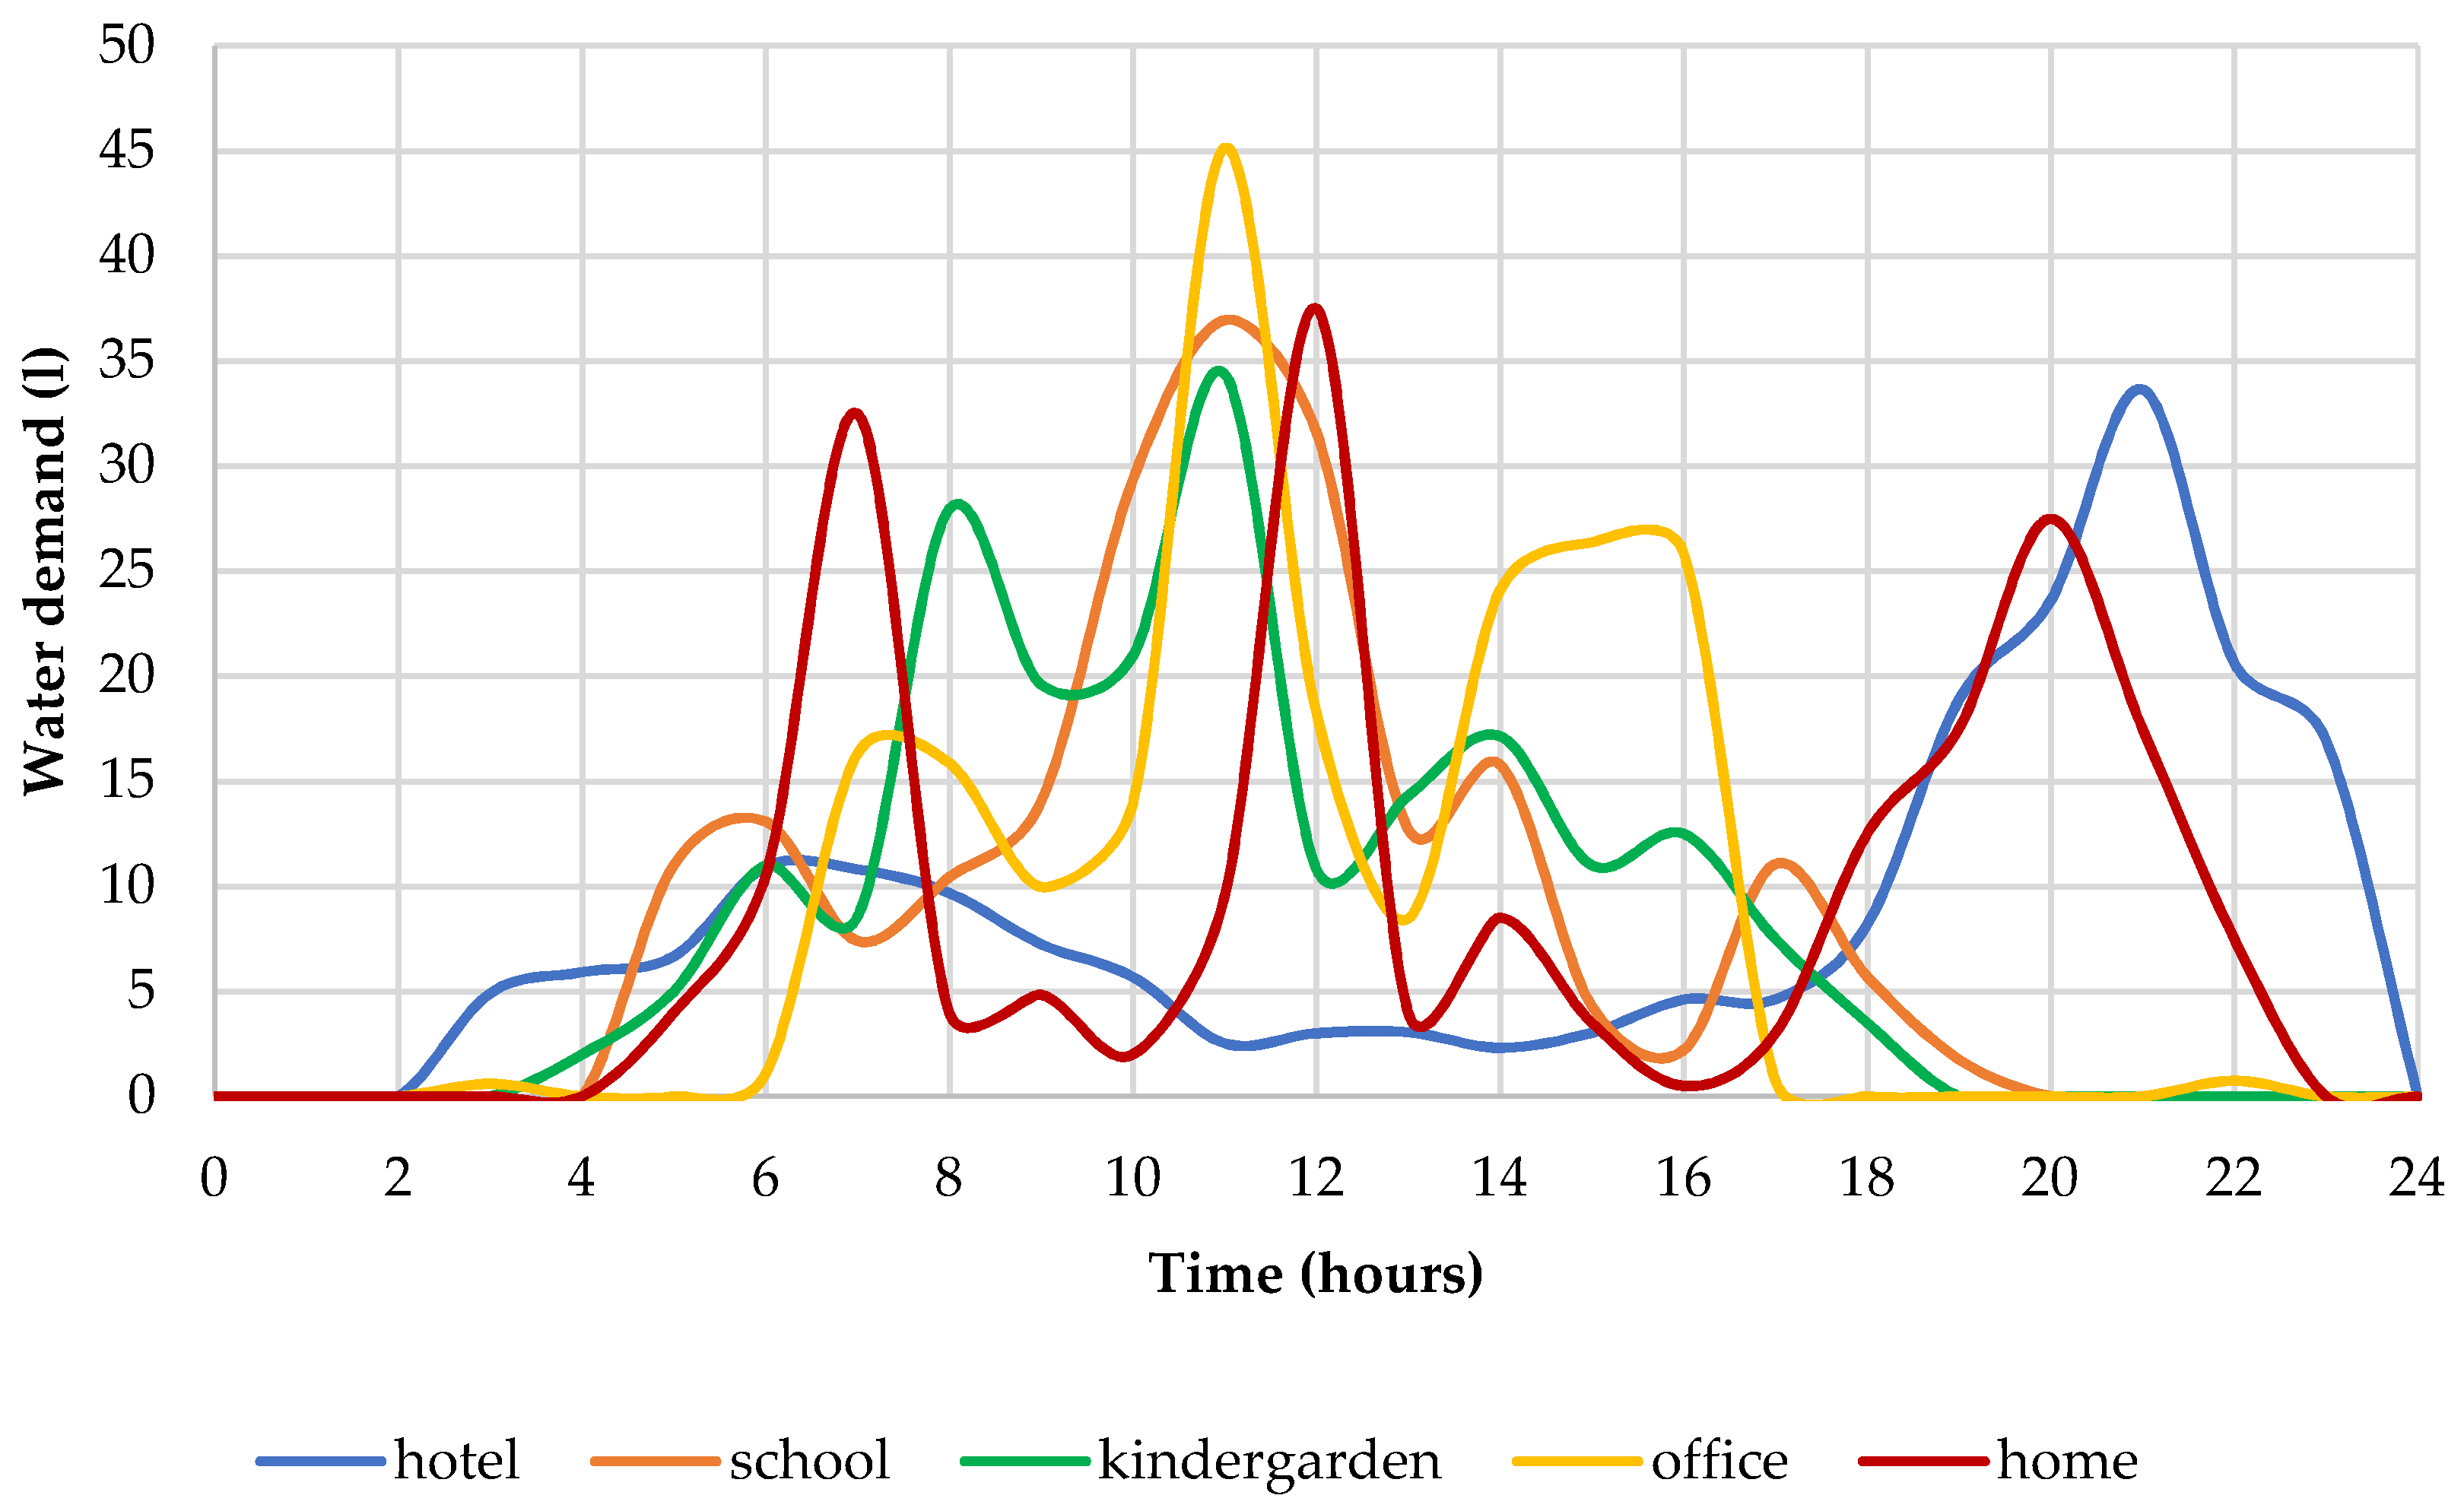
The hot water demand of the hotel was taken from a study with real measurement of the demand of one double room with two occupants in a city hotel, located in downtown Kyoto city [33]. The curve is shown in Figure 12. The demand of a hotel is particular compared to the household, as we can observe that the peak demand occurs later in the evening, as typically hotel guests are out late. The measurements are taken in Kyoto, Japan, which has a temperate humid climate, different from the temperate continental climate of Bucharest. This means that the amount of water drawn is also different, since ambient conditions are an important factor in the amount of water demand [34,35]. However, since all the demand curves were scaled down to match each other at 200 l/day, the important factor here is not the total volume, but the daily distribution, which is typical to hotel guests in big cities (out during the day, up late in the night).
Other profiles considered are those of a kindergarten and school. They show similar curves with slight variations, both peaking at midday when there is the maximum water draw for lunchtime. The data was collected from a study [36] where the gym was excluded from the school campus, as it would considerably impact the curve.
The demand curve of the office building was adapted from a small office building in Estonia [36]. The curve peaks at midday, with an additional period of consumption at the end of the office hours.
The demand data are summarized in Table 3.
For the parametric study on the demand curve, an average total water draw of 200 L was considered for the daily usage, varying only the daily curve distribution according to the source data. In the case of larger users, such as hotels or office buildings, this is an assumption that scales down the size of the user to an equivalent home. The demand curves are illustrated in Figure 12 for a typical weekday (Monday–Friday, scaled down from the data to reach an area under each curve of 200 L/day).
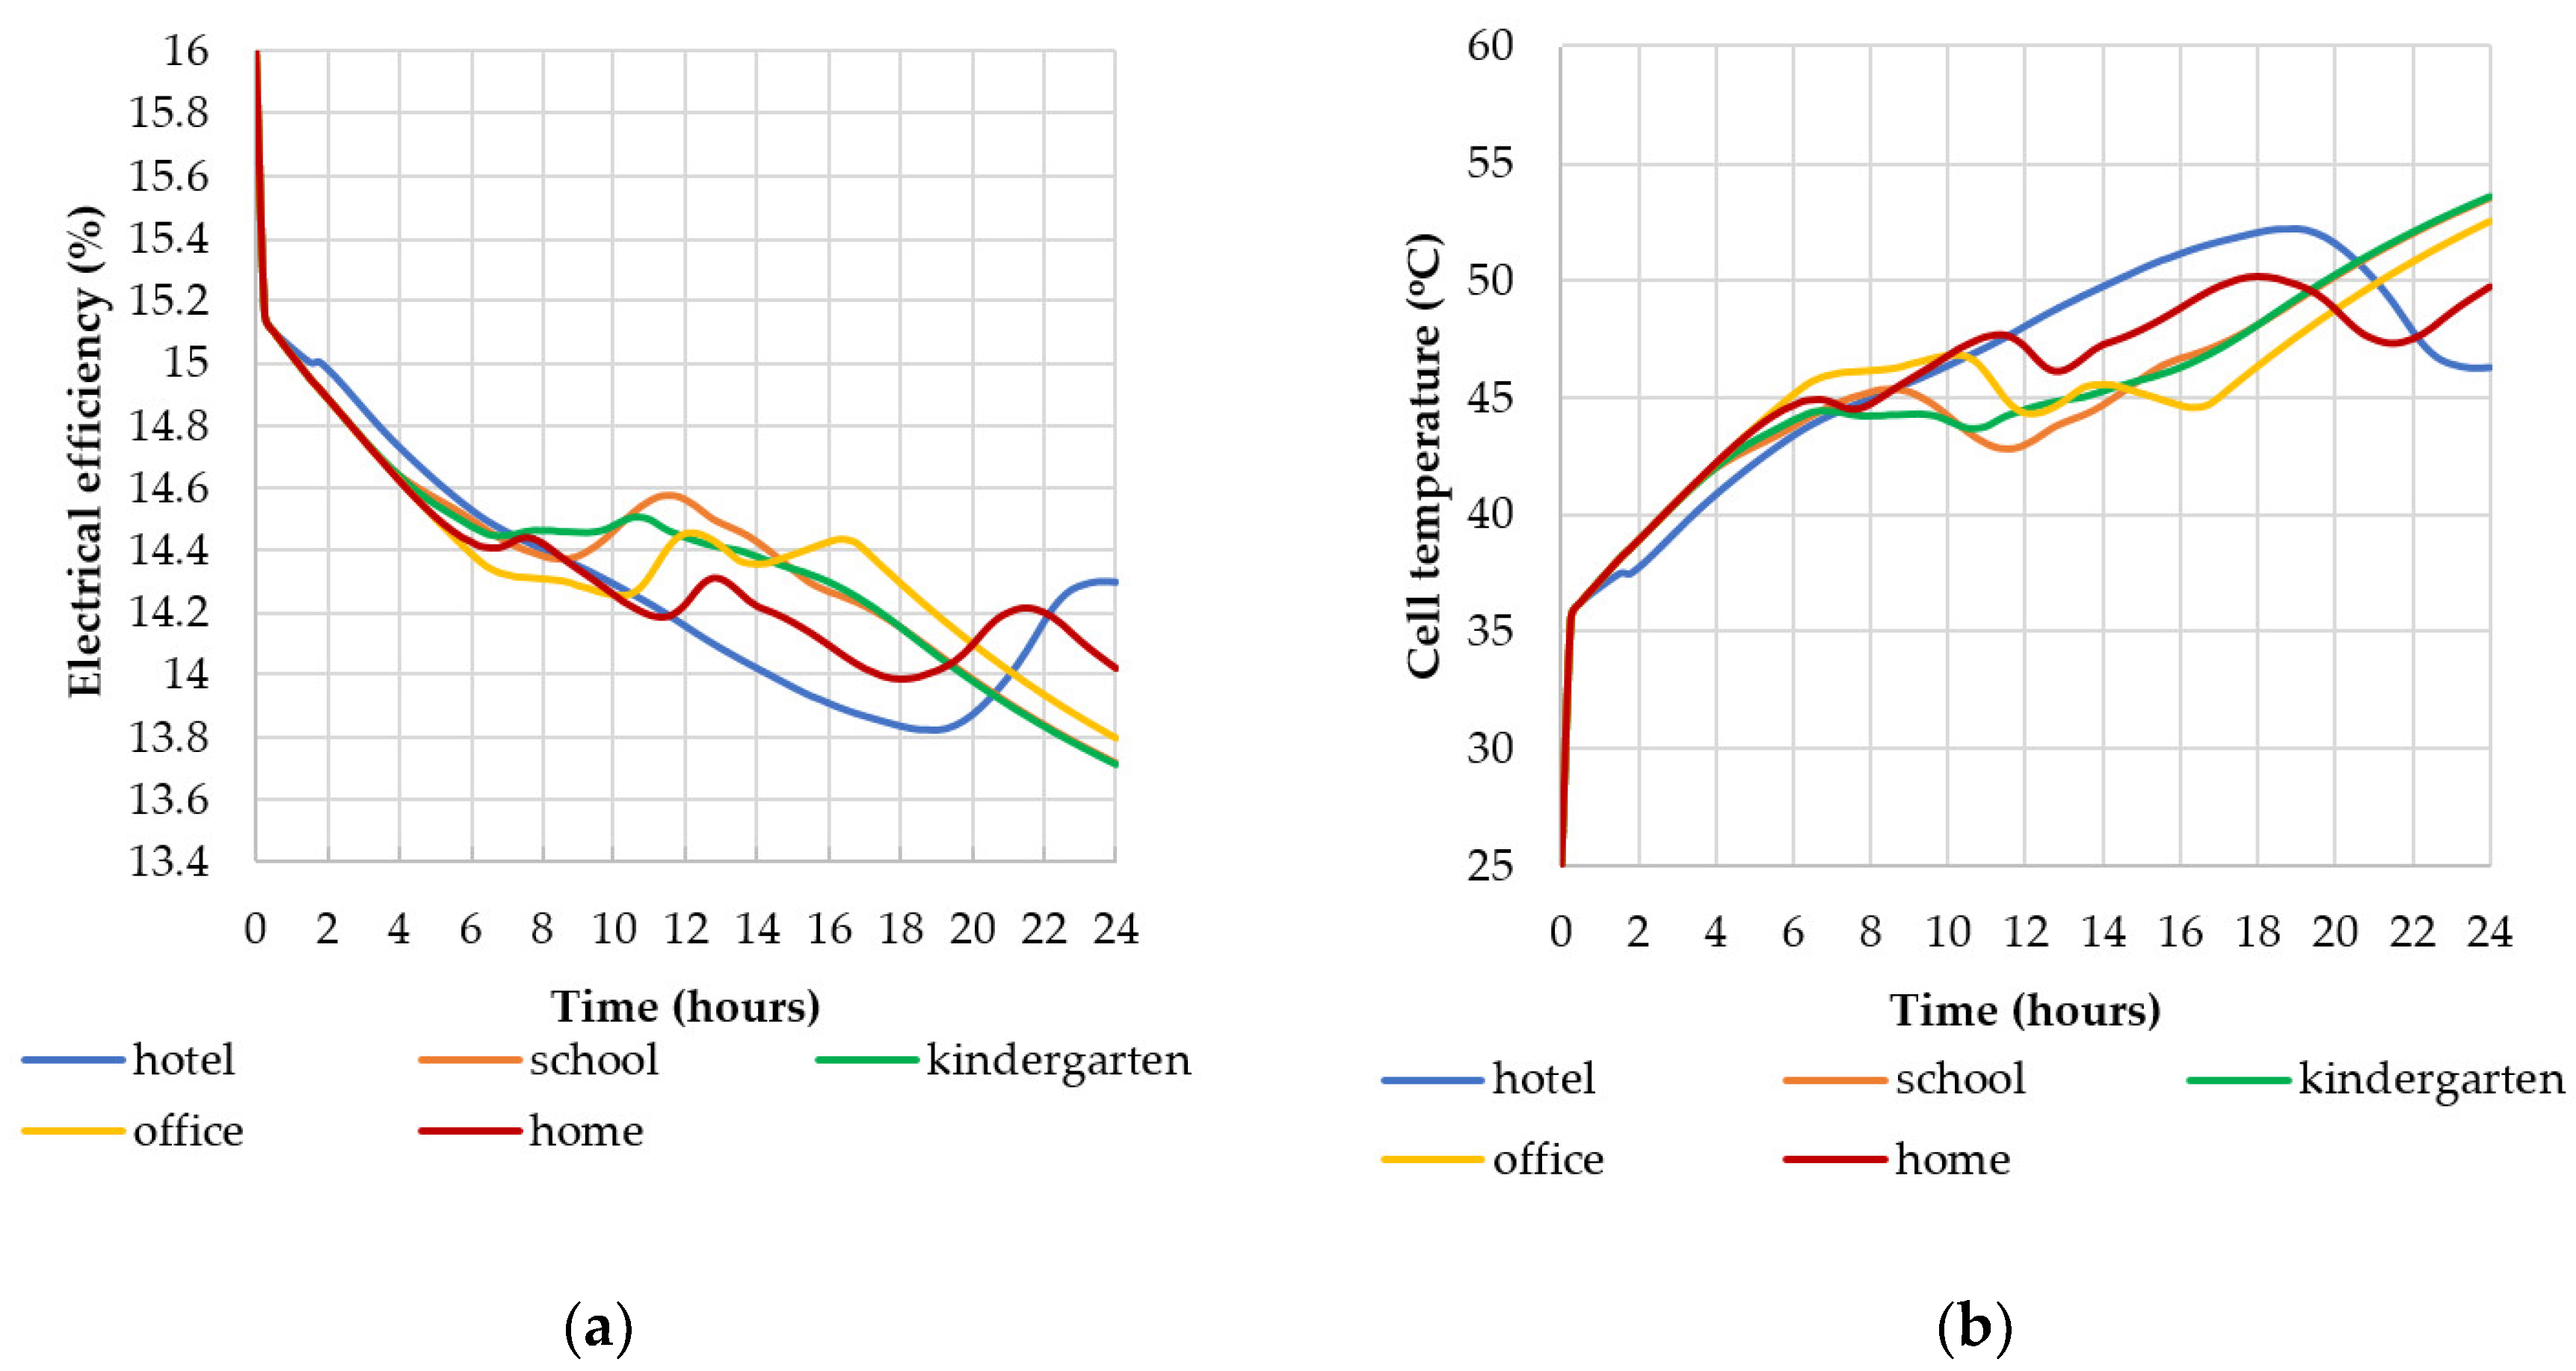
The results of the 24-h simulations are shown in Figure 13 below. It’s interesting to observe that the peak efficiency occurs during the peak demand of each curve. A variation of more than 1% is observed between the peak and minimum electrical efficiency overall, and about 0.5% at a particular time.

3.5. Power vs. PVT Inlet Temperature

An interesting aspect to observe is the variation of the instantaneous power as a function of the temperature of the coolant at the inlet of the PVT panel, shown in Figure 14. This was carried out with all the parameters kept constant to the default values. As expected, the electrical power (Pel) decreases with higher inlet temperatures. For this particular modelled panel, the approximate slope of the curve is −2.14. The instantaneous thermal power extracted from the PVT panel (PthPVT), calculated at the outlet of the panel, as a function of the temperature difference between the inlet and the cell, also decreases as the temperature at the inlet of the panel increases, with a slope of −16.28. That is due to the fact that the difference in the temperature decreases. However, if we look at the net instantaneous power delivered to the tank, calculated as the rate at which energy is removed from the tank through the specified outlet port minus the rate at which energy is added to the tank through the corresponding inlet port, it can be observed that it increases with a slope of +12.14. This means that the total amount of energy produced by the system is increasing, keeping in mind that the outlet flow rate to the consumer is constant during the simulation.

3.6. Discussion

The parametric analysis revealed that the flow rate at the outlet of the tank is the most impactful factor on the electrical efficiency, and secondly ranked is the tank volume, as shown in Figure 15. This indicates the fact that the consumer demand is a critical factor in the efficient performance of a PVT system. If the system is not of a size suitable to the consumer, there may not be sufficient hot water drawn from the tank and the temperature increases, having a big impact on the electrical performance of the system. In practice, in some buildings, this situation occurs. For example, in schools and other educational units, during holidays the water demand drops significantly and, as a consequence, the electrical efficiency also drops significantly. Mitigation measures should be put in place for these situations, such as additional cooling by ventilation, overdesigning the size of the tank or additional cooling of the tank by removing an amount of hot water. Further research will look at the effects and overall energy impact of these various measures. The curve of the consumer demand is also important. Dwellings that require higher volumes of water during midday, when the peak solar radiation occurs, are more suitable for a PVT system, such as school, kindergarten, or office buildings. However, as stated previously, in these cases, the annual demand is not constant due to holidays. Homes and hotels have a peak consumption later in the day, but their demand is more or less constant during the year.
Table 4 summarises the maximum variation between the minimum and maximum steps of the OFAT simulation. The variation from the total refers to the maximum electrical efficiency that can be achieved by the chosen PV cell. The annual variation in terms of energy refers to a total of annual energy produced by a residential PVT system of 1173.24 kWhEL [25].

4. Conclusions

This paper modelled the temperature interactions in a simple PVT panel and in a PVT system connected to a DHW storage tank. Next, an OFAT parametric analysis was carried out to investigate the impact on the electrical efficiency of various thermal characteristics: size of DHW tank, flow rate to the consumer, cold water main inlet temperature, and consumer demand curve. The analysis was done by keeping all the other parameters constant and varying only the investigated parameter.
The results show that the variation of the outlet flow to the consumer has the highest impact on the electrical efficiency, of about 6.8%. The next highest impact factor is the size of the tank with a variation of 4.7%. The cold-water main temperature showed a variation of only 1.5%. Matching the profile of the consumer is also an important aspect, as it was observed that the peak electrical efficiency occurs during peak consumer demand. Finally, the instantaneous variation of the thermal and electrical power of the system was analysed as a function of the temperature at the inlet of the photovoltaic-thermal panel. The results of this analysis indicate that the net instantaneous power delivered to the tank increases at a rate of 12.14% with the increase of temperature of the PVT inlet fluid.
The main conclusions of this research can be summarized as:
  • The lower the cold-water temperature of the main, the better the cell electrical efficiency.
  • The bigger the water storage tank, the better the cell electrical efficiency.
  • The higher the consumer water demand, the better the cell electrical efficiency.
  • When there is a peak in the hot water demand from the consumer, the electrical efficiency of the cell also peaks.
  • The biggest impact on the electrical efficiency is the water draw to the consumer.
  • With increasing temperature of the fluid at the inlet of the PVT panel, the instantaneous electrical power decreases, the instantaneous thermal power also decreases, but the net instantaneous thermal power added to the tank increases.
Some areas of further research to be carried out have been identified:
  • Mitigation measures for the cases when there is not sufficient hot water consumption to the user.
  • Validation of model with an experimental system.
  • An economic analysis of the parameters studied in this paper.
  • Analysis of the coupling of a PVT system to a heat pump.

Author Contributions

Conceptualization, G.D. and M.B.; methodology, M.B. and M.S.; software, M.B.; resources, G.D. and M.S.; writing—original draft preparation, M.B.; writing—review and editing, M.B., G.D., and M.S. All authors have read and agreed to the published version of the manuscript.

Funding

This work was supported by the Operational Programme Human Capital of the Ministry of European Funds through the Financial Agreement “Developing the entrepreneurial skills of the PhD students and postdoctoral students—key to career success (A-Succes)” contract number 51675/09.07.2019 POCU/380/6/13, SMIS code 125125.

Conflicts of Interest

The authors declare no conflict of interest.

Nomenclature

η efficiency (%)
Ttemperature(°C)
kthermal conductivity(W/mK)
δthickness (m)
Uthermal loss coefficient (W/(m2K))
Ssolar energy absorbed (W)
Pelelectrical power (W)
PthPVTthermal power output by PVT(W)
Pth_net_tanknet thermal power in the tank (W)
Aarea (m2)
m ˙ flow rate (L/h)
βrtemperature coefficient (%/K)
α absorptivity(-)
Uheat transfer coefficient (W/(m2K))
h penalty factor [-](-)
PVTphotovoltaic thermal
STCstandard testing conditions
DHWdomestic hot water
PVphotovoltaic
STsolar thermal
CHPcombined heat and power
PCMphase change material

References

  1. Ramos, A.; Guarracino, I.; Mellor, A.; Alonso-Álvarez, D.; Childs, P.; Ekins-Daukes, N.; Markides, C. Solar-Thermal and Hybrid Photovoltaic-Thermal Systems for Renewable Heating; Grantham Institute Briefing paper No 22; Imperial College London: London, UK, 2017. [Google Scholar]
  2. Fahhad, A.; Kais, S. Theoretical Limits of Photovoltaics Efficiency and Possible Improvements by Intuitive Approaches Learned from Photosynthesis and Quantum Coherence. Renew. Sustain. Energy Rev. 2014, 43, 1073–1089. [Google Scholar]
  3. Dubey, S.; Sarvaiya, J.; Seshadri, B. Temperature Dependent Photovoltaic (PV) Efficiency and Its Effect on PV Production in the World–A Review. Energy Procedia 2013, 33, 311–321. [Google Scholar] [CrossRef] [Green Version]
  4. Florschuetz, L.W. 1979: Extenssion of the Hottel-Whillier Model to the Analysis of Combined Photovoltaic/Thermal flat plate collectors. Sol. Energy 1979, 22, 361–366. [Google Scholar] [CrossRef]
  5. Thilak Raj, N.; Iniyan, S.; Goic, R. A review of renewable energy based cogeneration technologies. Renew. Sustain. Energy Rev. 2011, 15, 3640–3648. [Google Scholar]
  6. Slimani, M.; Amirat, M.; Kurucz, I.; Bahria, S.; Hamidat, A.; Chaouch, W. A detailed thermal-electrical model of three photovoltaic/thermal (PV/T) hybrid air collectors and photovoltaic (PV) module: Comparative study under Algiers climatic conditions. Energy Conv. Manag. 2010, 133, 458–476. [Google Scholar] [CrossRef]
  7. Onovwiona, H.I.; Ugursal, V.I. Residential cogeneration systems: Review of the current technology. Renew. Sustain. Energy Rev. 2006, 10, 389–431. [Google Scholar] [CrossRef]
  8. Kern, E.C.J.; Russell, M.C. Combined photovoltaic and thermal hybrid collector systems. IEEE Photovolt. Spec. Conf. 1978, 1, 1153. [Google Scholar]
  9. Othman, M.Y.; Ruslan, M.H.; Alghoul, M.; Yahya, M.; Zaharim, A.; Ibrahim, A. Performance of photovoltaic thermal collector (PVT) with different absorbers design. WSEAS Trans. Environ. Dev. 2009, 5, 321–330. [Google Scholar]
  10. Leonforte, F.; Del Pero, C.; Aste, N. Design, modeling and performance monitoring of a photovoltaic–thermal (PVT) water collector. Sol. Energy 2015, 112, 85–99. [Google Scholar]
  11. Hermann, M.; Lunz, K.; Keyl, H.M.; Koch, L.; Stryi-Hipp, G. Fluid flow investigations of bionic absorbers made from aluminum and steel. In Proceedings of the EuroSun 2010 Conference, Graz, Austria, 28 September–1 October 2010. Abstract number 134. [Google Scholar]
  12. Chow, T.T. Performance analysis of photovoltaic-thermal collector by explicit dynamic model. Sol. Energy 2003, 75, 143–152. [Google Scholar] [CrossRef]
  13. Singh, I.; Singh, D.; Singh, M. Thermal Modeling and Performance Evaluation of Photovoltaic Thermal (PV/T) Systems: A Parametric Study. Int. J. Green Energy 2019, 16, 483–489. [Google Scholar] [CrossRef]
  14. Rejeb, O.; Dhaou, H.; Jemni, A. Parameters effect analysis of a photovoltaic thermal collector: Case study for climatic conditions of Monastir, Tunisia. Energy Convers. Manag. 2019, 89, 409–419. [Google Scholar] [CrossRef]
  15. Guarracino, I.; Mellor, A.; Ekins-Daukes, N.J.; Markides, C.N. Dynamic coupled thermal-and-electrical modelling of sheet-and-tube hybrid photovoltaic/thermal (PVT) collectors. Appl. Therm. Eng. 2016, 101, 778–795. [Google Scholar] [CrossRef] [Green Version]
  16. Kallio, S.; Siroux, M. Energy Analysis and Exergy Optimization of Photovoltaic-Thermal Collector. Energies 2020, 13, 5106. [Google Scholar] [CrossRef]
  17. Ma, T.; Zhao, J.; Li, Z. Mathematical modelling and sensitivity analysis of solar photovoltaic panel integrated with phase change material. Appl. Energy 2018, 228, 1147–1158. [Google Scholar] [CrossRef]
  18. Ijumba, P.; Sebitosi, A. Evaluating the impact of consumer behaviour on the performance of domestic solar water heating systems in South Africa. J. Energy S. Afr. 2010, 21, 25–34. [Google Scholar] [CrossRef]
  19. Nhut, L.; Raza, W.; Park, Y.A. Parametric Study of a Solar-Assisted House Heating System with a Seasonal Underground Thermal Energy Storage Tank. Sustainability 2020, 12, 868. [Google Scholar] [CrossRef]
  20. Arsalis, A.; Alexandrou, A. Parametric study and cost analysis of a solar-heating-and-cooling system for detached single-family households in hot climates. Sol. Energy 2015, 117, 59–73. [Google Scholar] [CrossRef]
  21. Khalilpour, K.; Vassallo, A. Technoeconomic parametric analysis of PV-battery systems. Renew. Energy 2016, 97, 757–768. [Google Scholar] [CrossRef]
  22. Tzinnis, S.; Bellos, E.; Tzivanidis, C. Parametric Analysis of a Solar Cooling System Designed for Athens Climate. In Proceedings of the 5th International Conference Energy in Buildings 2016 (EinB201), Athens, Greece, 12 November 2016. [Google Scholar]
  23. Tiwari, A.; Sodha, M.S. Performance evaluation of hybrid PV/thermal water/air heating system: A parametric study. Renew. Energy 2006, 31, 2460–2474. [Google Scholar] [CrossRef]
  24. Alobaid, M.; Hughes, B.; O’Connor, D.; Calautit, J.; Heyes, A. Improving Thermal and Electrical Efficiency in Photovoltaic Thermal Systems for Sustainable Cooling System Integration. J. Sustain. Dev. Energy Water Environ. Syst. 2018, 6, 305–322. [Google Scholar] [CrossRef] [Green Version]
  25. Barbu, M.; Darie, G.; Siroux, M. Analysis of a residential photovoltaic-thermal (PVT) system in two similar climate conditions. Energies 2019, 12, 3595. [Google Scholar] [CrossRef] [Green Version]
  26. TRNSYS 17-a. TRaNsient SYstem Simulation program. In Volume 4 Mathematical Reference; the Solar Energy Laboratory, University of Wisconsin-Madison: Madison, WI, USA, 2014. [Google Scholar]
  27. Jonas, D.; Lämmle, M.; Theis, D.; Schneider, S.; Frey, G. Performance modeling of PVT collectors: Implementation, validation and parameter identification approach using TRNSYS. Sol. Energy 2019, 193, 51–64. [Google Scholar] [CrossRef]
  28. Buonomano, A.; Calise, F.; Vicidomini, M. Design, Simulation and Experimental Investigation of a Solar System Based on PV Panels and PVT Collectors. Energies 2016, 9, 497. [Google Scholar] [CrossRef]
  29. Agudelo-Vera, C.; Avvedimento, S.; Boxall, J.; Creaco, E.; de Kater, H.; Di Nardo, A.; Djukic, A.; Douterelo, I.; Fish, K.; Iglesias Rey, P.; et al. Drinking Water Temperature around the Globe: Understanding, Policies, Challenges and Opportunities. Water 2020, 12, 1049. [Google Scholar] [CrossRef] [Green Version]
  30. Guarracino, I. Hybrid Photovoltaic-Thermal Solar Systems for Combined Heating. Ph.D. Thesis, Imperial College London, London, UK, 2017. [Google Scholar]
  31. Jordan, U.; Vajen, K. DHWcalc: Program to generate domestic hot water profiles with statistical means for user defined conditions. In Proceedings of the ISES Solar World Congress, Orlando, FL, USA, 6–12 August 2005. [Google Scholar]
  32. Jordan, U. Statistically Generated DHW-Load Profiles on a One-Miunte Time Scale; IEA SHACP Task 26; International Energy Agency: Paris, France, 2000. [Google Scholar]
  33. Tanaka, A.; Murakawa, S.; Koshikawa YAnd Takata, H. Calculation of hot water supply demands and instrument’s capacity for the guest rooms in a City hotel. J. Environ. Eng. 2008, 73, 69–75. [Google Scholar] [CrossRef]
  34. Chang, H.; Praskievicz, S.; Parandvash, H. Sensitivity of Urban Water Consumption to Weather and Climate Variability at Multiple Temporal Scales: The Case of Portland, Oregon. Int. J. Geosp. Environ. Res. 2014, 1, 7. [Google Scholar]
  35. Susanne, B. Water equity–Contrasting tourism water use with that of the local community. Wat. Res. Ind. 2014, 7–8, 9–22. [Google Scholar]
  36. Koiv, T.A.; Voll, H.; Hani, A. Domestic hot water consumption in educational premises, apartment and office buildings. Wseas Trans. Environ. Dev. 2010, 1, 54–63. [Google Scholar]
Figure 1. PVT energy diagram.
Energies 13 06481 g001
Figure 2. Energy flux in a PVT panel.
Energies 13 06481 g002
Figure 3. PVT cross section [25].
Energies 13 06481 g003
Figure 4. Daily variation (a) of electrical efficiency; (b) of cell temperature.
Energies 13 06481 g004
Figure 5. PVT system diagram.
Energies 13 06481 g005
Figure 6. TRNSYS System.
Energies 13 06481 g006
Figure 7. The variation of the (a) electrical efficiency; (b) cell temperature; as a function of the tank inlet temperature.
Energies 13 06481 g007
Figure 8. Meteorological data from Meteonorn database for a typical summer day in Bucharest, Romania.
Energies 13 06481 g008
Figure 9. The variation of the (a) electrical efficiency; (b) cell temperature; during a typical summer day in Bucharest, Romania.
Energies 13 06481 g009
Figure 10. The variation of the (a) electrical efficiency; (b) cell temperature; as a function of the tank volume.
Energies 13 06481 g010
Figure 11. The variation of the (a) electrical efficiency; (b) cell temperature; as a function of the flow rate to the consumer.
Energies 13 06481 g011
Figure 12. DHW demand curves for various buildings.
Energies 13 06481 g012
Figure 13. The variation of the (a) electrical efficiency; (b) cell temperature; as a function of the consumer demand curve.
Energies 13 06481 g013
Figure 14. Instantaneous power versus PVT inlet temperature.
Energies 13 06481 g014
Figure 15. Ranking of the impact of parameters.
Energies 13 06481 g015
Table 1. Default parameters.
ParameterNotationValue
Ambient TemperatureTa25 °C
Solar RadiationG1000 W/m2
Wind speedvw0 m/s
Reference electrical efficiency of cell η c 16%
Pump flow rate m ˙ pump200 L/h
PVT areaA3 m2
Tank volumeVtank250 L
Temperature coefficient β r−0.5%
Tank outlet flow rate m ˙ out5 L/h
Tank inlet temperatureTin7 °C
Table 2. Range of variation of parameters.
Parameter.RangeStep
Tank inlet temperature1–25 °C5 °C
Tank outlet flow rate1–30 L\h5 L
Tank volume100–600 L100 L
Demand curverefer to 4.4refer to 4.4
Table 3. Demand data summary.
Type of BuildingLocation of Measured DataReference
HomeEurope[31,32]
HotelJapan[33]
KindergartenEstonia[36]
SchoolEstonia[36]
OfficeEstonia[36]
Table 4. Results summary.
ParameterVariation% Variation from TotalAnnual Variation in Terms of Electrical Energy (kWh)
Tank inlet temperature0.2421.51417.76
Tank outlet flow rate1.0996.87180.62
Tank volume0.6644.15348.72
Demand curve0.5743.58842.09
Publisher’s Note: MDPI stays neutral with regard to jurisdictional claims in published maps and institutional affiliations.