Article

Upholding Safety in Future Energy Systems: The Need for Systemic Risk Assessment

Department of Values of Technology and Innovation, Delft University of Technology, 2628 BX Delft, The Netherlands
*
Author to whom correspondence should be addressed.
Energies 2020, 13(24), 6523; https://doi.org/10.3390/en13246523
Submission received: 20 October 2020 / Revised: 7 December 2020 / Accepted: 8 December 2020 / Published: 10 December 2020
(This article belongs to the Special Issue Risk and Integrity Management of Energy Assets)

Abstract

:
This paper argues that energy systems are becoming increasingly complex, and illustrates how new types of hazards emerge from an ongoing transition towards renewable energy sources. It shows that the energy sector relies heavily on risk assessment methods that are analytic, and that systemic methods provide important additional insights. A case study of the Dutch gas sector illustrates this by comparing the hazard and operability study (HAZOP, analytic) with the system-theoretic process analysis (STPA, systemic). The contribution is twofold. This paper illustrates how system hazards will remain underestimated by sustained use of only analytic methods, and it highlights the need to study the organization of safety in energy transitions. We conclude that appropriate risk assessment for future energy systems involves both analytic and systemic risk assessments.

1. Introduction

The integration of renewable energy sources increases the complexity of traditional energy systems. Renewable energy sources, such as wind and solar, are intermittent, i.e., their availability strongly depends on climate and weather patterns. Consequently, renewable energy supply cannot be adjusted to fluctuating demand, as is the case in traditional systems that rely on dispatchable energy sources. Another novel phenomenon is the decreasing efficient scale of energy provision. Renewable energy is produced by solar power panels, wind turbines, or local biomass facilities of farmers providing biogas. Typically, the production units are much smaller than traditional fossil fuel plants. Moreover, the number of production units in the system is significantly larger. This contributes to the complexity of the energy system in two ways. First, it is much more challenging to balance energy supply and demand in systems that rely on a large number of heterogeneous, dispersed, small-scale, and often intermittent production units [1]. Second, energy flows are increasingly non-linear. Traditional energy systems are characterized by a one-way and linear flow of energy: From large-scale production plants, connected to transport networks, to the distribution networks supplying the final consumers. Nowadays, renewable energy producers are also often directly connected to the distribution networks, close to the final consumers. Under these conditions, surplus energy from local networks has to be delivered back to the transmission networks to provide it to regions with an energy shortage. This increased integration within (and even among) gas and electricity systems raises new concerns for safety that are related to these changing features of the energy system [2].
Controlling and mitigating safety hazards is a key concern in the energy sector [3,4]. Hazards related to the operation of natural gas and electricity systems may cause tremendous financial losses, human injury, and even fatalities. Risk assessment tools assist in identifying and ultimately mitigating such hazards. Usually, these assessments are often carried out before new components are added to the system, and are repeated when necessary. In the past, this process has proven effective in the energy sector, because components could be assessed independently from each other, while their addition to the system traditionally has had little impact on the system as a whole. However, this is set to change as a consequence of the transition to renewable sources. Energy systems are becoming more interrelated. Safety hazards that were previously limited to mostly isolated segments of energy systems, for example, in distribution systems, will influence components and processes in other segments. This process is amplified by increased digitalization of energy systems, newly linking millions of devices to electricity and gas systems [5]. If methods that are currently used to mitigate safety hazards cannot account for this increased complexity, severe safety hazards are bound to be overlooked.
Systemic risk assessment methods are designed to cope with these novel challenges. They identify and ultimately help to mitigate hazards related to increased non-linearity and interaction among subsystems, such as recently witnessed in the energy sector. Instead of a component or analytic focus, these methods apply a systemic focus in response to increased complexity [6,7]. Systemic methods have successfully been applied in diverse fields, including the aviation industry [8,9,10], infrastructures [11,12,13,14,15], and the maritime sector [16]. These studies show that systemic methods are more capable than their analytic counterparts in identifying hazards specific to increased complexity, for example, linked to growing component interaction [9,10,12] or digital control [14,15,17]
These positions study the effectiveness of systemic risk assessments in the energy sector as a largely untouched research gap. Even if complexity in energy systems grows rapidly, analytic methods remain the most prevalent ones used among both practitioners and scholars. Some recent exceptions underline the untapped potential for systemic risk assessment in the energy sector. Rejzek and Hilbes stress their added value in the design of digital instrumentation for nuclear power plants [18]; Rosewater and Williams analyzed safety in new battery designs using a systematic risk assessment and conclude that it creates more causal scenarios for accidents compared to their analytic counterpart, in addition to providing a better answer to hazards related to uncertainties that come with new technologies [19]; and Karatzas and Chassiakos find that a systemic risk assessment is instrumental in identifying gaps in current risk assessments in the context of the increased complexity of domestic energy systems [20]. Their results suggest that systemic methods are indeed more appropriate for identifying and potentially mitigating novel challenges associated with a transition to renewable energy sources. This research tests that assumption by analyzing the changing features of future energy systems. It asks:what constitutes appropriate risk assessment for the increasingly complex energy systems of the future?
We show how changing the features of energy systems introduce novel hazards that may not be fully identified with analytic risk assessment methods. We do so by comparing a hazard and operability study (HAZOP) and system-theoretic process analysis (STPA) as an analytic and systemic risk assessment, respectively. Both methods are applied to the changing attributes of the gas sector in the Netherlands. The following chapter introduces the concept of complexity, exemplifies how it influences system behavior, and elaborates on analytic and systemic approaches to assessing safety. Chapter 3 demonstrates how energy systems become increasingly complex. Chapter 4 confirms that analytic approaches remain dominant in the energy sector in practice and theory. HAZOP and STPA are compared for the case of a gas compressor in Chapter 5. Chapter 6 concludes this paper.

2. Theoretical Background: Systems and Safety

This paper is concerned with systems, complexity, and safety. A system is understood as “an assembly of elements related in an organized whole” ([21], p. 7). These elements can be technological artifacts (i.e., gas pipelines) or actors (i.e., gas producers). Relationships between these elements exist if one element influences or controls the behavior of a second element. Both elements and their relationships are characterized and can be described by attributes, such as “materials, information, or energy” (ibid.). The next Section 2.1 introduces system attributes that define simple and complex systems. Section 2.2 elaborates on how safety can be assessed in both types of systems.

2.1. Features of Simple and Complex Systems

In general, complex systems are characterized by interdependent elements and non-linear interactions. The presence of feedback loops is an important characteristic. Then, the output of a single system element not only affects other elements in the system but, sometimes through a series of relationships, also feeds back into itself. [21]. These features make it difficult to easily understand and assess the behavior of complex systems [21]. Conversely, simple systems are constituted by linear interactions between their elements. Under these conditions, system behavior can be assessed analytically by focusing on the cumulative contributions of every single component. Table 1 summarizes attributes that distinguish the two system types [6,21,22]. It should be noted that the distinction between simple and complex systems is hardly ever binary. Systems can be partially simple or partially complex and often display elements of both.
Interactions in simple systems are linear. In other words, system elements are not subject to feedback loops or other non-linear behavior. Traditional natural gas systems, for example, fall into this category. Generally, gas is transported from high-pressure to low-pressure pipelines. This infrastructure is constituted by dedicated single-purpose equipment such that gas is ultimately delivered to industry and to households. Typically, the technical functioning of this equipment is determined by predefined technical criteria, so-called controls. For instance, pressure sensors are instrumental in regulating the gas injection from high-pressure into low-pressure pipelines. Related to a target pressure level (the control), these single-purpose elements enable the delivery of gas into the different parts of the system. Hundreds of grid connection points in the same infrastructure work this way-individually programmed without feedback loops or communication with other elements of the system. They serve a single-purpose and control a clearly defined part of the overall infrastructure: To move gas downstream from a given connection point. As a result, the gas system comprises numerous subsystems that, even if they are supplied by the same high-pressure pipeline, function as non-interacting segregated subsystems.
Complex systems are at least partially constituted by feedback loops and non-linear interactions between their elements. To facilitate such dynamic system behavior, typical system elements are able to serve multiple purposes, such as software that controls different technical processes. Figure 1 visualizes this difference by highlighting the difference between a simple and complex gas system. Simple gas systems (on the left) are constituted by linear gas flows. Gas moves down from either storage or production facilities (point A) through decreasingly pressurized gas grids until it reaches the consumer (point D). In complex systems (on the right), bi-directional gas flows occur. These new flows are a direct consequence of the increased utilization of biogas and hydrogen [2].
Unlike natural gas, these renewable gasses are often produced on a small scale and injected into lower-pressure pipelines. These injection points are typically near production facilities like farms or waste plants. This may result in a scenario in which some subsystems have excess gas, that must be transferred to other parts of the system where there is a shortage. For example, biogas production is high in rural areas because of agricultural activity, but population density and industry activity there are insufficient to consume the available supply at all times [24]. Particularly in summer, when gas use for heating is low, excess production is likely. To move this gas to urban areas located in other parts of the system, the gas must be transported through high-pressure pipelines. To facilitate this, grid connection points must be able to transfer gas in both directions from low-pressure to high-pressure grids and vice versa. In other words, elements of the gas system become multi-purpose, and previously independent subsystems become interconnected. This interconnection between subsystems significantly enhances the systems’ complexity.
This new attribute of gas systems creates new issues. Interactions among different subsystems raise concerns for gas quality. Consistent gas quality must be maintained for the safe operation of gas systems: There are criteria that must be met, such as a particular calorific value and an identifiable gas odor [2]. Gas quality becomes increasingly heterogeneous when sourced from various production plants, and variations in gas quality will be hard to trace back to a single producer once all subsystems become more connected. At the same time, controlling the entire gas system (i.e., both high- and low-pressure pipelines) becomes more difficult. New coordination mechanisms may be required to balance the production and consumption of gas, possibly relying on advanced electronics to calculate how gas travels throughout the system (ibid.)

2.2. Assessing Safety of Simple and Complex Systems

Systems may be exposed to different safety hazards as they grow more complex. To address this problem, it is important to define safety and distinguish between hazards, accidents, and risk. Safety relates to minimizing hazards and avoiding accidents. A hazard refers to a “system state or set of conditions that, together with a particular set of worst-case environmental conditions, will lead to an accident (loss)” ([22], p. 183). An accident is “an undesired or unplanned event that results in a loss [...].” (ibid, p. 181). A ruptured gas pipeline is a hazard, but only constitutes an accident when gas is released. A hazard may result in multiple accidents, for example, when a gas release also leads to fire or poisoning. Risk, then, is “the combination of the likelihood of an event and the consequences of that event” ([25], p. 230). This section elaborates on two approaches to assessing safety. An analytic approach (2.2.1) that is well suited to the analysis of linear systems, and a systemic approach (2.2.2) that is geared towards complex systems [7].

2.2.1. Analytic Approach

Analytic thinking has long formed the foundation for assessing safety. This approach involves an analyst decomposing the system under investigation into manageable chunks: Analyzing each individually, before combining the individual outcomes to form an understanding of the whole. This form of analysis is known as analytic reduction [26]. The chance of failure is estimated for each component (sometimes called a node), along with the potential effect of the failure. Combined, these two factors demonstrate risk. Risk assessment methods that follow an analytic approach identify those system elements that generate high risk, with the aim of improving their reliability so that the overall risk is reduced. Examples include the failure mode and effects analysis (FMEA), the Bowtie Method, and the HAZOP [27].
These methods work well for linear systems that are relatively segregated and have limited interdependence. Consider, for example, the simple gas system illustrated in Figure 1. The system can be decomposed into the four different nodes A through D. In the analytic approach, the risk of all nodes is studied separately. A possible outcome of an analytic risk assessment could be that point C, a specific segment of the 4 bar gas grid, has the most significant safety risks—it might leak easily when grid pressure exceeds a certain threshold. A possible remedy for improving the reliability of the 4 bar gas grid would be to substitute the pipeline, or direct the gas flow in such a way that gas pressure is lowered for section C, which results in leakage becoming less likely. The effective decrease of risk associated with point C, would then also decrease total system risk. Increasing system complexity, however, introduces risks that may not be reducible to a single system element.

2.2.2. Systems Approach

Systems approaches posit that safety is an emergent property. Safety, or the lack thereof, is not an attribute of a single system element; rather, it is an attribute of the relationship between two or more elements. Accordingly, the focus shifts away from components. Instead, the system is framed as a hierarchy where higher levels exercise control by imposing constraints on the functioning of lower levels. Accidents, then, result from unexpected interactions that are not (sufficiently) controlled. Risk assessment methods that follow a systems approach identify conditions under which this control may be insufficient. Insufficient control can cause hazardous system behavior and, by consequence, accidents. Systemic risk assessment methods include STPA [22], functional resonance analysis method (FRAM) [28] and AcciMap [29].
Systemic risk assessments have proven effective for complex systems [30]. They can be effective in identifying hazards where safety is irreducible to a single component. Consider, for example, the biogas production facility. It may have a simple technology installed that shuts down grid injection if the grid pressure is too high. A simple pressure sensor is connected to a shut-off valve. Neither system element (i.e., the sensor and the valve) is complex by themselves. The relationship among them is also linear and simple. The relationship becomes more complex, however, if the valve is connected to a grid operator control room. The grid operator may want to control the gas supply remotely to balance different interconnected segments of the gas grid. In this scenario, the complexity that is not visible in the individual system elements becomes apparent in their relationship. For example, when a grid operator must control gas supply from several biogas production plants simultaneously. Insufficient control of different gas flows could pose a significant risk, but it cannot be traced back to a single element.

3. Changing Features of Energy Systems

Conventional energy systems are mostly linear, comprising independent subsystems, and are typically reliant on fossil energy sources, such as coal, oil, and gas. Future energy systems, by contrast, are more non-linear with increasingly interdependent subsystems and rely on a growing share of renewable energy sources, such as biomass, sun, and wind. This section illustrates how system interactions for both electricity and gas are becoming increasingly complex.

3.1. Conventional Energy Systems

Conventional energy systems are characterized by centralized and large-scale production plants, such as offshore gas platforms or gas-fired power plants. From a limited number of central production points, energy is transported over large distances to consumers. Energy is first transported through high capacity networks: High-voltage for electricity and high-pressure for gas. Then, at different points in the network, it is further distributed through medium- and low-capacity networks that are connected to consumers. Elements in both gas and electricity networks are mostly designed to facilitate a one-way energy flow and serve this single-purpose. This allows for functioning with relatively few interactions between independent subsystems and, likewise, few associated feedback loops.
Energy production is demand-driven and easily scalable. The coordination of supply and demand is typically accomplished using different timescales. Based on estimated demand patterns, the majority of the produced energy is allocated and projected well in advance, while any remaining inconsistencies between production and demand are balanced the day before consumption or even during the day. For electricity, which is difficult and expensive to store, this is true year-round. Gas is produced throughout the year, but also stored in the summertime to meet increased demand in winter. These system characteristics allow for clearly defined controls. Relevant actors can operate subsystems that work mostly independently from each other. Figure 2 shows a simplified scheme of conventional energy systems [31,32].

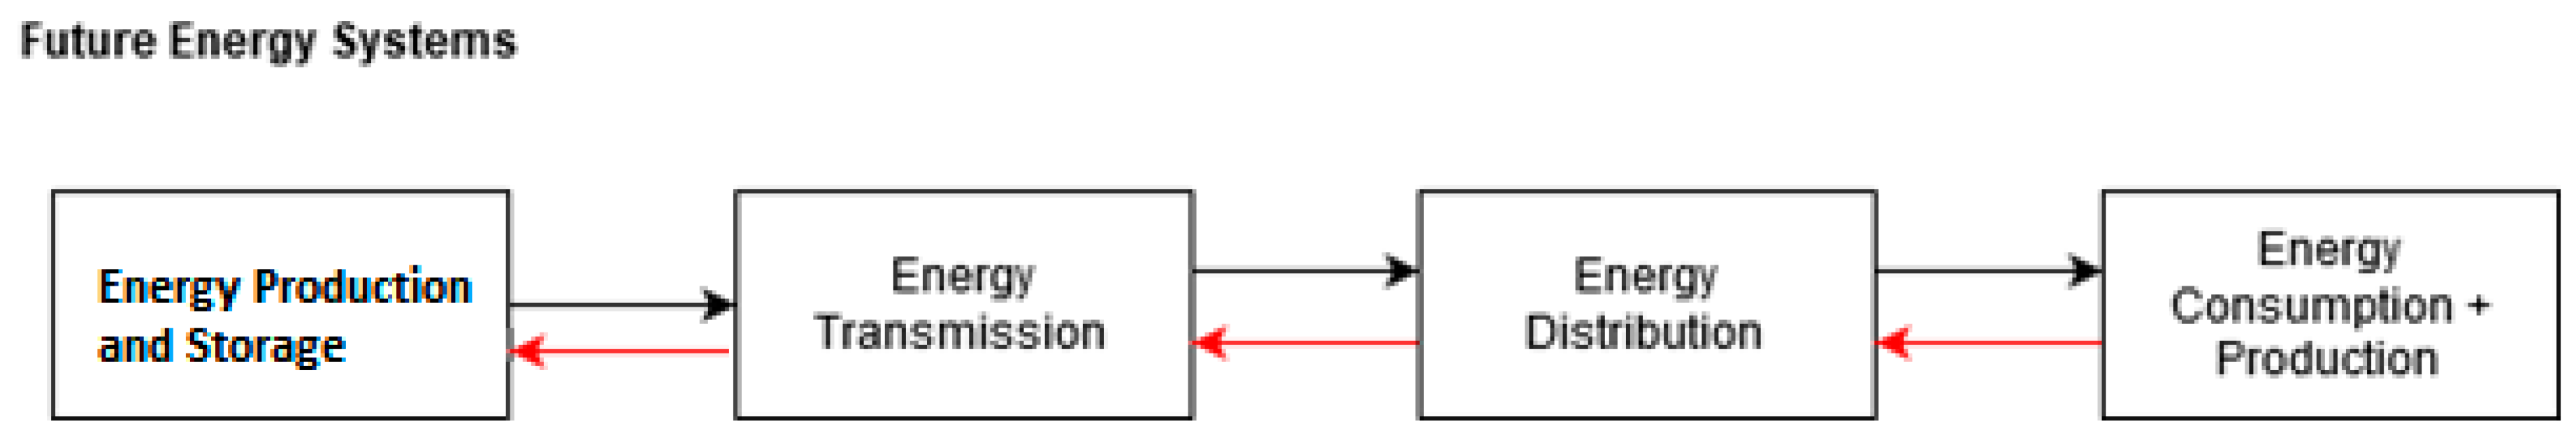
3.2. Future Energy Systems

Future energy systems are increasingly non-linear. As visualized in Figure 3, the provision and consumption of energy are becoming bi-directional. Former consumers are increasingly involved in the production of energy and become prosumers, meaning they are consumers and producers. They harvest energy from renewable sources. Dairy farmers who upgrade cow manure to produce biogas, for example, break the traditional linear sequence as they also feed energy into the network. They might also provide biogas to consumers in their direct proximity, substituting biogas for natural gas. However, if these local systems reach their capacity to absorb the biogas produced, the gas might be transported via higher-pressure pipelines to serve customers elsewhere. The need for bidirectional distribution of energy from lower to higher capacity networks and vice versa requires new functionalities. It fundamentally changes the attributes of energy systems from linear to non-linear,—comprising single-purpose elements to comprising multi-purpose elements, and is independent to interdependent subsystems [2].
Future energy systems will be driven by a particular combination of energy supplied by intermittent wind, solar and tidal production units, and by must-run technologies like geothermal. Whereas, conventional fossil energy supply can be easily adjusted to predicted and actual demand conditions, future energy demand will have to follow the availability of energy. Therefore, the components of future energy systems are interdependent to a much larger extent, to balance supply and demand [33]. For example, formerly separate electricity and gas grids may become connected by Power-to-Gas (P2G) technologies. These convert surplus electric power, for instance, from wind turbines or large-scale solar systems, into gasses, such as hydrogen or synthetic gas. These gasses will be fed into the bi-directional gas pipeline system and transported to storage facilities, customers, or other conversion units.
To conclude, the increasing utilization of renewable energy sources is bound to drastically change the relationship between different grid segments and to increase the reliance on automated control. Controlling safety in these systems becomes increasingly challenging as interactions become more complex. Responsibilities for monitoring and controlling the interactions between system elements must be re-defined and allocated. Controls that were straightforward and clearly defined in linear conventional energy systems will become blurred as subsystems grow interdependent.

4. Risk Assessments in the Energy Sector

The predominant mode of risk assessment used in the energy sector today is illustrated by consulting three independent sources of information. Firstly, a systematic literature review of scientific articles shows the popularity of different risk assessment methods associated with the safety of future energy systems. These results are then corroborated by reports from the industry and several interviews with energy system safety experts.
The literature review distinguishes between analytic and systemic risk assessment methods, as introduced in Chapter 2. Besides FMEA, HAZOP, and Bowtie, search queries for analytic methods also included Failure Mode, Effects, and Criticality Analysis (FMECA) and Hazard Identification (HAZID). Systemic methods were limited to STPA, FRAM, and AcciMap. The analysis was conducted through the academic database ScienceDirect, and identified the use of both categories of risk assessment methods in combination with (1) “Biogas” OR “Hydrogen”; (2) “Solar PV” OR “Solar Panel” OR “Wind Turbine”; (3) “Battery” OR “Fuel Cells”. Initial results were manually screened for relevance: They had to apply the probed risk assessment method to a renewable energy topic. Detailed information is provided in Appendix A; Table 2 shows the results. A total of 50 cases of analytic risk assessment methods were identified as opposed to a single case of a systemic risk assessment method.
The choice of risk assessment methods in the energy sector is guided by standards issued by the relevant authorities. For example, the European Commission recommends five methods identified in IEC/ISO 31010 for conducting risk assessments in gas networks, including brainstorming, HAZOP, and FMEA [34]. Grid operators in Europe follow these guidelines, as illustrated by references to FMEA [35]; FMECA and Event Tree Analysis (essentially half a Bowtie analysis) [36]; and HAZOP [37]. Likewise, a reference guide on risk assessments for photovoltaic facilities issued by the US department of energy exclusively lists analytic methods, including those mentioned above [38]. None of those guidelines mentions systemic methods.
Zooming in on renewable gas applications confirms this picture. Analytic risk assessment methods are dominant. Examples include FMEA for smart gas meters [39]; Bowtie for the transport of biogas [40] and hydrogen [41]; and HAZID/HAZOP for hydrogen injection [42]. The exclusive use of analytic risk assessment methods is confirmed by safety experts and others familiar with risk assessment methods in the sector.

5. Comparing Different Risk Assessment Approaches

Evidently, the energy sector still relies very much on analytical risk assessment approaches, although energy systems are becoming increasingly complex. This raises the question: What kind of risks might be recognized if a systemic approach were to be applied? We elaborate on this question using a specific case related to the natural gas system in the Netherlands. We analyze a recent pilot project involving the integration of a gas compressor into the pipeline system. This technology enables a two-way flow of gas and links previously unconnected nodes into the gas network. It is a precondition for the envisioned uptake of small-scale biogas production. Additionally, the operating conditions of the compressor can be remotely adjusted. Hence, it is a clear example of how the system becomes more complex. In line with previous studies [18,19,20], we are particularly interested in how the two approaches differ in dealing with digital instrumentation, the number and nature of identified hazard scenarios, and ways in which uncertainty is accounted for.

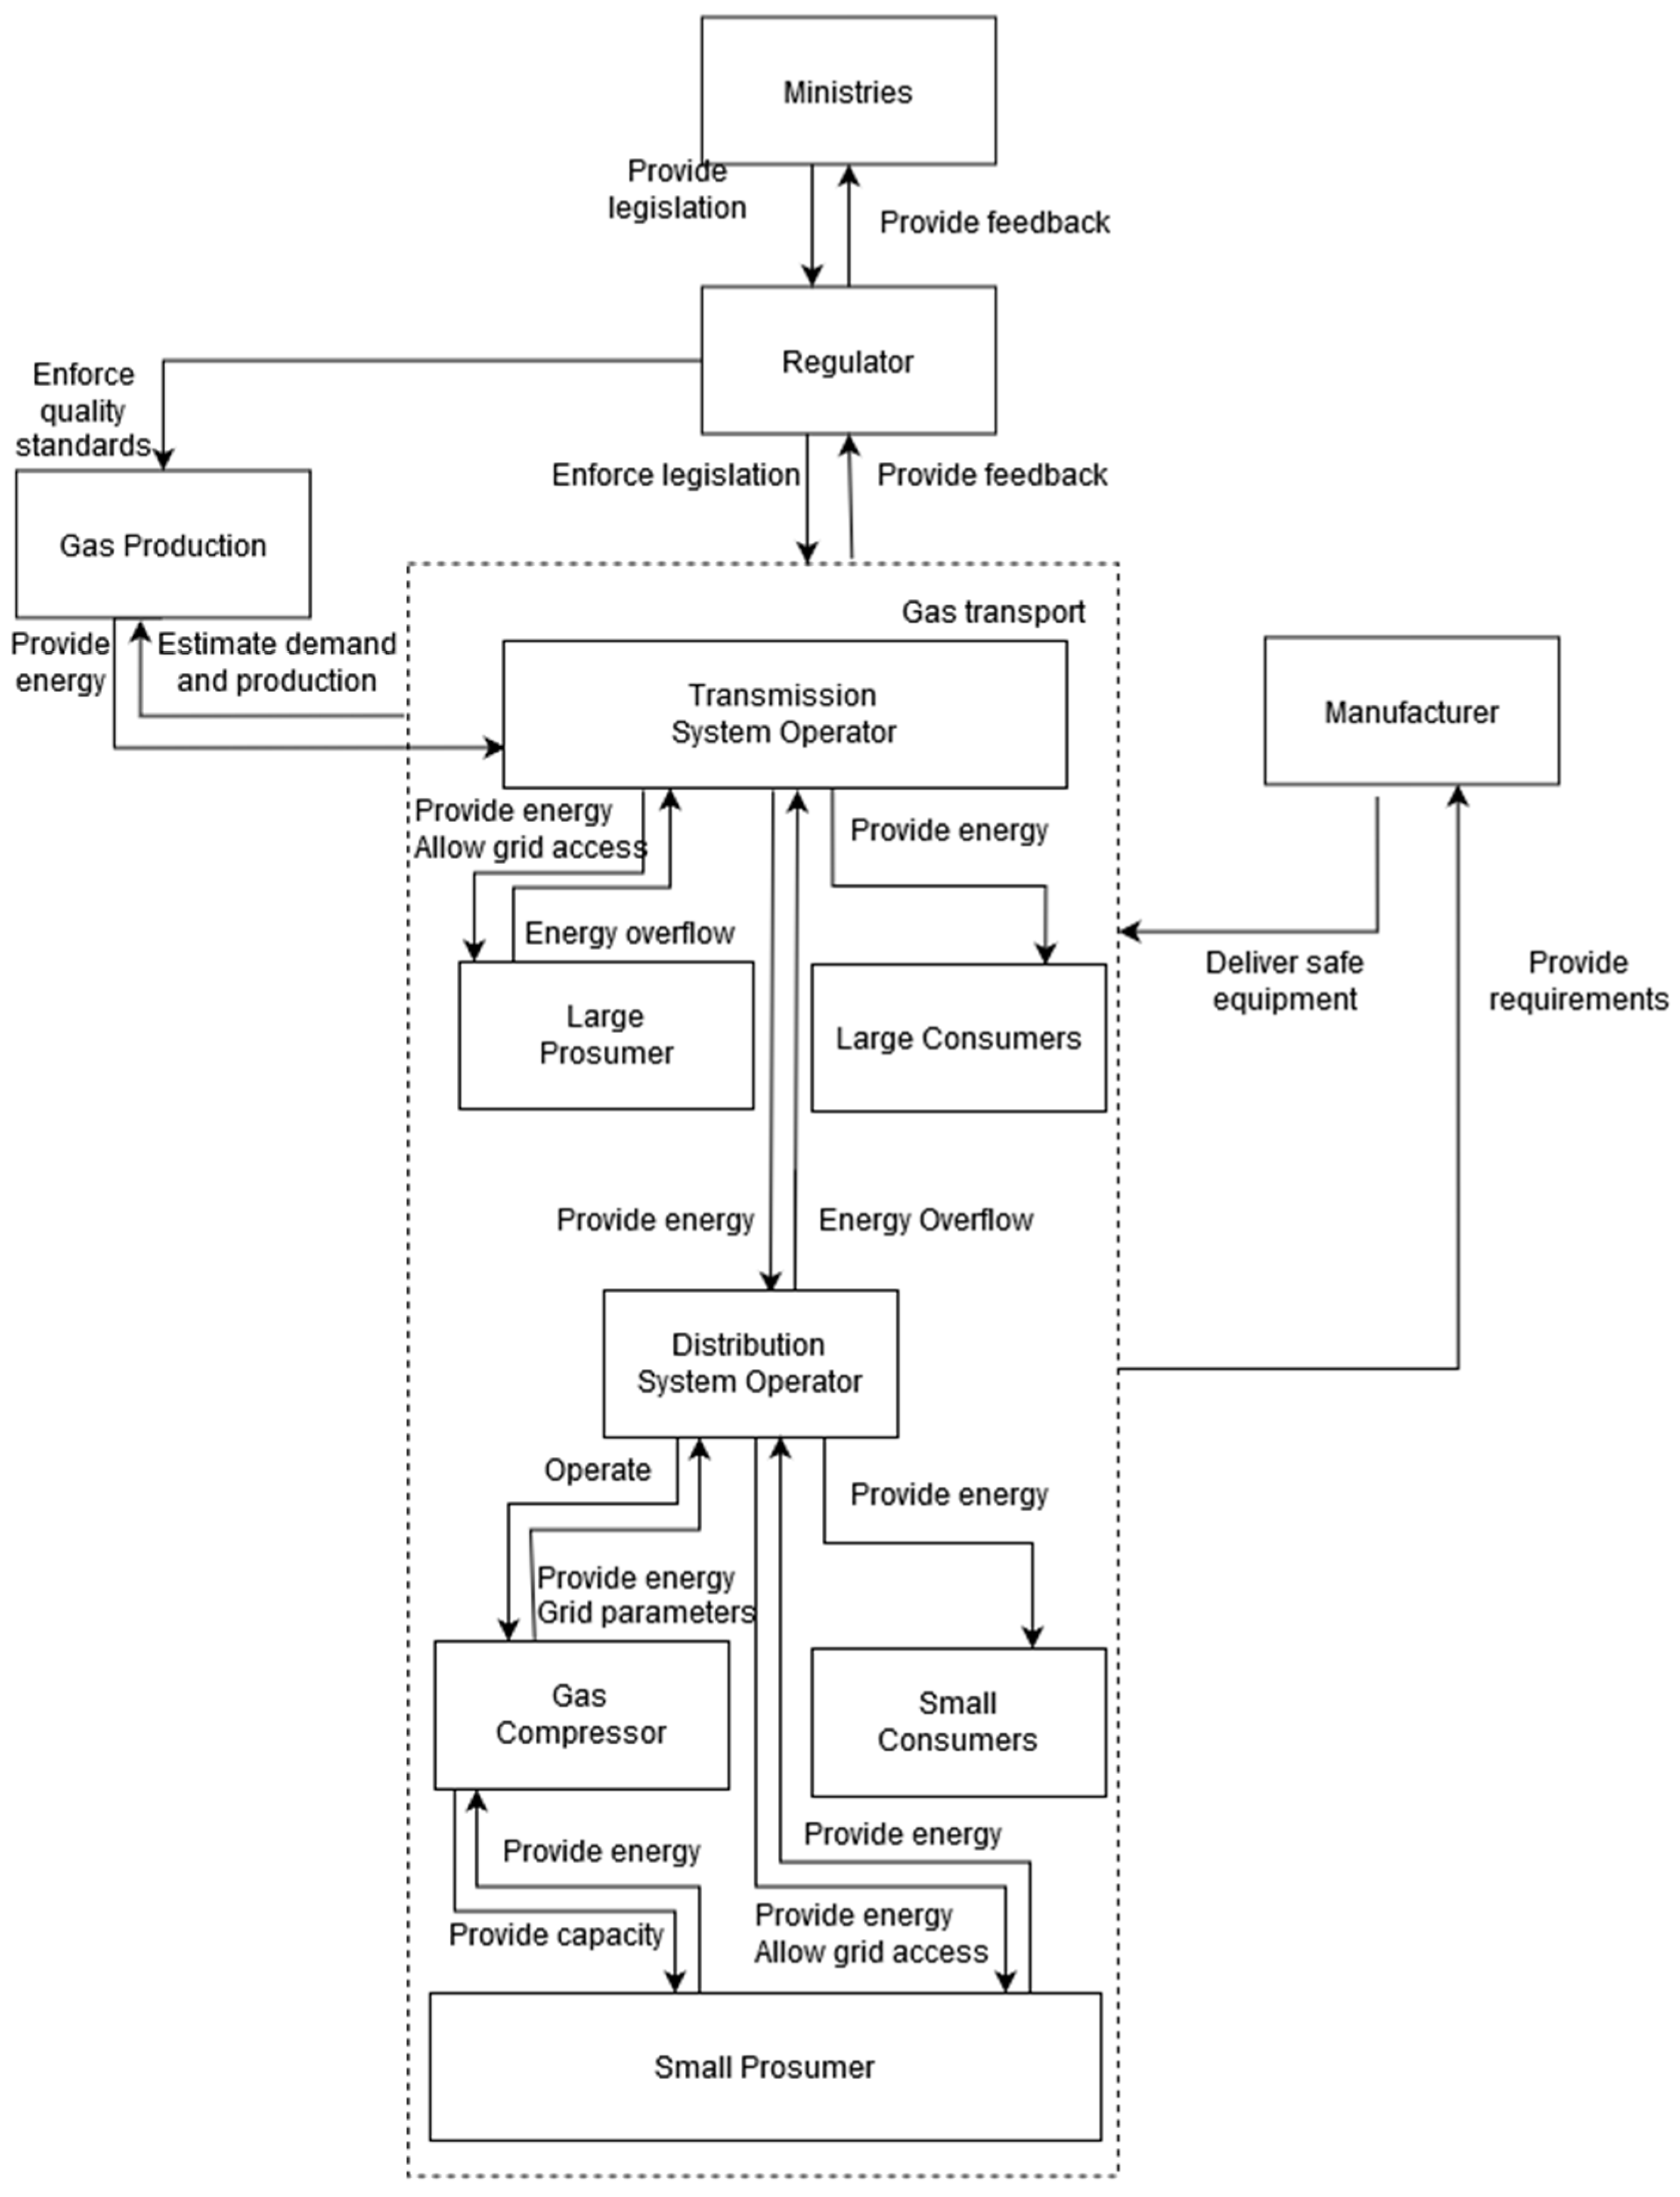
5.1. Changing Features of the Dutch Gas Sector

The case involves a gas compressor that is to operate in a rural part of the province of Flevoland in the Netherlands. Figure 4 shows the compressor operating in between a 4-bar (green) and 8-bar (orange) grid. A biogas producer is connected to the low-pressure grid (4-bar) and produces 250 m3 of gas per hour at a continuous rate. As a consequence of the continuous biological process, there is little room for flexibility in adjusting the supply to changing demand. At times when the production is higher than the demand on the 4-bar grid, the gas compressor technically enables the transfer of gas to the 8-bar grid. This is not possible with the commonly installed pressure reduction technology for connection, which only supports one-way transport from the high- to the low-pressure grid.

5.2. Analytic Risk Assessment: HAZOP

The HAZOP method identifies deviations from the design intent. It assumes that a system is designed to be safe, and that deviations from this design intent may lead to accidents. The method identifies component failures as causes of accidents that can consequently be used to assign risk. This can be done by estimating the likelihood of component failure, and the effects thereof. The HAZOP analysis starts with a visualization of the system using a Piping and Instrumentation Diagram (P&ID). This detailed diagram, often used in the process industry, shows all relevant components of the technological system, as well as the instruments and equipment that control its processes. The analyst establishes the boundaries of the system during this step, as well as the nodes that will be analyzed individually. Then, in the second step, the design intent of each of the components is identified, describing their expected functioning by identifying key parameters. Deviation of these parameters from the design intent is indicated by guidewords that suggest the causes of malfunctioning. Third, possible causes and consequences of variations of design intent are established in a brainstorming session [27,44].
The HAZOP study for the booster was executed by an expert team of seven persons from Dutch network companies and gas technology manufacturers [45]. First, the P&ID was specified, indicating components like filters, flow meter, pressure regulator, detectors, compressor, etc. Second, the parameters were identified that are relevant for analyzing system performance. The expected performance of these parameters is indicated by the design intent (Table 3). The parameter ‘incoming pressure’ (i.e., into the compressor), for example, must stay between 3 and 4.2 bar. A deviation from the design intent occurs if the pressure becomes ‘higher’ or ‘lower’ (the guidewords), as a consequence of which an accident may happen. In addition to hazards that strictly resulted from the HAZOP methodology (those that can be described by a combination of parameter, design intent, and guideword), the experts also identified hazards that did not readily fit these descriptors. For the latter example, consider cyber threats. While one could argue for ‘digital safety’ as a relevant parameter, there is no relevant design intent or guideword (other than inconsequential descriptors, such as ‘functioning’ and ‘yes, no’). This difference is visible in Table 3, where system hazards, such as envisioned by the HAZOP method, are displayed on the left and other (external) hazards on the right.
Third, hazard causes and consequences were identified by the HAZOP team. All parameters identified in Table 3 were systematically analyzed in combination with their relevant guidewords (Table 4). This table specifies how a higher incoming pressure into the gas compressor may, under certain conditions, lead to an unwanted release of gas—which in turn might result in associated accidents, such as poisoning, fire, or explosion. The full HAZOP analysis includes 42 lines, such as those shown below, divided over the parameters identified in Table 3. It also includes recommendations for mitigating identified hazards, and a means of prioritization based on failure estimates. The most relevant systemic hazards will be discussed in the next chapter.

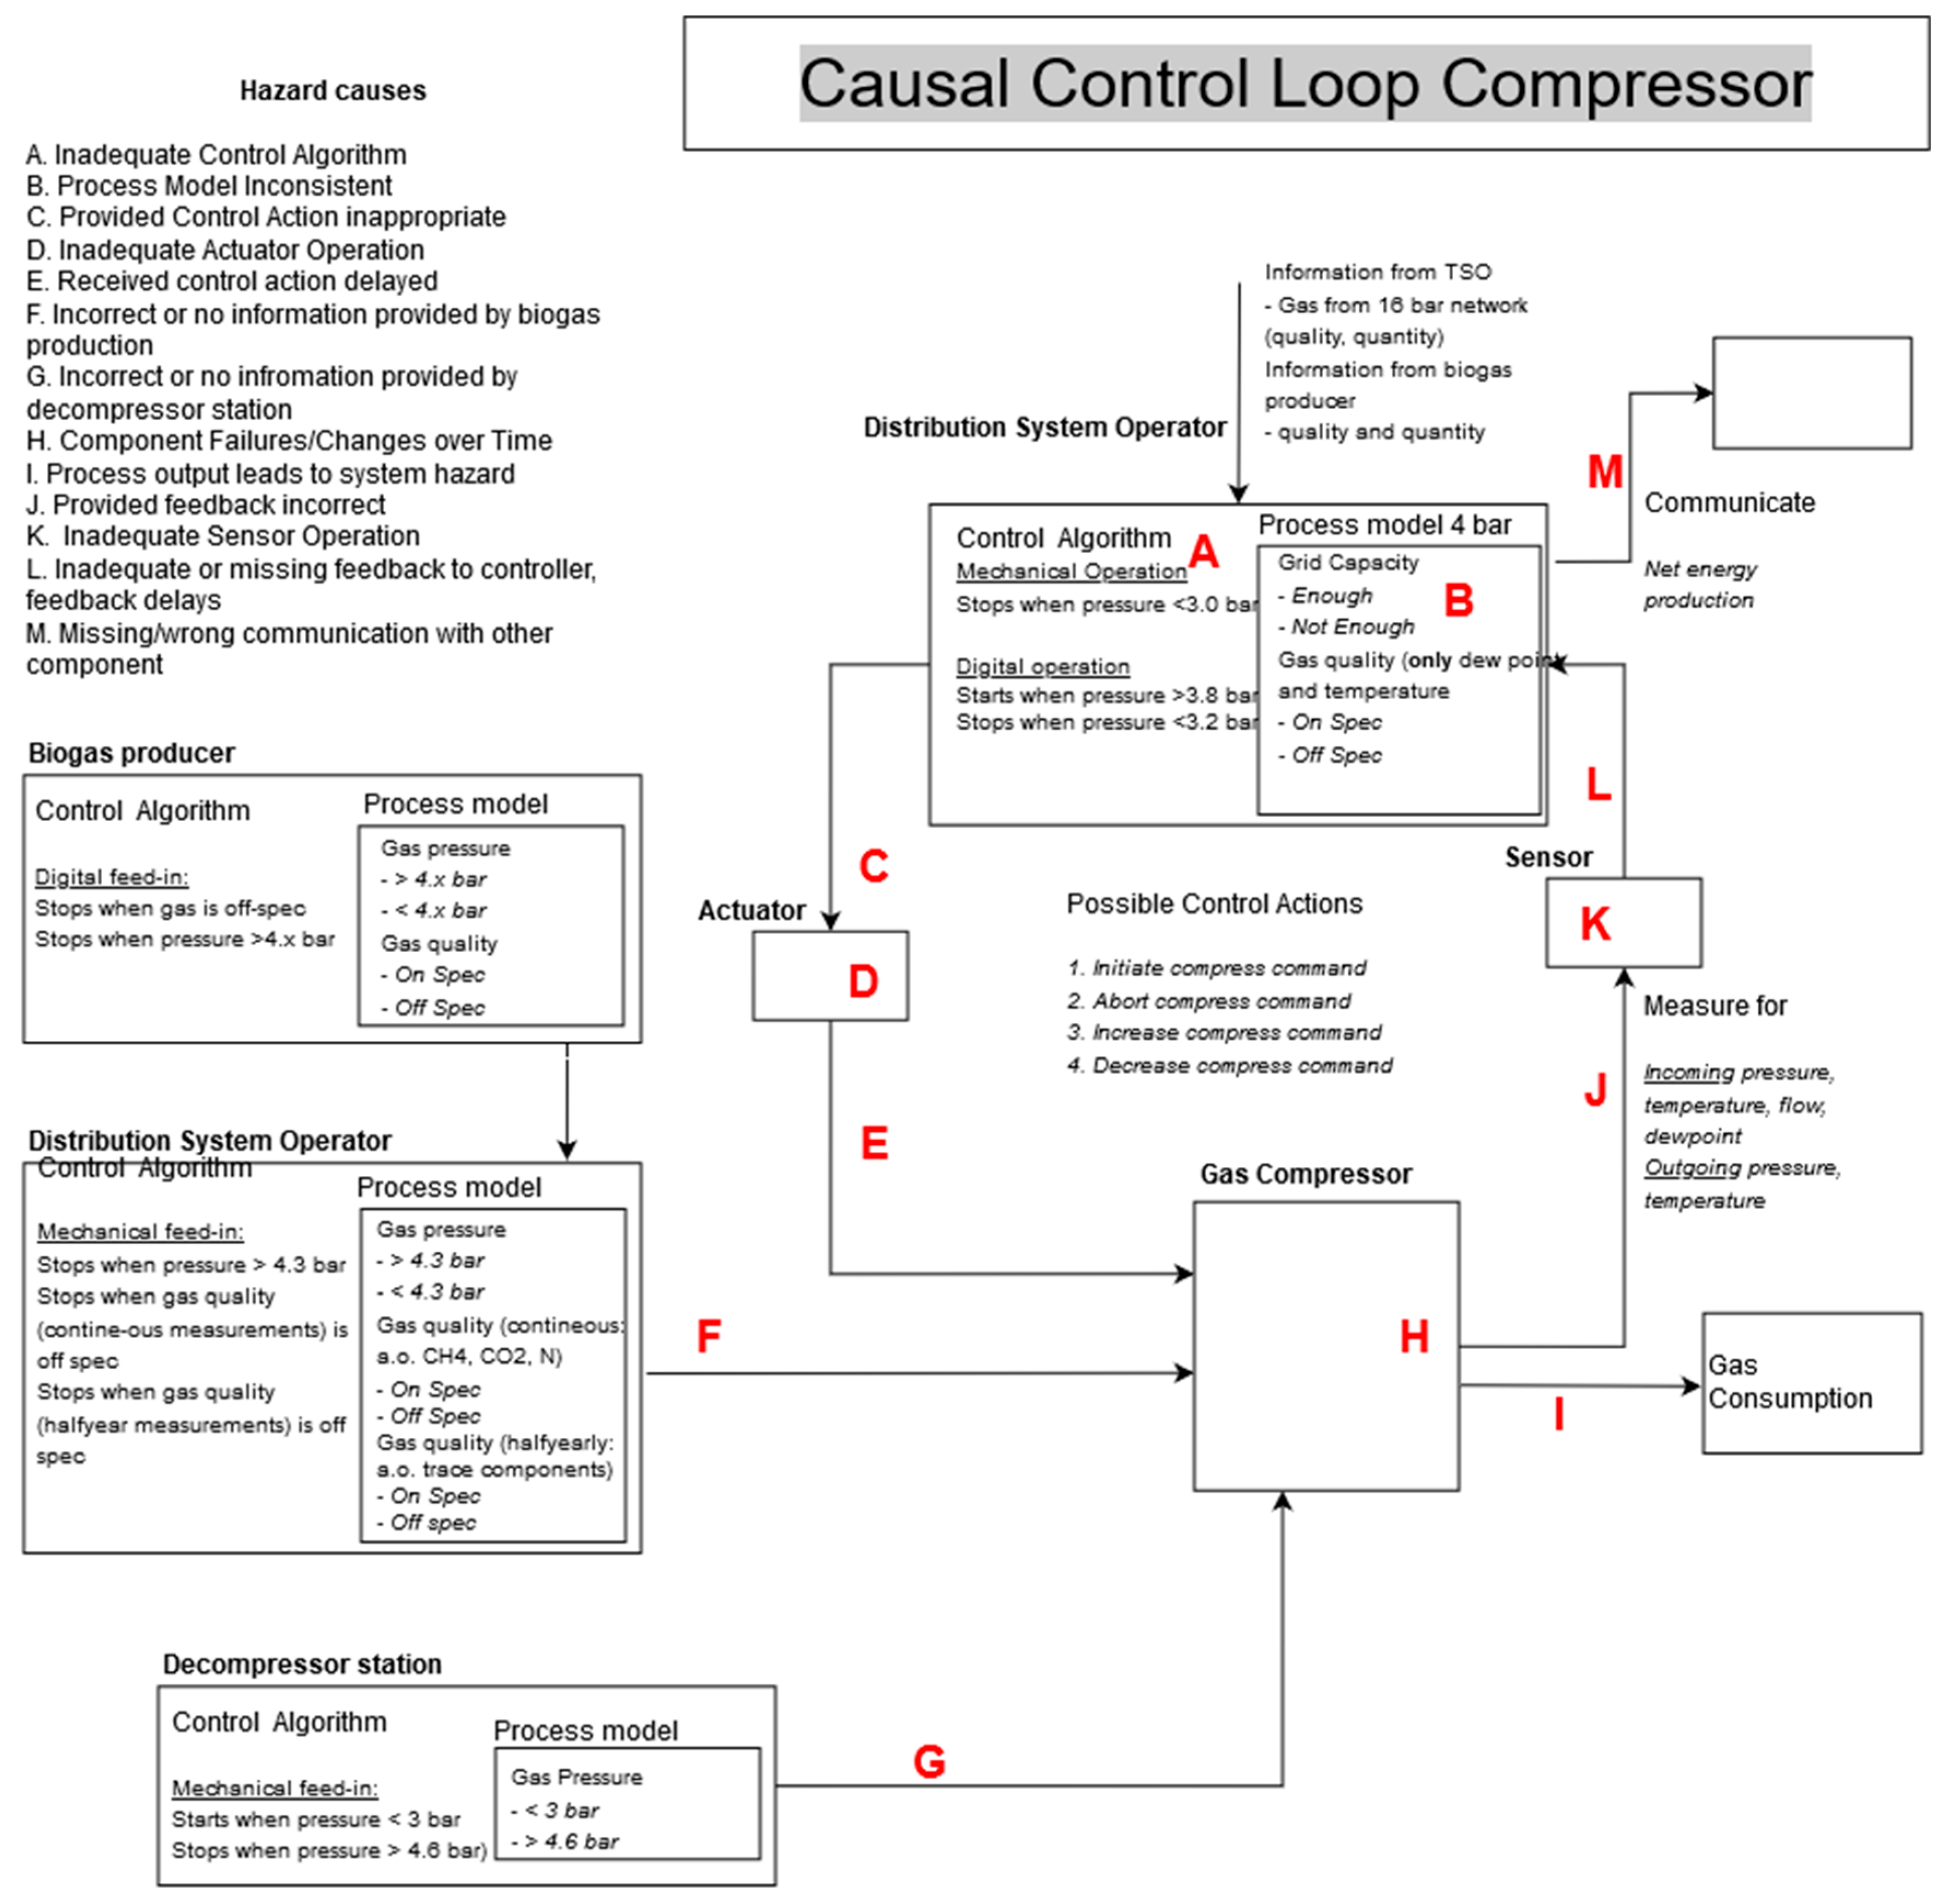
5.3. Systemic Risk Assessment: STPA

STPA identifies scenarios under which control over the system fails. This method assumes that safety is an emergent property, and mitigates hazards by defining relevant control actions. If all possible interactions in the system are sufficiently controlled, a safe system state is achieved [22]. The analysis is done as follows. First, the purpose of the analysis is defined. Losses are defined, as well as hazards that may lead to these losses. Second, a control structure is developed. This visualization identifies functional relationships among different system components and shows their possible interactions. The control structure illustrates these interactions as control actions issued by a controller to a controlled process, as well as feedback that goes the other way. It also sets the boundaries for the analysis. Third, the researcher identifies how inadequate control can generate a hazardous system state—resulting in a list of unsafe control actions. Fourth, and last, the researcher determines how unsafe control actions can occur [22].
The STPA was performed by the corresponding author in collaboration with several experts involved in designing and installing the gas compressor. The analysis was completed through an iterative process. First, losses and high-level safety hazards were identified that were relevant to the functioning of the gas compressor in the system. These are illustrated in Table 5 and include, other than losses traditionally associated with hazard analysis, such as Fire/Explosion (L-1) and Poisoning (L-2), also loss of operator performance (L-3), or Loss of Producer Revenue (L-4). High-level safety hazards are linked to the identified losses, and are system states that should be avoided. Second, a control structure was developed that illustrates the position of the gas compressor in relation to other relevant parts of the system. The control structure is attached in Appendix B. Third, unsafe control actions were identified. To start off with, relevant control actions must be determined. The analysis focuses on the relationship between the gas compressor and its controller, where the latter can issue four possible control actions: (1) Initiate, (2) abort, (3) increase or (4) decrease the ‘compress’ command. Next, unsafe control actions can be identified by systematically analyzing the four conditions under which control actions can cause hazardous system states:
  • A control action required for safety is not provided or not followed.
  • An unsafe control action is provided.
  • A potentially safe control action is provided too early or too late, that is, at the wrong time or in the wrong sequence.
  • A control action required for safety is stopped too soon or applied too long) ([22], p. 213).
This yielded a total of 41 Unsafe Control Actions, a couple of which are explored in Table 6.
Last, all identified unsafe control actions are mapped against a generic control loop that helps identify possible scenarios in which they might occur. The generic control loop is provided by Leveson (2011), and can be adapted based on information gathered in Step 2 (an unsafe control action is provided). The control structure developed there (Appendix B) shows how the grid operator controls the booster, but is itself dependent on input from others. Incorporating input from multiple system elements allows a systemic view of hazard causation, and results in the detailed control loop (Appendix C). Possible generic hazard causes are labeled A through M, and each unsafe control action can be mapped against those causes to check if and how they might occur. Table 6 illustrates this mapping process for two of the identified Unsafe Control Actions. The grid operator (Distribution System Operator, DSO) might, for example, send a compress command when gas does not meet quality specifications (UCA-33) in several scenarios. Its control algorithm may be inadequate if too-high gas pressure is programmed to overrule the abort command that would usually follow out-of-spec gas (cause A); or there is a power outage which causes quality detection to be defective, while not hampering booster performance (cause K). The full analysis comprises the complete scenario-mapping of all 41 unsafe control actions. A safe system, then, is the result of effectively designed safety requirements that cover all identified hazard causes.

5.4. Discussion

How do the outcomes of the two risk analysis methods compare? To answer this question, we consider both conceptual and empirical differences with a focus on hazards associated with the increased complexity of the system.
The two methods differ fundamentally as to their objective. HAZOP identifies deviations from design intent, and consequently ensures that safeguards are in place to prevent previously identified accidents. STPA identifies unsafe control actions and illustrates how accidents may propagate. We will consider hazards related to gas quality as an example. The HAZOP suggests stopping the operation of the gas compressor when the gas temperature exceeds 40 degrees Celsius, because otherwise it might degrade pipelines and appliances. The identification of this hazard is a direct result of the parameters included in the analysis, namely, the temperature (cf. Table 3). These parameters, in turn, are determined by the compressor’s constituting components as identified in the Piping and Instrumentation Diagram (P&ID). Temperature is a relevant process parameter, a thermometer measures it, and automated devices shut down operations when it exceeds the design intent. However, other parameters exist that are relevant for gas quality, such as methane, carbon dioxide, or nitrogen content. Similarly, the odorization of gas is crucial as it enables the detection of leakages. These parameters are measured in other parts of the system (cf. Appendix C) and, as such, are not part of the P&ID and, by consequence, not included in the HAZOP results.
Conversely, STPA identifies unsafe control actions related to out-of-spec gas (i.e., UCA-33 in Table 6). UCA-33 can lead to HLSH-4 (Feeding of out-of-spec gas into the destination grid, cf. Table 5) and includes safety-critical parameters other than temperature, such as odorization or nitrogen content. STPA’s broader scope, combined with its systemic view, recognizes the dangers that out-of-spec gas might pose for the system at large. While the compressor might not be designed to detect varying gas quality, and out-of-spec gas may not even deter it’s functioning, it does have the capacity to expose a much larger part of the network to out-of-spec gas that remains undetected. Table 6 lists a range of scenarios in which UCA-33 might occur.
The different units of analysis render very different hazard causes. Results from the HAZOP analysis and the STPA, respectively, illustrate component and design failures. HAZOP’s physical failures follow from its focus on nodes, whereas STPA’s design failures can be explained by its focus on unsafe control actions. Hazards related to gas temperature are a good example. The HAZOP identified numerous ways in which the parameter Gas Temperature (cf. Table 3) might be lower or higher than the design intent. These included the cooling part of the compressor or the heat exchanger failing—all five identified hazard causes are component failures. However, the gas temperature might deviate from the acceptable boundary in other ways, too. Parameters determining the functioning of the gas compressor can be modified remotely—creating hazard causes related to digital instrumentation [cf. 18] Modifying the lower threshold for acceptable gas temperature from 20 °C to 0 °C, for example, would effectively stop the functioning of the compressor even if gas technically meets all quality requirements. Modifying the gas temperature threshold through a computer hack, by consequence, does not intuitively follow from the HAZOP analysis because no component failure is involved. STPA, by contrast, identifies unsafe control actions that result in hazardous system states. As illustrated in Table 6, for example, it guides the analyst to ask what might have spurred an unsafe control action (i.e., Process Model Link C) that erroneously stops the compress command. A computer hack that modifies the parameters is such a hazard.
The respective strength of both approaches is visible when linking their outcomes to attributes of the system under analysis. HAZOP effectively identifies hazards related to components that serve a single-purpose (i.e., heat exchanger failure that might cause a high gas pressure); linear interactions between independent subsystems (i.e., too high-pressure in the low-pressure gas grid might cause hazards in the compressor and connected medium-pressure gas grid); or clearly defined controls (i.e., the compressor must be turned off if the gas temperature exceeds 40°C [41]). STPA provides a more comprehensive analysis when these attributes change. To illustrate, it identifies hazards related to components that serve multiple purposes (i.e., software hack may modify a range of parameters—Table 6, process model link C); non-linear interactions between interconnected subsystems (i.e., a compress command may be aborted if other low-pressure gas systems connected to the same medium-pressure gas grid have filled the latter to capacity—Table 6, M); or interacting controls (i.e., when multiple controllers are responsible for controlling different aspects of gas quality—Table 6, A, F).
These results confirm findings from comparable studies. The omission of parameters, such as nitrogen content of gas or its odorization, as illustrated above, is in line with several critiques that observe the difficulty of providing a full inventory of hazards with analytic approaches, such as HAZOP and FMEA (i.e., References [4,18,19,20]). For HAZOP, this is partly due to its inherent structure that determines hazards by focusing on the P&ID and relies on the team brainstorming to generate a design intent and possible deviations from it [42]. Our analysis confirms this by illustrating how hazards related to digital instrumentation (i.e., cyber threats) and non-odorized gas are not fully captured by any combination of parameter and design intent. Additionally, our results confirm previous observations that an incomplete hazard inventory may be especially pressing in the case of new technologies [9,19,46]. We observe comprehensive identification of hazards associated with features of conventional gas systems, whereas those associated with future energy systems fall short. This might be explained by a HAZOP expert team basing their analysis on existing knowledge and not being sufficiently guided in exploring novel scenarios [9]. This adds further credence to previous studies claiming systemic risk assessments are valuable in situations in which uncertainty concerning new technologies remains [19]. The way in which our STPA contributes to a fuller picture of hazards is equally supported by comparable studies. Systemic hazards become apparent when focusing on interactions among different system components [20], and the STPA provides a more structured framework to identify novel hazards [9]. Like Rosewater et al. [19], we find that the study of the safety of renewable energy systems must incorporate a systemic view to integrating all possible new interactions.

6. Conclusions

Appropriate risk assessment for future energy systems involves both analytic and systemic risk assessments. This paper provided an example for each, showing marked differences in both their approach and the outcomes. The analytic HAZOP approach provides a rigorous assessment of possible component failures in linear interactions and yields actionable safety recommendations for professionals. The generated risk profiles are instrumental in planning for maintenance and replacement, and direct attention to vulnerable components. The systemic STPA method is better equipped to identify safety concerns related to two-directional energy flow or increased component interaction. Additionally, it identifies hazards related to increased automation of systems—specifically identifying situations in which non-failed components might cause hazardous system states.
The results highlight how increasing complexity in energy systems creates new types of hazard causes. While component failures remain relevant, and deserve continued attention, new hazard causes related to subsystem and component interaction are increasingly pressing. This paper illustrated how hazards may increasingly propagate through energy systems as these systems grow more interconnected, and how responsibilities for maintaining safety must change accordingly. For the case of local biogas production, this concerns the safeguarding of gas quality at the production site, and potentially where it is injected into higher-pressure grids. Additionally, grid operators face new tasks that include monitoring gas quality and facilitating two-directional flow in the gas grid. This paper has shown that, compared to HAZOP, STPA provides a more comprehensive inventory of hazards related to novel ways of monitoring gas quality and other key parameters as these system functions are executed increasingly remote and digitally. The Dutch case of the gas compressor, while exhibiting clear attributes of complexity, is still rather straightforward. Once more biogas producers are added to different low-pressure grids, and more interconnection points emerge among low-pressure grids, as well as medium-pressure grids, existing systemic hazard causes will become more important, and new ones might emerge. While the STPA was successful in identifying ways in which new systemic hazards can emerge, successfully mitigating them requires further steps.
This analysis has two significant implications for global energy transitions. First, it illustrates how sustained use of only analytic methods will mean that system hazards will remain underestimated. These methods are predominantly used in the energy sector today and include, besides HAZOP, also FMEA, Bowtie, and many others. These findings confirm previous studies related to the energy sector, but further research must be directed to the ability of analytic methods other than HAZOP to identify systemic hazards. Likewise, attention should be directed to other systemic methods, such as FRAM and AcciMap, to identify their possible contribution to a more comprehensive understanding of safety hazards in complex energy systems. The results shown in this paper would also be strengthened if both compared risk analyses were executed by the same group of experts, ensuring the same degree of relevant knowledge and resources. Even so, the results as discussed above are relevant as additional insights were provided by the STPA, which was executed by the party with both knowledge and resource disadvantages. Second, the analysis highlights the need to study the organization of safety in energy transitions. Even if more hazard causes can be identified by effectively employing appropriate risk assessment methods, their ultimate mitigation relies on properly facilitating and incentivizing relevant actors. This is true for both the gas and electricity sector, but these results might also hold significance for other infrastructures, including water, railways, or the internet. The integration of renewable energy sources requires the coordination of both public and private actors across different system levels. Allocating responsibility among these actors for new and changing interactions in complex systems is not straightforward, and also merits further research. This paper serves as an encouragement for both academics and practitioners in the energy sector to look beyond the predominant methodologies, and to explore what constitutes appropriate risk assessment for them.

Author Contributions

Conceptualization, B.R.; methodology, B.R.; investigation, B.R.; writing—original draft preparation, B.R.; writing—review and editing, B.R., R.K., G.R. and A.C.; supervision, R.K., G.R. and A.C.; project administration, B.R.; funding acquisition, R.K. and G.R. All authors have read and agreed to the published version of the manuscript.

Funding

This research has been funded by Netbeheer Nederland.

Acknowledgments

The analysis in this article is those of the authors and does not necessarily represent the opinion of the funding partner. We would like to acknowledge input from the companies and organizations that shared the results of their risk assessment, as well as all interviewees who contributed to this article.

Conflicts of Interest

The authors declare no conflict of interest. The funders of the study had a role in guiding the research design, including case selection but had no say in the outcome.

Appendix A

Table A1. Systematic literature review queries.
QueriesQuery as Conducted on ScienceDirect at 7 August 2020
Query 1
Biogas and Hydrogen with analytic methods
qs = (BIOGAS OR HYDROGEN) AND (“FMEA” OR “FMECA” OR “HAZOP” OR “HAZID” OR “BOWTIE”)&date = 2010–2020&
tak = (BIOGAS OR HYDROGEN) AND (“FMEA” OR “FMECA” OR “HAZOP” OR “HAZID” OR “BOWTIE”)&articleTypes = REV%2CFLA%2CCH%2CABS&show = 100
Query 2
Solar PV and Wind Turbine with analytic methods
qs = (“SOLAR PV” OR “SOLAR PANEL” OR “WIND TURBINE”) AND (“FMEA” OR “FMECA” OR “HAZOP” OR “HAZID” OR “BOWTIE”)&date = 2010–2020&tak = (“SOLAR PV” OR “SOLAR PANEL” OR “WIND TURBINE”) AND (“FMEA” OR “FMECA” OR “HAZOP” OR “HAZID” OR “BOWTIE”)&articleTypes = REV%2CFLA%2CCH%2CABS&show = 100
Query 3
Battery or Fuel Cell with analytic methods
qs = (“BATTERY” OR “FUEL CELL”) AND (“FMEA” OR “FMECA” OR “HAZOP” OR “HAZID” OR “BOWTIE”)&date = 2010–2020&tak = (“BATTERY” OR “FUEL CELL”) AND (“FMEA” OR “FMECA” OR “HAZOP” OR “HAZID” OR “BOWTIE”)&articleTypes = REV%2CFLA%2CCH%2CABS&show = 100
Query 4
Biogas and Hydrogen with systemic methods
qs = (BIOGAS OR HYDROGEN) AND (“STPA” OR “FRAM” OR “ACCIMAP”)&date = 2010–2020&tak = (BIOGAS OR HYDROGEN) AND (“STPA” OR “FRAM” OR “ACCIMAP”)&articleTypes = REV%2CFLA%2CCH%2CABS&show = 100
Query 5
Solar PV and Wind Turbine with systemic methods
qs = (“SOLAR PV” OR “SOLAR PANEL” OR “WIND TURBINE”) AND (“STPA” OR “FRAM” OR “ACCIMAP”)&date = 2010–2020&tak = (“SOLAR PV” OR “SOLAR PANEL” OR “WIND TURBINE” OR “BATTERY”) AND (“STPA” OR “FRAM” OR “ACCIMAP”)&articleTypes = REV%2CFLA%2CCH%2CABS&show = 100
Query 6
Battery or Fuel Cell with systemic methods
qs = (“BATTERY” OR “FUEL CELL”) AND (“STPA” OR “FRAM” OR “ACCIMAP”)&date = 2010–2020&tak = (“BATTERY” OR “FUEL CELL”) AND (“STPA” OR “FRAM” OR “ACCIMAP”)&articleTypes = REV%2CFLA%2CCH%2CABS&show = 100

Appendix B

Figure A1. Control structure gas compressor.
Energies 13 06523 g0a1

Appendix C

Figure A2. Causal loop compressor.
Energies 13 06523 g0a2

References

  1. IEA. Getting Wind and Sun onto the Grid—A Manual for Policy Makers. 2017. Available online: https://www.iea.org/reports/getting-wind-and-solar-onto-the-grid (accessed on 9 December 2020).
  2. Riemersma, B.; Correljé, A.F.; Künneke, R.W. Historical developments in Dutch gas systems: Unravelling safety concerns in gas provision. Saf. Sci. 2020, 121, 147–157. [Google Scholar] [CrossRef]
  3. Hammond, G.P.; Waldron, R. Risk assessment of UK electricity supply in rapidly evolving energy sector. Proc. Inst. Mech. Eng. Part A J. Power Energy 2008, 222, 623–642. [Google Scholar] [CrossRef]
  4. Cameron, I.; Mannan, S.; Németh, E.; Park, S.; Pasman, H.; Rogers, W.; Seligmann, B. Process hazard analysis, hazard identification and scenario definition: Are the conventional tools sufficient, or should and can we do much better? Process Saf. Environ. Prot. 2017, 110, 53–70. [Google Scholar] [CrossRef] [Green Version]
  5. International Energy Agency. Digitalization & Energy. 2017. Available online: https://www.iea.org/reports/digitalisation-and-energy (accessed on 9 December 2020).
  6. Perrow, C. Normal Accidents: Living with High-Risk Technologies; BasicBooks: Princeton, NJ, USA, 1984. [Google Scholar]
  7. Provan, D.J.; Woods, D.D.; Dekker, S.W.A.; Rae, A.J. Safety II professionals: How resilience engineering can transform safety practice. Reliab. Eng. Syst. Saf. 2020, 195, 106740. [Google Scholar] [CrossRef]
  8. Hollnagel, E.; Pruchnicki, S.; Woltjer, R.; Etcher, S. Analysis of Comair flight 5191 with the functional resonance accident model. In Proceedings of the 8th International Symposium of the Australian Aviation Psychology Association. 2008; Volume 8. Available online: https://hal-mines-paristech.archives-ouvertes.fr/hal-00614254 (accessed on 6 October 2017).
  9. Plioutsias, A.; Karanikas, N.; Chatzimihailidou, M.M. Hazard Analysis and Safety Requirements for Small Drone Operations: To What Extent Do Popular Drones Embed Safety? Risk Anal. 2018, 38. [Google Scholar] [CrossRef]
  10. Stanton, N.A.; Harvey, C.; Allison, C.K. Systems Theoretic Accident Model and Process (STAMP) applied to a Royal Navy Hawk jet missile simulation exercise. Saf. Sci. 2019, 113, 461–471. [Google Scholar] [CrossRef]
  11. Clay-Williams, R.; Hounsgaard, J.; Hollnagel, E. Where the rubber meets the road: Using FRAM to align work-as-imagined with work-as-done when implementing clinical guidelines. Implement. Sci. 2015, 10, 1–8. [Google Scholar] [CrossRef] [Green Version]
  12. Read, G.J.M.; Naweed, A.; Salmon, P.M. Complexity on the rails: A systems-based approach to understanding safety management in rail transport. Reliab. Eng. Syst. Saf. 2019, 188, 352–365. [Google Scholar] [CrossRef]
  13. Salmon, P.M.; Read, G.J.M.; Stevens, N.J. Who is in control of road safety? A STAMP control structure analysis of the road transport system in Queensland, Australia. Accid. Anal. Prev. 2016, 96, 140–151. [Google Scholar] [CrossRef]
  14. Dunsford, R.; Chatzimichailidou, M. Introducing a system theoretic framework for safety in the rail sector: Supplementing CSM-RA with STPA. Saf. Reliab. 2020, 39, 59–82. [Google Scholar] [CrossRef]
  15. Merrett, H.C.; Horng, J.J.; Piggot, A.; Qandour, A.; Tong, C.W. Comparison of STPA and Bow-tie Method Outcomes in the Development and Testing of an Automated Water Quality Management System. MATEC Web Conf. 2019, 273. [Google Scholar] [CrossRef] [Green Version]
  16. Kim, T.-E.; Nazir, S.; Øvergård, K.I. A STAMP-based causal analysis of the Korean Sewol ferry accident. Saf. Sci. 2016, 83, 93–101. [Google Scholar] [CrossRef]
  17. Leveson, N. Are you sure your software will not kill anyone? Commun. ACM 2020, 63, 25–28. [Google Scholar] [CrossRef]
  18. Rejzek, M.; Hilbes, C. Use of STPA as a diverse analysis method for optimization and design verification of digital instrumentation and control systems in nuclear power plants. Nuclear Eng. Des. 2018, 331, 125–135. [Google Scholar] [CrossRef]
  19. Rosewater, D.; Williams, A. Analyzing System Safety in Lithium-Ion Grid Energy Storage. J. Power Sources 2015, 300, 460–471. Available online: https://www.osti.gov/pages/servlets/purl/1257985 (accessed on 6 March 2019). [CrossRef] [Green Version]
  20. Karatzas, S.; Chassiakos, A. System-theoretic process analysis (STPA) for hazard analysis in complex systems: The case of ‘demand-side management in a smart grid’. Systems 2020, 8, 33. [Google Scholar] [CrossRef]
  21. Flood, R.L.; Carson, E.R. Dealing with Complexity: An Introduction to the Theory and Application of Systems Science, 2nd ed.; Springer Science + Business Media: Berlin, Germany, 1993; Volume 50. [Google Scholar]
  22. Leveson, N.G. Engineering a Safer World: Systems Thinking Applied to Safety; The MIT Press: Cambridge, UK, 2011. [Google Scholar]
  23. LePlat, J. Occupational accident research and systems approach. J. Occup. Accid. 1984, 6, 77–89. [Google Scholar] [CrossRef]
  24. Osborne, A.T. Onderzoek Initiatieven Invoedbeperkingen Groen Gas. Baarn, The Netherlands. 2016. Available online: https://groengas.nl/wp-content/uploads/2016/09/Eindrapport_Onderzoek_initiatieven_invoedbeperkingen_groen_gas_201609.pdf (accessed on 9 December 2020).
  25. Leveson, N.; Dulac, N.; Marais, K.; Carroll, J. Moving Beyond Normal Accidents and High Reliability Organizations: A Systems Approach to Safety in Complex Systems. Organ. Stud. 2009, 30, 227–249. [Google Scholar] [CrossRef]
  26. Leveson, N.G. Rasmussen’s Legacy: A Paradigm Change in Engineering for Safety. Appl. Ergon. 2017, 59, 581–591. [Google Scholar] [CrossRef]
  27. Meyer, T.; Reniers, G. Engineering Risk Management, 2nd ed.; De Gruyter: Berlin, Germany, 2016. [Google Scholar]
  28. Hollnagel, E. FRAM: The Functional Resonance Analysis Method: Modelling Complex Socio-Technical Systems; Ashgate: Surrey, UK, 2012. [Google Scholar]
  29. Rasmussen, J. Risk management in a dynamic society: A modelling problem. Saf. Sci. 1997, 27, 183–213. [Google Scholar] [CrossRef]
  30. Underwood, P.; Waterson, P. Systemic accident analysis: Examining the gap between research and practice. Accid. Anal. Prev. 2013, 55, 154–164. [Google Scholar] [CrossRef] [PubMed] [Green Version]
  31. Correlje, A.F. Natural Gas: A Tale of Three Markets. In The Routledge Companion to Network Industries; Finger, M., Jaag, C., Eds.; Routledge: London, UK; New York, NY, USA, 2016; pp. 55–67. [Google Scholar]
  32. Pérez-Arriaga, I.J. Regulation of the Power Sector; Springer Science & Business Media: London, UK, 2013; Volume 61. [Google Scholar]
  33. Scholten, D.; Künneke, R. Towards the Comprehensive Design of Energy Infrastructures. Sustainability 2016, 8, 1291. [Google Scholar] [CrossRef] [Green Version]
  34. Ricardo, B.L.; Francesco, G.; Peter, Z.; Pavel, Z.; Lenhart, V.; Maria, M.A. Best Practices and Methodological Guidelines for Conducting Gas Risk Assessments; JRC Scientific and Technical Reports; Publications Office of the European Union: Luxembourg, 2012. [Google Scholar] [CrossRef]
  35. The National Grid. National Grid Electricity Transmission Network Output Measures Methodology Network Asset Risk Annex. 2018. Available online: https://www.nationalgrid.com/uk/electricity-transmission/document/134406/download (accessed on 9 December 2020).
  36. The National Grid. Measuring Our Gas Network Outputs: Methodology for Network Output Measures. 2018. Available online: https://www.nationalgrid.com/uk/gas-transmission/document/125396/download (accessed on 9 December 2020).
  37. Liander. Kwaliteits- en Capaciteitsdocument Gas 2015. 2015, p. 69. Available online: https://www.liander.nl/sites/default/files/Kwaliteits-_en_capaciteitsdocument_2015_Gas.pdf (accessed on 9 December 2020).
  38. Fthenakis, V.; Trammell, S. Reference Guide for Hazard Analysis in PV Facilities. 2003. Available online: https://www.researchgate.net/publication/228611604 (accessed on 21 November 2019).
  39. SODM. Veiligheid Slimme Gasmeters. 2018. Available online: https://www.sodm.nl/documenten/rapporten/2018/11/17/onderzoek-sodm-naar-de-veiligheid-van-de-slimme-gasmeter (accessed on 9 December 2020).
  40. RVO. Voorstel voor Richtlijn voor Het Transport van Ruw Biogas. 2016. Available online: https://www.rvo.nl/sites/default/files/2016/03/Voorstelvoorrichtlijnvoorhettransportvanruwbiogas.pdf (accessed on 29 March 2018).
  41. Kiwa Technology. Toekomstbestendige Gasdistributienetten. 2018. Available online: https://www.netbeheernederland.nl/_upload/Files/Toekomstbestendige_gasdistributienetten_133.pdf (accessed on 9 December 2020).
  42. EUDP. Energy Storage—Hydrogen Injected into the Gas Grid via Electrolysis Field Test. Erritsø, Denmark. 2020. Available online: https://www.entsog.eu/sites/default/files/2018-11/Energinet-MR-station-hydrogen.pdf (accessed on 9 December 2020).
  43. Liander. Themadag Groen Gas. Bunnik, The Netherlands. 2020. Available online: https://www.gasunietransportservices.nl/uploads/fckconnector/1da4836a-9fd6-56e9-a97b-f7d3e2aa9cb0/3105693314/Gasnetten%20die%20groei%20groen%20gas%20mogelijk%20maken%20-%20Pieter%20Mans%2C%20Rolf%20van%20der%20Velde%20Alliander.%20Harry%20Smit%2C%20GTS.pdf? (accessed on 9 December 2020).
  44. Crawley, F.; Preston, M.; Tyler, B. HAZOP: Guide to Best Practice: Guidelines to Best Practice for the Process and Chemical Industries; Elsevier: Amsterdam, The Netherlands, 2008. [Google Scholar]
  45. Panel of Experts. Gas Booster HAZOP Study; Unpublishd confidential document; 2020. [Google Scholar]
  46. Baybutt, P. A Critique on the Hazard and Operability (HAZOP) Study. J. Loss Prev. Process Ind. 2015, 33, 52–58. [Google Scholar] [CrossRef]
Figure 1. Visual representation of the difference between a simple and a complex gas system, figure adapted from Reference [23].
Energies 13 06523 g001
Figure 2. Schematic representation of conventional energy systems.
Energies 13 06523 g002
Figure 3. Schematic representation of future energy systems.
Energies 13 06523 g003
Figure 4. Gas compressor connecting the 4 and 8 bar gas grid, adapted from Reference [43].
Energies 13 06523 g004
Table 1. Summary terms for linear and complex systems, adapted from Reference [5].
Simple SystemsComplex Systems
Linear interactionsNon-linear interactions
No feedback loopsFeedback loops
Single-purpose elementsMultiple purpose elements
Independent subsystemsInterconnected subsystems
Clearly defined controlsInteracting controls
Table 2. Systematic literature review results.
QueriesTotal Identified (Analytic)After Screening (Analytic)Total Identified (Systemic)After Screening (Systemic)
Biogas and Hydrogen272100
Solar Photovoltaic (PV) and Wind Turbine9900
Battery and Fuel Cell202021
Total565021
Table 3. Considered parameters in the hazard and operability study (HAZOP), along with design intent and guidewords.
ParametersDesign IntentGuidewordsParametersDesign IntentGuidewords
System hazards Other hazards
Incoming pressureMax. 4.2 bar pressureHigher, lowerExplosion danger
Min. 3 bar pressure Higher, lower
Outgoing pressureMax. 8.4 bar pressureHigher, lowerCorrosion Too much
TemperatureMax. 30 °CHigher, lowerMalpractice
FlowMax 240 m3 per hourHigher, lower, reverse, wrongNoise disturbance Too much
Pressure on pipes Higher, lowerDigital safety
Table 4. Detailed excerpt from HAZOP.
ParameterPossible CauseWhat Can Go Wrong → Possible Consequences
Incoming pressure (guideword: higher)4-bar grid pressure too highFilter fails → Unfiltered gas in 8-bar network; release of gas
Flow meter fails → No flow measurement; release of gas
Pressure regulator fails → Incoming pressure too high
4-bar grid pressure too high and/or pressure regulator defective/ out-of-specMotion detector fails → Incoming pressure too high
Compressor fails → Pressure out of spec; internal leakage
Piping leaks or otherwise fails → Release of gas
Control line fails → Release of gas
Incoming pressure (guideword: lower)Pressure regulator defective/out-of-specIncoming pressure compressor too low → <not a realistic scenario>
4-bar grid pressure too lowSystem does not boot up → <not a realistic scenario>
Temperature (guideword: higher)Compressor failureCompressed gas too warm → uncontrolled biogas emission
Compressed gas too warm → Physical harm to persons in the vicinity of hot pipelines
Heat exchanger not (fully) functioningCompressed gas too warm → Deterioration of medium pressure gas lines
Table 5. High-level Safety Hazards to be considered.
Losses [L]
[L-1]Fire/Explosion
[L-2]Poisoning
[L-3]Loss of operator performance
[L-4]Loss of producer revenue
High-level Safety Hazards [HLSH]
[HLSH-1]Gas pressure in the source grid exceeds acceptable boundary levels[L-1, L-2, L-3]
[HLSH-2]Gas pressure in the destination grid exceeds acceptable boundary levels[L-1, L-2, L-3]
[HLSH-3]Feeding in of out-of-spec gas into the source grid[L-1, L-2, L-3]
[HLSH-4]Feeding in of out-of-spec gas into the destination grid[L-1, L-2, L-3]
[HLSH-5]Interruption of gas supply (producer to 4 bar)[L-1, L-2, L-3, L-4]
[HLSH-6]Interruption of gas supply (4 bar to 8 bar)[L-1, L-2, L-3]
[HLSH-7]Interruption of gas supply (4 bar to consumer)[L-2, L-3]
Table 6. Detailed analysis of 2 unsafe control actions (from a total of 41).
UCA-1: DSO Does Not Send Initiate Compress Command (cmd.) When Source Grid Pressure Exceeds 3.8 barUCA-33: DSO Sends Initiate Compress cmd. When Gas Is Off-Spec
Process model linkCauseCause
A. Inadequate Control AlgorithmSoftware is installed so that abort/decrease cmd. Overrides initiate cmd. (possible conflicting parameters: Destination grid pressure >8.2 bar; gas is off-spec; parameters are [unwittingly] changed by producer or DSO)Software is installed so that initiate cmd. Overrides abort/decrease cmd. (possible conflicting parameters: Source grid pressure >3.8 bar; parameters are [unwittingly] changed by producer or DSO)
B. Process Model InconsistentProcess model regarding source grid pressure is wrong; Process model regarding destination grid pressure is wrong; Process model regarding gas quality is wrongProcess model regarding gas quality is wrong (critical parameters are not tested)
C. Provided Control Action inappropriateControl algorithm sends inappropriate CA based on inconsistent process model or faulty design; Hostile takeover (computer hack) leads to inappropriate CA Control algorithm sends inappropriate CA based on inconsistent process model or faulty design; Hostile takeover (computer hack) leads to inappropriate CA
D. Inadequate Actuator OperationInitiate cmd. Not received (or received too late) by remote control; Remote control delays sending initiate cmd.Abort/decrease cmd. Not received (or received too late) by remote control; Remote control delays sending Abort or Decrease cmd.
E. Received Control Action delayedCompressor fails to follow up on initiate cmd.Compressor fails to follow up on Abort/decrease cmd.
F. Incorrect or no information provided by biogas productionOff-spec gas is detected at compressor (i.e., continuous gas quality sensor is defective; power outage, but gas keeps flowing; shut-off valve is defective)
Gas that is sent to the grid becomes off-spec before it reaches the compressor
Off-spec gas is sent to the grid (i.e., continuous gas quality sensor is defective; power outage, but gas keeps flowing; half-yearly parameters not frequent enough, due to changing gas biomass source; shut-off valve is defective); Gas that is sent to the grid becomes off-spec before it reaches the compressor
G. N/A
H. Component Failures/Changes over TimeCompressor failure
Power outage (but biogas production continues)
Compressor failure
I. N/A
J. Provided feedback incorrectChanging supply and demand increase gas pressure in segments of the grid not registered by the sensor
K. Inadequate Sensor OperationSensor fails to measure grid capacity correctly; Sensor fails, due to power outageSensor for quality control fails, due to power outage (but biogas production continues)
L. Inadequate or missing feedback to controller, feedback delaysSensor sends faulty or no information regarding grid pressure
M. Missing/wrong communication with other componentMechanical stop is shut in the compressor
Multiple boosters (or large biogas producers) are connected to one destination grid and have priority
Publisher’s Note: MDPI stays neutral with regard to jurisdictional claims in published maps and institutional affiliations.

