Article

Experimental Investigation on the Tensile Strength of Coal: Consideration of the Specimen Size and Water Content

1
School of Energy and Mining Engineering, China University of Mining and Technology, Beijing 100083, China
2
State Key Laboratory of Coal Resources and Safe Mining, China University of Mining and Technology, Beijing 100083, China
3
School of Mechanics and Civil Engineering, China University of Mining and Technology, Beijing 100083, China
4
School of Civil Engineering, Tsinghua University, Beijing 100083, China
*
Author to whom correspondence should be addressed.
Energies 2020, 13(24), 6585; https://doi.org/10.3390/en13246585
Submission received: 20 October 2020 / Revised: 10 December 2020 / Accepted: 11 December 2020 / Published: 14 December 2020

Abstract

:
We experimentally and theoretically explored the microstructure-related effects of water and specimen size on the tensile strength of coal. Cylindrical coal specimens with different sizes (diameters of 25, 38, and 50 mm) and water contents (immersion time lengths: 0, 4, and 7 days) were processed. The microscopic features and mineral compositions of the coal samples were imaged and characterized via scanning electron microscopy (SEM) and X-ray diffraction (XRD). The physicochemical effects of water on the microstructures and coal matrices were investigated by acoustic emission (AE) and fractal theory. In this research, the tensile strength was found to be reduced in larger specimens, which can be explained by an exponential correlation. Water enhances the scale effect on the tensile strength of coal, although the water content decreases in larger specimens. Meanwhile, greater reductions in tensile strength were observed under the coupled effects of the water and specimen size. Based on the AE variation and fractal feature analysis, water was considered to mainly plays roles in dissolving clay minerals, softening the coal matrix, and lubricating cracks during the tensile failure of coal. In addition, the cumulative AE counts and absolute AE energy values decreased with the water content and increased with the specimen size. Similar variations were also observed in the fractal dimension, indicating the intensification of the AE activity concentration around the peak strength area in specimens with greater water contents, as well as a concentration reduction in larger specimen sizes with different water contents. The percentage of tensile failure increased in the diameter range of 25–38 mm and decreased in the range of 38–50 mm. Water increases the proportion of tensile strength generated during the tensile failure process, and this effects increases with the immersion time. Thus, consideration should be given to the combined water and scale effects when extrapolating lab-investigation results to water-related engineering issues in coal mines.

1. Introduction

Tensile strength is a fundamental parameter in geotechnical engineering [1,2], which denotes an intrinsic property of coal and rock masses. The tensile strength is usually affected by the water content [3] and specimen size [4,5]. The presence of water is inevitable in the coal mining process due to the existing geological characteristics [6] and the adopted coal mining technologies, including water injection, hydraulic fracturing [7], and water-driven methane [8] techniques. Thus, understanding the mutual influence of water content and specimen size on the tensile strength of coal is helpful in extrapolating the lab-acquired influence of water on tensile strength to fieldwork. This is essential for the tensile strength determination used as part of the coal mass stability estimation process in engineering applications, such as in coal pillar optimization, roadway support processes, and dynamic disaster prevention in water intrusion areas of coal mines.
In general, the scale (size) effect is considered attributable to the microstructural variations due to specimen size differences in coal [9,10,11]. In coal, microstructures such as pre-existing discontinuities and mineral inclusions affect the initiation, propagation, and coalescence of cracks during the loading process [12,13], thereby decreasing the bearing capability as greater amounts or volumes of microstructures appear in larger specimens, contributing to the mechanical variations with specimen size [9,14]. Although uniaxial compressive strength (UCS)-related scale effects have been a central focus for serval decades, limited numbers of investigations have investigated the scale (size) dependency of tensile strength in rock [14,15]. The tensile strength variations in coal with specimen size are not yet fully understood.
The influence of water on the mechanical properties of various rock types has been extensively investigated during the past decades [16,17,18,19], both physically and chemically. Besides the Stefan effect induced by water in some kinds of soft rocks [20,21], water is broadly considered to possess weakening effects on the rock strength [16,22,23], since it converts strong silica–oxygen bonds to weaker hydrogen bonds [24], dissolves some clayey matrices [25], lubricates the surfaces of discontinuities [26], and accordingly reduces the cohesion of rock [3]. Compared with various types of rocks, neither the effects of water on the tensile strength, nor the physicochemical interaction effects of coal and water on the tensile strength of coal have been deeply investigated. The roles water plays during the scale effect on the tensile strength of coal remain unknown. Hence, to extrapolate the lab-obtained tensile strength values of coal samples to coal masses in water intrusion areas, investigations should be carried out to simultaneously assess the effects of water content and specimen size on the tensile strength of coal.
To obtain a fundamental understanding of the effects of scale and water content on the tensile strength of coal, techniques are needed to assess the coal–water physicochemical interactions and evolution of damage in coal [16,27,28]. X-ray diffraction (XRD) is a non-destructive technique which enables researchers to obtain composition information according to the crystalline phases presented in a material [29,30,31]. As a type of visualized microscopic analysis, scanning electron microscopy (SEM) has been broadly utilized to obtain high-resolution three-dimensional surface characteristics of samples [32,33]. The acoustic emission (AE) technique is a non-destructive monitoring technology [34,35] which allows the detection of damage growth by passive monitoring of the AE events generated by the fracture development [36,37]. The effective combination of these techniques would allow mineral composition detection, microstructural analysis, and specimen damage measurements, allowing an in-depth understanding of the effects of water and specimen size on the tensile strength of coal.
Thus, considering the need to investigate the scale and water effects, specimens with different diameters (25, 38, and 50 mm) were processed and respectively immersed at time lengths of 0, 4, and 7 days. XRD analysis, SEM detection, and acoustic emission monitoring were respectively utilized to reveal the physicochemical interactions of coal and water, to determine the roles the microstructure plays during tensile failure, and to understand the effects of water content and specimen size on the tensile strength of coal.

2. Effects of Water on Coal

Coal is a complex material containing both organic and inorganic matter [31,38]. Water seeps into the coal mass via geological movement before or after coal formation and mining activities, and mainly exists in three forms, namely free water contained by physicomechanical forces, adsorbed water held by physicochemical forces, and chemically bonded water in mineral inclusions [27,39,40].
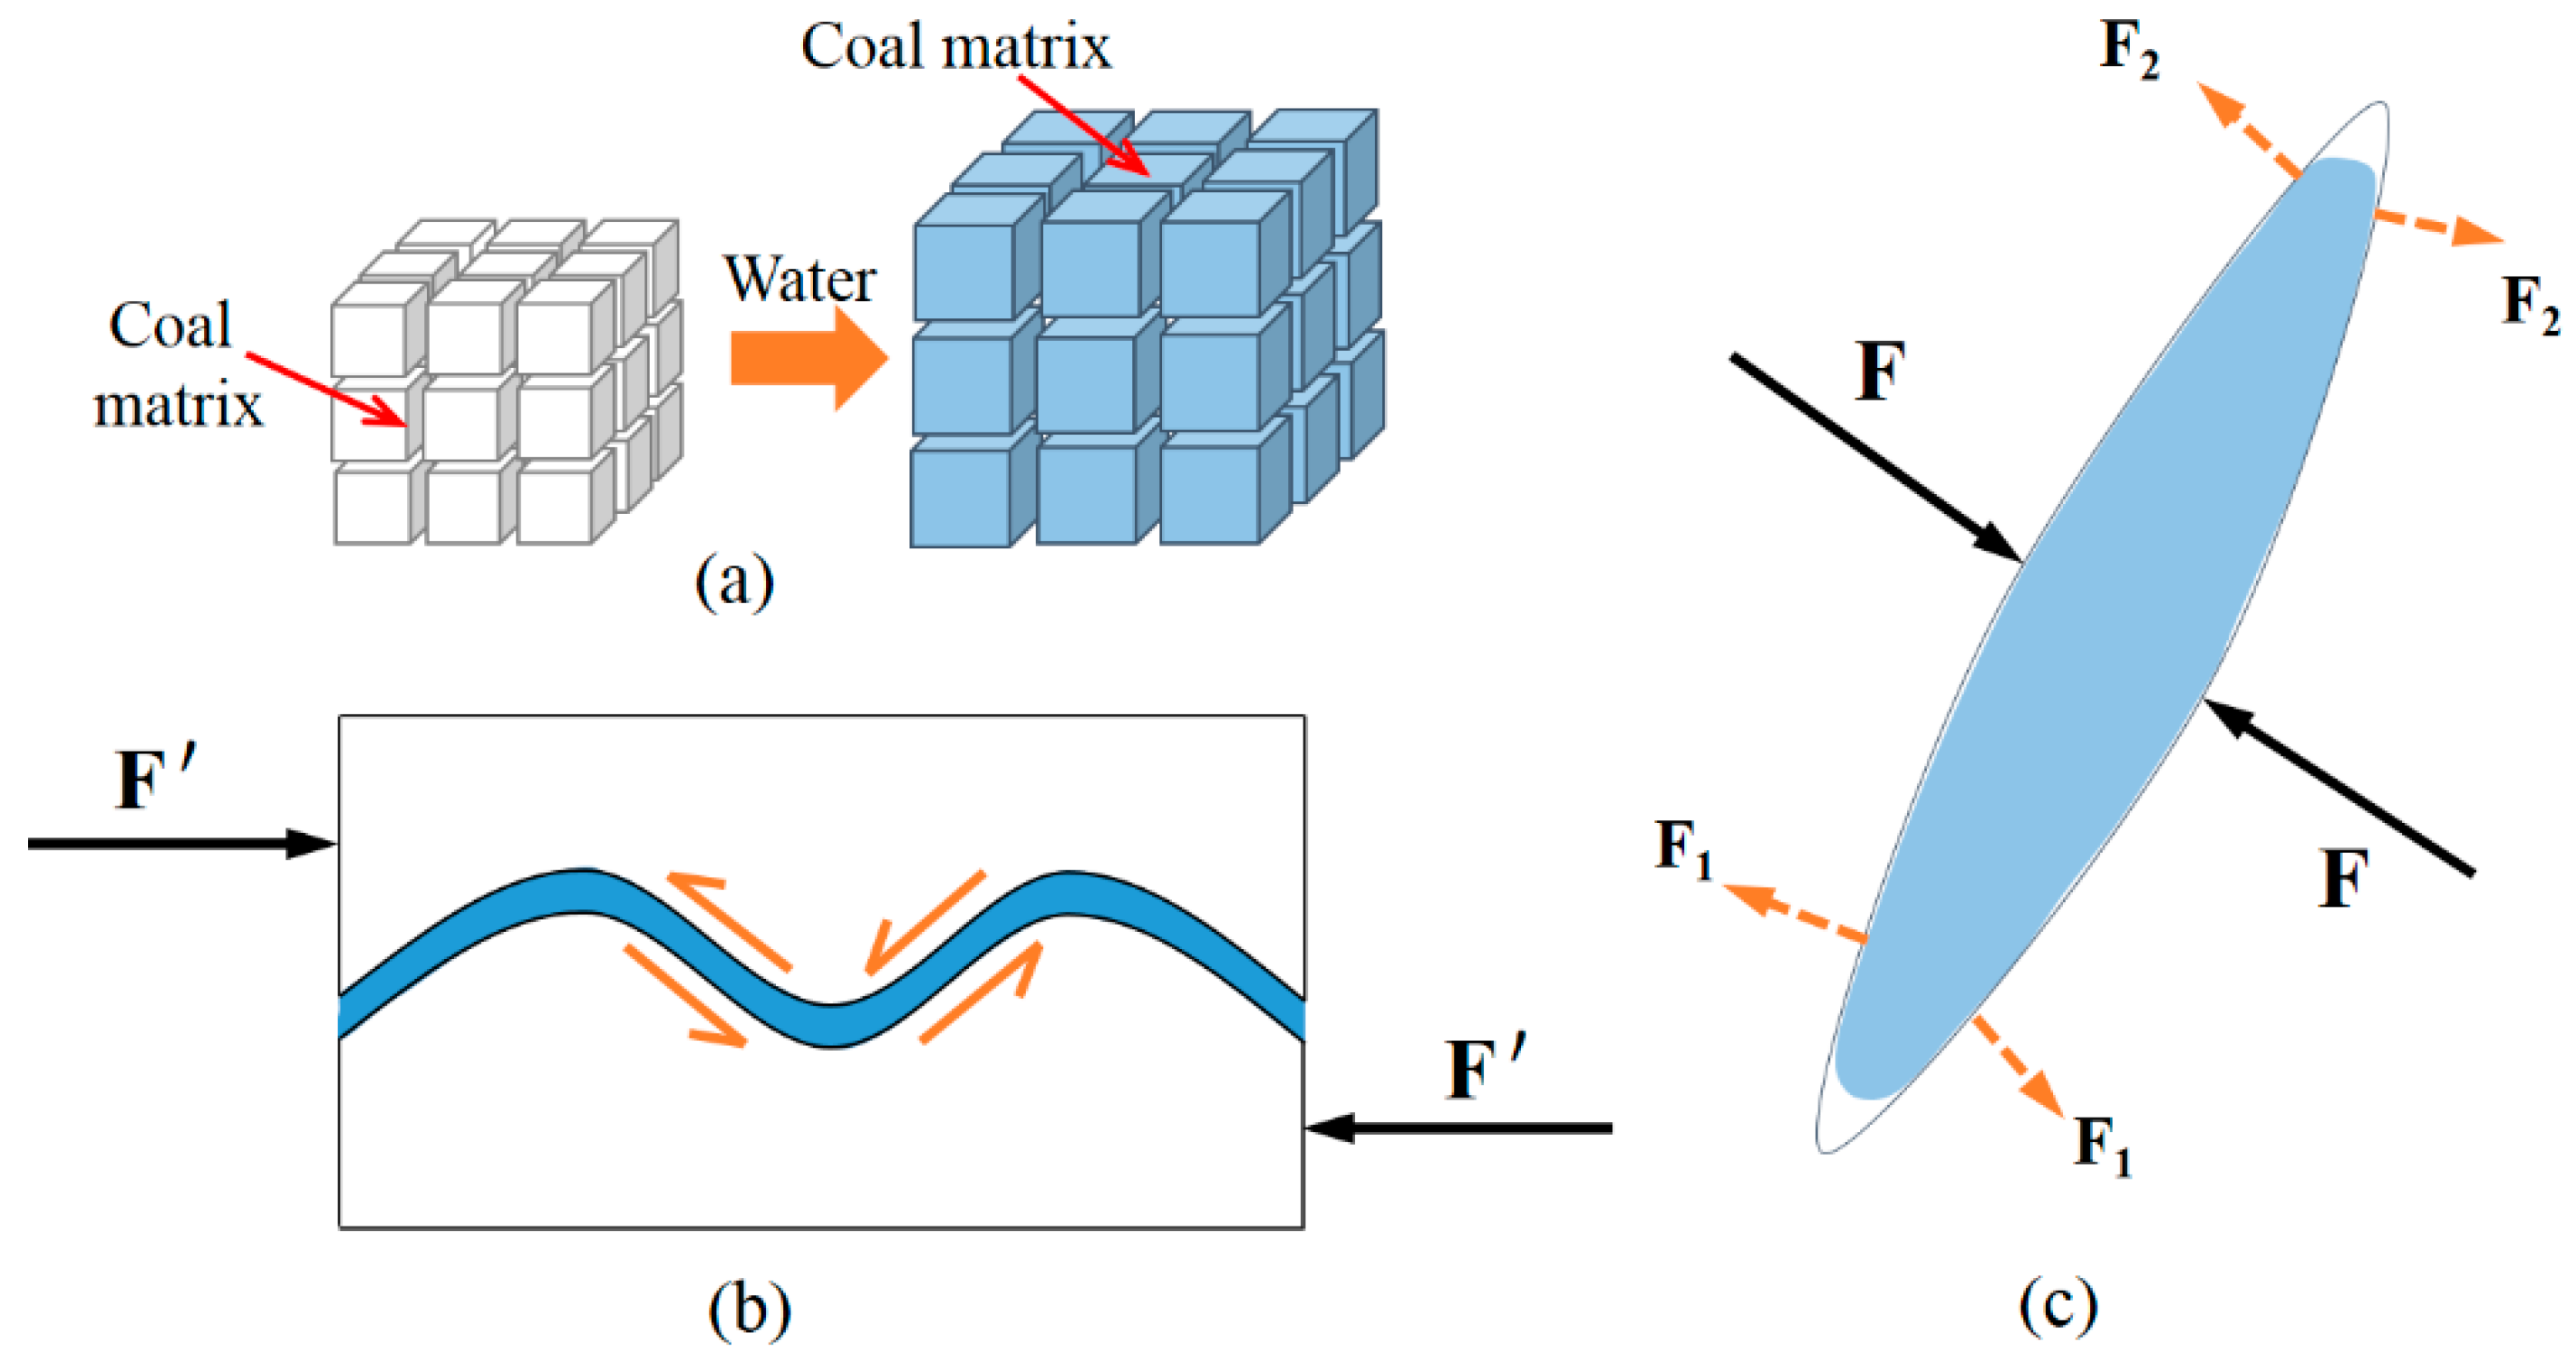
Based on the investigations reported in previous studies [27,40], water exists mainly in two forms (free water and adsorbed water) in pre-existing discontinuities. The adsorbed water is connected by hydrogen bonds (H-bonds) to the oxygen content sites (hydroxyl, -OH) [27], while the free water is mutually attracted by H-bonds and held by capillary forces in pre-existing discontinuities, as shown in Figure 1a. In the figure, the cracks are covered with adsorbed water and the free water existing in the middle of the fissure, as shown in Figure 1b.
The water presence causes structural changes to coal, including dissolution of some clay minerals and the creation of more internal space in the coal [41]. Considering the existing forms and microstructural changes water causes, it may transform the mechanical properties of the coal matrix in three ways:
(1)
Softening effect. The colloidal gel-like structure of coal exhibits a swelling feature in response to water intrusion [42], as shown in Figure 2a, thereby softening the coal matrix and weakening the mechanical properties of the coal.
(2)
Lubrication. The water film generated by the adsorbed water reduces the frictional resistance as the crack surface slides under various mechanical behaviors [28,43], as shown in Figure 2b. As a result, the bearing capacity of the coal weakens.
(3)
Counterforce. The water contained in the fractures also exerts a counterforce as the crack is compressed, as shown in Figure 2c, which may strengthen the mechanical properties under some specific conditions [4]. This phenomenon is known as the Stefan effect [20].

3. Experimental Work

In this section, we measure the fundamental properties of a coal sample, then describe the specimen preparation process, water immersion process, Brazilian splitting test procedure, and AE measurement methodology. Finally, we introduce the experimental parameter settings.

3.1. Coal Sample Properties

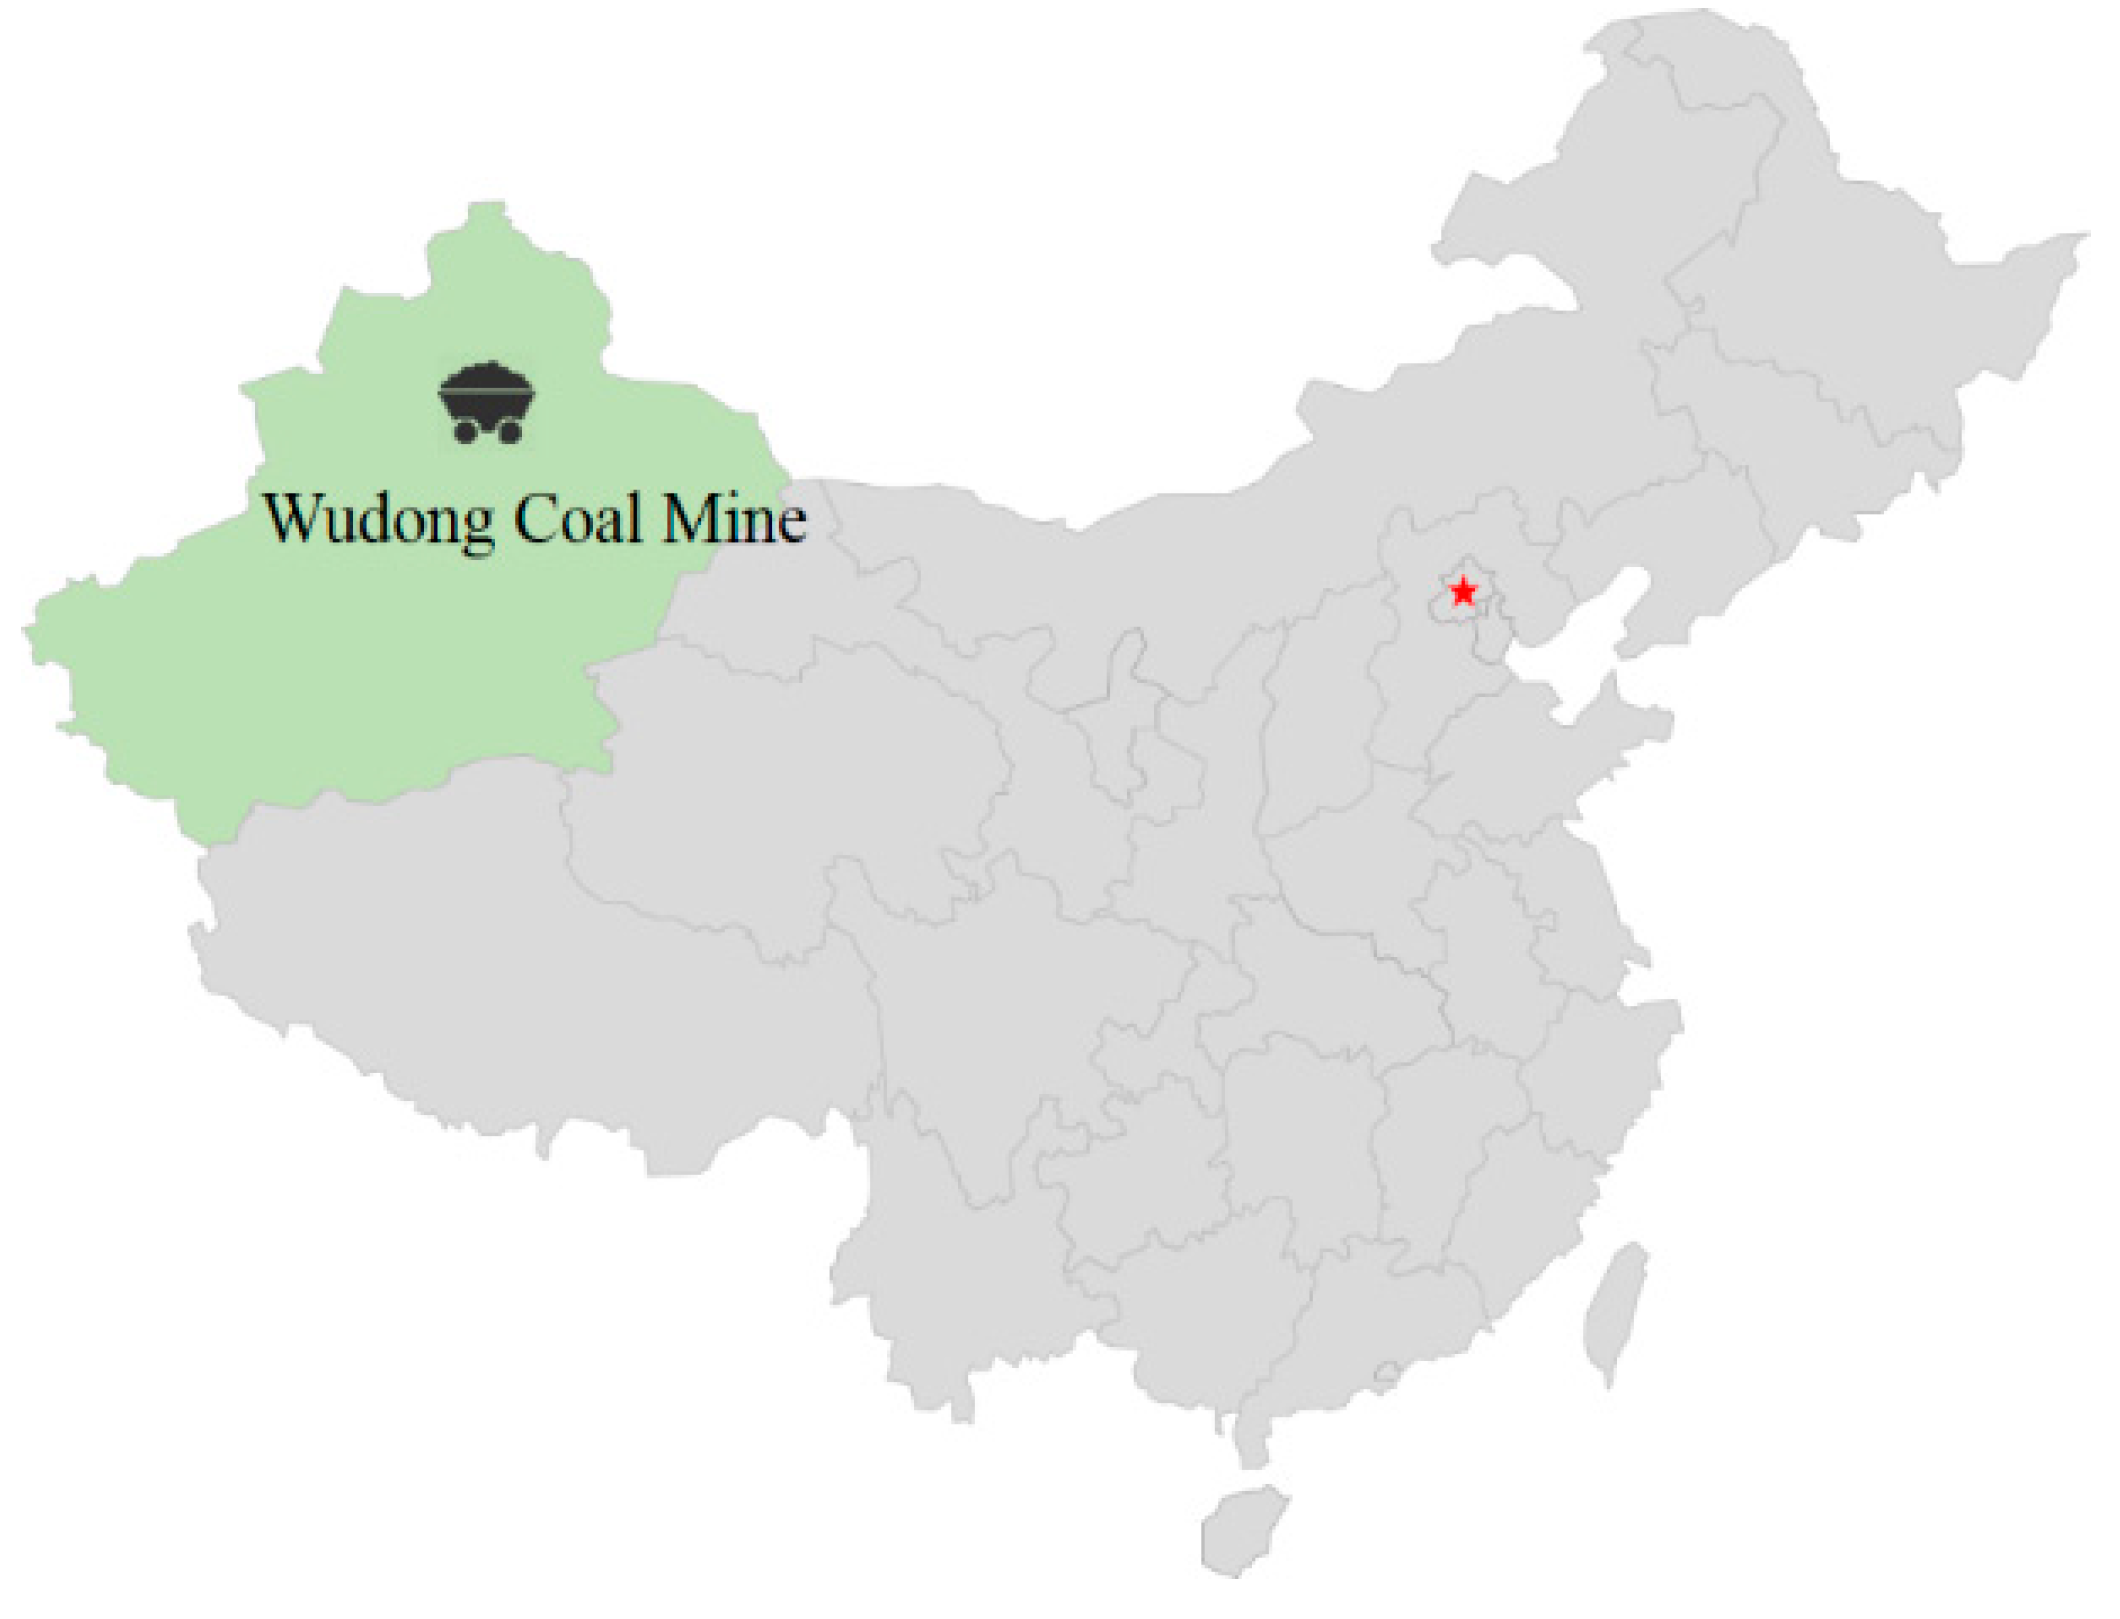
The coal sample was initially excavated from coal seam #45, Wudong Coal Mine, in the western part of China. The location is shown in Figure 3. The block coal density was measured as ~1.46 g/cm3, with a natural moisture content of ~1.2%.
The composition was identified and characterized by XRD, verifying that the major proportions of the coal matrix (91.8%) were carbon, hydrogen, and oxygen. Other minerals accounted for the remaining 8.2% of the matrix, including kaolinite (5.08%), nacrite (2.17%), and lizardite (0.83%). Thus, clay was proven to exist in the coal specimens used in this research.

3.2. Specimen Preparation

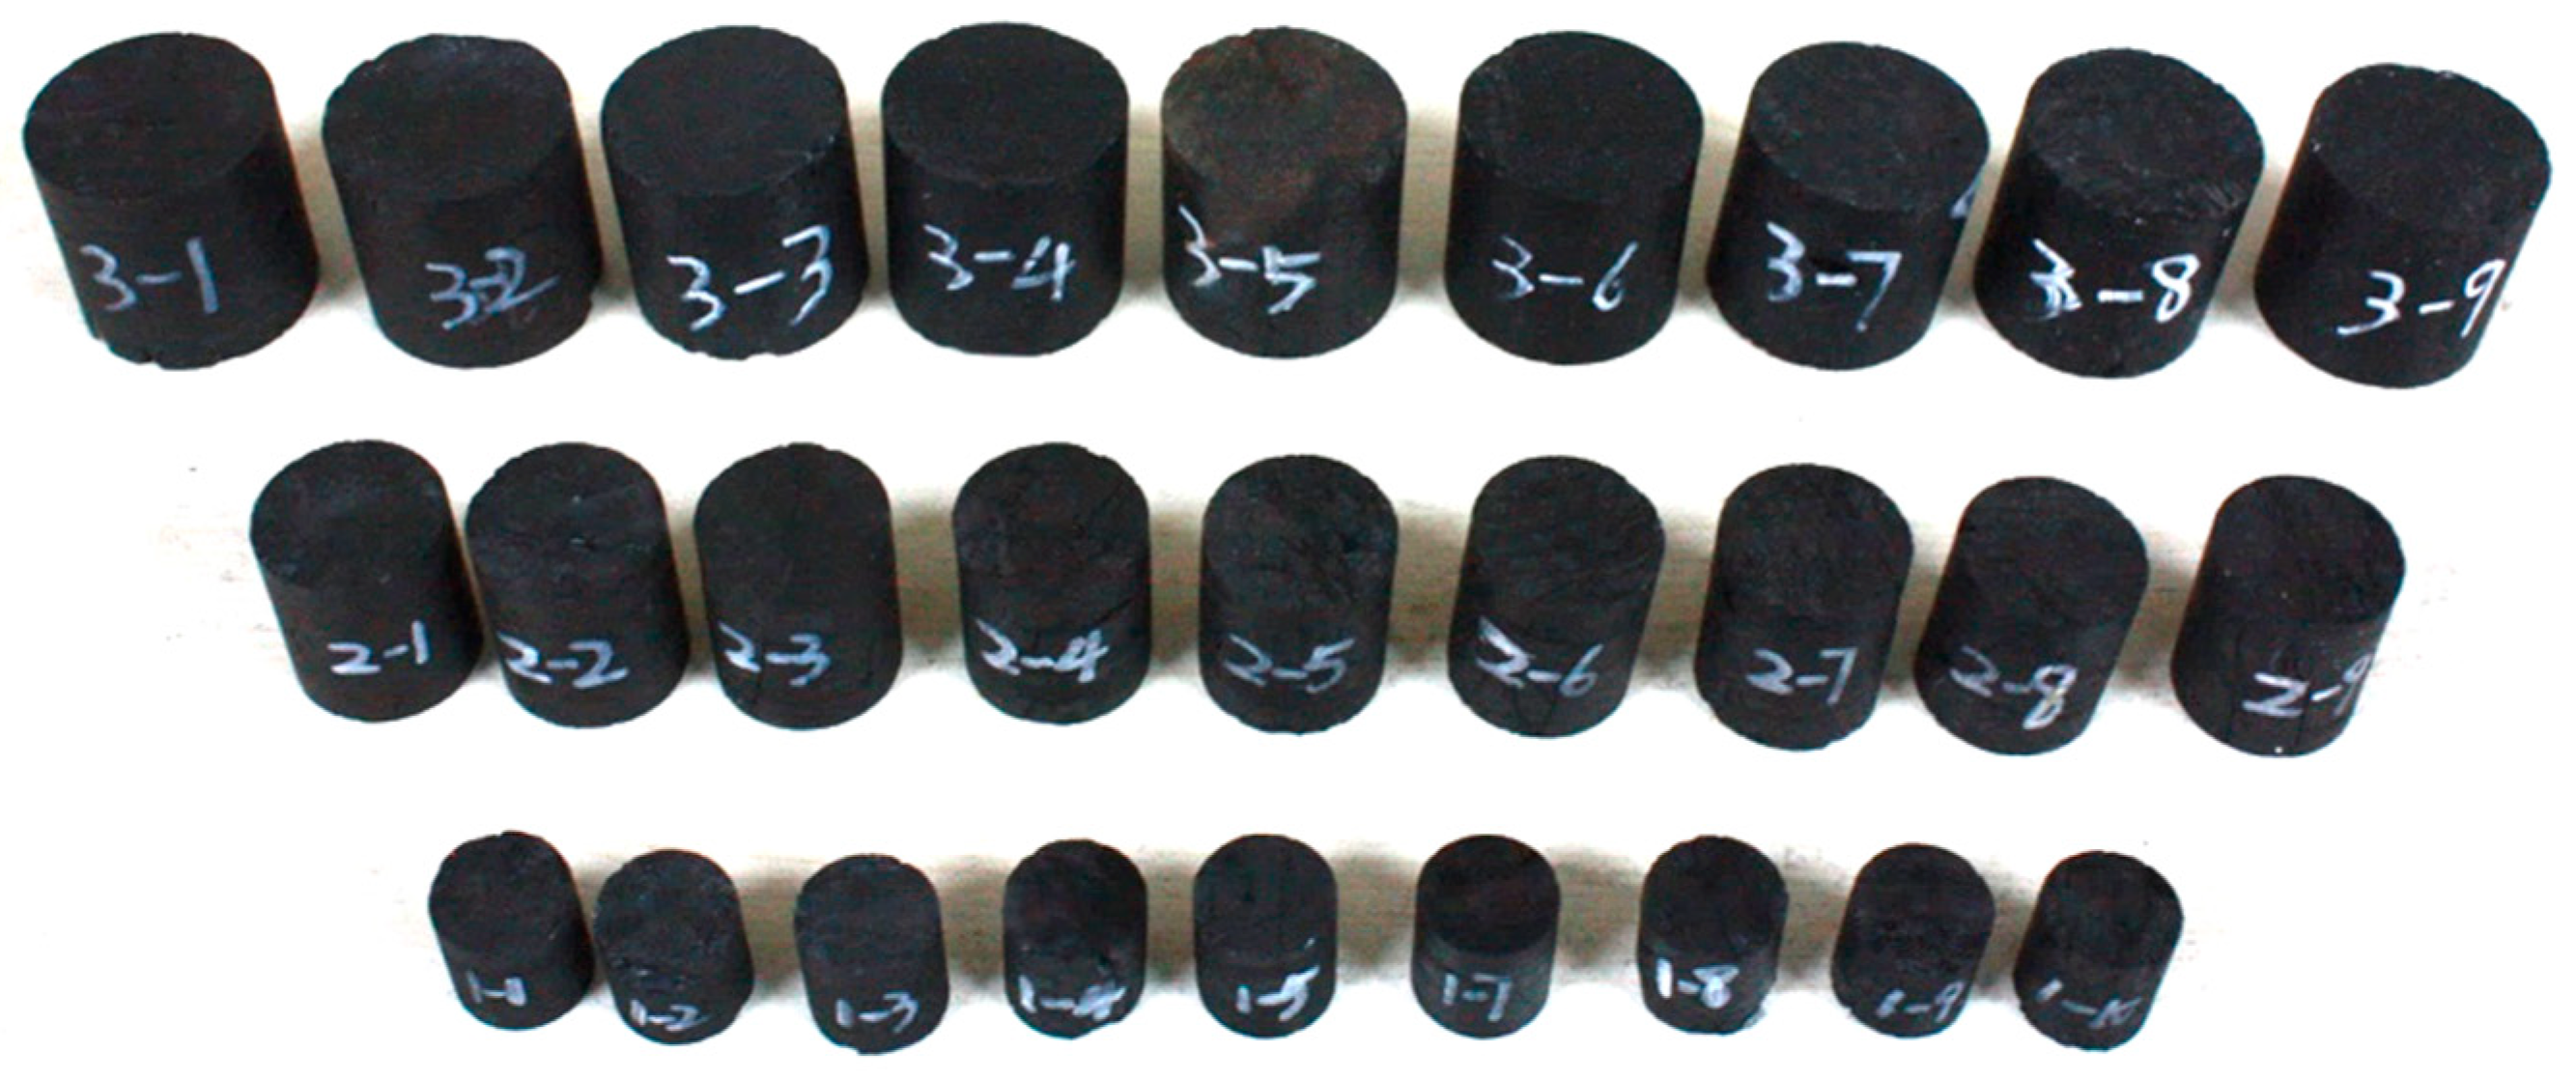
Three groups of cylindrical specimens were cored, processed, and trimmed, which had diameters of 25, 38, and 50 mm and a unified height-to-diameter ratio. Based on the recommendation of the International Society for Rock Mechanics and Rock Engineering (ISRM) for each group of specimens, at least nine samples were processed and subdivided into three sub-groups. Twenty- seven specimens were processed in this research, as shown in Figure 4.

3.3. Immersion Experiment

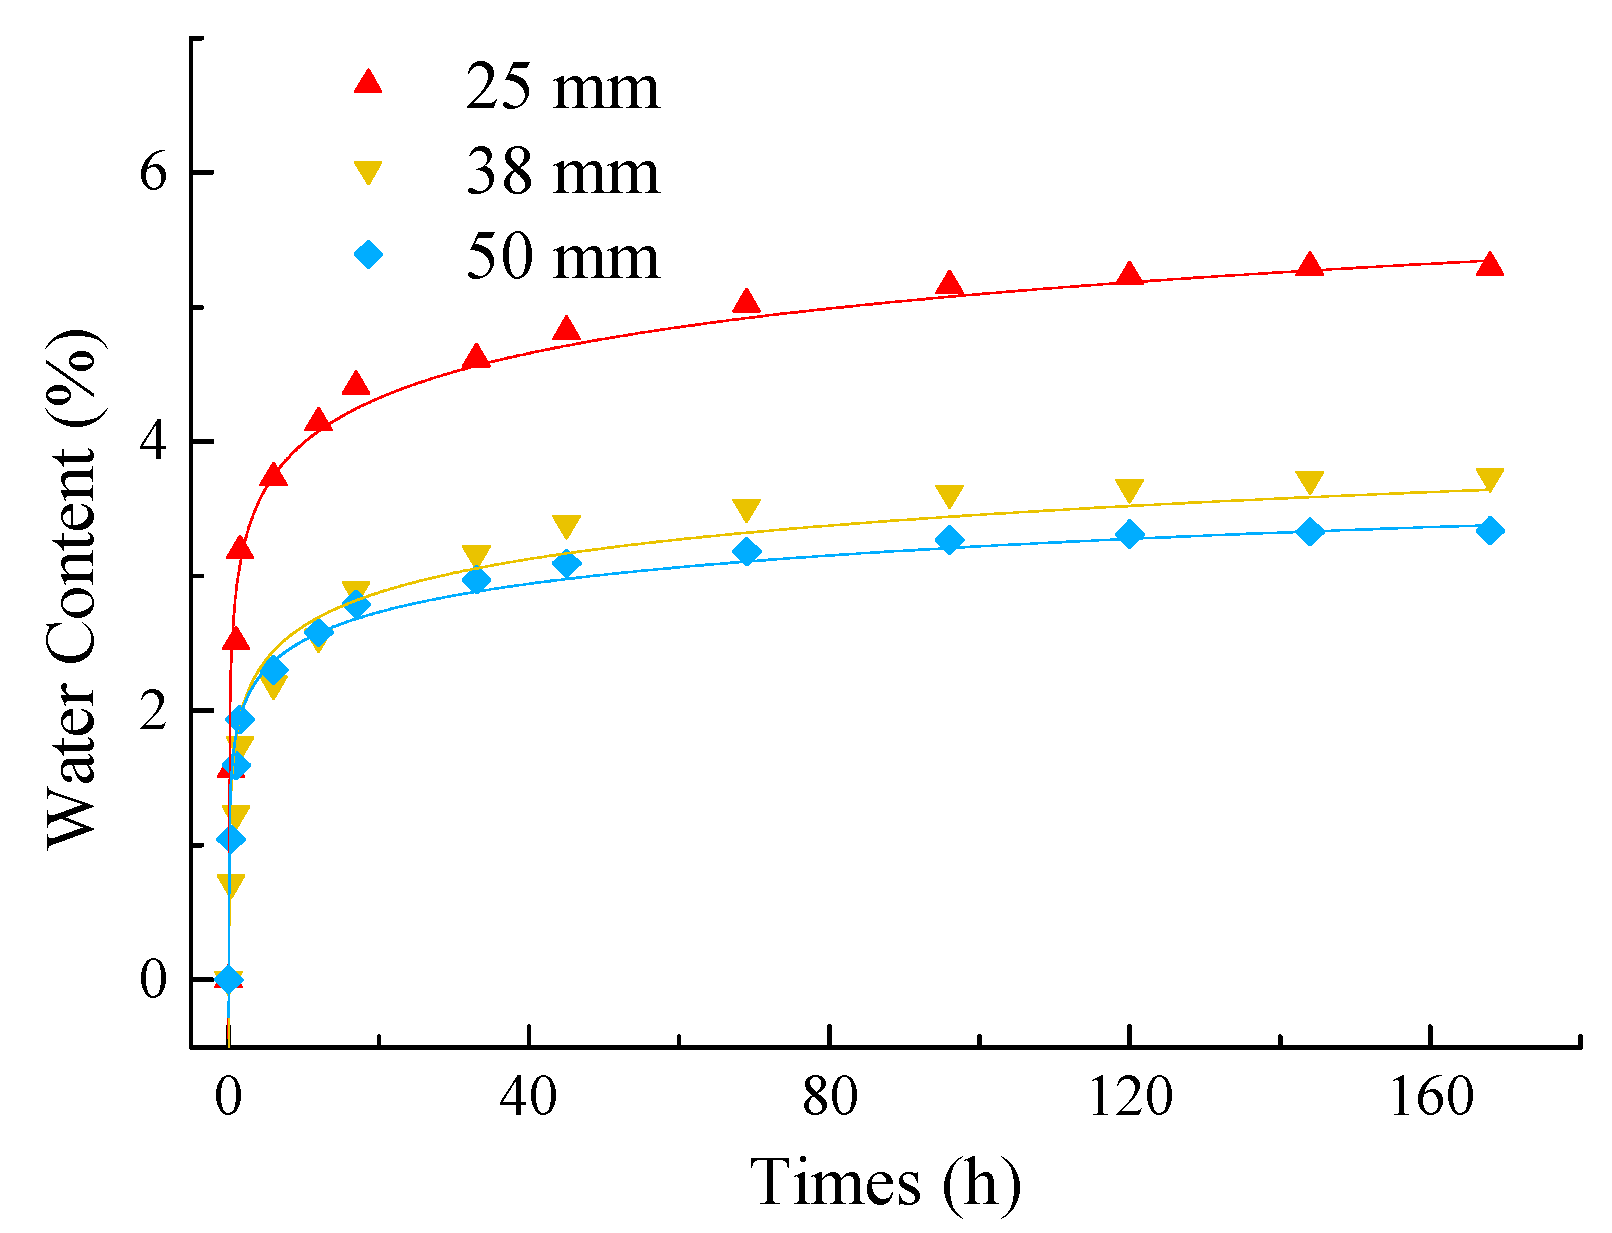
The immersion experiment was implemented using pure water. All specimens were oven-dried and weighed before the immersion test. For each group of specimens, the first three specimens were oven-dried only, the middle three specimens were immersed for 4 days (96 h), and the last three specimens were immersed for 7 days (168 h). The representative water content variations in specimens of different sizes are plotted in Figure 5. The water contents of specimens with different diameters and immersion times are summarized in Table 1.
For the water content values, a logarithmic function was applied, which increased with the immersion time. As shown in Figure 5, it increases sharply in the first 20 h, while it is less obvious as the immersion time changes from 4 to 7 days, as shown in Table 1. Compared with the smaller specimen, the larger specimen had a lower percentage of water, as shown in Figure 5, but with a greater water weight. The decreasing water content may be attributed to the greater density of the coal than that of water, which reduces the percentage of water in larger specimens, although more water entered larger specimens than the smaller ones.

3.4. SEM Measurements

The microstructural characteristics were acquired using a field emission scanning electron microscope (Zeiss, Germany). The SEM instrument had an acceleration voltage range of 0.05~300 kV, with resolutions of 1.0 nm/15 kV and 1.7 nm/1 kV in an energy spectrum detection range of B4-U92. This experiment was implemented under 20 kV conditions at various magnifications.
Surface images of coal in different positions were obtained under 200, 300, 1000, and 1800 times magnification, as shown in Figure 6.

3.5. Brazilian Splitting Test and AE Measurements

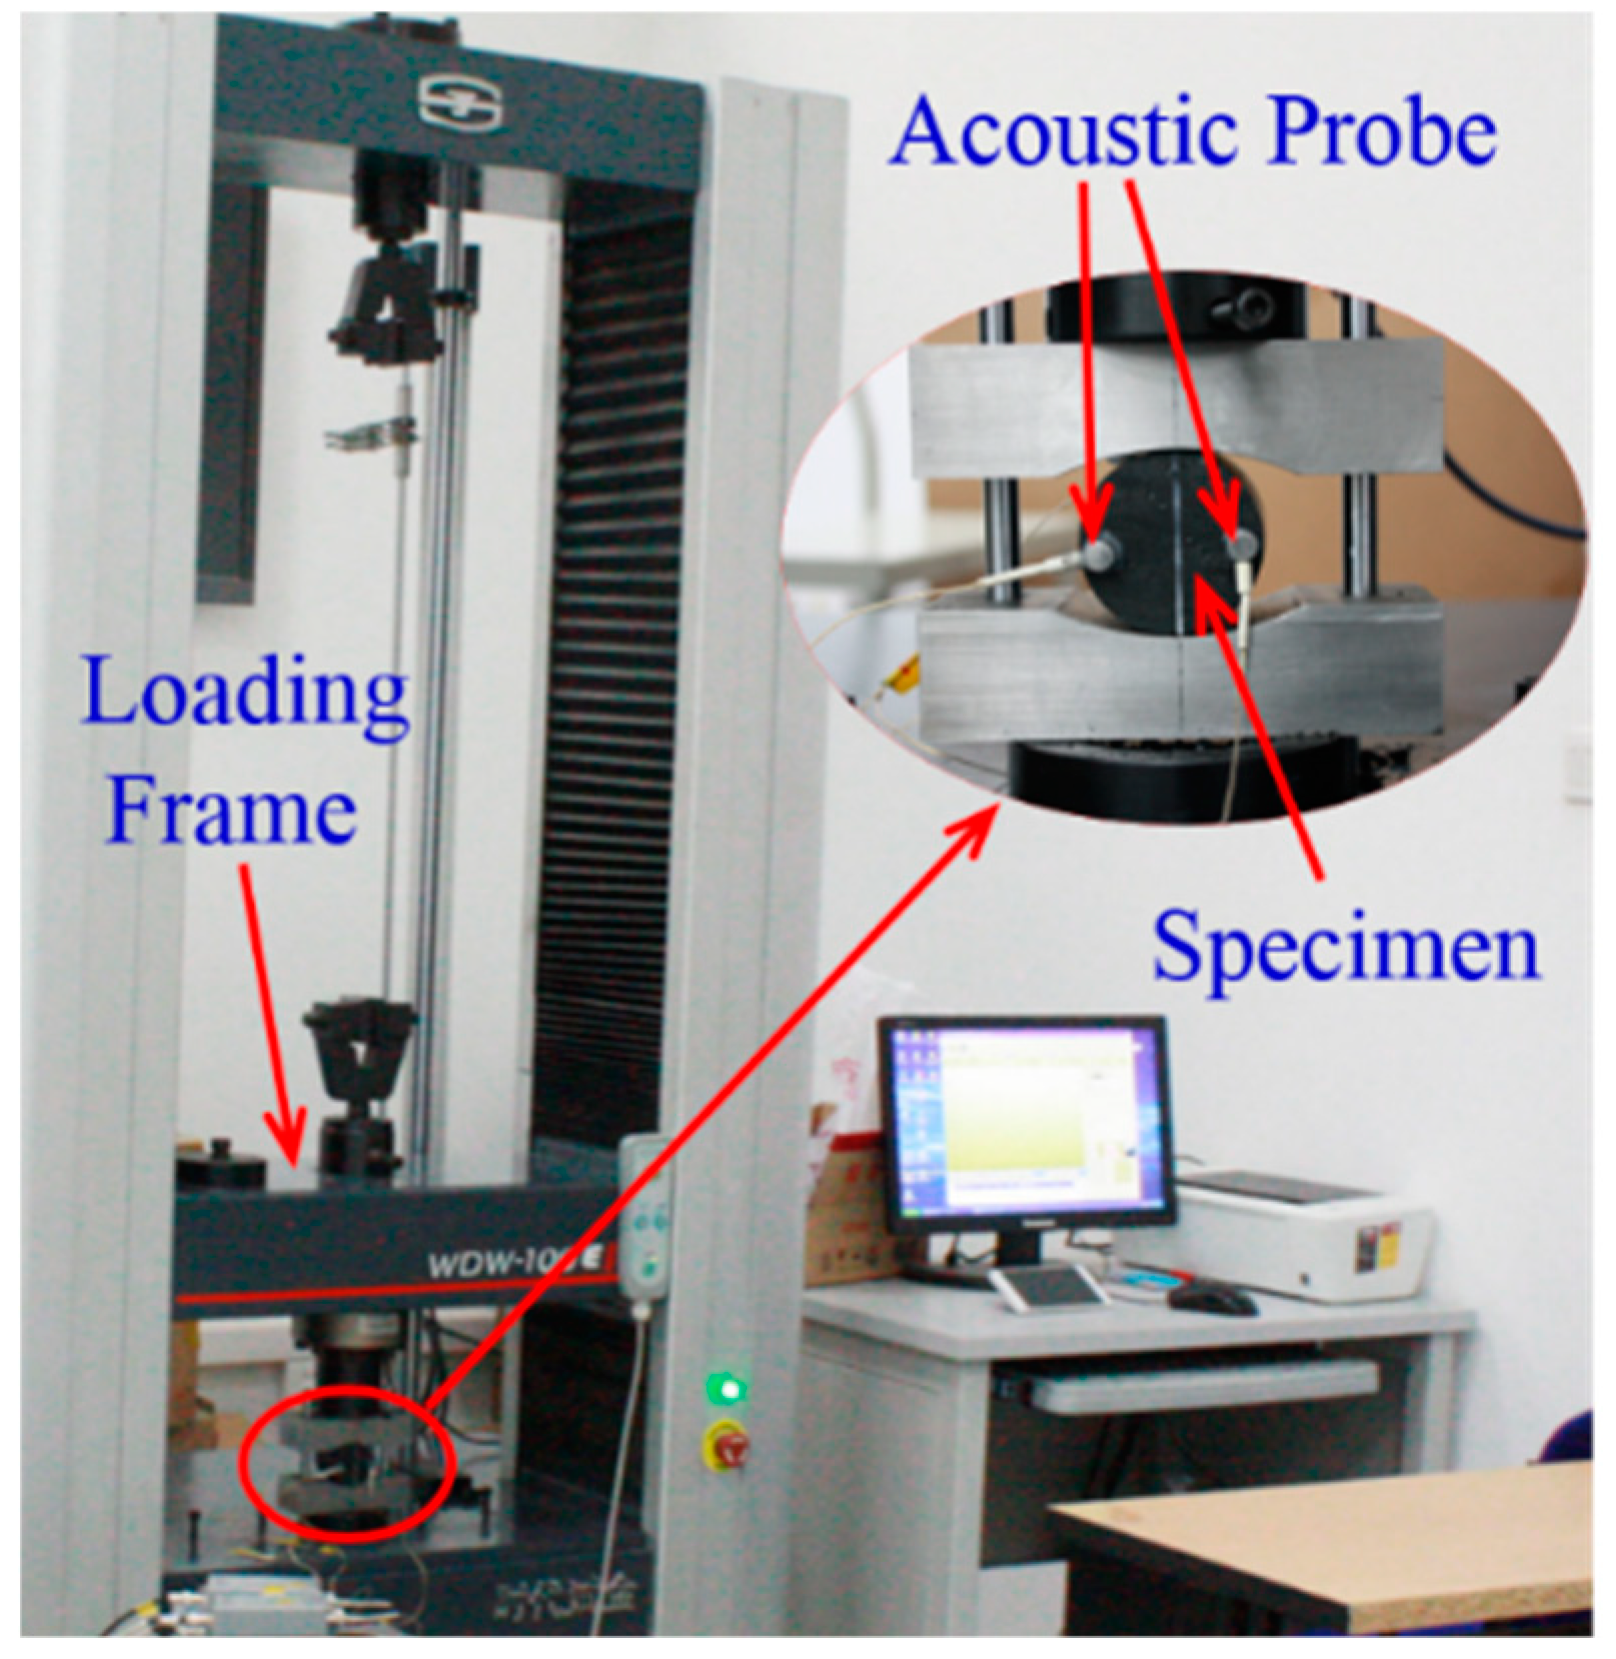
Brazilian splitting tests and AE monitoring were simultaneously implemented to acquire the damage evolution failure values of coal specimens with different sizes and water contents. The Brazilian splitting tests were implemented using a uniaxial unconfined load instrument with a compressive capacity of 100 kN, equipped with a displacement transducer with a precision of ±0.5%. The testing layout and positions of the AE probes on the specimen are shown in Figure 7. The tests were carried out under displacement-controlled conditions and at a loading velocity of 1 mm/min.
Meanwhile, the acoustic emission (AE) events were captured using an AE signal monitoring system (PAC, USA). This system consisted of four micro 30 S sensors, a 6-type preamplifier, and a PIC recording device. During the test, the waveform streaming mode was selected, which had a maximum signal amplitude of 100 dB.

4. Results and Discussion

The tensile strengths of specimens with different diameters and immersion times were presented and the influences of the specimen size and immersion time on the tensile strength and AE feature were discussed.

4.1. Tensile Strength Variations

In this study, the tensile strengths were calculated based on experimental data and the following Equation (1) [1]:
σ t = 2 P max π d l
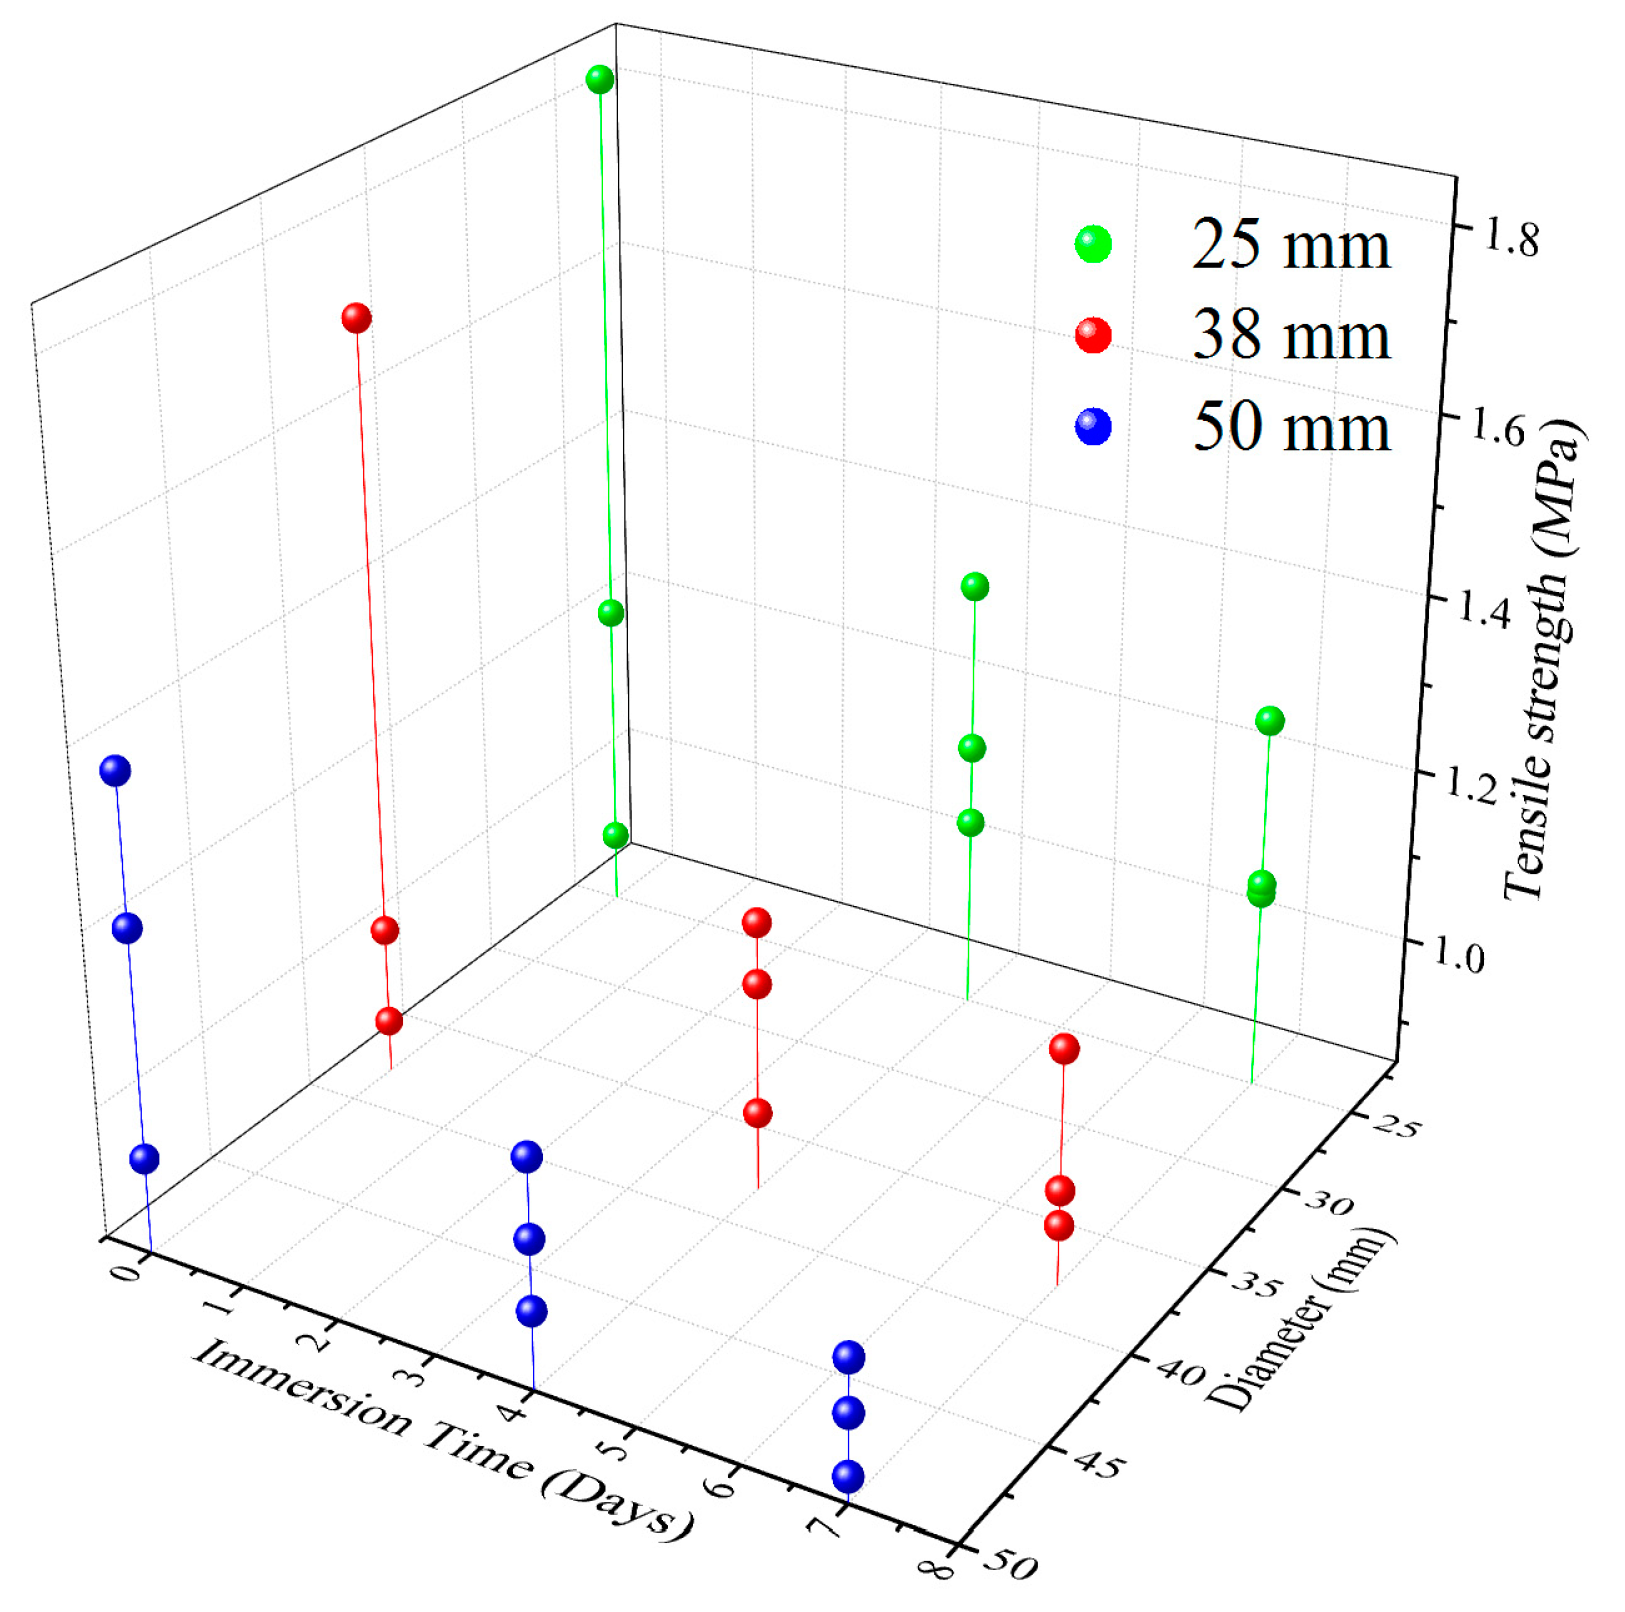
where Pmax represents the maximum load during the loading process in N; d and l are the diameter and thickness, respectively, of a disc specimen in mm; and σt is the tensile strength in MPa. The tensile strength values of specimens with different sizes and immersion times are plotted in Figure 8. The mean tensile strength values for the specimens are presented in Table 2.
The tensile strength decreased in larger specimens, which occurred to a greater extent as the immersion time increased. As the specimen diameter increased from 25 to 50 mm, the average tensile strength decreased from 1.32 to 1.19 MPa, representing a reduction of 10.07% (0.13 MPa) under dry conditions. Meanwhile, the reductions for immersion times of 4 and 7 days were greater than those under dry conditions, with values of 14.25% (0.17 MPa) and 17.68% (0.20 MPa), respectively, as shown in Table 2. This may indicate tensile strength reductions in the coal mass when compared with the lab-obtained results, with water enhancing the weakening effect caused by the specimen size on the tensile strength of the coal mass. The roles water played will be discussed in the following section.
The discreteness of the tensile strength values in this research is similar to the discreteness of the coal samples reported by Okubo [44] and Bieniawski [9]. Compared with other types of rocks, the experimental data show greater discreteness in coal, including for the tensile strength and uniaxial compressive strength values [44], due to the greater anisotropic and inhomogeneous features of the coal, which are generated by sedimentary and geological movements during coal formation.
Meanwhile, the discreteness degree of the tensile strength is also reduced as the specimen size and immersion time length increase (Figure 8), since the standard deviation (SD) decreases with the increasing specimen size and immersion time (Table 2). The reduced SD values were 0.199 (dry), 0.048 (4 days), and 0.039 MPa (7 days) for the diameters of 25, 38, and 50 mm, respectively. Similarly, the respective SD values decreased to 0.284 (25 mm), 0.268 (38 mm), and 0.124 MPa (50 mm) as the immersion time increased from 0 days to 7 days. This shows that the tensile strength differences between the various specimens decreased with the increasing specimen size and water content, the corresponding reasons for which will be discussed in the following section.
Meanwhile, specimens showed greater tensile strength losses under the coupling effect of water and the scale effect when compared with the single effect of specimen size or immersion time, as shown in Table 2. For dry specimens, the tensile strength decreased from 1.32 to 1.19 MPa, with a stress loss of 9.85% (0.13 MPa), as the diameter increased from 25 to 50 mm. By contrast, the stress loss was 28.03% (from 1.32 to 0.95 MPa) under the coupling effect of specimen size (25–38 mm) and water (0−7 days), showing an approximately three times greater effect than that of the single effect of specimen size. Thus, consideration should be given to the coupling effect of water content and specimen size in mining engineering problems in water intrusion areas.

4.2. Weakening Effects of Water Content and Specimen Size

The tensile strength variation with the specimen size can be explained by the volume and microstructure differences in the coal. Microstructures (mineral inclusions and pre-existing discontinuities) naturally occur in coal due to sedimentary and geotechnical movement during coal formation. The number of microstructures increases with the increasing specimen size [9,45]. Since the microstructures play a weakening role during the failure process [12,46], the weakening effect increases with the increasing specimen size, thereby decreasing the tensile strength in larger specimens. Meanwhile, the volume difference of microstructures is less obvious in larger specimens, since they more closely represent microstructural features of the coal mass [9], whose microstructural density is to be considered nearly constant. The mechanical difference thus decreased with the increase in the specimen size, as did the tensile strength.
Due to the tensile strength being observed to decrease with increasing immersion time length (water content), it was assumed that water primarily plays a role in the weakening of the tensile strength of coal. Based on the theoretical analysis in Section 2, here the effects of water on the tensile strength mainly appear in three forms: (a) by dissolving clay minerals and producing more interspace; (b) by softening the coal matrix; and (c) by lubricating the cracks, since the coupling effect of these events creates more internal space [41], lowering the threshold for the initiation of micro-cracks and the propagation of macro-cracks [28], therefore decreasing the tensile strength as the immersion time elapses.
In addition, water enhances the scale effect on the tensile strength of coal. This may be attributed to the weakening influence of water on the pre-existing discontinuities and mineral inclusions, as described in Section 2. Compared with smaller coal specimens, the larger ones have a greater volume of pre-existing discontinuities and mineral inclusions (clayey minerals), resulting in greater amounts of interspace and lubricated cracks. In combination with the softened coal matrix, the larger coal specimens are easily damaged and experience greater reductions in tensile strength than the smaller ones.

4.3. AE Variations with Specimen Size and Water Content

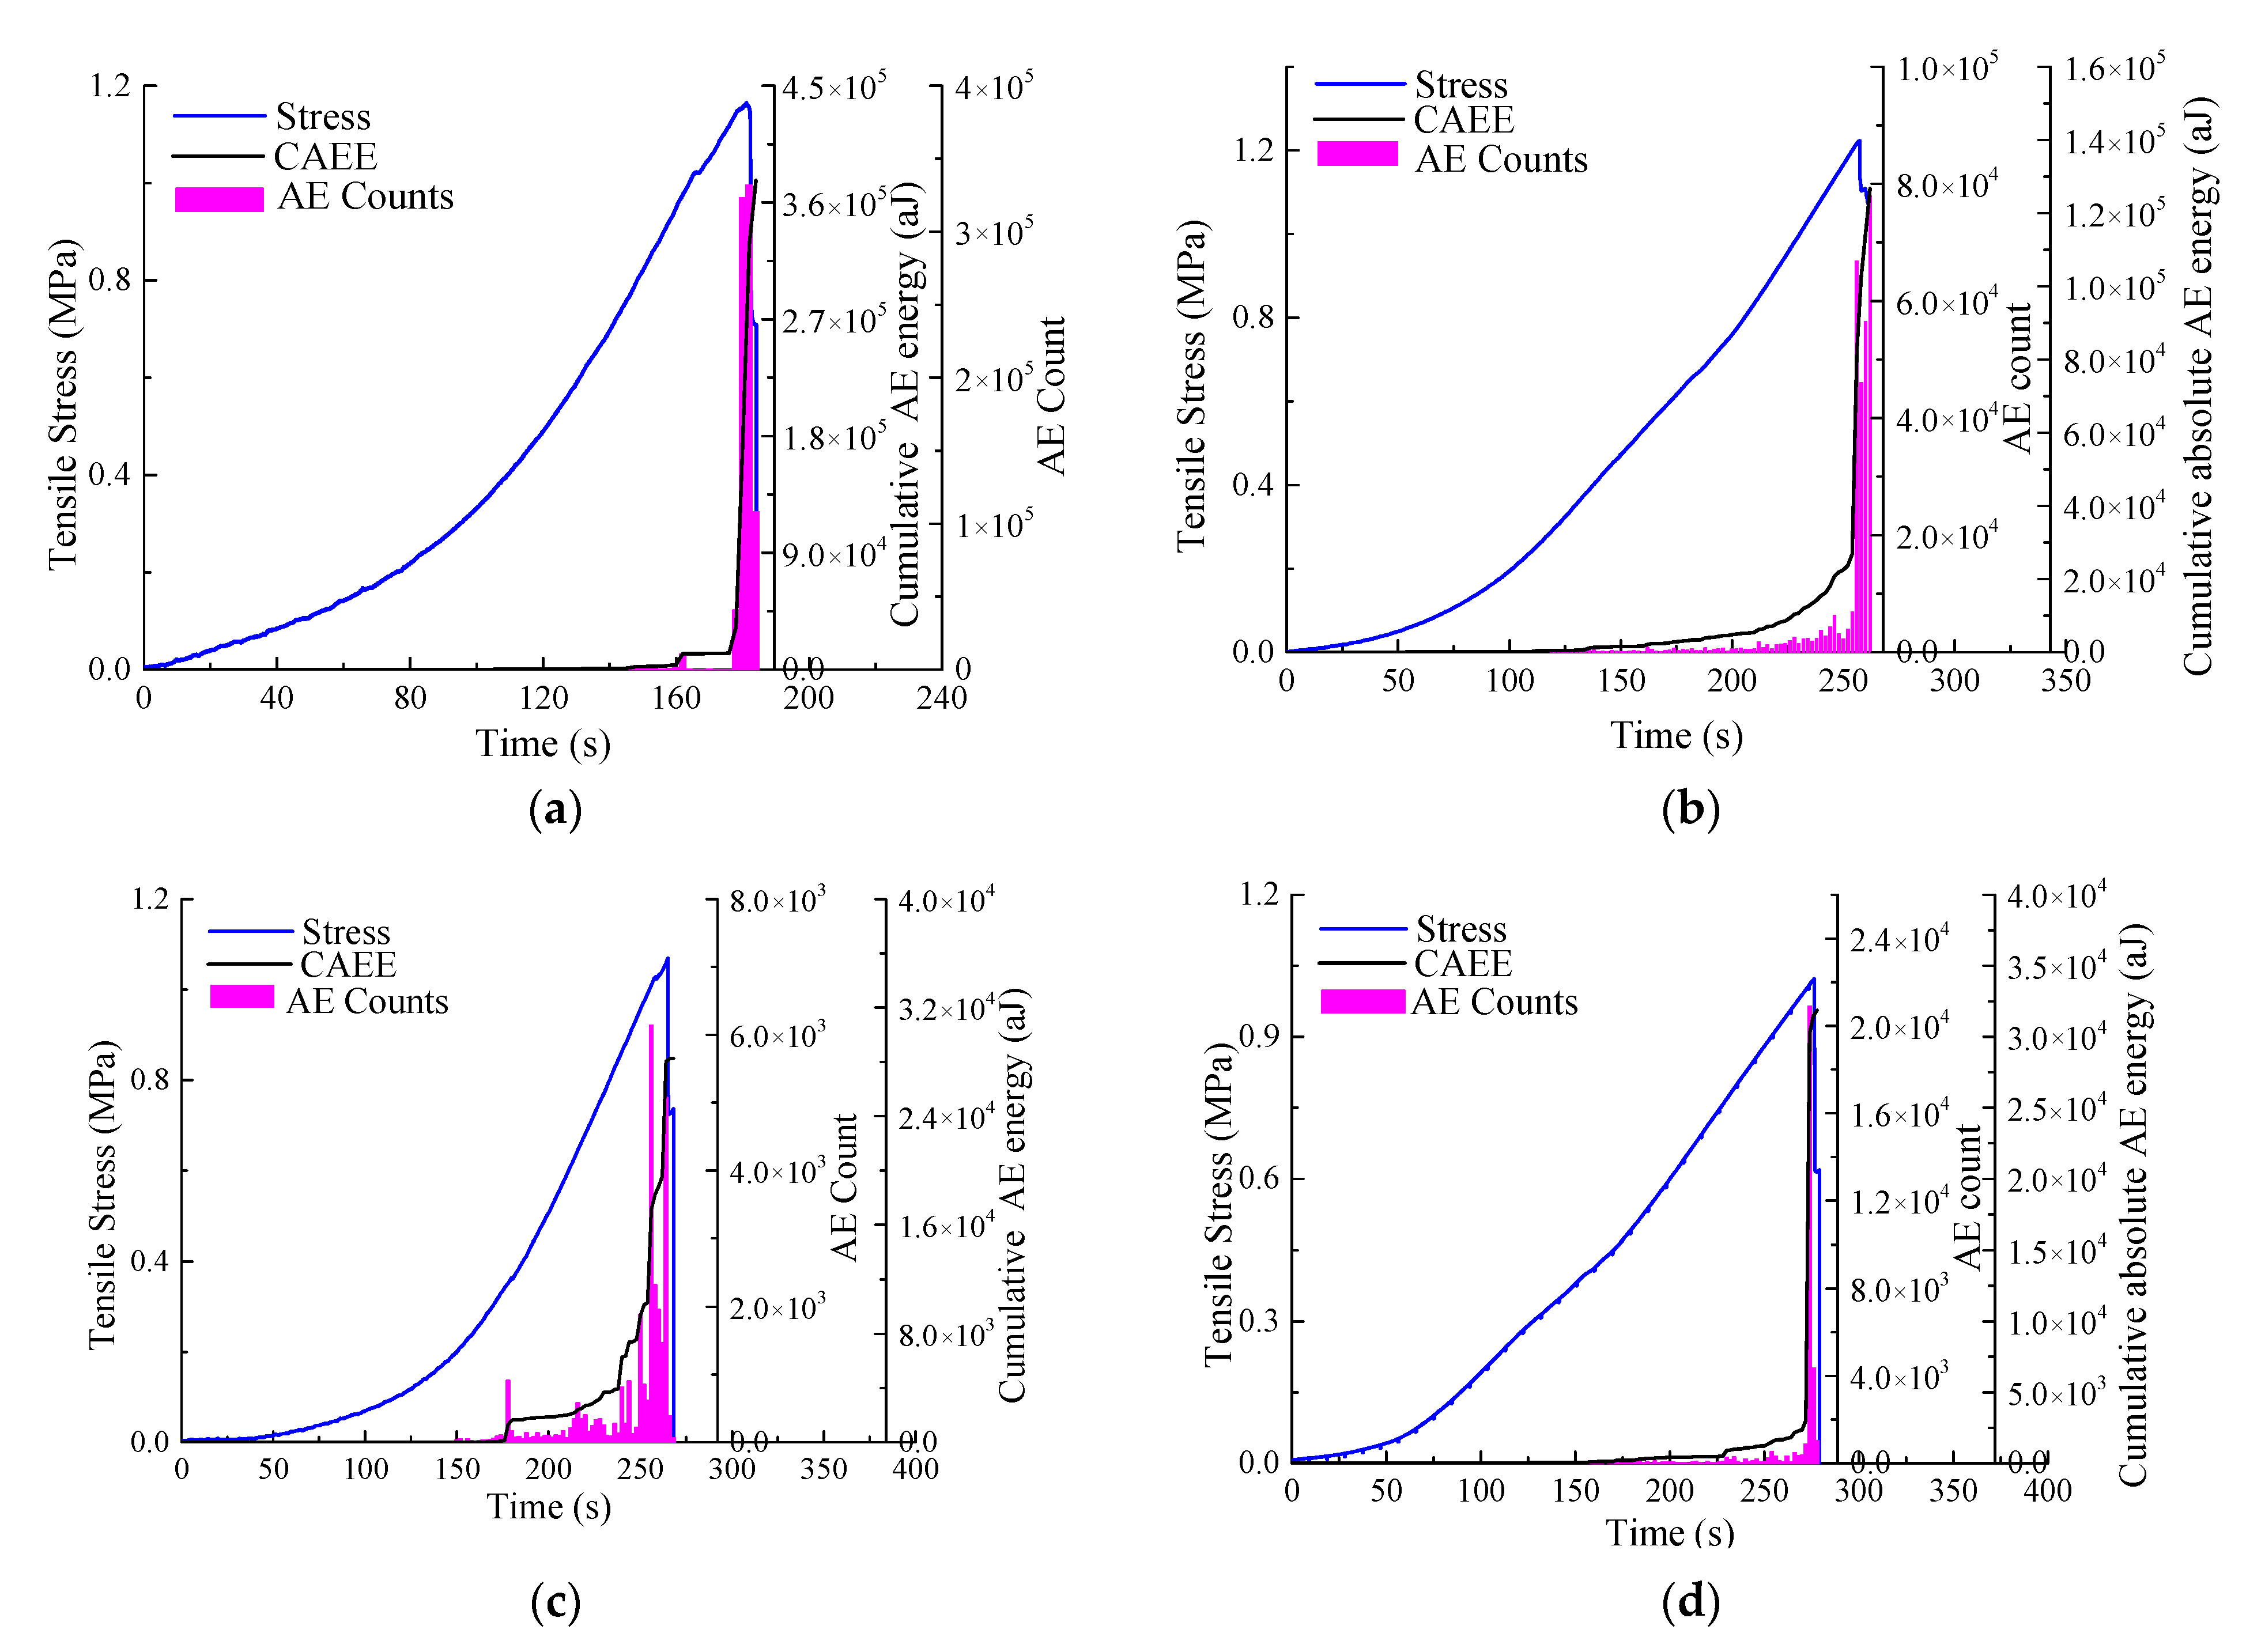
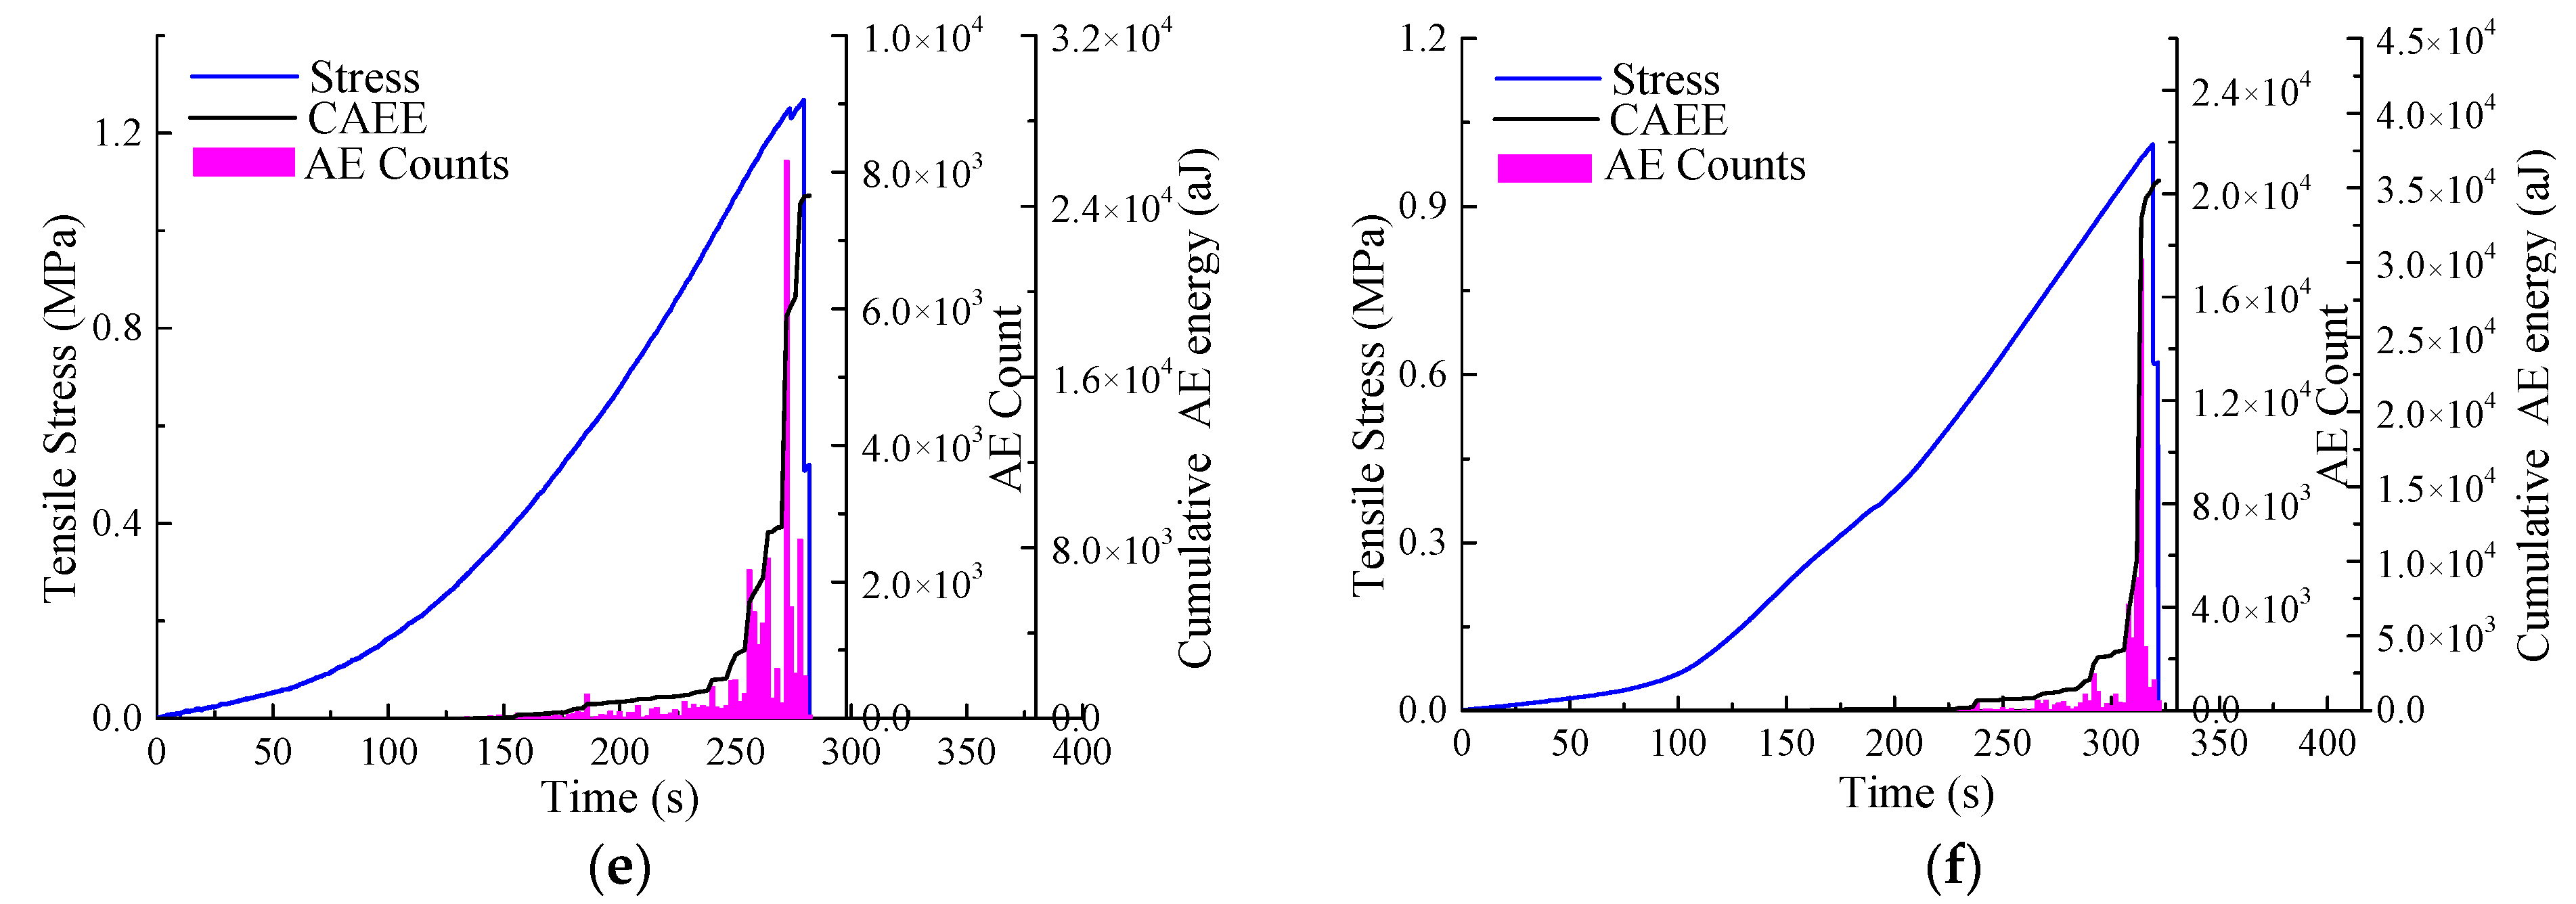
AE activities are generated by the initiation, propagation, and coalescence of cracks in rock-like materials [36,47,48]. Here, the AE technique is adopted to investigate the effects of specimen size and water on the tensile failure of coal. The AE features of specimens with different sizes and immersion times are summarized in Figure 9.
The cumulative AE counts (CAEC) and cumulative absolute AE energy (CAEE) values increased with the coal specimen size. As the diameter increased from 25 to 50 mm, the CAEC values increased to 0.47 × 10⁵ (dry), 0.44 × 10⁵ (4 days), and 0.20 × 10⁵ (7 days). Correspondingly, the respective CAEE increments were 0.86 × 10⁵ aJ (dry), 0.51 × 10⁵ aJ (4 days), and 0.52 × 10⁵ aJ (7 days), as summarized in Table 3. Similar to the AE features observed under uniaxial compressive conditions [45], this variation can also be ascribed to two reasons: (a) greater occurrence of pre-existing discontinuities and cracks in larger specimens during the failure process; (b) the increased loading time length as the immersion time elapses, as shown in Figure 9, which generates a greater amount of AE events, extends the AE monitoring time length, and resuls in more AE activities and energy values being captured and recorded.
The cumulative AE counts and absolute AE energy values showed an overall descending trend with the increasing immersion time (water content), although a minimal increase was observed as the immersion time increased from 4 to 7 days, as summarized in Table 3. The respective cumulative AE counts declined to values of 0.98 × 10⁵ (25 mm), 1.18 × 10⁵ (38 mm), and 1.25 × 10⁵ (50 mm); the cumulative absolute AE energy values separately decreased to values of 0.20 × 10⁵ (25 mm), 0.48 × 10⁵ (38 mm), and 0.54 × 10⁵ aJ (50 mm), under dry conditions, 4 days of immersion, and 7 days of immersion, respectively. This indicates a reduction in fracture activities during the loading process under the influence of water, which may have been caused by the water-related softening effect on the coal matrix [49] and lubrication of the cracks [28], since these activities enhanced the deformability of the coal matrix and reduced the amount of minimal cracks generated during the tensile failure of coal. Meanwhile, the reduction in AE activities as the water intruded into the coal specimens also explained the weakening micro-seismic activities as the water was injected into the coal or rock masses, since water played similar roles in both the coal specimens and coal mass.

4.4. Failure Pattern Variations Due to Specimen Size and Water Content

The fracture patterns for coal and rocks can be detected and calculated using the AE parameters during the failure process [50,51,52]. The corresponding failure type classification approach was introduced in conjunction with the following equations:
N RA = t r a m
N AF = n t D
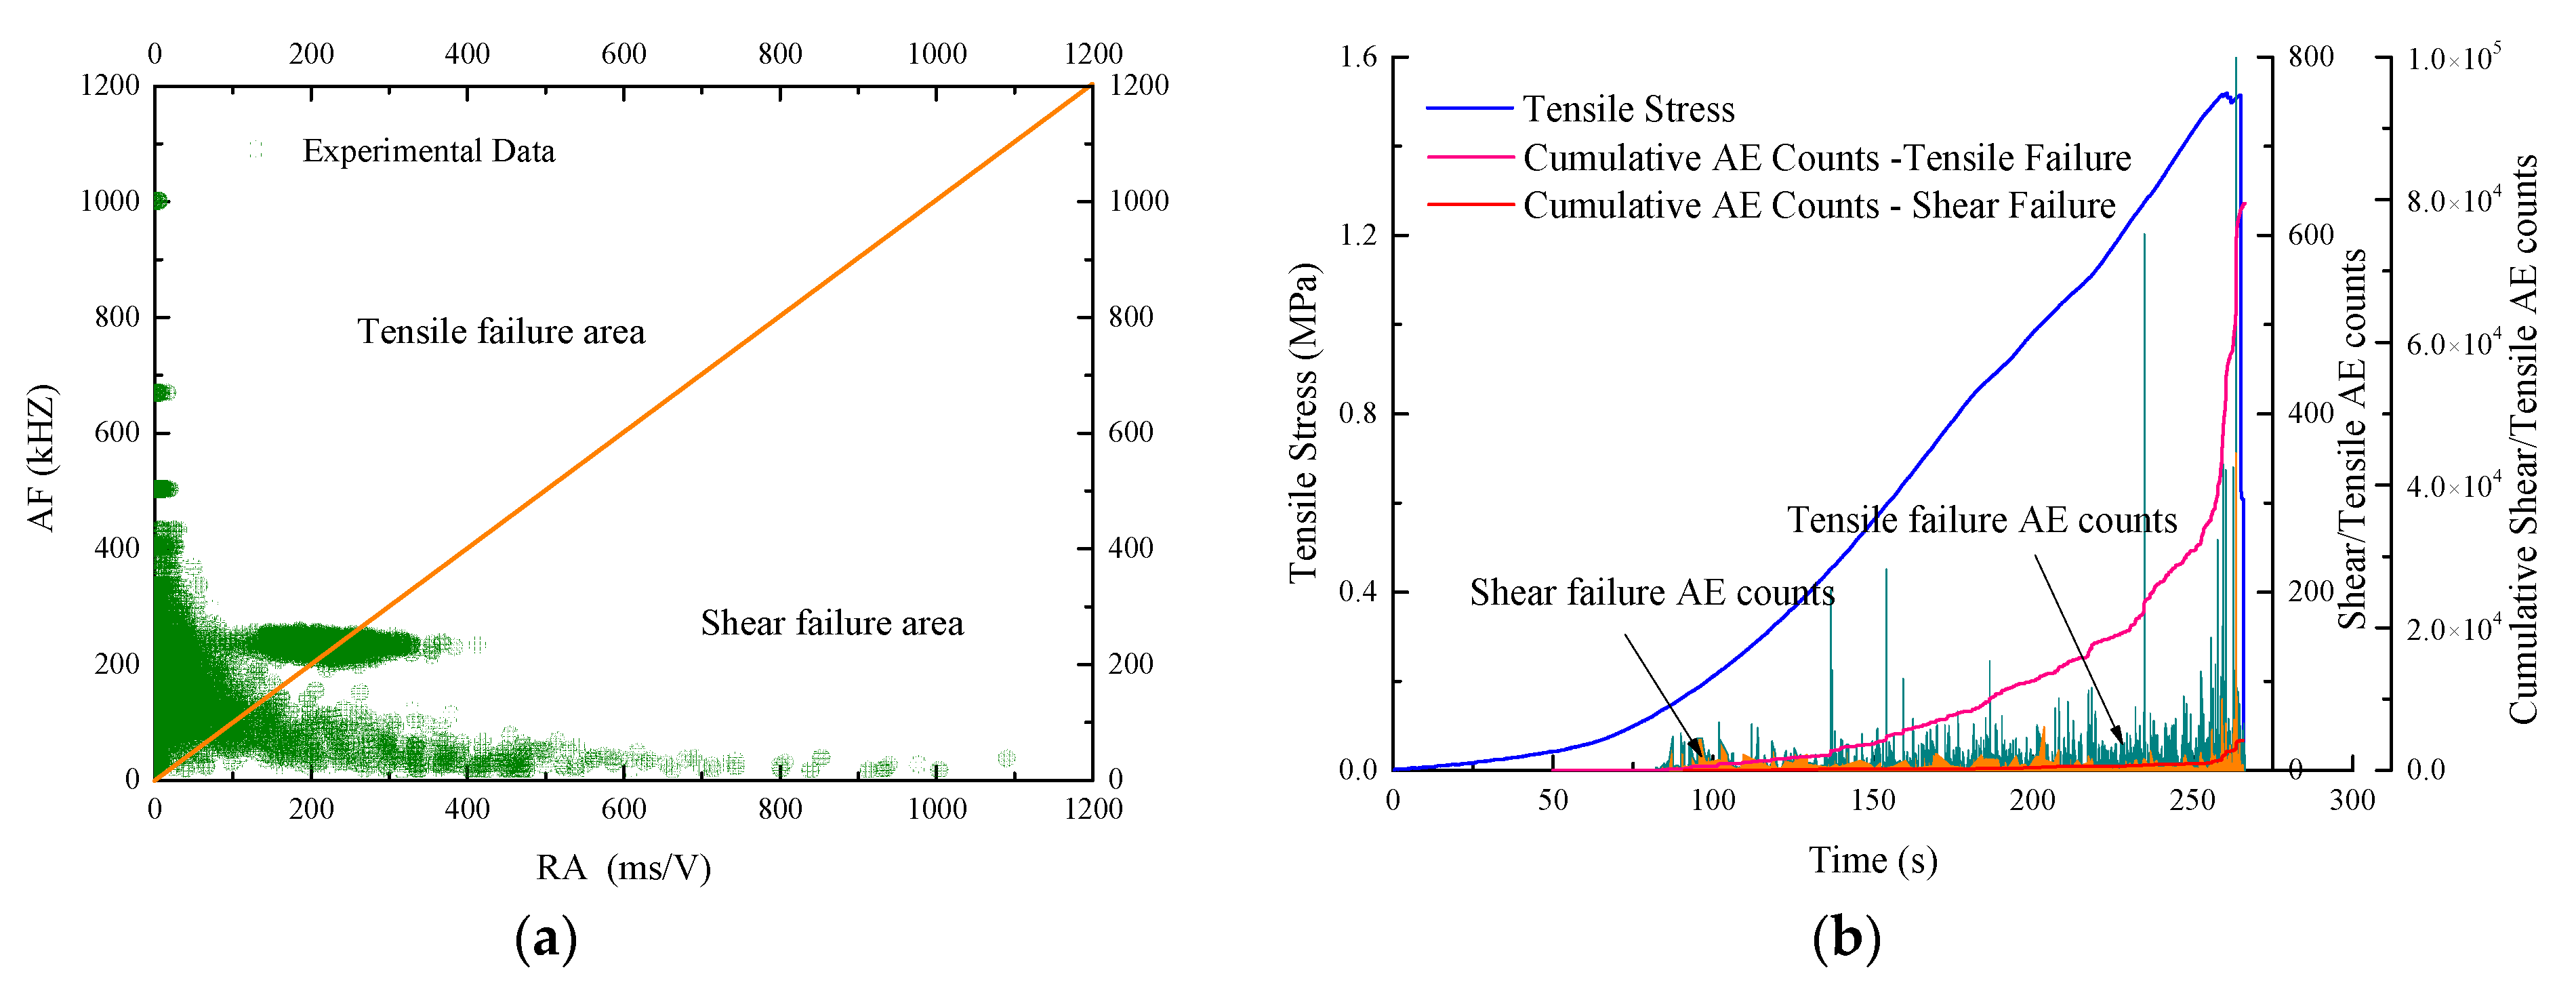
where NRA is the RA (ratio of the rise time and the maximum amplitude) value, tr and am denote the raising time (ms) and the maximum amplitude (V), NAF is the AF (average frequency) value, and n and tD, respectively, denote the numbers of AE counts for different durations (ms). Based on the AE parameters monitored during the tensile loading process, the typical failure patterns revealed by RA and AF in this research are shown in Figure 10a,b, indicating that the tensile failure was obviously greater than the shear failure during the Brazil split test.
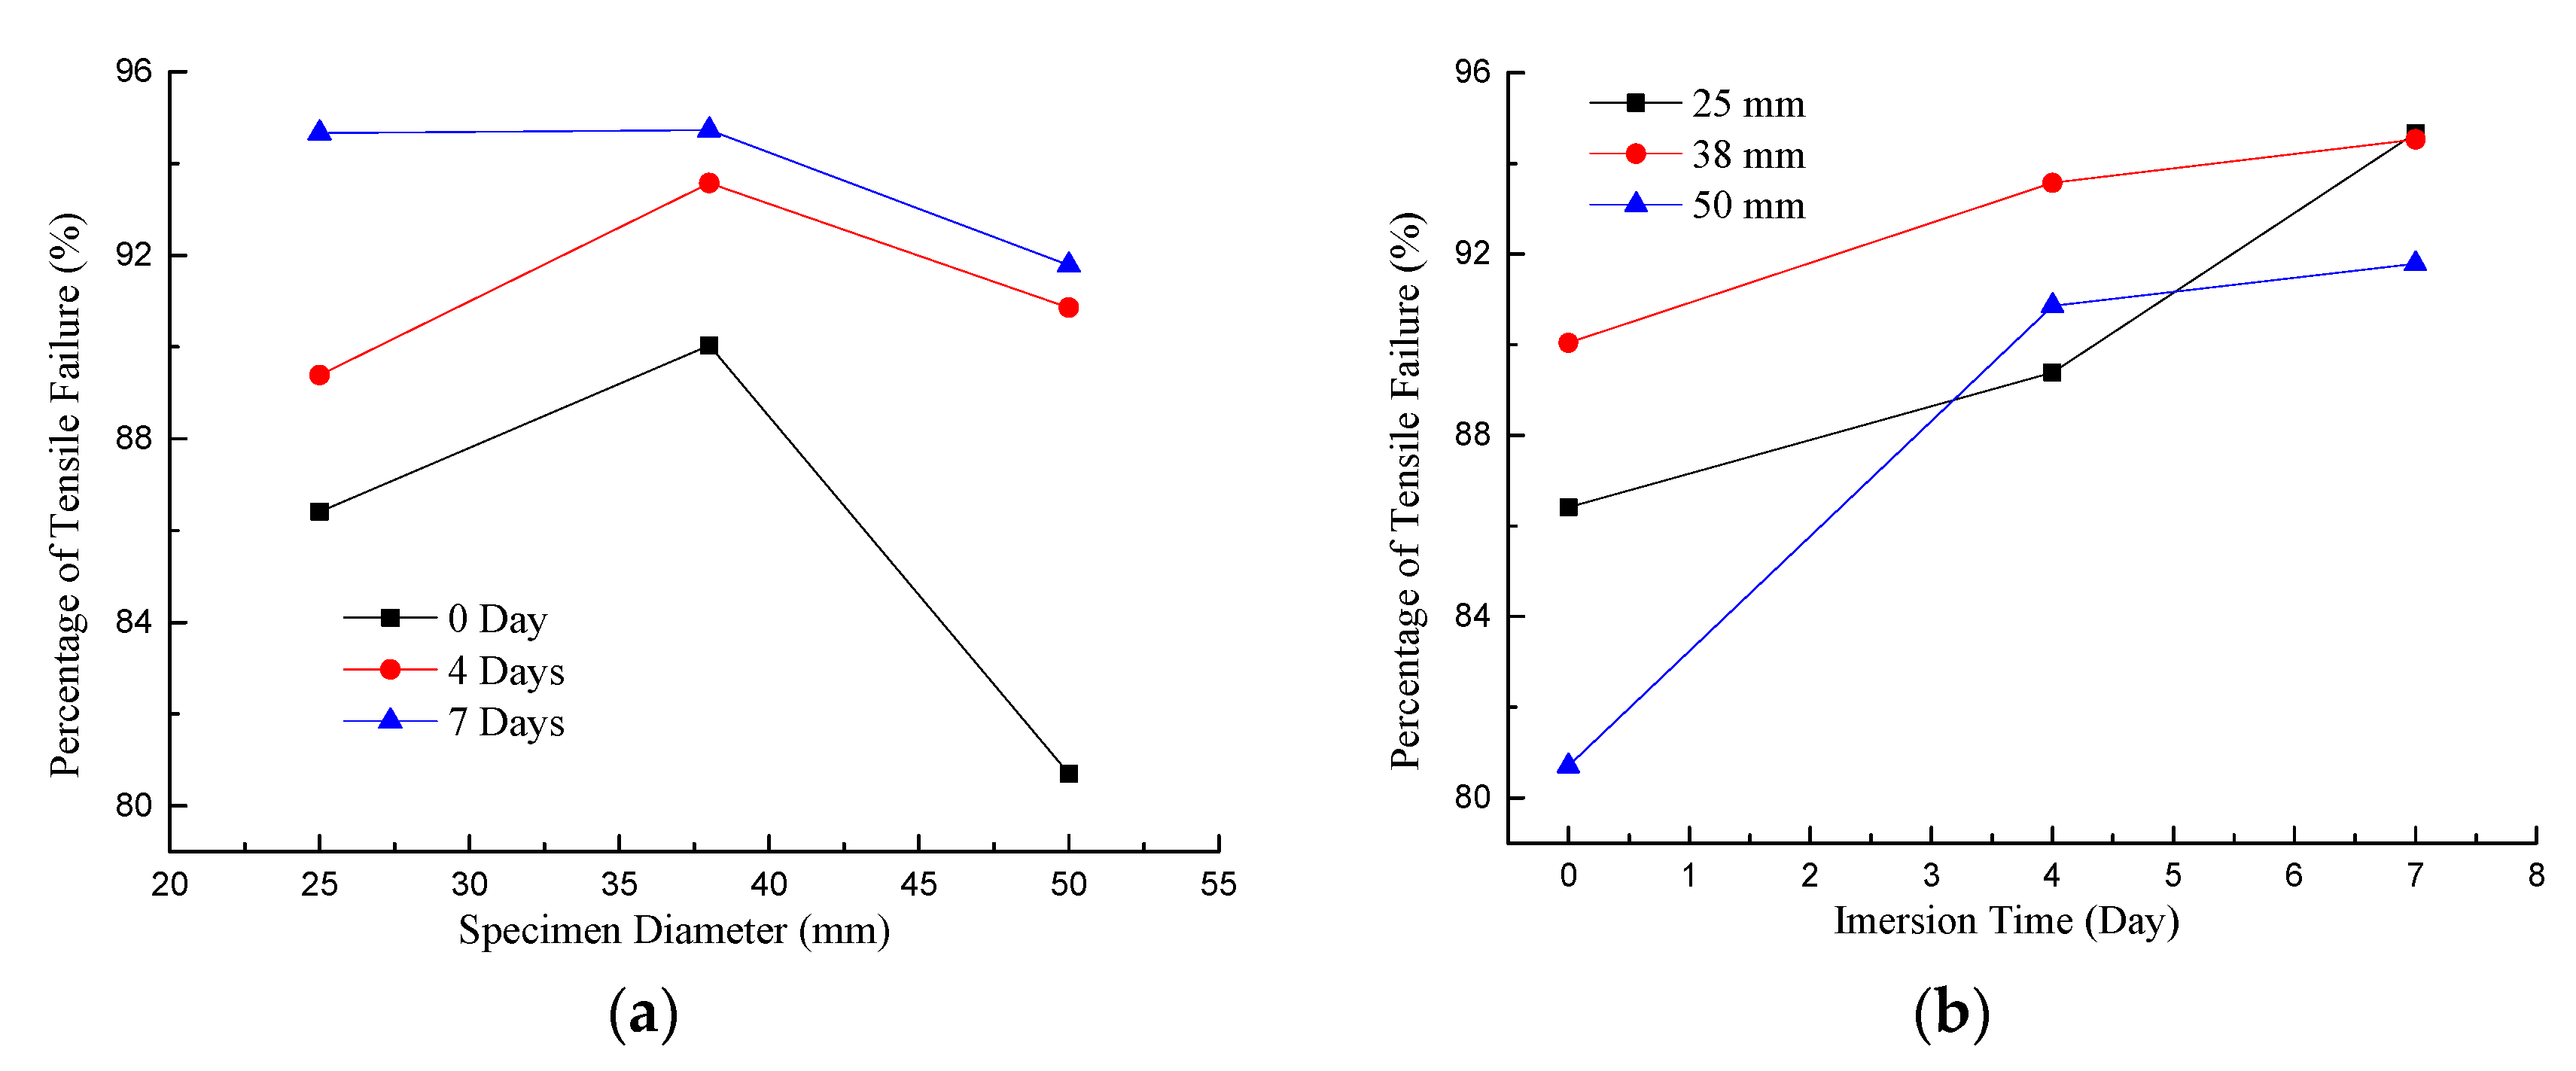
Meanwhile, the failure pattern variations with the specimen size and immersion time were calculated based on Equations (2) and (3), and are summarized and shown in Figure 11a,b. The percentage of tensile failure was calculated by the ratio of tensile failure AE counts and the sum of AE counts. Apparently, the tensile failure AE counts increased in the specimen range of 25–38 mm, with increments of 3.63% (from 86.41% to 90.04%), 4.18% (from 89.39% to 93.57%), and 0.06% (from 94.67 to 94.73%) under immersion times of 0, 4, and 7 days, as shown in Figure 11a. The tensile failure AE counts decreased in the range of 38–50 mm, with respective reductions of 9.34%, 2.71%, and 2.94% with immersion times of 0, 4, and 7 days. The tensile feature fracture variation with the specimen size was consistent with the conclusion that rock failure changed from pure tension to a combination of shearing and tension as the specimen size exceeded 38 mm, as reported by Masoumi [5], indicating that the optimal specimen size could be determined by measuring the tensile strength of coal using the Brazil split test, as greater tensile failure was observed in this specific specimen size, which may mean that the lower measurement errors and greater variable accuracy described by Quosay [53,54] could be obtained.
Meanwhile, the proportion of tensile failure also increased with the immersion time. In specimens with diameters of 25, 38, and 50 mm, the increments were 8.26%, 4.68%, and 11.08%, respectively. This trend is more obvious in specimens with smaller percentages of tensile failure (at a diameter of 50 mm). This represents an enhancement effect of water on the tensile failure generated during the tensile loading process, which may be caused by the water-related softening effect on the coal matrix and lubrication of the cracks, since these processes improved the deformation capability of the coal matrix, reduced the development and coalescence of pre-existing cracks, and thereby reduced the shear failure caused by them. This also explained the decreasing tensile strength with increasing immersion time length, since more tensile failures were observed in specimens with longer immersion times.

4.5. Fractal Characteristic Variations Due to Specimen Size and Water Content

Fractal theory has been broadly used in describing AE feature variations in brittle materials to evaluate the evolution of damages to coal and rock [55,56,57]. Therefore, the time-sequence-related fractal dimension was chosen to analyze the AE feature differences during the tensile loading process and investigate the effects of water and specimen size on the tensile strength of coal.
The time-sequence-related fractal dimension is actually a correlation dimension, which was developed based on the methodology proposed by Grassberger and Procaccia [58], and then developed in different forms according to various research purposes [59]. For a certain time-sequence with AE records of N and time interval Δt, the suitable m-dimension time phase space with (Nm+1) vectors can be established with a proper time interval mΔt, represented in the form of q = q 1 , q 2 , , q N m + 1 . Based on the correlation theory, in the constructed m-dimensional phase space, the percentage of vector pairs (q1, q2) with length differences lower than the given Δl has a positive correlation relationship, shown as:
P ( Δ l ) ( Δ l ) D
where D is the fractal dimension, Pl) is the correlation integral that represents the percentage of vector pairs with length differences of less than Δl, which can be expressed as:
P ( Δ d ) = 1 ( N m ) ( N m + 1 ) i , j = 1 i , j = N m + 1 F ( Δ l | | q i q j | | ) ,   ( i j )
where F is the Heaviside function, F takes 1 if Δ l | | q i q j | | 0 , and otherwise the F value is 0 for the given Δl, which is usually chosen as
Δ l = k L ,   L = 1 ( N m ) ( N m + 1 ) i , j = 1 i , j = N m + 1 | | q i q j | | ,   ( i j )
where k is a time-series-dependent constant. The fractal dimension, is, thus obtained by:
D = lim ln P ( Δ l ) ln ( Δ l )
After numerous tests using MATLAB (R2018b, MathWorks, Natick, MA USA), the value of m and the time intervals were respectively selected as 5 and 1 s, while the number series of 0.001, 0.002, …, 0.01 was chosen for the k values. The fractal dimension values for specimens with different sizes and immersion times were obtained and are summarized in Table 4.
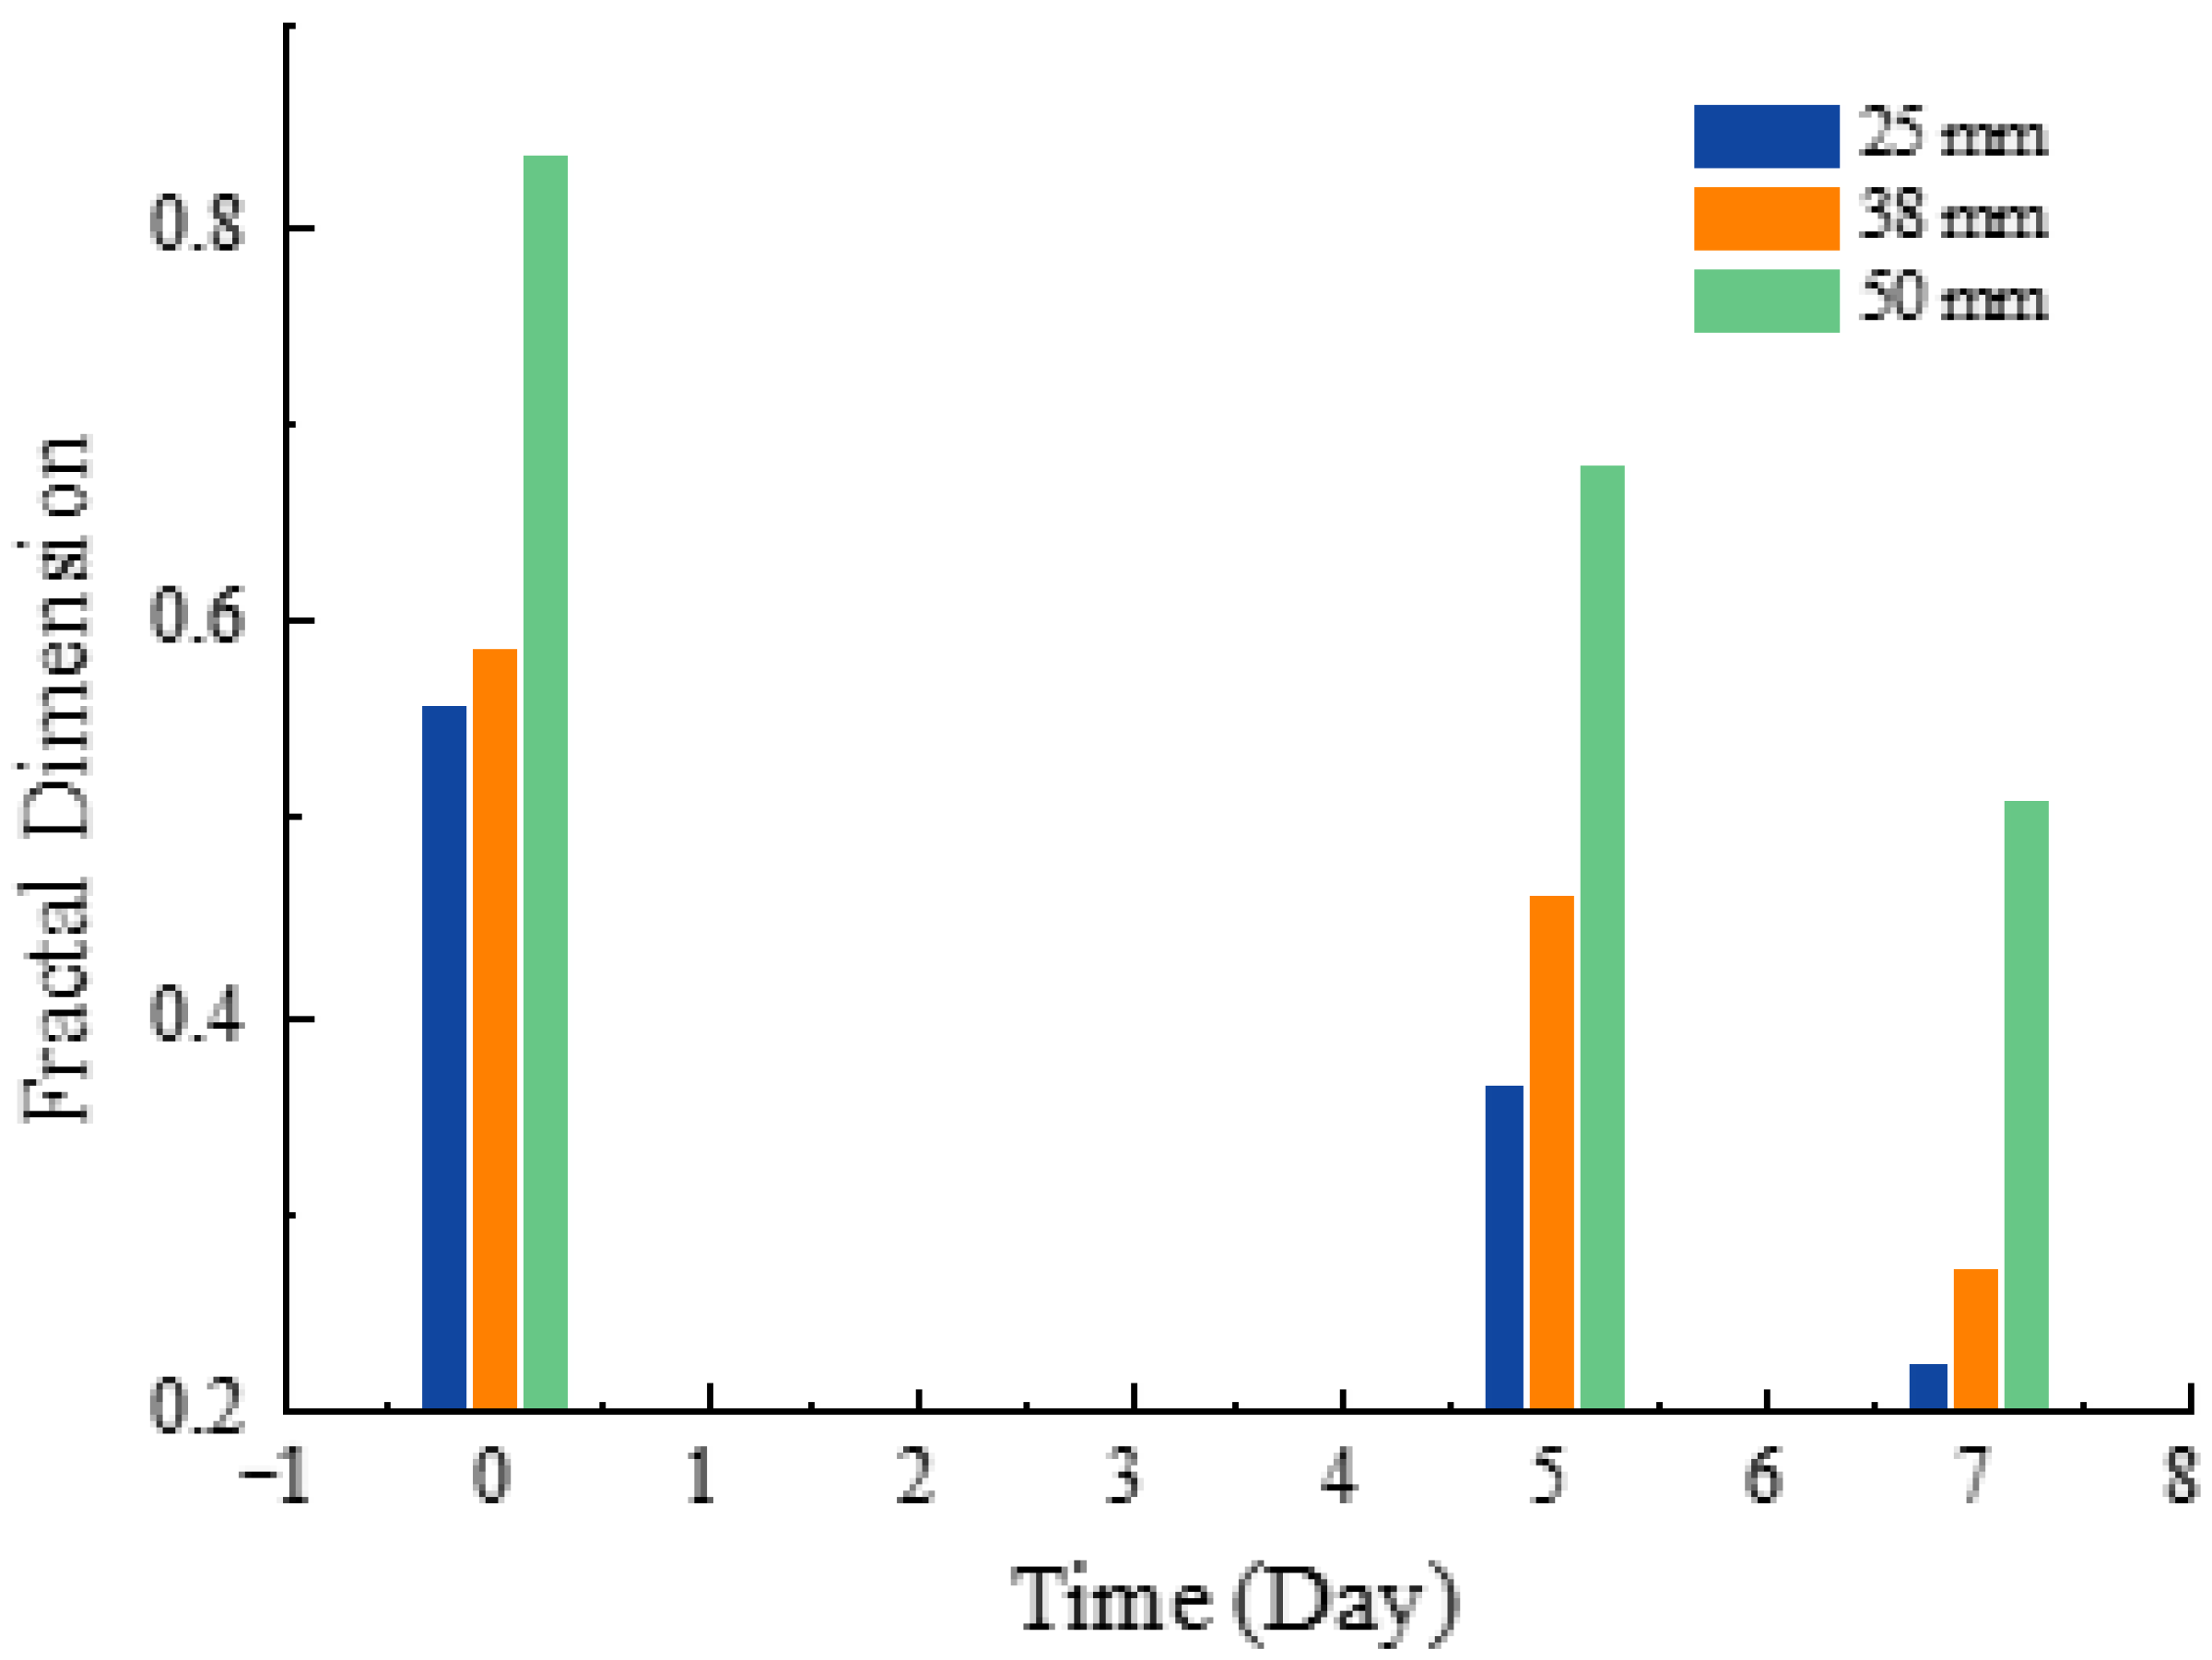
The fractal dimensions decrease as the immersion time elapses. As the time length changes from 0 to 7 days, the average fractal dimension value decreases to 0.32 (58.18%) for the specimen with the diameter of 25 mm, 0.27 (46.55%) for that measuring 38 mm, and 0.32 (38.55%) for that measuring 50 mm, as shown in Figure 12. Based on Equations (4)–(7), the greater fractal dimension value indicates the presence of more vector pairs at a distance greater than the given length.
Based on the distribution features of AE events in time series, this variation of the fractal dimension values with the immersion time indicates that larger proportions of AE events occurred before the peak stress and contributed to a lower intensity of AE activities during the loading process. Since the AE activities are generated by the fracture activities [36], as discussed in Section 4.3, this also verifies the presence of water lubrication in pre-existing discontinuities and the softening effect on the coal matrix. These effects reduced the number of AE counts generated, since the fracture activities of pre-existing discontinuities occurred before the progressive failure stage, meaning the density of the AE counts around the peak strength period was relatively greater than in dry specimens.
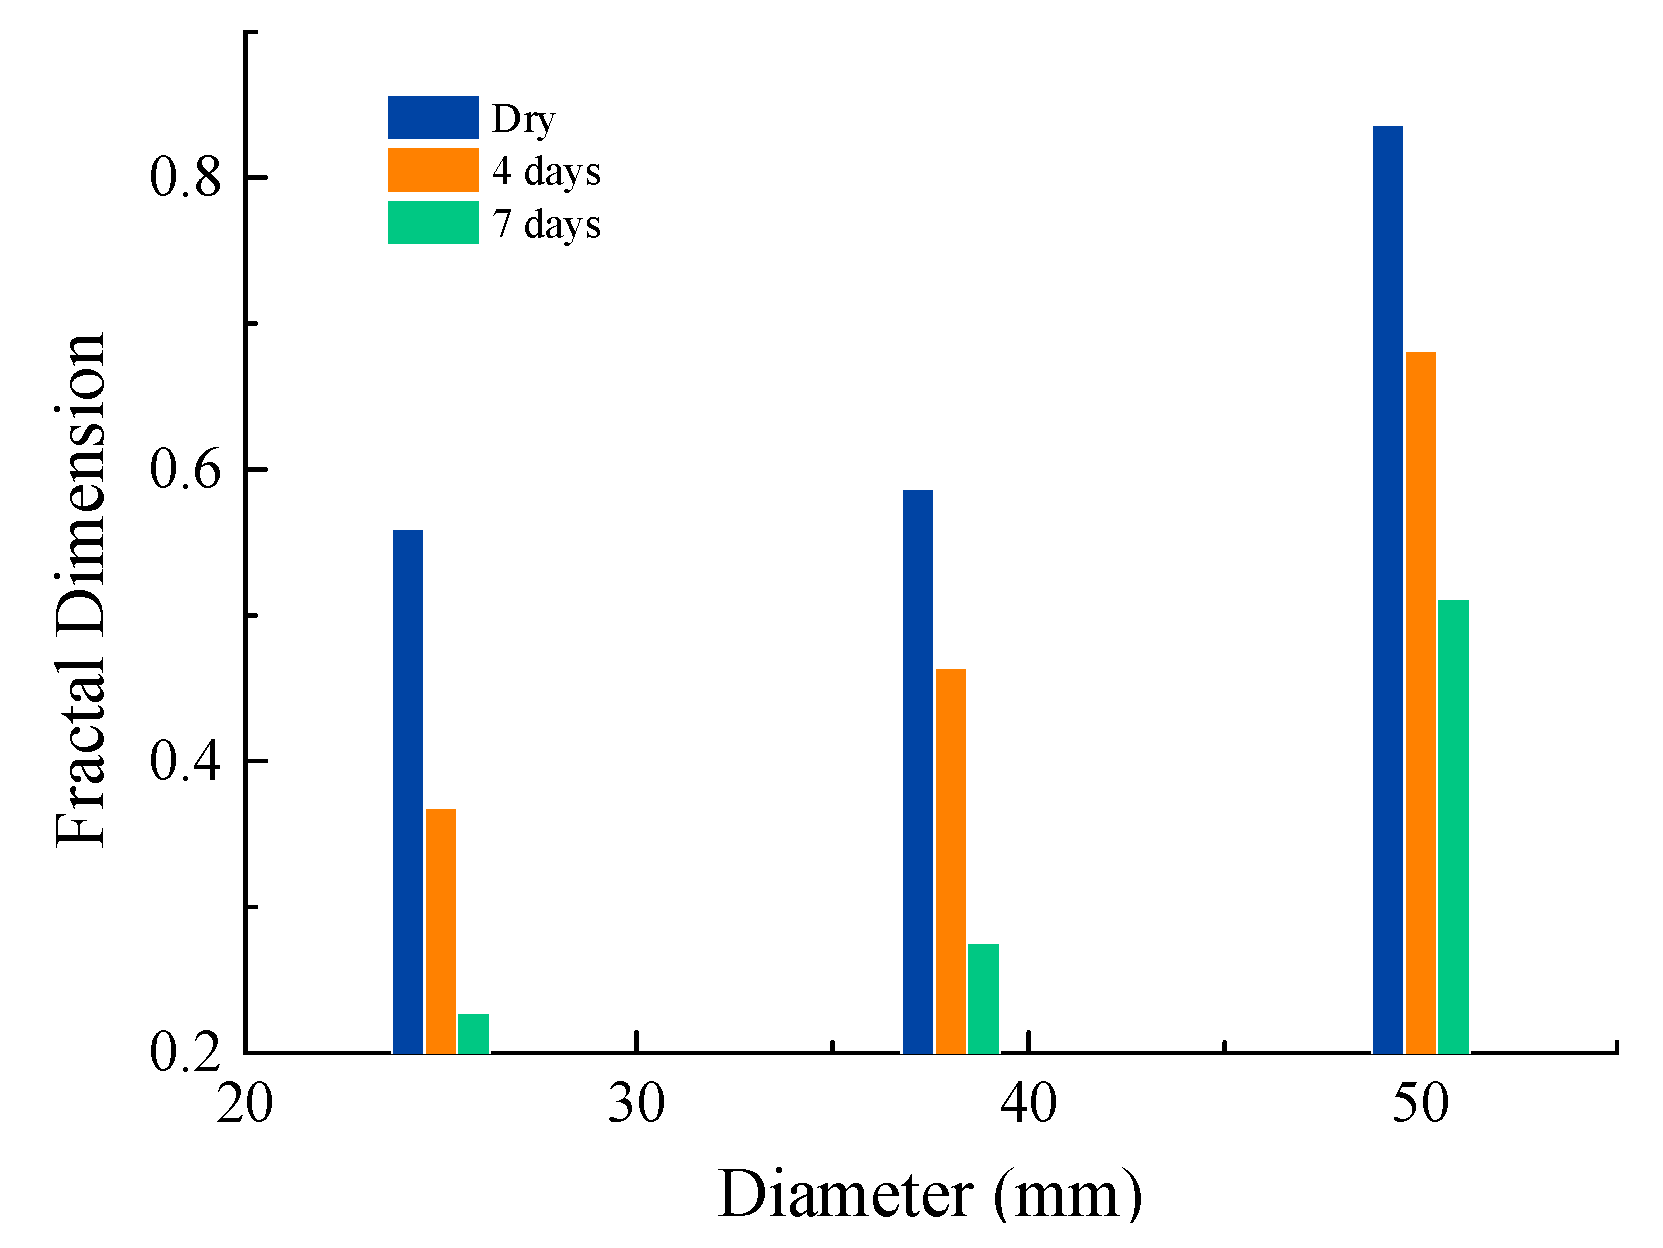
On the contrary, the fractal dimension values increased with the specimen size, as shown in Figure 13. As the diameter increased from 25 to 50 mm, the fractal dimension increments were 0.28 (dry), 0.31 (4 days), and 0.28 (7 days), as summarized in Table 4, differing from the time-related fractal dimension results under uniaxial compressive loading conditions [59]. This shows that relatively less AE activity occurred around the peak stress period in larger specimens and greater amounts of AE activities were generated before the progressive failure process (Figure 9). This variation also proves that more fractures developed before the progressive failure, since more pre-existing discontinuities existed in the larger specimen, which could have easily coalesced to generate more AE counts before the progressive failure stage.

4.6. Correlations between Specimen Size and Tensile Strength in Coal

The obtained model describing the strength variations due to specimen size will be significant for coal mass strength estimation and fieldwork. Since the scale effects on the tensile and uniaxial compressive strength share a similar predisposing factor, the scale effect characteristics based on the uniaxial compressive strength can also be further extended to the tensile strength.
For practical use, formulas with analog properties were chosen to obtain suitable models for the tensile strength. Based on the experimental data in Table 2, in combination with the previously proposed theoretical analysis of the scale effect [45], a new equation was developed after numerous attempts and is presented in the following form:
τ = A + B e k d
where τ represents the tensile strength in MPa; A and B are a material- and water-content-related constant; d is the diameter of the cylinder specimen in mm; and k is a material- and water-content-related constant. The regression analysis curve is shown in Figure 14, which was based on the experimental data summarized in Table 2.
Obviously, Equation (8) is applicable in describing the tensile strength variations with different specimen diameters under different immersion time length conditions. The fitting curves in Figure 14 show good agreement with the experimental data. The correlation coefficients (R2) in Table 5 are greater than 0.95. Meanwhile, Equation (8) also mathematically indicates that the water weakening effect increases with the immersion time, since the constant k decreases with the immersion time (Table 5).

5. Conclusions

Based on the theoretical analysis and experimental work, the effects of the specimen size and water content on the tensile strength were investigated. The roles played by water during the tensile failure of coal were also studied, and the following conclusions were obtained:
(1)
The tensile strength decreases in larger specimens, while the tensile strength variations due to specimen diameter differences can be described by an exponential correlation function, although the immersion times are different;
(2)
Water strengthens the scale effect on the tensile strength in coal. Greater reductions in tensile strength occur due to the mutual effects of water and specimen size under the discrete effects of each factor. The water content decreases in larger specimens with the same amount of immersion time;
(3)
The cumulative AE counts and absolute AE energy values increased in larger specimens, while these values decreased as the immersion time length increased. Similar behavior was also observed in the fractal dimension for AE activities. The concentration intensity of AE activities around the peak strength period increased as the immersion time elapsed, while relatively less obvious concentrations of AE events in larger specimens were observed;
(4)
The percentage of tensile failure AE activities increased in the specimen diameter range of 25–38 mm, while the percentage decreased in the range of 38–50 mm. The proportion of tensile failures increased as the immersion time increased. Water was considered to play significant roles in dissolving clay minerals, softening the coal matrix, and lubricating cracks during the tensile failure of coal in the specimen diameter range of 25–50 mm.
This work provides the ability to extrapolate lab-obtained tensile strength and AE features to fieldwork to allow the tensile strength estimation of coal mass samples and for coal bump prevention in water intrusion areas.

Author Contributions

Conceptualization, H.S. and Y.Z.; methodology, H.S. and Y.Z.; software, H.S.; validation, H.S., Y.Z., Y.J. and W.D.; formal analysis, H.S.; investigation, H.S.; resources, Y.Z.; data curation, H.S. and W.D.; writing—original draft preparation, H.S.; writing—review and editing, H.S.; visualization, H.S.; supervision, Y.J.; funding acquisition, Y.Z. and H.S. All authors have read and agreed to the published version of the manuscript.

Funding

This research was funded by [Science and Technology Department of Shandong Province and National Natural Science Foundation of China] grant number [2019SDZY02, 2019SDZY01, 52004288, 51874312, 51861145403].

Conflicts of Interest

The authors declare no conflict of interest.

References

  1. Bieniawski, Z.T.H. Suggested methods for determining tensile strength of rock materials. Int. J. Rock Mech. Min. Sci. Geomech. Abstr. 1978, 15, 99–103. [Google Scholar]
  2. Dai, F.; Xia, K. Loading Rate Dependence of Tensile Strength Anisotropy of Barre Granite. Pure Appl. Geophys. 2010, 167, 1419–1432. [Google Scholar] [CrossRef]
  3. Wong, L.N.Y.; Maruvanchery, V.; Liu, G. Water effects on rock strength and stiffness degradation. Acta Geotech. 2016, 11, 713–737. [Google Scholar] [CrossRef]
  4. Zhao, Y.; Liu, S.; Jiang, Y.; Wang, K.; Huang, Y. Dynamic Tensile Strength of Coal under Dry and Saturated Conditions. Rock Mech. Rock Eng. 2016, 49, 1709–1720. [Google Scholar] [CrossRef]
  5. Masoumi, H.; Roshan, H.; Hedayat, A.; Hagan, P.C. Scale-Size Dependency of Intact Rock under Point-Load and Indirect Tensile Brazilian Testing. Int. J. Geomech. 2018, 18, 4018006. [Google Scholar] [CrossRef]
  6. Liu, S.; Li, W.; Wang, Q. Height of the Water-Flowing Fractured Zone of the Jurassic Coal Seam in Northwestern China. Mine Water Environ. 2018, 37, 312–321. [Google Scholar] [CrossRef]
  7. Guanhua, N.; Hongchao, X.; Zhao, L.; Lingxun, Z.; Yunyun, N. Improving the permeability of coal seam with pulsating hydraulic fracturing technique: A case study in Changping coal mine, China. Process Saf. Environ. Prot. 2018, 117, 565–572. [Google Scholar] [CrossRef]
  8. Guo, H.; Yuan, L.; Cheng, Y.; Wang, K.; Xu, C.; Zhou, A.; Zang, J.; Liu, J. Effect of moisture on the desorption and unsteady-state diffusion properties of gas in low-rank coal. J. Nat. Gas Sci. Eng. 2018, 57, 45–51. [Google Scholar] [CrossRef]
  9. Bieniawski, Z.T. The effect of specimen size on compressive strength of coal. Int. J. Rock Mech. Min. Sci. Geomech. Abstr. 1968, 5, 325–335. [Google Scholar] [CrossRef]
  10. Scholtès, L.; Donzé, F.-V.; Khanal, M. Scale effects on strength of geomaterials, case study: Coal. J. Mech. Phys. Solids 2011, 59, 1131–1146. [Google Scholar] [CrossRef]
  11. Zhang, C.; Tu, S.; Bai, Q. Evaluation of Pore Size and Distribution Impacts on Uniaxial Compressive Strength of Lithophysal Rock. Arab. J. Sci. Eng. 2018, 43, 1235–1246. [Google Scholar] [CrossRef]
  12. Zhao, Y.; Liu, S.; Zhao, G.-F.; Elsworth, D.; Jiang, Y.; Han, J. Failure mechanisms in coal: Dependence on strain rate and microstructure. J. Geophys. Res. Solid Earth 2014, 119, 6924–6935. [Google Scholar] [CrossRef]
  13. Ai, D.; Zhao, Y.; Wang, Q.; Li, C. Crack propagation and dynamic properties of coal under SHPB impact loading: Experimental investigation and numerical simulation. Theor. Appl. Fract. Mech. 2020, 105, 102393. [Google Scholar] [CrossRef]
  14. Masoumi, H.; Saydam, S.; Hagan, P.C. Unified Size-Effect Law for Intact Rock. Int. J. Geomech. 2016, 16, 4015059. [Google Scholar] [CrossRef]
  15. Yu, Y.; Yin, J.; Zhong, Z. Shape effects in the Brazilian tensile strength test and a 3D FEM correction. Int. J. Rock Mech. Min. Sci. 2006, 43, 623–627. [Google Scholar] [CrossRef]
  16. Liu, H.; Zhu, W.; Yu, Y.; Xu, T.; Li, R.; Liu, X. Effect of water imbibition on uniaxial compression strength of sandstone. Int. J. Rock Mech. Min. Sci. 2020, 127, 104200. [Google Scholar] [CrossRef]
  17. Nara, Y.; Tanaka, M.; Harui, T. Evaluating long-term strength of rock under changing environments from air to water. Eng. Fract. Mech. 2017, 178, 201–211. [Google Scholar] [CrossRef] [Green Version]
  18. Vásárhelyi, B.; Ván, P. Influence of water content on the strength of rock. Eng. Geol. 2006, 84, 70–74. [Google Scholar] [CrossRef]
  19. Jia, J.; Liu, Z.; Feng, W.; Ma, F.; Zheng, C.; Wang, Y. Water Pressure Induced Corrosion of Cemented Sand, Gravel, and Rock (CSGR). Arab. J. Sci. Eng. 2018, 43, 2083–2092. [Google Scholar] [CrossRef]
  20. Rossi, P. A physical phenomenon which can explain the mechanical behaviour of concrete under high strain rates. Mater. Struct. 1991, 24, 422–424. [Google Scholar] [CrossRef]
  21. Zhang, Q.B.; Zhao, J. A review of dynamic experimental techniques and mechanical behaviour of rock materials. Rock Mech. Rock Eng. 2014, 47, 1411–1478. [Google Scholar] [CrossRef] [Green Version]
  22. Masuda, K. Effects of water on rock strength in a brittle regime. J. Struct. Geol. 2001, 23, 1653–1657. [Google Scholar] [CrossRef]
  23. Gu, H.; Tao, M.; Cao, W.; Zhou, J.; Li, X. Dynamic fracture behaviour and evolution mechanism of soft coal with different porosities and water contents. Theor. Appl. Fract. Mech. 2019, 103, 102265. [Google Scholar] [CrossRef]
  24. Dyke, C.G.; Dobereiner, L. Evaluating the strength and deformability of sandstones. Q. J. Eng. Geol. Hydrogeol. 1991, 24, 123–134. [Google Scholar] [CrossRef]
  25. Ramos da Silva, M.; Schroeder, C.; Verbrugge, J.-C. Unsaturated rock mechanics applied to a low-porosity shale. Eng. Geol. 2008, 97, 42–52. [Google Scholar] [CrossRef]
  26. Dresen, G.; Stephansson, O.; Zang, A. Rock Damage and Fluid Transport, Part I (Pageoph Topical Volumes); Springer Scienc: Berlin, Germany, 2006; Volume 278. [Google Scholar] [CrossRef]
  27. Charrière, D.; Behra, P. Water sorption on coals. J. Colloid Interface Sci. 2010, 344, 460–467. [Google Scholar] [CrossRef]
  28. Yao, Q.; Chen, T.; Tang, C.; Sedighi, M.; Wang, S.; Huang, Q. Influence of moisture on crack propagation in coal and its failure modes. Eng. Geol. 2019, 258, 105156. [Google Scholar] [CrossRef]
  29. Da S. Machado, A.; Mexias, A.S.; Vilela, A.C.F.; Osorio, E. Study of coal, char and coke fines structures and their proportions in the off-gas blast furnace samples by X-ray diffraction. Fuel 2013, 114, 224–228. [Google Scholar] [CrossRef]
  30. Song, D.; Yang, C.; Zhang, X.; Su, X.; Zhang, X. Structure of the organic crystallite unit in coal as determined by X-ray diffraction. Min. Sci. Technol. 2011, 21, 667–671. [Google Scholar] [CrossRef]
  31. Ward, C.R.; Taylor, J.C.; Matulis, C.E.; Dale, L.S. Quantification of mineral matter in the Argonne Premium Coals using interactive Rietveld-based X-ray diffraction. Int. J. Coal Geol. 2001, 46, 67–82. [Google Scholar] [CrossRef]
  32. Creelman, R.A.; Ward, C.R. A scanning electron microscope method for automated, quantitative analysis of mineral matter in coal. Int. J. Coal Geol. 1996, 30, 249–269. [Google Scholar] [CrossRef]
  33. Roslin, A.; Pokrajac, D.; Zhou, Y. Cleat structure analysis and permeability simulation of coal samples based on micro-computed tomography (micro-CT) and scan electron microscopy (SEM) technology. Fuel 2019, 254, 115579. [Google Scholar] [CrossRef]
  34. Shen, R.; Qiu, L.; Zhao, E.; Han, X.; Li, H.; Hou, Z.; Zhang, X. Experimental study on frequency and amplitude characteristics of acoustic emission during the fracturing process of coal under the action of water. Saf. Sci. 2019, 117, 320–329. [Google Scholar] [CrossRef]
  35. Li, D.; Wang, E.; Kong, X.; Ali, M.; Wang, D. Mechanical behaviors and acoustic emission fractal characteristics of coal specimens with a pre-existing flaw of various inclinations under uniaxial compression. Int. J. Rock Mech. Min. Sci. 2019, 116, 38–51. [Google Scholar] [CrossRef]
  36. Lockner, D. The role of acoustic emission in the study of rock fracture. Int. J. Rock Mech. Min. Sci. Geomech. Abstr. 1993, 30, 883–899. [Google Scholar] [CrossRef]
  37. Faria, M.T.C.; Pimentel-Junior, G.L.S. On the Crack Propagation in Rotating Shafts Supported by Fluid Film Bearings Using High-Frequency Acoustic Emission Analysis. Arab. J. Sci. Eng. 2019, 44, 1709–1712. [Google Scholar] [CrossRef]
  38. Wang, C.; Wu, S.; Lv, Q.; Liu, X.; Chen, W.; Che, D. Study on correlations of coal chemical properties based on database of real-time data. Appl. Energy 2017, 204, 1115–1123. [Google Scholar] [CrossRef]
  39. Le Roux, M.; Campbell, Q.P. An investigation into an improved method of fine coal dewatering. Miner. Eng. 2003, 16, 999–1003. [Google Scholar] [CrossRef]
  40. Yu, J.; Tahmasebi, A.; Han, Y.; Yin, F.; Li, X. A review on water in low rank coals: The existence, interaction with coal structure and effects on coal utilization. Fuel Process. Technol. 2013, 106, 9–20. [Google Scholar] [CrossRef]
  41. Dai, S.; Hower, J.C.; Finkelman, R.B.; Graham, I.T.; French, D.; Ward, C.R.; Eskenazy, G.; Wei, Q.; Zhao, L. Organic associations of non-mineral elements in coal: A review. Int. J. Coal Geol. 2020, 218, 103347. [Google Scholar] [CrossRef]
  42. Suuberg, E.M.; Otake, Y.; Yun, Y.; Deevi, S.C. Role of moisture in coal structure and the effects of drying upon the accessibility of coal structure. Energy Fuels 1993, 7, 384–392. [Google Scholar] [CrossRef]
  43. Zhong, C.; Zhang, Z.; Ranjith, P.G.; Lu, Y.; Choi, X. The role of pore water plays in coal under uniaxial cyclic loading. Eng. Geol. 2019, 257, 105125. [Google Scholar] [CrossRef]
  44. Okubo, S.; Fukui, K.; Qingxin, Q. Uniaxial compression and tension tests of anthracite and loading rate dependence of peak strength. Int. J. Coal Geol. 2006, 68, 196–204. [Google Scholar] [CrossRef]
  45. Song, H.; Jiang, Y.; Elsworth, D.; Zhao, Y.; Wang, J.; Liu, B. Scale effects and strength anisotropy in coal. Int. J. Coal Geol. 2018, 195, 37–46. [Google Scholar] [CrossRef]
  46. Zhao, Y.; Song, H.; Liu, S.; Zhang, C.; Dou, L.; Cao, A. Mechanical anisotropy of coal with considerations of realistic microstructures and external loading directions. Int. J. Rock Mech. Min. Sci. 2019, 116, 111–121. [Google Scholar] [CrossRef]
  47. Liu, Y.; Yin, G.; Li, M.; Zhang, D.; Huang, G.; Liu, P.; Liu, C.; Zhao, H.; Yu, B. Mechanical Properties and Failure Behavior of Dry and Water-Saturated Anisotropic Coal Under True-Triaxial Loading Conditions. Rock Mech. Rock Eng. 2019. [Google Scholar] [CrossRef]
  48. Yang, J.; Dai, J.; Yao, C.; Jiang, S.; Zhou, C.; Jiang, Q. Estimation of rock mass properties in excavation damage zones of rock slopes based on the Hoek-Brown criterion and acoustic testing. Int. J. Rock Mech. Min. Sci. 2020, 126, 104192. [Google Scholar] [CrossRef]
  49. Zhou, Z.; Cai, X.; Ma, D.; Cao, W.; Chen, L.; Zhou, J. Effects of water content on fracture and mechanical behavior of sandstone with a low clay mineral content. Eng. Fract. Mech. 2018, 193, 47–65. [Google Scholar] [CrossRef]
  50. Aggelis, D.G. Classification of cracking mode in concrete by acoustic emission parameters. Mech. Res. Commun. 2011, 38, 153–157. [Google Scholar] [CrossRef]
  51. Ohno, K.; Ohtsu, M. Crack classification in concrete based on acoustic emission. Constr. Build. Mater. 2010, 24, 2339–2346. [Google Scholar] [CrossRef]
  52. Yao, Q.; Tang, C.; Xia, Z.; Liu, X.; Zhu, L.; Chong, Z.; Hui, X. Mechanisms of failure in coal samples from underground water reservoir. Eng. Geol. 2020, 267, 105494. [Google Scholar] [CrossRef]
  53. Ahmed, Q.; Knez, D. Sensitivity Analysis on Fracturing Pressure Using Monte Carlo Simulation Technique. Oil Gas Eur. Mag. 2016, 42, 140–144. [Google Scholar]
  54. Quosay, A.A.; Knez, D.; Ziaja, J. Hydraulic fracturing: New uncertainty based modeling approach for process design using Monte Carlo simulation technique. PLoS ONE 2020, 15, e0236726. [Google Scholar] [CrossRef] [PubMed]
  55. Kong, X.; Wang, E.; Hu, S.; Shen, R.; Li, X.; Zhan, T. Fractal characteristics and acoustic emission of coal containing methane in triaxial compression failure. J. Appl. Geophys. 2016, 124, 139–147. [Google Scholar] [CrossRef]
  56. Xie, H.; Liu, J.; Ju, Y.; Li, J.; Xie, L. Fractal property of spatial distribution of acoustic emissions during the failure process of bedded rock salt. Int. J. Rock Mech. Min. Sci. 2011, 48, 1344–1351. [Google Scholar] [CrossRef]
  57. Zhang, Z.; Wang, E.; Li, N. Fractal characteristics of acoustic emission events based on single-link cluster method during uniaxial loading of rock. Chaos Solitons Fractals 2017, 104, 298–306. [Google Scholar] [CrossRef]
  58. Grassberger, P.; Procaccia, I. Measuring the strangeness of strange attractors. Phys. D Nonlinear Phenom. 1983, 9, 189–208. [Google Scholar] [CrossRef]
  59. Song, H.; Zhao, Y.; Jiang, Y.; Wang, J. Scale Effect on the Anisotropy of Acoustic Emission in Coal. Shock Vib. 2018, 2018, 11–21. [Google Scholar] [CrossRef]
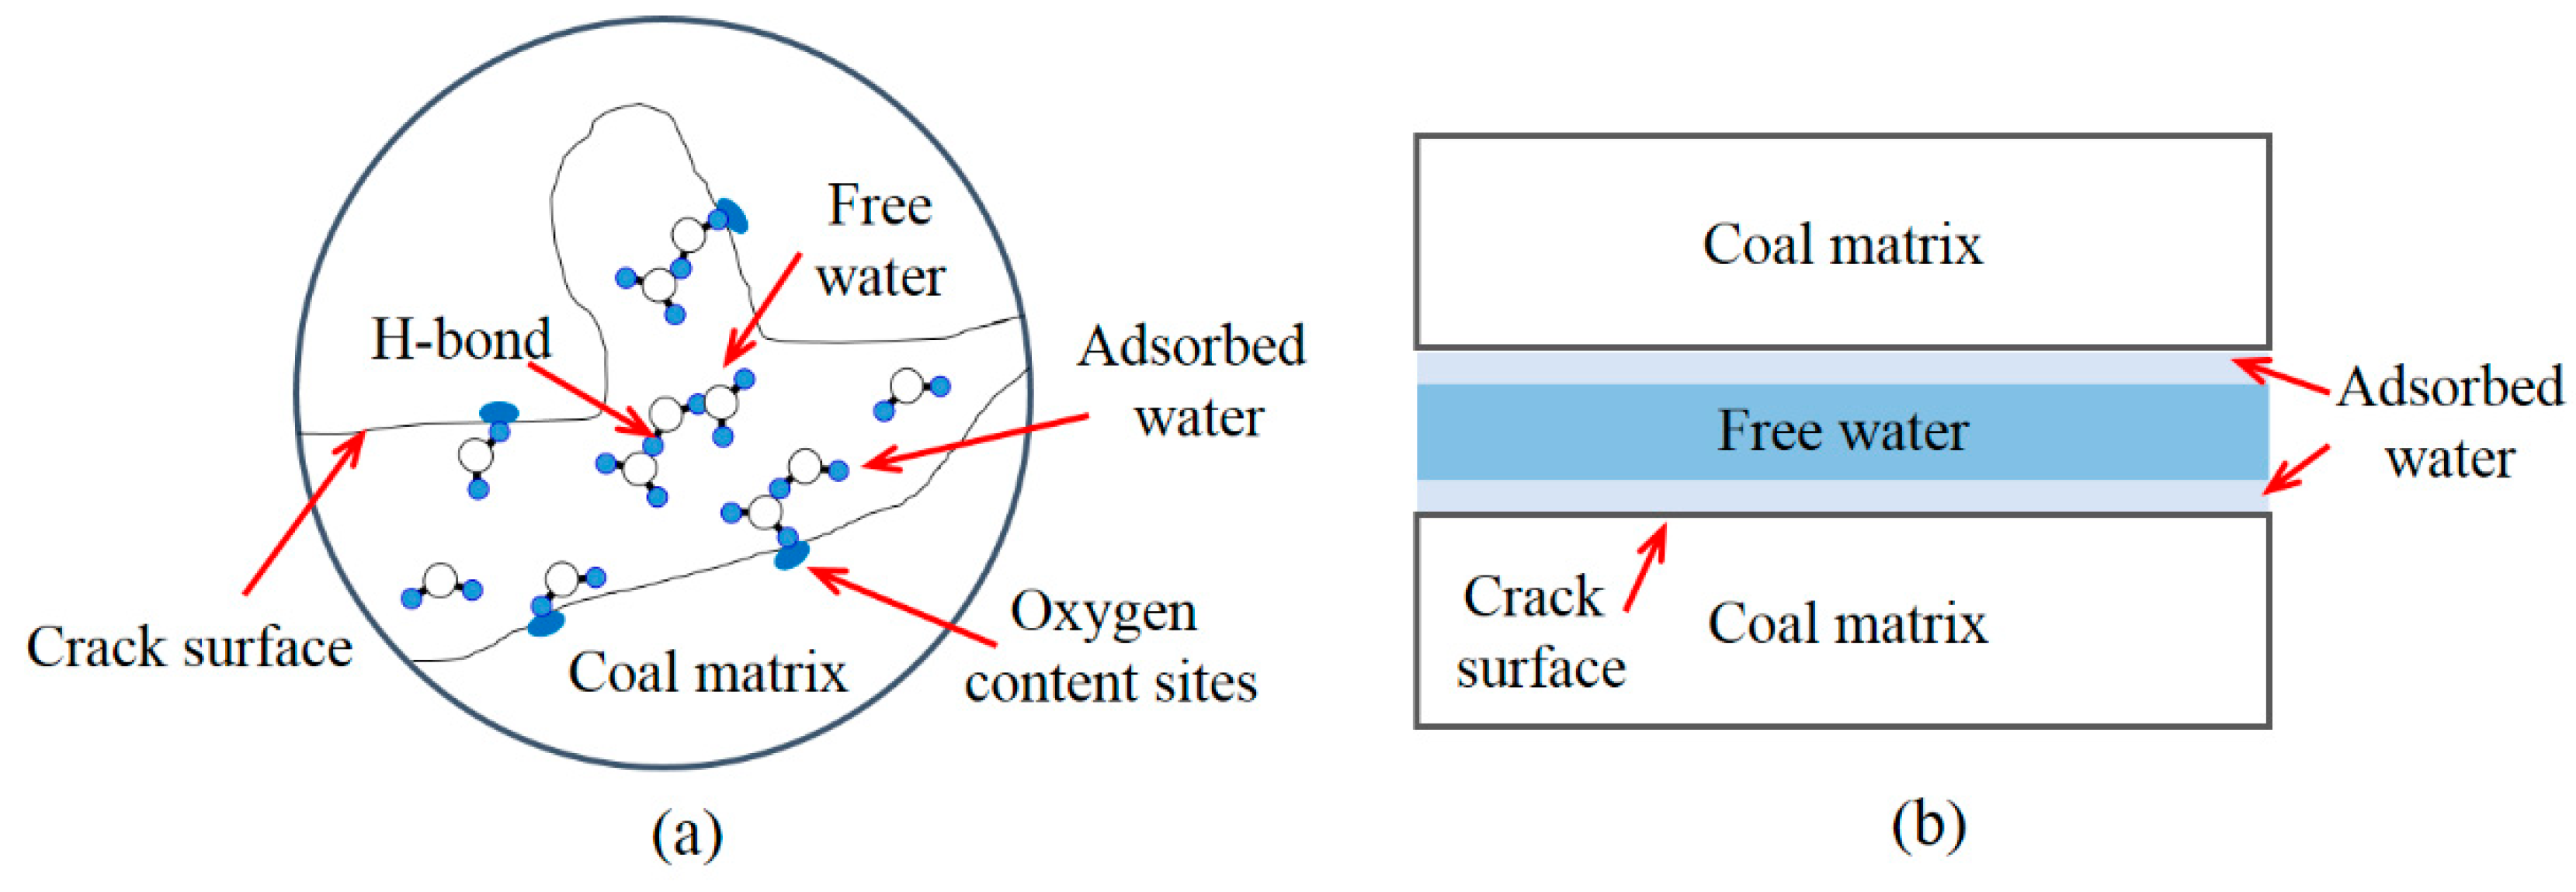
Figure 1. Schematic diagram of water forms in pre-existing discontinuities: (a) the presence of free and adsorbed water in the cracks at the micro scale; (b) macroscopic distribution of free and adsorbed water in cracks.
Energies 13 06585 g001
Figure 2. Mechanical responses of microstructures in coal under the influence of water: (a) swelling of the coal matrix after water injection; (b) the lubrication properties of water result in crack surface sliding; (c) a counterforce occurs after compression of the cracks holding the water.
Energies 13 06585 g002
Figure 3. Location of Wudong Coal Mine.
Energies 13 06585 g003
Figure 4. Specimens used in this research.
Energies 13 06585 g004
Figure 5. Water content variations with time in specimens of different diameters.
Energies 13 06585 g005
Figure 6. The surface features of coal under various magnifications and at different locations: (a) surface image at 200 times magnifications; (b) crack feature at 300 times magnification; (c) surface image at 1000 times magnifications; (d) crack image at 1800 times magnification.
Energies 13 06585 g006
Figure 7. Experimental layout of the equipment and specimens.
Energies 13 06585 g007
Figure 8. A scatter plot of tensile strength values for specimens with different diameters and immersion times.
Energies 13 06585 g008
Figure 9. AE features of coal specimens with different immersion times and diameters: (a) diameter of 25 mm, dry; (b) diameter of 50 mm, dry; (c) diameter of 25 mm, 4 days of immersion; (d) diameter of 50 mm, 4 days of immersion; (e) diameter of 25 mm, 7 days of immersion; (f) diameter of 50 mm, 7 days of immersion.
Energies 13 06585 g009aEnergies 13 06585 g009b
Figure 10. Typical tensile and shear features of coal revealed by the AE activities during the loading process: (a) failure patterns indicated by RA and AF; (b) stress and failure variations with loading time.
Energies 13 06585 g010
Figure 11. Failure type variations due to specimen size (mm) and water content: (a) failure type variations with specimen size; (b) failure type variations with immersion time.
Energies 13 06585 g011
Figure 12. Fractal dimension variations due to water content.
Energies 13 06585 g012
Figure 13. Fractal dimension variations due to specimen diameter differences.
Energies 13 06585 g013
Figure 14. Results of regression analysis of tensile strength and specimen size values under different water content conditions, based on Equation (8).
Energies 13 06585 g014
Table 1. Variations of water contents due to specimen size and immersion time.
Immersion Time (days)Average Water Content (%)
25 mm38 mm50 mm
44.803.983.31
75.564.593.89
Table 2. Tensile strength values for specimens with different sizes and immersion times.
Immersion Time (Days)25 mm38 mm50 mm
Average Tensile Strength (MPa)SD
(MPa)
Average Tensile Strength (MPa)SD
(MPa)
Average Tensile Strength (MPa)SD
(MPa)
01.320.3761.210.3541.190.177
41.190.1171.060.0921.020.069
71.150.0921.000.0860.950.053
Table 3. Variations of the cumulative acoustic emission (AE) count and absolute AE energy values due to specimen size and immersion time.
Immersion Time (Days)25 mm38 mm50 mm
CAEC
(×105)
CAEE
(×105 aJ)
CAEC
(×105)
CAEE
(×105 aJ)
CAEC
(×105)
CAEE
(×105 aJ)
01.990.862.341.582.461.72
40.700.470.920.791.140.98
71.010.661.161.181.211.24
Table 4. The fractal dimensions of AE values for specimens with different immersion times and sizes.
Time (Days)Fractal Dimension
25 mmAverage38 mmAverage50 mmAverage
00.260.550.670.580.920.83
0.200.601.12
1.20.480.46
40.680.370.370.460.620.68
0.180.690.85
0.240.330.57
70.050.230.340.310.350.51
0.490.440.39
0.140.140.79
Table 5. Parameters and correlation coefficients of Equation (8) in specimens with different sizes.
Dry4 Days7 Days
A1.040.880.82
B0.750.951.11
k0.400.430.45
Coefficient (R2)0.960.950.99
Publisher’s Note: MDPI stays neutral with regard to jurisdictional claims in published maps and institutional affiliations.