1. Introduction
One of the major challenges that humanity is facing is to promote the transition from traditional fossil fuels to long-term sustainable energies [
1]. In recent decades, photovoltaic (PV) technology has become a competitive technological alternative allowing to reach appreciable power production by conversion of solar energy into electricity [
2].
Si-crystalline photovoltaic panels (PVPs) currently represent the dominating technology [
3] covering 90% of the global market share [
4]. The application of alternative PV technologies, such as the thin-film Cd-Te and CIGS panels, is limited by the application of toxic metals (Cd in Cd-Te) and rare elements (In and Ga in CIGS) [
5], which contributes to consolidate the dominating market position of the Si based panels [
3].
Taking into consideration the PVPs market growth recorded over the past decades [
6], a progressively increasing annual flux of the end-of-life (EOL) PVPs is foreseen. Specifically, it is predicted that about 8 and 78 million EOL-PVPs tons could be generated within 2030 and 2050, respectively [
7].
Recycling this huge flux of EOL-PVPs is indispensable to prevent that harmful elements contained in the panels, such as heavy metals, could be dispersed into the environment [
8]. To this purpose, EU included EOL-PVPs in the class of the wastes of electric and electronic equipment (WEEE) [
9], and established minimum targets for their collection (65%), recycling (80%), and recovery (85%) starting from August 2018 (previous process targets were 70% for recycling and 80% for recovery).
In addition to significant environmental benefits, the value of recycling also lies in the recovery of secondary raw materials [
10]. Hence, in addition to the compliance with relevant regulations, the appropriate EOL-PVPs management may offer a further sustainable solution to raw materials supply. As a consequence, the EOL-PVPs treatment became an extensively studied topic, generally addressed through the life cycle analysis (LCA) methodology [
11,
12,
13,
14,
15,
16].
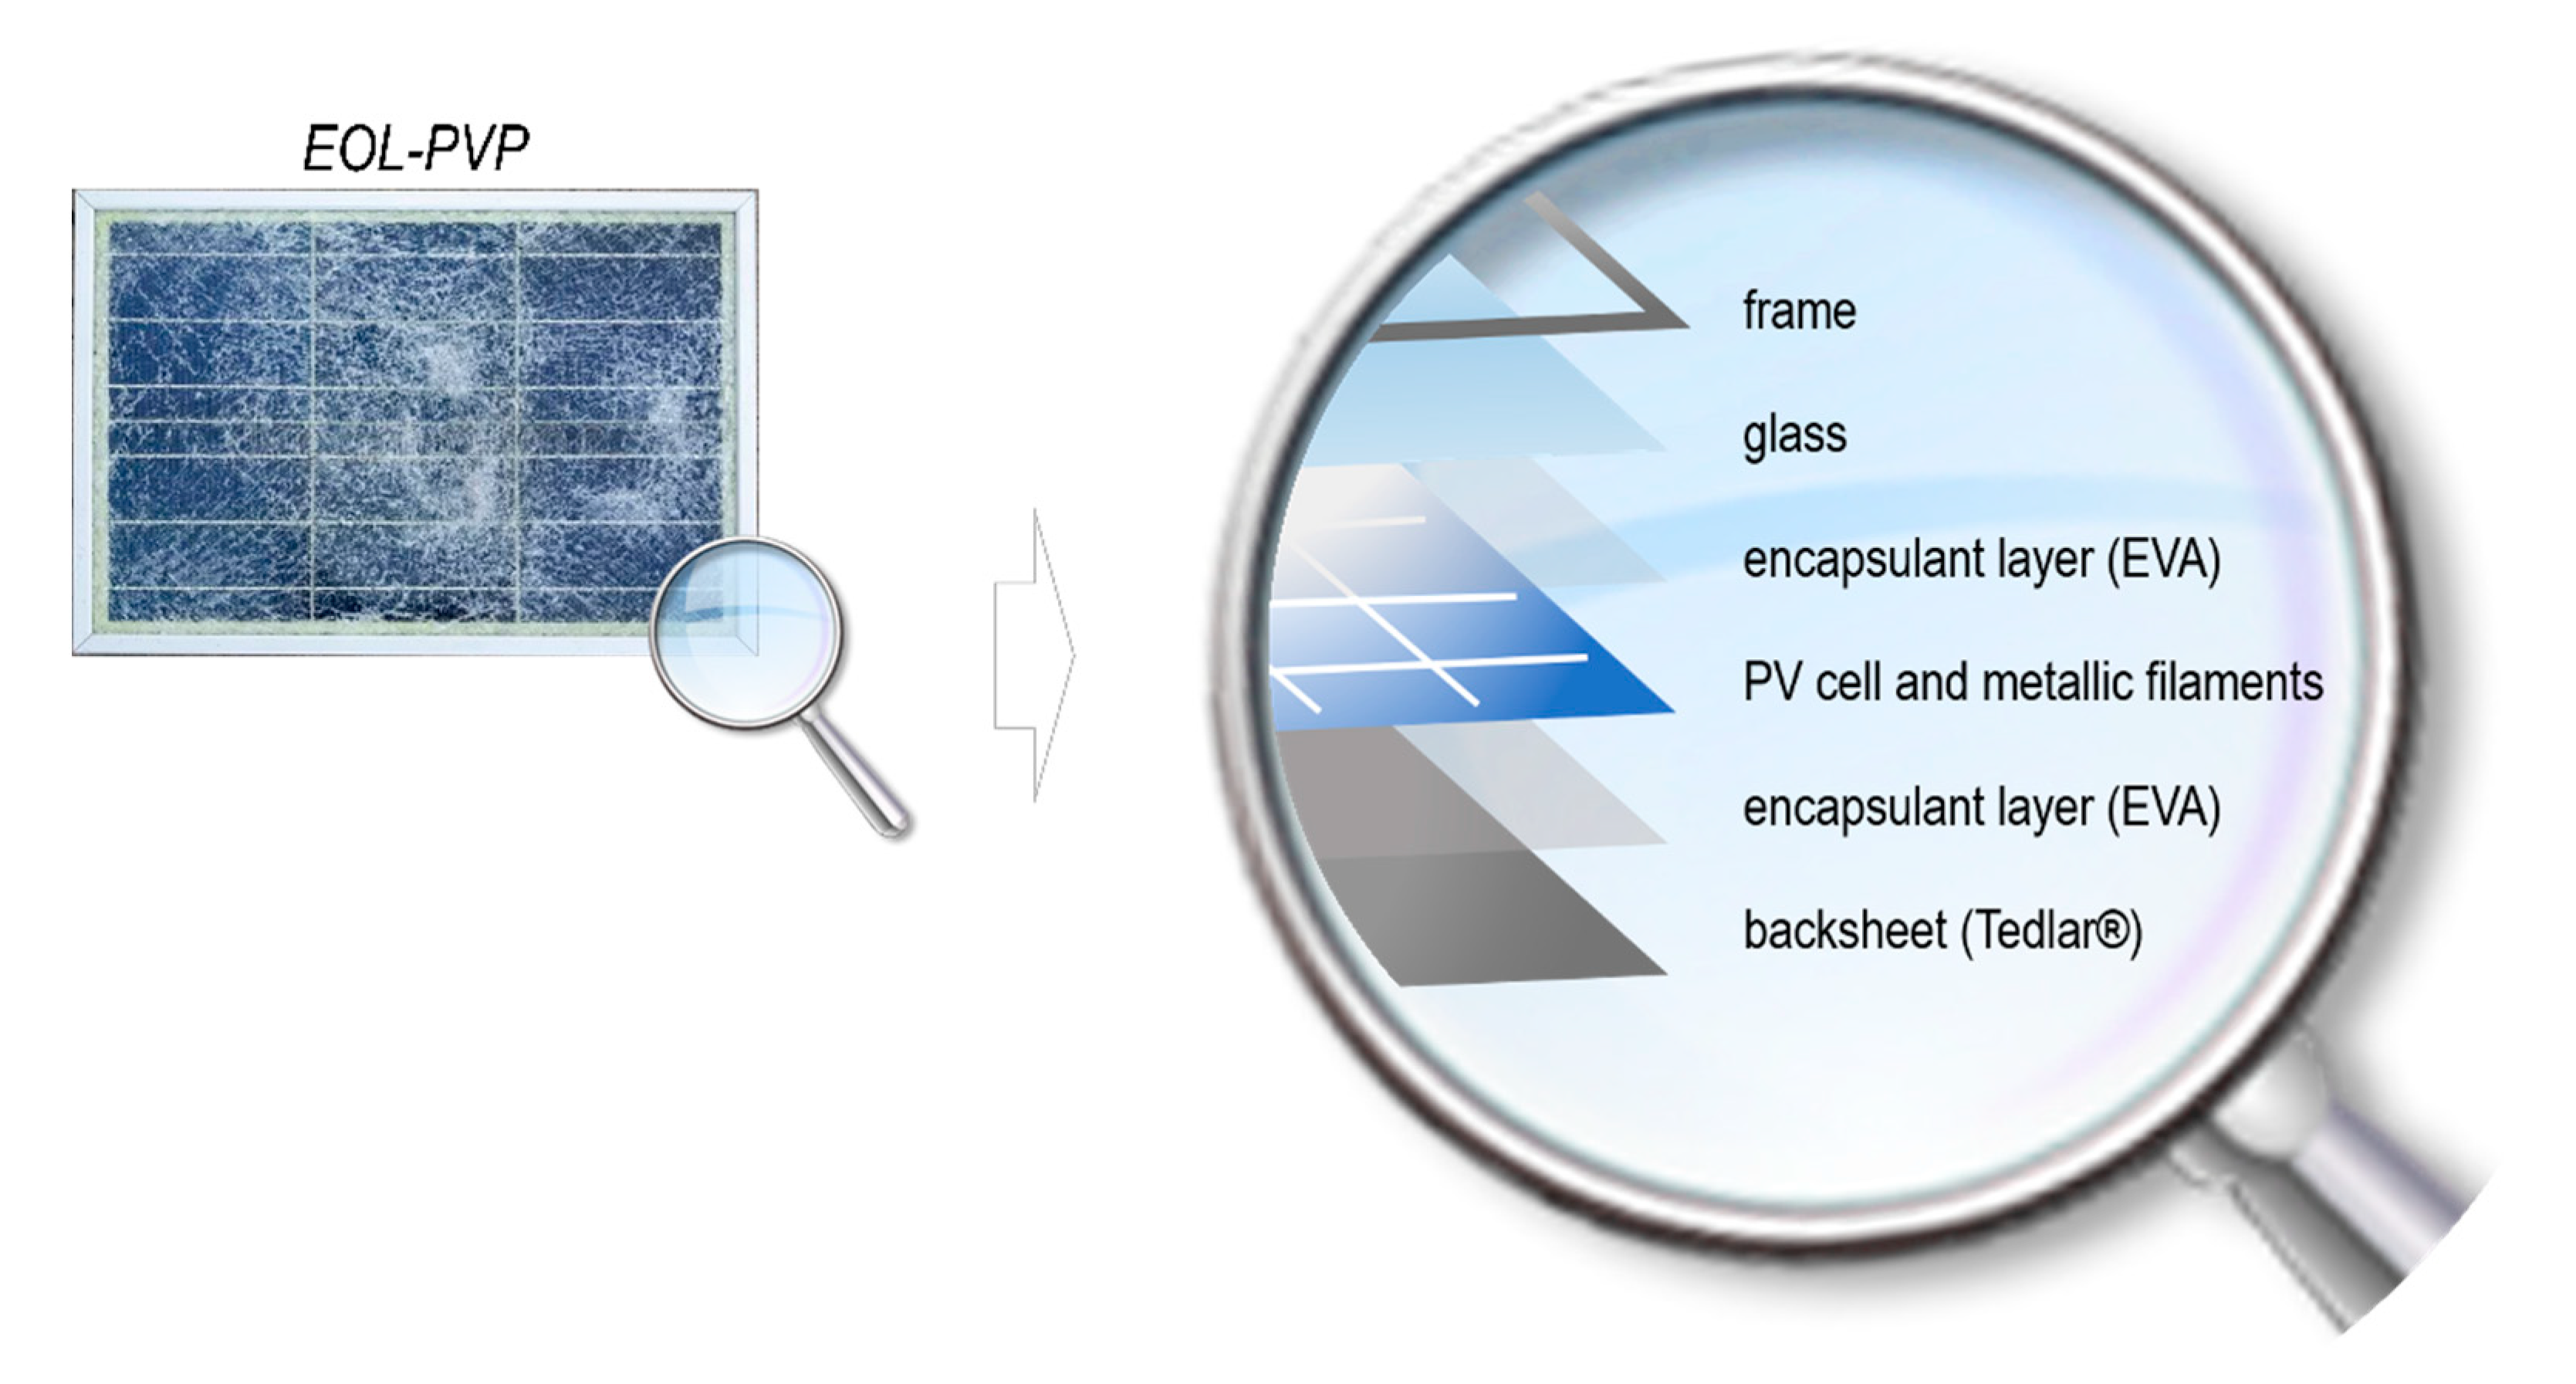
Considering that main recycling targets in a Si-crystalline PVP are glass, photovoltaic cells and metals, including panel frames (Al) and current collectors (Cu and Ag) [
17], the following two observations should be taken into account: (i) the aluminum frame and front glass represent more than 80% of the PVP total weight and (ii) 80% of the overall PVP value is associated to the metals used in PV cell and electric contacts (mainly Si, Cu, and Ag). This means that in order to guarantee the economic sustainability of the recycling process, metals of cell and contacts need to be recycled together with glass and frames (
Figure 1). On the other hand, strategies focused solely on cell recovery cannot guarantee the minimum recycling targets set by regulations.
A literature survey highlights that the difficulties encountered in the degradation of the encapsulant polymer (typically polyethylene-vinyl-acetate (EVA)) represent a major obstacle to the separation of the EOL-PVP components and thus to the efficient recovery of different valuable fractions [
5].
The most common recycling methods implemented at pilot and industrial scale rely on mechanical treatments (i.e., dismantling, crushing, and sieving) to achieve the separation of the different PVP components and their concentration in specific size fractions. Typical examples of this approach include the recycling processes proposed by the French environmental services provider Veolia [
19], and by the Italian company Nike* S.r.l. [
20]. However, these processes are generally defined as ‘downcycling’ because they can meet the requirements of the EU directive by recovering only low-value fractions (e.g., impure fine-sized glass fractions [
17]). This is mainly caused by the fine milling operations required to separate the various EOL-PVPs components from the encapsulant (EVA). Indeed, while enabling the separation of the different EOL-PVP components, these operations are also responsible for the contamination of the separated components by the EVA. This negatively affects the economic sustainability of the recycling process by making it possible to recover only low-value impure glass fractions. In order to overcome this limitation, the EU Commission settled specific priorities to promote high-quality recovery operations [
21] and founded research and development projects aiming at higher-value material recovery [
22].
Some results obtained with this approach include the technologies developed by the Italian company SASIL [
23] and by the German Geltz Umwelt-Technologie [
24]. Both these technologies are based, again, on mechanical operation but they include a preliminary degradation of the plastic components (i.e., encapsulant and backsheet polymers) by pyrolysis. However, even though facilitating the separation of the PV cell from the encapsulant polymer, this thermal degradation is responsible for the generation of toxic gaseous emissions, mainly due to the fluoride compounds contained in the Tedlar
® backsheet (commercial name for Polyvinyl Fluoride based film [
25]), which negatively influences the overall environmental impact of the recycling process [
26].
A technological solution allowing for the separation of the PV cell, alternative to pyrolysis, is the solvent treatment. Specifically, by virtue of a swelling/dissolution mechanism, the EVA is partly solubilized in the solvent, thereby facilitating the separation of the various PVP components. This method was generally implemented by dipping the entire panel in the solvent bath in absence of solvent agitation, which yielded inefficient mass transfer and thus imposed long treatment times [
27,
28,
29]. For instance, Doi et al. tested different solvents (i.e., lacquer thinner, toluene, acetone, petroleum benzene, ethanol, methyl ethyl ketone, isopropanol, methyl isobutyl ketone, tetrahydrofuran, trichloroethylene, ethylene glycol, glycerine) at 80 °C and reported that the best separation performances were obtained by using trichloroethylene in a 10-day treatment [
27]. Prado et al. obtained instead the Cell detachment at room temperature by using isopropanol for 2 days [
28]. Yan et al. [
29], proposed the separation of the various layers constituting the EOL-PVP through a hydrothermal route in KOH-ethanol solution. Nevertheless, the use of these green solutions resulted always in glass fraction still containing EVA residues (low purity glass) [
29]. Despite these possible environmental benefits, the solvent treatment remains scarcely implemented due to the slower kinetics with respect to the thermal treatment [
27].
Considering that glass and Al are the main component of the panels (79–85%), boosting the economic performances and guaranteeing the minimum targets set by regulation require effective strategies oriented toward high purity glass recovery, as well as the recovery of further valuable fractions (e.g., metals contained in the PV cell).
In the previous works by this research group, different approaches for the treatment of EOL-PVPs were investigated [
17,
30,
31,
32]. These studies evidenced that a solvent treatment with cyclohexane can allow effectively recovering a high value glass fraction from crushed PVPs [
17]. The possibility to effectively recover impurity-free large sized glass separated from metal contacts and polymeric fraction (including Tedlar
®, EVA, and PV cell fragments) was demonstrated at pilot scale during the PhotoLife project [
33]. During the pilot scale demonstration, mechanical and solvent treatment were performed allowing for the recovery of Al frames, high-value glass and metallic contacts, while polymeric fractions glued to cell elements (Ag and Si) were collected as a solid mixture requiring further refining.
Objectives
The main objective of this work is assessing the technical and economic feasibility of an upgraded recycling process including the refining of the polymeric-cell mixture. This process, hereafter referred to as ‘advanced PhotoLife process’, was simulated based on preliminary data derived by lab scale research activities. The process allows for the separation of the polymer fractions and for the recovery of the silver and silicon fractions (Ag and Si) contained in the PV cell. Mass and energy balances are reported and process simulations are analyzed to elaborate a preliminary techno-economic assessment. In this framework, a comparison between the Advanced PhotoLife process and the originally developed PhotoLife process is discussed.
To the best of our knowledge, recycling strategies allowing the recovery of polymeric fractions have not been reported yet. In fact, they are generally not even considered for recycling [
10,
27]. Accordingly, process simulations reported here can allow quantifying the economic and environmental benefits that can be derived by the recovery and recycling of these additional materials as secondary raw materials.
3. Results and Discussion
3.1. PhotoLife Process
The PhotoLife process is described in the block diagram reported in
Figure 3. Further details about the operating conditions are reported elsewhere [
17].
The process includes the manual dismantling of the Al frame followed by shredding to produce a target coarse fraction (>3 mm) as well as residual intermediate and fine fractions. The coarse fraction is further treated by organic solvents, thus resulting in high quality glass (>3 mm), metallic filaments made of copper, and a polymeric residue containing the PVP back sheet (mainly of Tedlar
®), and the EVA encapsulant still glued to the Si cell fragments (
Figure 4).
The Al from frames, the high quality glass and the metallic filaments can be directly recycled as they are, yielding the first revenue of the PhotoLife process [
33]. The intermediate fraction is a by-product without any commercial value, being constituted by fine glass with some metal impurities. This fraction can be re-used in cement production without additional costs for waste disposal/treatment. The fine fraction containing glass, EVA and the cell fine fragment is considered as a waste to be disposed of.
Table 1 reports the mass balances for the different fractions obtained in the PhotoLife process. According to the operation described and the mass balances elaborated during the PhotoLife project, the recycling rate was estimated as reported in
Table 2.
In the PhotoLife project, the thermal treatment of plastic residue was not evaluated because, without preliminary separation of Tedlar
® from EVA, such an operation is not feasible. In fact, Tedlar
® contains fluoride, which can release toxic HF gas emissions during thermal valorization. For this reason, the recovery rate for the PhotoLife process is equal to the recycling rate (
Table 2).
Indications about the performances of the recycling process can be derived by estimating the percentage of the maximum recoverable value that is attained, i.e., the value of the recovered materials divided by the value of all the materials contained in the panels.
Considering the main components reported in
Table 3 and their market prices (
https://www.capitalscrapmetal.com/prices/;
https://www.dailymetalprice.com), it is found that large part of the maximum recoverable value is associated to the silver fraction contained in the PVP wastes of the PhotoLife recycling route. Accordingly, the PhotoLife process allows for only 30% recovery of maximum recoverable value (
Table 2), the largest part of the recoverable value being associated to the polymeric residue containing Ag and Si (
Table 3).
3.2. Advanced PhotoLife Process
According to the illustrated analysis, the process was implemented to improve the recycling and recovery targets by:
- -
Separating the different polymers in the polymeric residue
- -
Recycling the Tedlar® backsheet
- -
Thermally treating the EVA residues
- -
Recycling the Ag and Si from the ashes
The additional unit operations required to perform this process are described in
Figure 5. The process includes the separation of Tedlar
® by sieving, followed by the gravimetric separation in water of EVA residue (overflow) and glass (downflow). The EVA residue containing the Si cell fragments and Ag from the printed contacts is then thermally treated to burn the EVA. Hydrometallurgical treatment of the residual ashes is finally performed to recover Ag and Si.
The mass balances of the Advanced PhotoLife process are reported in
Table 4.
Reported results indicates that, as compared to the original PhotoLife process, the advanced PhotoLife process allows for a significant improvement in both the recycling and the recovery rate. This leads to a significant increase in the recovered value, which reaches 75% of maximum theoretical value (
Table 5). This increase in the recovered value is mainly due to the increased recovery of the Ag panel fraction, 90% of this latter fraction is contained in the ashes fed to the hydrometallurgical treatment and can thus effectively recovered through the proposed process scheme.
3.3. Process Simulations
Process simulations were performed for the advanced PhotoLife process at two potentialities (3000 and 30,000 t/y). For both these options, the batch duration was set as 5.5 h with a cycle time (time between two subsequent batches) of 4.65 h. It is important to remark that this time does not correspond to the minimum cycle time, which would be instead as low as 2.17 h based on the longest operation (process bottleneck) of water-cyclohexane density separation (total time: 2.17 h). The cycle time was set as 4.65 based on the assumption to conduct five batches per day for a total of 330 days. The concept of performing five batches per day is associated with the idea of a recycling plant working on two 8-h shifts. Based on these assumptions, the increase in recycling volume from 3000 to 30,000 t/y would be ensured by the same number of batches per year with larger throughputs per batch, thus larger equipment and more labor required. In the simulation, the duration of the batch cycle was maintained the same despite the tenfold increase in process throughputs. However, the labor required to implement the process was increased to account for the larger number of operators associated with the operation of EOL-PVPs reception, storage, manual dismantling, as well as material transfer between operations.
As for the equipment size and cycle time, the downstream hydrometallurgical section of the process required special consideration. For this section, the cycle time between two batches was set considerably higher than the upstream batch section, based on the assumption that the hydrometallurgical section would process the materials generated by multiple batches of the upstream process. In particular, for the process that recycles 30,000 t/y, the cycle time in the hydrometallurgical section was set as 24 h. This means that the hydrometallurgical section in this process would treat altogether the material generated in 1 day by five batches of the upstream process. In contrast, this cycle time for the LRVP was set as 240 h. Given the 10 times lower throughputs in the LVRP, the 10-fold increase in this cycle time implies that each hydrometallurgical batch treats the same amount of material. This choice is due to the consideration that the equipment required to treat the amount of material fed to the hydrometallurgical section (about 3% of the EOL-PVPs) would be too small and non-optimal given the non-linear increase in equipment cost and labor required to treat increased amount of material. In other words, treating lower amounts of materials more frequently (higher number of batches) was considered as less efficient than treating the same total amount per year with a lower frequency but in larger batches.
The net profit value was calculated at an interest rate of 0.5% over a project lifetime of 15 years that includes a plant construction period of 30 months and a startup period of 4 months. The cash-flow analysis was also conducted under the assumption of an inflation rate of 1%, an income tax of 40% and a depreciation time of 7 years. Such a depreciation time was set based on an overall plant depreciation coefficient of 15%. Such a coefficient value was adopted based on current Italian legislation (Ministerial Decree 31 December 1988) that sets as 10% the depreciation coefficient for large mechanical machines, at 12% the one for electricity generation plants, engines and pumps, and at 17.5% the one for chemical equipment within the metallurgy industry.
A comparison between the economic outputs of the two processes is listed in
Table 6 evidencing that the advanced Photolife process is economically feasible only treating 30,000 t/y.
While treating 3000 ton of end-of-life photovoltaic panels per year does not yield enough revenues to sustain the operating costs (about 3 M
$ revenues against 7 M
$ operating costs), treating 30,000 t/y is sufficient to sustain the process and repay the investment within 3–3.5 years. It is evident that the 10-fold increase in the recycling volumes results in a linear increase in process revenues from about 3 M
$/y to 30 M
$/y. At the same time, the capital investment increases only by 2 times, from about 5 to 10 M
$, thus contributing to a higher return on the investment. Such an increase in total capital investment is due to (i) the non-linear relationship between equipment cost and size, which is known to follow a power law with exponent around 0.5–0.6 [
36,
37], and (ii) the hydrometallurgical section sized for the same throughput but working only part of the time (1/10).
Table 6 also denotes a fourfold increase in operating costs despite the 10 times higher throughput by scaling-up from LRVP to HRVP. This aspect requires a special analysis since having operating costs higher than revenues results in the LRVP not being economically feasible. Analyzing and understating how this cost item affects the process economy requires breaking it down into the different components.
The operating cost breakdown is shown in
Figure 6, which highlights that labor represents around 71% and 64% of the operating costs for the LRVP and HRVP, respectively.
The lower impact of the labor cost in the HRVP is associated with the increase in labor costs which increase nonlinearly with increasing the throughput. Indeed, the total labor cost comprises a component that is linearly proportional to the throughput and a component that increases only slightly, i.e., less than proportionally, with it. The first one is for instance associated with the manual work required for the manual removal of the aluminum frames from the EOL PVPs. The second one is instead the labor associated with the physical and chemical/hydrometallurgical operations, which was assumed to increase to a lower extent with the process throughput (i.e., filter-presses and reactors might require only 1 or 2 more operators despite the 10-fold increase in recycling volume). Improved understanding of the relationship between labor and process economy can be obtained by analyzing the labor cost breakdown (
Figure 7).
Figure 7 displays through labels the amount of labor-hours per year associated with each process section, evidencing that the largest portion of labor cost is associated with the manual dismantling of the aluminum frames.
Figure 7 also evidences that the total amount of labor-hours per year required to run the process are about 88,000 and 299,000 for the LRVP and HRVP, respectively. For the LRVP, this corresponds to have on-site about 17 people at any time. For the HRVP, the same consideration leads to a total of 56 people present on the plant during each shift, which might be overestimated. However, the fact that the labor for the latest option might have been overestimated represents further corroborates the conclusion that the HRVP is economically feasible.
It must be also remarked that the simulations were performed under the assumption of a high recycling rate (99%) of cyclohexane and water. Attaining this recycling rate for water and solvent is essential to minimize the costs for material consumption and waste disposal and thus enforce the economic feasibility in the HRVP.
More detailed information about materials balance for both recycling volumes are listed in
Table 7, whereas the purchasing and selling prices of raw materials and the process revenues are listed in
Table 8.
It must be remarked that EOL-PVPs were not considered as raw materials in the simulation but as revenues. This choice can be justified by considering that the recyclers receive from the community/collectors/PVP producers a fee to sustain the economy of the recycling process. This fee is usually paid by PVP consumers by charging with an overprice of about 10 $/PVP the cost for the purchase and installation of PVPs. Since the average PVP weight is around 20 kg/PVP, such fee ultimately translates into a gross income contribution for recyclers of about 0.5 $/kg.
4. Discussion
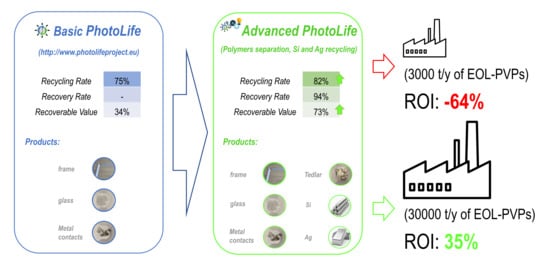
The technical feasibility of the PhotoLife process was demonstrated at pilot scale. This process allows recovering high-value solar glass and Al and Cu scraps with 75% recovery rate, thus fulfilling targets set by the EU Directive (70% until 2018 now increased to 80%).
On the other hand, the PhotoLife process did not include any material recovery from a residual fraction composed of the panel polymers (EVA and Tedlar®) and of the cell components. In this latter fraction, it is concentrated about 90% of the whole Ag panel content, which account for most of the panel recoverable value. Accordingly, by excluding metal recovery from this residual fraction, the Photolife process delivered secondary raw materials (high quality glass, Al and Cu) covering only 30% of the PVP recoverable value.
Preliminary lab scale tests were performed demonstrating the possibility to separate the polymeric components (EVA and Tedlar®) and to recycle the metals found in the cell fragments (Ag and Si), thereby improving the process performances. The proposed process solution includes the physical separation of the Tedlar® backsheet materials followed by the thermal decomposition of EVA. Ag and Si can be then recovered by hydrometallurgical treatment of the ashes left after EVA thermal treatment. This process can increase both the recycling rate (82%) and the recovered value (75% of the panel recoverable value), giving at the same time the possibility to produce an excess of energy (from EVA combustion) needed for other process operations such as solvent treatment and leaching (advanced Photolife process material recovery rate is 94%, thus exceeding the EU target that is 85%).
Process simulations at two feed rates (
Table 6) denoted that the advanced PhotoLife process is economically feasible only treating 30,000 t/y of EOL PVP. This is due mainly to economy scale law decreasing the impact of plant cost per produced unit for increased size, but there is also a critical aspect in the hydrometallurgical section in the LRVP whose size was chosen avoiding small equipment with expensive controls. This leads to a working time for this section that is only 1/10 of the time, which is not an efficient operating solution. Therefore, aiming to recycle 3000 t/y of EOL-PVPs, an alternative solution to make the process economically feasible would be to exclude from the investment the hydrometallurgical section and sell the Ag-Si-EVA material to external processers.
Operating costs break down evidenced that labor costs are the main components (
Figure 6). Analyzing the different labor contribution it is also evident that dismantling activity of the external frames is the largest one (
Figure 7). This is a crucial aspect to be considered in the techno-economic assessment of the developed process as it represents a limiting factor for the scale-up. Pilot-scale tests highlighted as one operator can manually remove the frame from one EOL-PVP in 5 min. Given the average weight of 20 kg/EOL-PVP, 1 labor hour produces the dismantling of 240 kg of EOL-PVPs. The manual removal of the aluminum frame from PVP can be thus considered as a time-cost constraint in the process. For this reason, it was simulated as a continuous operation taking place 24/7 for 330 days/y. This consideration implies that increasing the process throughput from 3000 to 30,000 t/y requires a linear increase in the labor hours at the manual dismantling from 1.58 to 16.13 per hour. In other words, the batch feed of 1.59 ton per hour of dismantled EOL-PVPs in the LRVP can be obtained by having 1.58 labor hour per hour while the 16.20 t/y in the HRVP requires having 12.13 labor hour per hour. This constraint also suggests that an increase in the process feasibility could be attained by replacing the manual removal of the frames with an automated and faster technology.
For the above-mentioned reasons, the only labor considered to increase linearly by scaling up 10 times the process is the one for manual dismantling. The labels in
Figure 7 highlights the labor hours per year associated with this section increases by 5.7 times by scaling up the process from 3000 to 30,000 t/y of EOL-PVPs (the increase is not exactly linear to the scale-up because it contains the non-linear labor for EOL-PVPs handling and storage). In contrast, the other labor requirement accounted only for a few extra-people to face the larger throughput. Clearly, the 4-fold increase in operating costs observed by scaling-up 10 times the process arisen from a balance between these two kinds of costs. Furthermore, the fourfold increase in operating costs despite the 10 times higher recycling volume actually suggests as the sum of all costs that are linearly proportional to the throughput (e.g., manual dismantling, raw materials, utilities, etc.) are slightly lower than the others.
In order to improve economic feasibility of the process the automatization of frames removal seems to be the best option.
A final consideration about energy balances from simulations that highlighted another interesting feature of the advanced Photolife process: the thermal treatment of the EVA offers a significant energy credit. In particular, considering the simulation at 30,000 t/y, the exothermic thermal degradation of EVA (calorific value −45 kJ/g [
38]) would produce about 12.5 MWh/batch that could be conveniently recovered where needed across the flowsheet. Then, according to a possible energy recovery scheme, part of this energy can be recovered to heat up the leaching reactor and the cyclohexane evaporator, requiring 0.025 and 1.4 MWh/batch, respectively. However, the recovered heat would still correspond only to the 11% of the total energy credit (12.5 MWh/batch), thus leaving a theoretical surplus of about 11 MWh/batch available for other heating tasks (for instance thermal conditioning of cyclohexane having a fusion point of 7 °C). Then including thermal valorization of EVA the energy consumption of the recycling process is reduced and the recovery targets achieved. Otherwise not including this operation, recovery rate (sum of recycled materials plus material used for energy production) would be the same than recycling rate (82%) not satisfying EU target (85%).
5. Conclusions
In this work, two processes (the Photolife process and the advanced Photolife process) for EOL PVP treatment were compared in terms of recycling rate, recovery rates and recoverable value rate.
The Photolife process was implemented at pilot scale demonstrating the technical feasibility of the operations allowing for the recovery of high value glass and metals from frames and metallic contacts. Nevertheless, the PhotoLife process did not include the recycling (or recovery) of polymers and metals from the cells (including Ag and Si).
Mass balances of the processes evidenced that the integration in the advanced Photolife process of operations for polymer separation, EVA combustion and Ag-Si recycling can greatly improve both recycling rate (from 75% to 82%) and recoverable value (from 30% to 75%). Then, according to preliminary lab scale tests, the advanced Photolife process exceeded EU targets in terms of recycling rate (82% vs. 80%) and recovery rate (94% vs. 85%) guaranteeing high value products recycling.
The simulations for the advanced PhotoLife process highlighted its economic feasibility only at high recycling volume (30,000 t/y). By recycling 30,000 ton of EOL-PVPs per year, the return of the investment would be about 29% with a NPV at 1% interest of 14,275,000 $.
The main throughput/economic constraint in the process is represented by the manual work required to remove the Al frames from the EOL-PVPs. Replacing this manual work with automated operations might improve considerably the process economy and probably make the process feasible also at lower recycling volumes.
Another point for further optimization is the hydrometallurgical section of the recycling process/plant, whose economy could be significantly improved by avoiding long inactive times between batches. This could be obtained by developing a multi-waste process treating not only PVP but also other silver-rich wastes such as Ag-batteries.
Further simulations will address the effect of these options (automatization of dismantling and inclusion of the treatment of Ag-containing wastes) on the economic feasibility of the advanced PhotoLife process for different flow rates.

 ,
, 


