Abstract
The objective of this study is to assess the technical and economic potential of four alternative processes suitable for post-combustion CO2 capture from natural gas-fired power plants. These include: CO2 permeable membranes; molten carbonate fuel cells (MCFCs); pressurized CO2 absorption integrated with a multi-shaft gas turbine and heat recovery steam cycle; and supersonic flow-driven CO2 anti-sublimation and inertial separation. A common technical and economic framework is defined, and the performance and costs of the systems are evaluated based on process simulations and preliminary sizing. A state-of-the-art natural gas combined cycle (NGCC) without CO2 capture is taken as the reference case, whereas the same NGCC designed with CO2 capture (using chemical absorption with aqueous monoethanolamine solvent) is used as a base case. In an additional benchmarking case, the same NGCC is equipped with aqueous piperazine (PZ) CO2 absorption, to assess the techno-economic perspective of an advanced amine solvent. The comparison highlights that a combined cycle integrated with MCFCs looks the most attractive technology, both in terms of energy penalty and economics, i.e., CO2 avoided cost of 49 $/tCO2 avoided, and the specific primary energy consumption per unit of CO2 avoided (SPECCA) equal to 0.31 MJLHV/kgCO2 avoided. The second-best capture technology is PZ scrubbing (SPECCA = 2.73 MJLHV/kgCO2 avoided and cost of CO2 avoided = 68 $/tCO2 avoided), followed by the monoethanolamine (MEA) base case (SPECCA = 3.34 MJLHV/kgCO2 avoided and cost of CO2 avoided = 75 $/tCO2 avoided), and the supersonic flow driven CO2 anti-sublimation and inertial separation system and CO2 permeable membranes. The analysis shows that the integrated MCFC–NGCC systems allow the capture of CO2 with considerable reductions in energy penalty and costs.
1. Introduction
CO2 capture and storage (CCS) is among the key low-carbon technologies required to reduce power plant-related CO2 emissions in an economically sustainable way [1]. To accelerate the pace of deployment, several R&D institutions, industrial technology providers and operators are currently pursuing R&D programs and activities aimed at reducing the CO2 avoidance cost, while demonstrating and improving the commercial maturity of various CCS technologies [2,3].
One of the most established programs in this field is the CO2 Capture Project (CCP) [4,5], a partnership of major energy companies, which has now entered the fourth phase, CCP4. Within the framework of CCP4, the post-combustion capture of CO2 from natural-gas-fired combined cycles (NGCCs) is a key R&D area. This paper presents the outcome of a preliminary study aimed at assessing the potential techno-economic advantages of novel post-combustion technologies, and benchmarking their performance against conventional technology, namely post-combustion capture by monoethanolamine (MEA). In addition to this, to give a broader perspective to the analysis, a comparison against an advanced solvent technology, aqueous piperazine (PZ), which could be considered as a prospective benchmark, is also made.
Even though CO2 capture technologies based on amine solvents have been recently demonstrated in full or relevant-scale power plants [6], their high CO2 avoidance cost still remains a significant limitation to the largescale adoption of CO2 capture and storage (CCS) in the field of power generation [7]. This has spurred the development of different innovative technologies with the objective of improving performance and/or reducing costs [8]. Examples of such technologies are supersonic, flow-driven anti-sublimation [9], membranes [10], capture from pressurized combustion [11] and molten carbonate fuel cells (MCFCs) [12,13].
Balepin and Castrogiovanni [14] and Castrogiovanni [9] proposed a process aimed at exploiting the supersonic acceleration and expansion of flue gas to separate the CO2 as a solid phase. This concept is not completely new in the field of gas purification, since a similar system has been recently designed and installed for natural gas conditioning [15]. Nevertheless, its application as a post-combustion CO2 capture technique is new, and entails different design and operating conditions. According to the patent of Balepin et al. [16], flue gas can be derived either from natural gas or coal combustion, and CO2 is captured via anti-sublimation, followed by inertial separation, both resulting from the supersonic expansion of the gas mixture. The core equipment unit of the whole process is named as the “Inertial CO2 Extraction System”, and consists of a De Laval nozzle followed by a diffuser [9]. The system is currently being tested and developed, at the bench scale, by Orbital ATK and ACENT Laboratories. Dehydrated flue gas, previously pressurized, enters the convergent tube section (subsonic nozzle) of the CO2 extraction system, and passes through a throat designed to achieve sonic conditions. This is followed by a divergent tube section (supersonic nozzle), where the expansion occurs, and supersonic velocities and very low temperatures and pressures are achieved. As a result, the CO2 freezes into solid particles, which are collected towards the internal wall of the tube, as a result of the combination of swirl (i.e., the non-negligible tangential velocity component provided at the tube entrance through vanes) and higher density of the solid phase. Then a cyclone removes the collected particles, such that the remaining gas stream is decarbonized. At the end of this section, another convergent tube (supersonic diffuser) followed by a sonic throat and a divergent tube (subsonic diffuser) discharge the CO2-depleted flue gas at nearly atmospheric pressure. In both the diffusers, deceleration provides pressure recovery and temperature increase. According to the developers [9], the main advantages of the technology are: (i) the very reduced footprint compared to an amine plant of similar capacity (with potentially less than half of the area required for the installation of the whole system); (ii) the attractive energy penalties and cost of CO2 avoided, estimated to be near to 50 $/tCO2 avoided (tCO2 stands for metric ton of CO2 as in the rest of the paper) for the application of the technology to a coal-fired power plant.
Another promising technology for the post-combustion capture of CO2 from NGCCs is selective membranes. Merkel et al. [10] proposed the use of polymeric CO2-permeable membranes, by introducing the concept of “selective flue gas recirculation”. The flue gas discharged from a combined cycle is cooled down to near ambient temperature, removing most of its water content, then compressed to a moderate pressure (1.1–3 bar) and fed to a first membrane separator for CO2 capture. With a cross-flow configuration, this device produces a stream of highly concentrated CO2, based on the selectivity of the membrane. However, the membrane does not completely remove the CO2, so a significant amount remains in the flue gas, which is fed to a second membrane separator. This second stage utilizes the turbine combustion air as a sweep gas to achieve removal of almost all of the remaining CO2.
After the second separation stage, the CO2-depleted flue gas, optionally expanded in a turbine, is discharged into the atmosphere. The stream of CO2-enriched air, with a CO2 content in the range 8.8–16.2% mol, is used as an oxidant in the gas turbine. The benefits of the selective flue gas recirculation are: (i) the concentration of CO2 in the flue gas is increased, which reduces the energy penalty for its capture; (ii) the excessive dilution of the air stream at the inlet of the gas turbine that occurs with conventional flue gas recirculation is avoided, since the use of a CO2-selective membrane minimizes the recycle of other species than CO2. In particular, (ii) is the crucial aspect of this approach, which makes possible recirculating a high flow rate of CO2, increasing the CO2 in the flue gas from 4% to 15–20% on a molar basis, while keeping the concentration of O2 in the CO2-enriched air, high enough to be suitable for the normal, albeit off design, operation of the gas turbine, without entailing any significant modification in its design.
Christensen et al. [11] recently proposed a method to remove the CO2 from NGCC flue gas while it is still at high pressure. In the proposed scheme, a multi-shaft gas turbine, namely the GE LMS100 model [17], is split into a gas generator providing a pressurized stream of flue gas at high pressure and temperature (8 bar and 800 °C), and a final expansion stage. Normally, the hot, high pressure combustion gases are directly expanded to generate power. Instead, the hot stream is cooled by generating steam in a heat recovery steam generator (HRSG) for a recuperative steam cycle, which produces a significant portion of the electrical power of the overall plant. In an alternative configuration [11], a pressurized natural gas-fired boiler heats up the hot gases, ahead of the heat recovery process, while increasing the CO2 concentration up to 9% mol. In either case, a pressurized solvent-based capture unit decarbonizes the flue gas, which is then heated via waste heat recovery, and finally expanded to atmospheric pressure to generate additional electric power. The capture unit is a hot potassium carbonate solvent-based Benfield absorption scheme designed and licensed by Honeywell UOP [18], but other solutions favored by the high CO2 partial pressure may be envisaged. The developers report that the main advantage of this scheme are: (i) the high CO2 partial pressure at the inlet of the CO2 capture section, which should reduce the energy penalty due to capture; (ii) the more compact size of the HRSG and of the CO2 capture section due to higher pressure; (iii) the maturity of the technology, which involves only conventional units, i.e., the LMS100 gas turbine, the well-known Benfield process and a Heat Recovery Steam Cycle. Compared to other solutions, this technology is readily implementable as a short-term CCS option, with limited investment required for research costs.
Molten Carbonate Fuel Cells (MCFCs) are direct fuel conversion systems, which can be efficiently exploited as active CO2 separators and electricity generators. The concept of using MCFCs as CO2 concentrators relies on their capability to transfer CO2 as an oxygen carrier, in the form of carbonate ions (CO32−), from the cathode to the anode side, where CO2 is concentrated as a result of both this mass transfer and fuel oxidation. In more detail, at the cathode, O2 and CO2 molecules form carbonate ions (½O2 + CO2 + 2e− = CO32−) as a result of a catalytic reaction promoted by the nickel oxide (NiO) cathode [19]. These ions, produced on the porous surface of the cathode, are then transferred through a selective membrane, where the electrolyte (a liquid potassium/lithium carbonate electrolyte retained in an LiAlO2 ceramic matrix) conducts the ions to the anode. At the anode, CO32− ions react with hydrogen, producing water and carbon dioxide (CO32− + H2 = CO2 + H2O + 2e−). For each CO32− ion transferred through the fuel cell membrane, two electrons flow externally in the opposite direction, generating a current flow. As a consequence of these electrochemical phenomena, a certain amount of CO2 is removed from the cathode stream of the MCFC (the removal efficiency depends upon the CO2 utilization factor, which is in turn related to the MCFC area and operating conditions), and is then concentrated in the gaseous effluent exiting the anode side. The anode effluent contains water and unconverted CO/H2 syngas (produced by CH4 reforming within the cell) in addition to CO2. The CO2 can easily be removed from the CO/H2, which is recycled for fuel use, in a Gas Processing Unit (GPU). One of the most interesting advantages of MCFCs is that their operating temperature, close to 650 °C, closely matches with the exhaust conditions of heavy-duty gas turbines (GTs), making their process integration easier.
Moreover, nickel surfaces within the fuel cell catalyze the internal fuel reforming of the natural gas (NG) feed. The use of MCFCs as CO2 capture devices has been widely studied for applications in coal power plants, IGCCs, NGCCs and other industrial applications [12], showing the potential for high capture rates with limited energy penalty, especially in the NGCC case. The MCFC can be positioned between the gas turbine (GT) and the heat recovery steam generator (HRSG) of the modified NGCC, and the bottoming steam cycle can increase its output compared to the reference NGCC by exploiting not only the waste heat from the GT flue gases, but also the one from the MCFC anodic stream [12]. In this configuration, the MCFC could capture up to 80%–90% of the total CO2 released by the fuel combustion, and could increase the electric output of the power plant by around 25% [20]. Various configurations of MCFCs combined with NGCCs for CO2 capture purposes have been recently studied by the authors [21], where the impact of major operating conditions, of the utilization factor and issues such as the MCFC ability, to be used in retrofit applications, are considered.
Currently, the main issues with the use of MCFCs are reliability (tests are still ongoing to prove 10 years’ operation for 1.4 MWel stacks), their limited availability (latest installations [22] are targeting 8000 equivalent hours per year with 95% availability), and costs which are difficult to predict, because there is not yet a mature market (Ahmed et al. [23] report around 2000 $/kWel expected for a 5 MWel annual production of MCFCs, projected to reduce to 1250 $/kWel if the annual production demand increases to 50 MWel).
Preliminary estimates released by FCE [24], the largest MCFC manufacturer, and focused on CCS from coal, report a cost of CO2 avoided lower than 40 $/tCO2 avoided.
The study reported in this paper focuses on CO2 capture from flue gas produced from natural gas sources, is funded by the CCP and carried out by a group of LEAP (Laboratorio Energia e Ambiente Piacenza) and GECOS (Group of Energy Conversion Systems)—Politecnico di Milano researchers, together with the CCP team. This work originates from the preliminary study reported by Forsyth et al. in 2017 [25], and focuses on the preliminary assessment of the following four promising technologies for post-combustion CO2 capture from NGCCs:
- CO2 permeable membranes (MEMs)
- Molten Carbonate Fuel Cells (MCFCs)
- Pressurized CO2 absorption integrated with multi-shaft gas turbine and Heat Recovery Steam Cycle (HPS)
- Supersonic, flow-driven CO2 anti-sublimation and inertial separation (SSD)
Compared to the introductory work by Forsyth et al. [25], this paper provides the following novel contributions:
- the assessed technologies are described in more detail, and their potential and limitations have been highlighted;
- a new configuration has been considered for the MCFC, coherently with the findings of Spinelli et al. [21];
- the whole techno-economic analysis is more comprehensive (with multiple configurations and cases reported for each technology), including a fully detailed performance assessment (based on the SPECCA index) and costing methodology.
Figure 1 depicts the CO2 capture concept at the basis of each of the novel technologies evaluated.
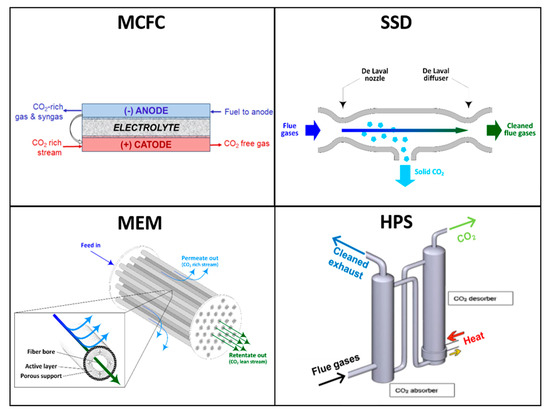
Figure 1.
Conceptual representation of the CO2 capture processes behind the four technologies evaluated in this study.
The paper is structured as follows. First, the technical and economic framework for the comparative analysis is presented in Section 2, which also reports a description, performance and costs figures for the reference NGCC without and with CCS. Section 3, Section 4, Section 5 and Section 6 describe in detail the process flow diagram and modeling approach followed to evaluate each of the four novel technologies. Section 7 and Section 8 outline and compare the performance and costs of all the schemes evaluated. Finally, in Section 9, conclusions are drawn.
2. Technical and Economic Framework
Accurate process models (built in Aspen Plus® v8.8 [26], Thermoflex® v24 [27] and GS [28]) are used to make a systematic assessment of the energy and economic performance of the four technologies. The key performance data needed to correctly model the equipment units have been provided by the main technology providers, or assumed based on the engineering knowledge of the industrial and scientific partners of the project. The most significant cost and performance assumptions, for which no industrial feedback or literature data are available, are highlighted and discussed in the process modeling and results sections. The purpose of this high-level evaluation is to perform a consistent comparison between alternative options, while providing suggestions on how to further develop the technologies and improve their integration with natural gas-fired power plants.
The baseline system of this study is the Natural Gas Combined Cycle described in the CCS European Benchmarking Task Force report [29], which is thought to be representative of the state-of-the-art of this power generation technology. The European Benchmarking Task Force (EBTF) document [29] reports the main technical assumption of the EBTF-NGCC (named NGCC w/o capture).
2.1. Methodology for Performance Evaluation
The large-capacity, high efficiency gas turbine-based combined cycle, NGCC w/o capture, is designed to generate 830 MWel of net electric power at full load, and features a net electric efficiency of 58.30% on a Lower Heating Value (LHV) basis. This comprises two “F class” gas turbines combined with two triple-pressure-level Heat Recovery Steam Generators (HRSGs) and one steam turbine.
The performance and the detailed design features (e.g., turbine geometry, cooling system, etc.) of the GTs have been calculated with the detailed expander model described by Chiesa and Macchi [30], and consistency is achieved with the CCS European Benchmarking Task Force report [29] as the same GT model and assumptions are adopted. Given the R&D efforts needed to modify the design of a GT, the GT geometry is kept fixed throughout the whole study. Thus, when necessary, the off-design performance of the EBTF gas turbine was assessed with the detailed model proposed by Chiesa and Macchi [30]. This off-design calculation of the GT performance was necessary for the schemes involving flue gas recycle, i.e., those with the membranes. The control strategy adopted for off-design operation uses the compressor VIGV (Variable Inlet Guide Vanes) to adjust the inlet mass flow rate of air, while maintaining the turbine inlet temperature at the design condition. This control strategy allows the maximization of the turbine electrical efficiency. Assuming that there is sufficient margin in the compressor load to prevent a stall in the compressor stages, the gas turbine is able to work at the same pressure ratio as the design condition (operating without flue gas recycle). For the cooled expansion, the necessary cooling flow rates have been calculated so as to keep the same blade metal temperature. These minor adjustments of the cooling flow rates compared to the design condition can be easily performed in practice, without redesigning the GT cooling system (e.g., by just tuning the control valves placed on the cooling flow circuit). The same HRSC (HRSG and steam turbine) configuration as the EBTF study has been considered. However, the HRSC performance has not been calculated in the off-design mode. Being a green-field plant, the HRSG tube banks, steam turbine and condenser are re-sized for each plant scheme. The HRSC performance has been calculated with the GS code and the model by Chiesa and Macchi [30].
Three of the four novel technologies (i.e., MEM, MCFC and SSD) assessed in this work are based on the same GT set of the NGCC w/o capture case, and they include an HRSC as well. The only exception is the high-pressure solvent (HPS) absorption case, where the GE LMS100 GT has been adopted, since the HPS case requires an inter-cooled, multi-shaft GT.
For the NGCC equipped with CCS, a base case is defined by introducing a CO2 capture section featuring 30% w/w MEA solvent absorption downstream of the EBTF NGCC. Again, the process assumptions and performance results are taken directly from Anantharaman et al. [29]. The steam for solvent regeneration and CO2 stripping is extracted from the steam turbine ahead of the low-pressure section. The major CO2 capture equipment is completed by an electric-drive compressor to deliver CO2 at high pressure ready for pipelining and subsequent geological sequestration or enhanced oil recovery. The assumptions for the NGCC baseline are reported in Table 1. The purity specification for the captured CO2 stream is shown in Table 2.

Table 1.
Key Assumptions for the performance evaluation of the natural gas combined cycle (NGCC) baseline.
Table 2.
Product CO2 specification for Enhanced Oil Recovery (EOR) applications.
While MEA can be considered a widely established and mature solvent for post-combustion CO2 capture, its role as a benchmark could be replaced in the near future by other advanced chemical solvents, with improved energy performance, hopefully lower CAPEX and hence lower CO2 avoidance costs. For this reason, in order to put this study in perspective, in addition to MEA, which represent the present benchmark, we consider also piperazine (5 molal solution in water), which is among the most promising, advanced, new generation solvents that have already achieved a significant development level (since it has been tested for several hours at pilot scale by Rochelle’s group at University of Texas, [31]). Even though piperazine solvent costs more than MEA [32], and attention must be paid to select the appropriate solvent loading to avoid solid formation in the absorber [33], aqueous piperazine has the capability for setting a new standard for post-combustion capture, due to the following advantages [33]: better energy performance, more favorable absorption rates, higher resistance to thermal and oxidative degradation and lower volatility.
Therefore, the following baseline configurations without and with CCS were defined:
- The Reference plant is the natural gas combined cycle without capture (NGCC w/o capture) described in Figure 2a (refer to the EBTF report [29] for more details)
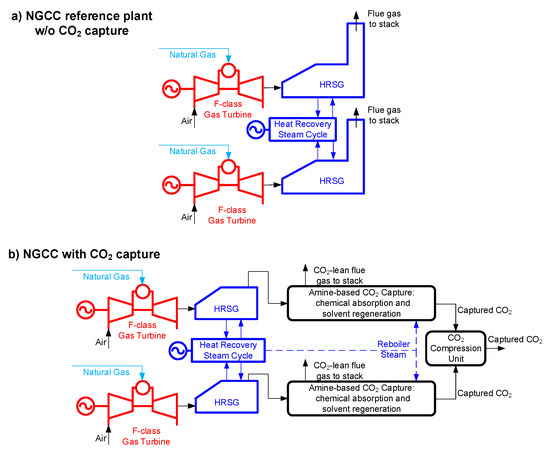 Figure 2. Block-flow diagram of: (a) the Reference plant without CO2 capture and storage (CCS); (b) the natural gas combined cycle (NGCC) with CO2 capture (this general scheme applies both to the Base plant and to the Advanced-piperazine (PZ) plant).
 - The Base plant is the NGCC with MEA-based capture (NGCC + MEA) arranged according to the block-flow diagram of Figure 2b (refer to the EBTF report [29] for more details)
- The Advanced solvent reference is the NGCC with the Advanced-PZ-based capture, featuring aqueous piperazine (PZ) in place of MEA as post-combustion chemical solvent technology, arranged according to the block-flow diagram of Figure 2.b (refer to Conversano et al. [34] for more details).
According to the EBTF report [29], when MEA-based capture is added, the consequence is a 77 MWel decrease in the gross power output of the steam turbine, due to steam extraction for solvent regeneration, and the net electric power produced is further penalized by 43 MWel, which is the parasitic electric consumption for CO2 capture and compression. The overall impact of CCS with MEA is a reduction in the net power output by 120 MWel compared to the NGCC reference plant without CCS, and the overall effect on the net electric efficiency of the plant is a decrease from 58% to 50% (LHV basis). This is reported in Table 3.
Table 3.
Performance of a European Benchmarking Task Force (EBTF) plant without capture, versus monoethanolamine (MEA) or PZ-based capture.
The configuration selected for PZ (“Advanced-PZ”) is based on the advanced absorber scheme (i.e., without a Direct Contact Cooler ahead of the absorber) proposed by Zhang et al. [35], and it is described, simulated and assessed from a techno-economic point of view in the paper by Conversano et al. (2018) [34], by following the same technical and economic framework adopted in this work. The results are summarized in Table 3. Compared with MEA, the PZ case has a higher net electric efficiency (+1.4 percentage points) resulting from two major advantages of PZ: (i) the lower specific heat of regeneration (2.74 vs. 3.96 GJ/tCO2 of MEA); (ii) the higher stripping pressure (i.e., 5.8 bar) which reflects into a lower consumption for CO2 compression compared to MEA (17.4 vs. 22.6 MWel).
The four novel CO2 capture technologies were simulated with specific modeling software selected based on the process type. SSD was simulated with Aspen Plus® [26], MCFC and MEM with GS [28], and HPS with Aspen Plus® [26] and Thermoflex® [27]. The key general assumptions are outlined in Table 4, while details on process modeling and specific assumptions are described in Section 4, Section 5, Section 6 and Section 7. The energy and mass balances calculated for each novel technology flowsheet were used to determine the energy and economic performance of the overall plant.
Table 4.
Key assumptions for the evaluation of novel capture technologies.
The performance summary tables also report net power output, net electric efficiency, specific CO2 emissions and the Specific Primary Energy Consumption for CO2 Avoided, defined as (Equation (1)):
where η denotes the net electric efficiency and E the specific CO2 emission rate [kgCO2/MWhe] of the plant. Subscript “REF” refers to the indices of the reference plant NGCC w/o capture, whereas “CCS” refers to the NGCC equipped with the CO2 capture technology under investigation.
2.2. Methodology for Cost Estimation
For each technology under assessment, we estimate the cost according to a “bottom-up” approach, where the total plant cost is broken down, and is related to the equipment items that build up the overall system. This approach reflects the methodology proposed by the EBTF [29], CCP3 [36] and several other research groups [13]. The methodology entails the following steps: (i) break-down the power plant into basic equipment units or plant subsections; (ii) assume a sizing and cost model for each item defined in (i); (iii) add installation costs, indirect costs, escalation and contingencies; (iv) compute the operating costs, the First Year Cost of Electricity (COE) and the Cost of CO2 avoided (CCA).
The overall capital expenditure required to build the plant on a green-field basis is the Total Plant Cost (TPC). After dividing the power plant flowsheet into relevant subsystems, i.e., equipment units or subsections, the Total Equipment Cost (TEC) of each subsystem is calculated. For each piece of equipment, the TEC is calculated, after equipment sizing, according to the well-known power-law relationship (Equation (2)):
where TEC is the actual cost, S is the actual size, and f is the scale factor. S0 and C0 are the appropriate reference size and cost for the component.
Table 5 reports the equipment costs and references adopted for the Base and Reference cases. All the values coming from different sources have been reported to the same year (2014) by means of the Chemical Engineering Plant Cost (Escalation) Index (CEPCI) [37], while a 1.329 $/€ exchange rate has been assumed (average value for year 2014).
Table 5.
References for Total Equipment Cost (TEC) evaluation of the reference NGCC.
For the novel technologies, when standard equipment units are considered (e.g., compressors, turbines, pumps, shell and tube heat exchangers, etc.), cost assumptions are made either in agreement with the current industrial state-of-the-art or using Thermoflex® and its cost database PEACE®. Costs of unconventional pieces of equipment were tentatively estimated as described for each technology in Section 4, Section 5, Section 6 and Section 7.
Once the TEC is computed, the installation costs, indirect costs, owner costs and contingencies are estimated using multiplication factors defined by combining the authors’ experience and authoritative reports, such as that of the National Energy Technology Laboratory (NETL) [38,39] and the International Energy Agency (IEA) [40,41]. The location considered in the evaluation of these costs is Western Europe (a site without any special issues that would alter installation/indirect costs).
Therefore, once the TEC is known, the TPC can be calculated as follows:
- Installation cost (INST), which accounts for piping, erection, Outside Battery Limits equipment, etc.
- Indirect Cost (IC), which accounts for yard improvement, service facilities, buildings, engineering, etc.
- Engineering, Procurement and Construction (EPC) cost, which includes both Direct and Indirect Costs:
- Owner’s Cost and Contingencies (OCC), which accounts for plant planning, commissioning and contingencies.
- Total Plant Cost (TPC)
The values assumed for the coefficients A, B and C are reported in Table 6. The power section (i.e., the NGCC) and the CO2 Removal Section feature different levels of design and capital cost uncertainty, since NGCC plants are technologically mature, whereas CCS plants are not. For this reason, in this work we make a distinction between the “Power section” and the “CO2 removal section”, and the coefficients A, B and C of the latter are significantly higher.
Table 6.
Coefficient for Total Plant Cost assessment.
Once the TPC is calculated, the First Year Cost of Electricity (COE) is calculated, in line with the CCP methodology described in the CCP book [36], Chapter 4, and according to the financial assumptions of Table 7.
Table 7.
Financial assumptions.
The CCA is determined as follows:
This cost estimate methodology is meant to reflect industry standards. However, the assessment does not include any risk premiums or contingencies related to the construction of a demonstration or first-of-a-kind plant, which might be required for first commercial CCS projects.
Based upon these assumptions, the capital and operating costs of the reference and base case were estimated.
For the base plant of this study, the specific total plant cost (i.e., TPC of the full plant with NGCC + MEA units + CO2 compression and dehydration system) was assumed equal to an average value of 2181 $2014/kW, a figure aligned with the estimates of the most authoritative industrial references [38,42,43].
The capital cost increase from the “reference” to the “base” plant is nearly 75% (TPC increases from 879 M$ to 1548 M$), and the Cost of CO2 avoided is 75 $/tCO2 at a CO2 capture rate of 90%. These results, which exclude CO2 transport and storage charges (as all other CCA estimates in this paper), are comparable with the results of similar analysis reported by the US DOE NETL [38] and the IEAGHG [42].
On the other hand, for the Advanced-PZ-case considered in this paper, Conversano et al. [34] have estimated a Cost of CO2 avoided of 68 $/tCO2 at a CO2 capture rate close to 90%, with a TPC of 1516 M$2014 and a specific total plant cost of 2079 $2014/kW.
3. CO2 Permeable Membranes
Polymeric membrane technology has been widely employed for CO2 separation from natural gas or biogas. Typical conditions for the application of these membranes are pressurized natural gas or biogas streams containing more than 10% CO2 on a molar basis [44]. By contrast, post-combustion CO2 capture from NGCCs flue gases is more challenging compared to natural gas purification or biogas upgrading, since it involves a more CO2-diluted stream, starting from close-to-atmospheric pressure.
The scheme proposed by Merkel et al. [10] and shown in Figure 3 has been assessed. In this configuration, the NGCC (reported as gas turbine and HRSC in Figure 3) is the same as from the base case (i.e., two F-class GTs and one steam turbine), while the membranes act as a post-combustion CO2 separation technology. CO2-permeable membranes are used in the CO2 capture process to pursue three goals: to carry out a selective recycle of CO2-enriched air to the gas turbine intake; to separate a CO2-concentrated stream from the CO2-enriched flue gases discharged by the HRSG; and as a final CO2 recovery step from the off-gas stream released by the CO2 purification section. In the case considered in this paper, the pressure conditions proposed by Merkel et al. [10] are employed for the CO2 capture membrane: the pressure ratio is set to 10, with a feed pressure of 3 bar and a permeate pressure of 0.3 bar (i.e., sub-atmospheric) controlled by a vacuum pump.
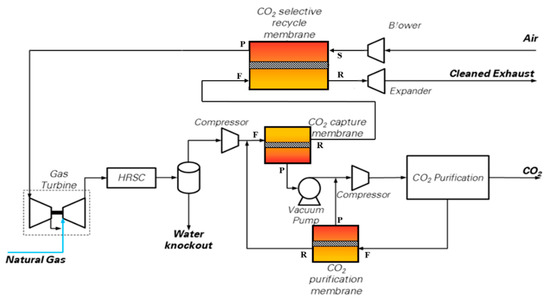
Figure 3.
CO2 capture scheme using CO2 permeable membranes. Nomenclature of membrane inlet/outlet streams: F = Feed; P = Permeate; R = Retentate; S = Sweep.
The following process schemes have been studied and evaluated:
- MEM-0: a scheme very similar to the original one published by Merkel et al. with only one minor difference: the retentate stream coming from the CO2 purification membrane is sent downstream of the main flue gas compressor (and not upstream of the water knock-out), as shown in Figure 3. This saves some compression power. The membrane area has been adjusted to reach a high CO2 removal rate, i.e., 94% CCL.
- MEM-1: same configuration as MEM-0 but with a smaller membrane area, adjusted to reach 90% CCL.
- MEM-2: same configuration as MEM-0 scheme, but featuring lower pressure levels for both the feed (1.7 bar) and the backpressure of the capture membrane (0.2 bar). This design explores the performance and economics trade-offs between membrane feed pressure and membrane area. The membrane area has been adjusted to reach 94% CCL.
- MEM-3: same as option MEM-2, but featuring a smaller membrane area, reduced so as to reach a CCL equal to 90%.
Hence, one of the goals of this analysis is to understand whether there are economic benefits (i.e., lower CO2 avoidance costs) from increasing the CCL from the target value of 90% reported by [10].
As a consequence of the selective recirculation of CO2 to the GT compressor inlet, the EBTF gas turbine is set to operate in off-design via the regulation of compressor VIGV, to adapt the machine to the variation in air mass flow-rate compared to the design conditions. Hence, the GT performance change was considered and modeled in off-design operation with the GS code [28]. The HRSG and steam cycle configuration/design, ambient temperature, cooler exit temperatures, condensing temperature of the steam cycle and the refrigerator, were changed to align the assumptions with the EBTF study. The HRSG and steam cycle are specifically redesigned for the resulting gas composition, temperature and mass flow rate. The CO2 purification unit is based on a multistage, intercooled compressor which brings the CO2 extracted by the vacuum pump to 27 bar, followed by a dryer and a low-temperature phase separator working at −30 °C; the phase-change temperature is reached via an external refrigerator; the liquid CO2 produced by the separator (stream CO2 in Figure 3) is pumped at 110 bar for subsequent delivery, while the gas phase (stream F in Figure 3) is recycled to the CO2 purification membrane.
4. Molten Carbonate Fuel Cells
The MCFC power island has been integrated with the baseline NGCC, as depicted in Figure 4. Fuel Cell Energy, a leading technology provider of MCFC technology, provided guidance on the MCFC equipment, performance, operating conditions, and costs assumed in this paper. More details can be found in [21]. As shown in Figure 4, the anode of the MCFC is fed with a mixture of natural gas, recycled unconverted fuel and steam, which undergoes an internal reforming process. Natural gas and the unconverted fuel are first pre-heated up to 300 °C, sent to the zinc-oxide unit for the removal of sulfur components [45], and then heated to the inlet temperature of the MCFC-anode (450 °C) via direct mixing with superheated steam (565 °C) bled from the LP superheater of the steam cycle. In the proposed configuration, the MCFC is placed between the gas turbine and the heat recovery steam generator (HRSG), and separates the CO2 from the high-temperature GT exhausts that are directly fed to the cathode side of the fuel cell at a temperature of 608 °C.
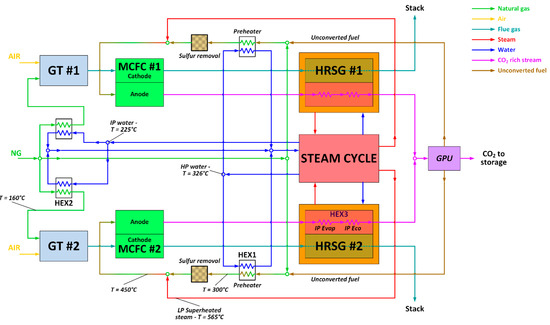
Figure 4.
Process flow diagram of the NGCC–MCFC integrated plant.
This technical choice minimizes the energy penalty associated with the CO2 capture section, because the cathode reactants (GT exhausts) do not need to be pre-heated up to the MCFC’s working temperature, and the waste heat released by the fuel cell is recovered for steam production in the HRSG. The GT model and operating conditions are exactly the same as the base case, while the steam cycle and the HRSG are newly-designed to manage the larger amount of thermal power to be recovered downstream of the MCFC compared to the NGCC baseline.
Therefore, this MCFC–NGCC integrated scheme should exploit synergies between the MCFC and NGCC integration, and it is expected to feature improved thermodynamic performance relative to either of the stand-alone MCFC and NGCC power plants with post-combustion capture. In this CCS arrangement, the anode exhaust, a CO2-rich flow containing the unconverted H2/CO stream, first generates steam in the HRSG, and afterwards is processed in the Gas Processing Unit (GPU) section, where CO2 is separated from the fuel stream via the cryogenic, auto-refrigerated process described by Spinelli et al. [21]. The unconverted fuel, separated as a vapor phase by the GPU, contains nearly all of the H2 and CO released at the anode, some CH4, and also a residual amount of CO2, and is subsequently recycled back to the fuel cell anode. In this way, all the fuel introduced in the fuel cell is eventually converted into electricity. As a result, the overall fuel utilization factor approaches 100%, even though the single-pass utilization factor across the MCFC anode is 80%. The anode-side heat recovery section has been designed with the aim of preventing metal dusting, which may damage carbon steel surfaces, affecting the durability of the heat recovery section [46,47]. To avoid this metal dusting, the mixture of CO2 and unconverted fuel leaving the MCFC anode is cooled down to a temperature of 125 °C by raising IP steam at a temperature of 254 °C (@35 bar). The high heat transfer coefficient of this quench boiler ensures a wall temperature lower than 350 °C, which is generally recognized as a safety limit to prevent metal dusting.
To reduce the MCFC active area and the related investment cost, the fuel cell is here assumed to operate with a current density of 1500 A/m2. The cell is simulated with the GS software, and its voltage and performance are calculated by means of an ad hoc correlation developed on the basis of experimental results at FCE laboratories, where a fuel cell test rig (single cell with an active layer of 250 cm2) has been tested over a wide range of current densities (from 800 up to 1600 A/m2) using NGCC flue gas and other combustion effluents (CO2 concentration ranging from 4% to 20% on a molar basis) as cathode reactants [48].
This correlation computes the Nernst voltage as a function of the average partial pressures of the anode/cathode reactants and of their average temperature. In addition, voltage losses are also evaluated as a function of the composition of the reactants, temperature and current density, which strongly influences the ohmic resistance of the fuel cell. The anode is fed with a mixture of natural gas and recovered syngas, to which is added sufficient steam to achieve the S/C ratio equal to 2. As stated above, the amount of fuel converted in a single pass of the MCFC (UF) is set equal to 80%, while the CO2 utilization factor is limited in order to leave a CO2 molar concentration equal to 1% at the cathode outlet to limit concentration overpotential losses inside the MCFC. Long-term, experimental tests have proven the MCFC capability of reaching such a low CO2 concentration at the cathode outlet, as reported in the work by Ghezel-Ayagh et al. [49] in 2017. During these trials, the cathode of a short MCFC stack has been fed with coal combustion effluents (13.5%mol CO2 at the cathode inlet), and the CO2 utilization has been kept constantly higher than 90% (hence corresponding to a CO2 concentration at the cathode outlet close to 1% on a molar basis). Furthermore, the flux of CO2 separated has been varied significantly from 100 up to 180 Ncm3/m2/s, where the upper value corresponds to current densities close to 1600 A/m2. According to [49], during the long-term experiment, no additional voltage losses (i.e., the polarization curve remains fairly constant over time) or significant material degradation were observed; however, during this test campaign, the short stack was operated with a low current density (~1000 A/m2) for most of the runtime (~8000 h of the total 16,000 h). Hence, further long-term, experimental activities should be dedicated to demonstrating the durability of MCFC materials, as well as the stable operation without significant performance degradation, when both high current densities and high CO2 utilizations are selected as design parameters. A sensitivity on the impact of the CO2 utilization factor on performance and costs has been carried out by Spinelli et al. [21].
In the present work, given that the MCFC cathode processes the CO2 from gas turbine flue gases (@3.98% CO2, 12.39% O2), the obtained CO2 utilization is 75.9%. The oxygen utilization (UO2 = 12.1%) is a direct consequence of the assumption on CO2 utilization, because each mole of CO2 transferred from the fuel cell cathode to the anode involves the permeation of 0.5 mol of oxygen, due to the formation of the CO32− ion. In this operating condition, the resulting MCFC voltage is 0.7 V, and this determines the waste heat released by the electrochemical process, which is partially exploited to drive the internal natural gas reforming. Because of this energy balance, the anode and cathode streams leave the fuel cell at a temperature of 652 °C, and are both used for steam production in the HRSC.
5. Pressurized CO2 Absorption Integrated with Multi-Shaft Gas Turbine and Heat Recovery Steam Cycle (HPS)
A possible method to tackle the low concentration of CO2 in NGCC exhaust gases is to remove the CO2 from the flue gas, via solvent absorption, while still pressurized, i.e., before the final gas turbine expansion stage. This concept [11], shown in Figure 5, is based on a gas turbine which is split into a mechanically-balanced gas generator and a low pressure expansion section. Among the heavy duty GT sets available, the multi-shaft, intercooled GE LMS100 model is likely to be suitable for this purpose, since it is designed with a three-shaft structure, making it theoretically possible to be split into a gas generator (mechanically balanced) and a last expansion stage (LP-GT) which generates a net electric output of 105.6 MWel at ISO conditions [17].
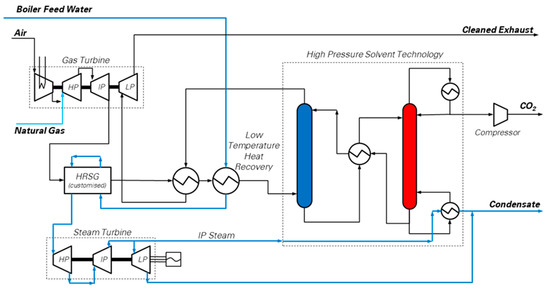
Figure 5.
Simplified process flow diagram of the pressurized CO2 solvent absorption integrated with multi-shaft gas turbine and Heat Recovery Steam Cycle (HRCS) [25]. The High Pressure Solvent Technology box is a simplified version of the CO2 capture unit based on hot potassium carbonate (detailed scheme reported by Christensen et al. [11]), aiming at highlighting the main connections of the power plant with the absorber (process column in blue) and the regenerator (process column in red). (Picture reprinted with permission from Elsevier, Energy Procedia, Vol 114, Jonathan Forsyth, Stuart Lodge, Stefano Consonni, Daniele Di Bona, Manuele Gatti, Emanuele Martelli, Roberto Scaccabarozzi, Federico Viganò, Evaluation of Five Alternative CO2 Capture Technologies with Insights to Inform Further Development, Pages 2599–2610, published under a CC-BY-NC-ND 4.0 open access user license (http://creativecommons.org/licenses/by-nc-nd/4.0/), Copyright 2017.)
The gas generator produces hot flue gas at 8 bar and 800 °C, and it is followed by a customized heat recovery cycle. Then, the CO2 capture section, based upon the well-known hot potassium carbonate process [18,50], decarbonizes the flue gas. Finally, the CO2-depleted flue gas, re-heated to 300 °C at the exit of the CO2 capture section, is expanded in the LP-GT to atmospheric pressure.
Two different configurations have been considered in this study:
- HPS-0a, which is based on the flowsheet of Figure 5, and does not include supplementary firing
- HPS-0b, which features supplementary firing in the pressurized heat recovery steam generator located downstream of the gas generator. The post-combustion configuration allows increasing the CO2 concentration in the flue gas.
The energy and mass balances of the HPS unit have been evaluated with detailed Aspen Plus® and Thermoflex® models. More specifically, the gas turbine performance has been simulated through Thermoflex®, which reproduced the performance of the commercial LMS100PA GT model, including the cooling flows of the expanders. The pressurized boiler and HRSC have been designed according to the EBTF guidelines [29] for advanced Ultra Super Critical steam cycles (USCs), to account for the large amount of thermal power transferred in the HRSG at high temperature (starting from nearly 800 °C). As a result, the steam cycle features regenerative water preheating up to 315 °C and requires very high steam turbine inlet temperatures and pressures, i.e., 300 bar and 600 °C, with reheat at 60 bar, in order to fully exploit the thermodynamic potential of the heat transferred in the HRSG.
The hot potassium carbonate solvent scrubbing system was not modeled and cost-assessed in detail, since reliable thermodynamic and transport properties for the solvent and the proprietary activator are not available in the public domain. Therefore, the following assumptions have been made in order to predict its performance:
- The net specific thermal consumption for solvent regeneration is 2.76 MJ/kgCO2 separated [50], supplied via LP steam extracted from the steam cycle cross-over at 6 bar.
- The specific electric consumption of the capture process is 308.3 kJ/kgCO2 separated. This is the average electric consumption of the process reported in the patent by Christensen et al. [11].
- The assumed process operating conditions are: absorption at 8 bar, 75 °C, CO2 capture level (CCL) of 90%, and captured CO2 made available at the top of the stripper at 1.5 bar for subsequent compression. The power consumption for CO2 compression has been simulated in Aspen Plus® according to EBTF assumptions.
6. Supersonic Flow Driven CO2 Anti-Sublimation and Inertial Separation (SSD)
The block flow diagram of the Supersonic flow-driven CO2 anti-sublimation process evaluated in this work is depicted in Figure 6. The scheme resembles those proposed in several studies [16,51,52,53,54]. The power island is the reference NGCC, which discharges the flue gas directly into the capture island. Here, flue gas is dehydrated through (i) bulk water condensation and removal in a cooler (operating at 28 °C) connected to a knock-out drum, followed by, (ii) deep water removal in a molecular sieve drier to achieve the target moisture content of 10 ppmv. Then, a train of inter-cooled compression stages bring the flue gas to the operational pressure required at the inlet of the supersonic extraction system, i.e., between 2 and 5 bar according to Balepin et al. [16]. A chiller may be optionally included to the purpose of precooling the gases while achieving CO2 separation with a lower compression ratio compared to the case without cooling. Finally, the “Inertial CO2 Extraction System” carries out the CO2 separation and makes available CO2 ready for compression, transport and storage, as well as decarbonized flue gas at conditions suitable for the stack.
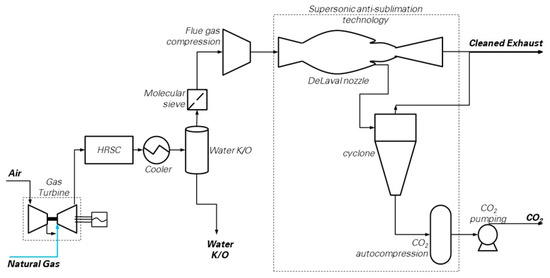
Figure 6.
CO2 capture by supersonic flow-driven deposition (SSD) [25]. (Picture reprinted with permission from Elsevier, Energy Procedia, Vol 114, Jonathan Forsyth, Stuart Lodge, Stefano Consonni, Daniele Di Bona, Manuele Gatti, Emanuele Martelli, Roberto Scaccabarozzi, Federico Viganò, Evaluation of Five Alternative CO2 Capture Technologies with Insights to Inform Further Development, Pages 2599–2610, published under a CC-BY-NC-ND 4.0 open access user license (http://creativecommons.org/licenses/by-nc-nd/4.0/), Copyright 2017.)
The performances of this plant (NGCC + SSD) have been estimated as follows. The NGCC section is identical to the reference case, and therefore produces 1330.6 kg/s of flue gas at 1.01 bar, 87 °C, containing 3.96% of CO2 on a molar basis (corresponding to 81.63 kg/s of CO2). The conventional equipment units of the capture section (namely, gas cooler, water knock-out drum and intercooled compressor) have been modeled in detail with Aspen Plus®, while the power consumption of the unconventional units (the molecular sieve drier and the auxiliary system for flue gas refrigeration) have been estimated through the assumptions reported in Table 4.
It is important to note that accurate modeling of the supersonic CO2 separator is extremely challenging for two main reasons: (i) the technology is still under development at the bench scale (TRL-4 according to the developers) [9], and its geometry, set up and balance of plant are likely to be modified in the future; (ii) within the device, a large number of complex physical phenomena occur, namely phase-transition in a multicomponent mixture with particles nucleation and growth, thermodynamic non-equilibrium effects, shock-waves, marked three-dimensionality of velocity and temperature profiles.
Several approaches have been proposed in the literature for the performance assessment of supersonic separators, and they can be classified as follows:
- (a)
- Detailed modeling and simulation of the system with a CFD and/or multi-physics approach [54,55,56];
- (b)
- High-level analysis of the system, assuming experimentally-measured performance as an input of the overall technology evaluation (see [51,57]).
Given the existing uncertainty on the configuration of the system, as well as the lack of relevant experimental data required for CFD model calibration, in this work a high-level analysis approach has been adopted. We have assumed the correlation between achievable CO2 capture level and inlet conditions (pressure and temperature) of the nozzle found by Hammer et al. [51]. However, the capture limits and operating conditions adopted in this paper were estimated by Hammer et al. (2014) [51] from process simulations based on a simplified model (assuming homogeneous phase-equilibrium), and should be taken as theoretical calculations, since they have not been confirmed with experimental investigation, yet. For instance, a report from Balepin et al. [58] discloses the most interesting experimental results, derived from a 3-years R&D project, involving several bench-scale test campaigns and process modeling activities aimed at investigating the potential of a “supersonic post-combustion Inertial CO2 Extraction System”. They tested flue gas with CO2 concentrations ranging from 2.1% to 9.9% on a mass basis, but without identifying a clear correlation between CO2 concentrations, inlet pressures, temperatures at the system inlet and achievable CO2 removal levels, the latter being quite variable during tests (half of the tests featured CCL > 50%, and only one third of the tests reported CCL > 80%).
Should relevant experimental data become available in the future, the accuracy of the performance analysis for this technology may be substantially improved.
Six different operating conditions have been considered by varying the inlet nozzle pressure and temperature within the theoretical ranges identified by Hammer et al. [51] and Sipocz et al. [57]. The matrix of the cases is reported in Table 8, together with the main performance assumptions. However, according to Castrogiovanni [9], the supersonic separator should include internal cold recovery (i.e., the solid CO2 is pressurized and then liquefied by supplying the thermal power removed from flue gas to be refrigerated) and a so-called “posimetric compressor”.
Table 8.
List of the Supersonic Flow Driven CO2 Anti-Sublimation and Inertial Separation (SSD) cases evaluated.
Due to the lack of data, no cold recovery has been considered, and it is assumed that the CO2 solid particles are adiabatically compressed from 0.1 to 10 bar as solids, then liquefied and adiabatically pumped to 110 bar in the liquid phase. This results in an overall electricity consumption for CO2 pumping of 13.2 kJ/kg of CO2 captured. The overall parasitic load for CO2 capture includes the following contributions: flue gas compressor power; electric consumption for heat removal from pre-, inter- and after-coolers (equal to 2% of the thermal load); electric consumption of the chiller (where required); electric consumption of the aforementioned solid and liquid pumps; electric consumption of drier auxiliaries, assumed equal to 4250 kWel/(twater removed/h) [1].
7. Results
7.1. CO2 Permeable Membranes
Table 9 summarizes the thermodynamic performance for the evaluated membrane-based options.
Table 9.
Summary of thermodynamic performance for membrane-based capture.
In terms of energy penalty for CO2 avoidance, membranes are not quite as good as the base case amines, since the SPECCA falls in the range between 3.4 and 4.3 MJLHV/kgCO2-avoided. As shown in the table, the thermodynamic penalty caused by the auxiliary power consumption of the membrane capture section is between 8.5% and 10.5% of the fuel input (LHV basis). This means that the net electric efficiency of MEM is always lower than 50%, and the increase of CCLs from 90% to 94% does not seem to provide significant benefits in terms of SPECCA, since larger membranes with greater pressure losses and higher auxiliary power are required. The most significant thermodynamic penalty items are flue gas compression (between 40% and 60% of the overall penalty) and subsequent CO2 purification and liquefaction within a dedicated GPU.
In addition to this, depending upon the application, an extra CO2 purification unit may be needed. For instance, if EOR applications are envisaged (see Table 2), the purity of the CO2 captured with membranes is out of the specifications, especially concerning the O2 content (reported in Table 10), which, in the analyzed cases, is two orders of magnitude above the 75 ppmv limit required for EOR. In this case, a more sophisticated purification system is required, hence affecting to some extent both the overall performance and costs, compared to the case calculated in this work.
Table 10.
Purities of relevant streams across the CO2 capture membrane and of the dense-phase CO2 purified by the cryogenic separation unit.
The economic analysis of cases MEM-1, MEM 2 and MEM-3 is reported in Table 11, whereas Table 12 provides the COE and the CCA. The equipment cost of the membrane module is assumed equal to 50 $/m2, i.e., the target value reported by polymeric membrane manufactures (Merkel et al., 2013 identifies 50–500 $/m2 as a realistic range). O&M costs assume that the membrane material is durable and capable of long service life (a full module replacement every 10 years has been assumed).
Table 11.
Main results of equipment cost assessment for membrane.
Table 12.
Membrane economic evaluation of membrane-based schemes.
In this paper, membrane calculations were based on a CO2 permeance of 2200 gpu across the membrane, and on the selectivities back-calculated from Merkel et al. [10] and reported in Table 13.
Table 13.
Membrane selectivity with respect to CO2.
The COE of membrane configurations (Table 12) lies in a range between 71 and 78 $/MWhel. MEM-1 is the configuration with the lowest CCA, i.e., 86 $/tCO2 avoided, due to a more compact EGR and CO2 membrane area. Cases with 90% CCL show lower CO2 avoidance costs compared to 94% CCL cases, which are affected by the higher cost of the CO2 capture and EGR membranes area. However, the membrane which produces the least efficient case is the EGR case, featuring areas one order of magnitude larger than the CO2 capture case.
7.2. Molten Carbonate Fuel Cells
The results of the MCFC integrated with NGCC are listed in Table 14. MCFC power is basically defined by the choice of the current density (1500 A/m2), and the mass flow rate of CO2 captured, which is almost 80% of the carbon introduced with the natural gas to fuel the gas turbine and the MCFC section. The selection of the current density defines the MCFC voltage (on the basis of the polarization curve) whereas the flow rate of the molecules of CO2 transferred from cathode to anode determine the total current circulating within the MCFC modules. As a result, the fuel cell has a capacity of 179.1 MWel. Most of the energy losses caused by the overpotential within the MCFC are recovered in the HRSC unit, because the waste heat released by the fuel cell is exploited for steam production within the HRSC. Therefore, the HRSC power output increases with respect to the baseline EBTF case, reaching a value of 306 MWel, whereas the overall power increases up to 983.4 MWel (+18.5%). Due to the high efficiency of the capture section, the SPECCA index reaches a very promising value (0.31 MJLHV/kgCO2 avoided), with a CO2 capture rate close to 80%. Interestingly, if the power consumption of CO2 purification and compression are excluded, the SPECCA index could become negative, with overall net electric efficiency exceeding the reference NGCC and CO2 avoided rate above the CO2 capture rate. Nevertheless, the gas purification unit is essential for the operation of the plant, not only for bringing the CO2-rich stream to the storage conditions, but also for recovering the unconverted syngas released by the MCFC anode. If the system was operated without the auxiliary flash separation, the fuel utilization factor would be limited by the single passage utilization factor inside the MCFC (UF = 0.8), hence 20% of the NG fed to the fuel cell modules would be lost.
Table 14.
molten carbonate fuel cell (MCFC) Performance evaluation outcomes (MCFC-1).
Based on these results, the economic assessment was carried out by considering the whole investment cost associated with the green-field installation of both the NGCC and MCFC units; the results of the economic evaluation are summarised in Table 15. The specific equipment cost of the MCFC + BoP section is considerably higher than calculated for the GT+HRSC section (555 $/kWel vs. 316 $/kWel), whereas the installation of the compression and purification unit requires less than 50% of the MCFC investment. The specific total plant cost (specific TPC) of the MCFC system, including all BoP items, is 3300 $/kWel (TPC of MCFC + BoP + blower + heaters + quench boiler equal to 591 M$ for a net MCFC power output of 179.1 MWel) a figure close to the lower bound of the installed cost-range, 3500–5500 $/kWel, reported by DOE [59]. This range is thought to represent year 2010 market status for a 2.8 MWel CHP system, at a production volume of 30 MWel per year. According to DOE projections made in 2011, the 10 year-forward specific installed cost target was 1500 $/kWel, assuming a production volume of 100 MWel per year. Even though the MCFC cost level has decreased remarkably over the last 20 years [13], according to DOE targets [59], there is still potential for cost improvements in the future.
Table 15.
MCFC cost evaluation outcomes.
Even though the integration of the MCFC (with BOP and CO2 purification auxiliaries) causes a 94% increase in the overall capital cost, the high efficiency (i.e., only 0.8 percentage points lower than the reference NGCC w/o CCS) makes this solution attractive also from an economic perspective. As reported in Table 16, the cost of electricity shows a moderate increase with respect to the Reference EBTF case (58.8 $/MWhel, about 30% higher than EBTF [29]), resulting in a cost of CO2 avoided lower than 50 $/tCO2. This result indicates a considerable cost reduction compared to the base technology (NGCC with MEA-based capture).
Table 16.
MCFC general performance and costs evaluation.
In this evaluation, the integration of MCFC with the NGCC appeared to be competitive in terms of efficiency and capture cost, even if a significant fraction of the investment is estimated on the new technology section, which is characterized by a high degree of cost uncertainties. In particular, the fuel cell cost assumed in the present estimation, though not too far from current market values, is based on future mass-production of the stack components (i.e., hundreds of MWel per year). Furthermore, the economics are calculated assuming a conventional MCFC lifetime (i.e., 7 years), even if the MCFC working point reflects the CCS requirements (high CO2 utilization factor, UCO2 = 80% and low voltage, 0.7 V) which have not been tested for sustained operations, yet. In particular, high over-potential and the related waste heat could affect the integrity of the electrolyte and the electrodes, whose durability should be experimentally demonstrated in the long period test under CCS conditions [21]. With the understanding that the MCFC integration with the combined cycle needs development and demonstration, we can conclude that:
- The MCFC integration provides an increase of the power plant output, as well as a strong decrease of specific CO2 emission (−80%), at the expense of a low efficiency penalty;
- Metal dusting represents an issue for the materials of the heat exchanger network, and adds complexity to the design of the anode gas heat recovery section (CO-rich exhausts);
- The maximum CO2 capture efficiency is limited by the constraint on the minimum CO2 concentration at the cathode outlet (XCO2,MIN = 1%), and reaches a value close to 80%;
- The key technical and economic performance indicators look promising;
- SPECCA = 0.3 MJLHV/kgCO2-avoided, CCA = 50$/tCO2;
- The long-term durability of electrolyte materials should be proven experimentally for the present case, where the MCFC is operated in CCS conditions (i.e., high CO2 utilization factor) and with high current density (Ic = 1500 A/m2).
7.3. Pressurized CO2 Absorption Integrated with Multi-Shaft Gas Turbine and Heat Recovery Steam Cycle (HPS)
Table 17 reports the performance results of the HPS configurations analyzed. Since the concept needs a specific type of gas turbine (the LMS100 GT power output is smaller than that of the turbine specified for the EBTF reference case), the results cannot be directly compared with the original EBTF NGCC scheme. In the case with supplementary firing HPS-0b, the steam cycle power output increases by 300% compared to the base case HPS-0a.
Table 17.
High-pressure solvent (HPS) performance evaluation outcomes.
In both options, the major fraction of power is generated by the steam cycle. This is a peculiarity of the HPS concept compared to standard NGCCs with and without CO2 capture.
Concerning the energy performance, HPS-0b turns out to be slightly better than HPS-0a for the following reasons:
- The higher concentration of CO2 in the flue gas (from 3.9% of HPS-0a to 9.0% of HPS-0b);
- The improved heat integration between hot flues gases and steam cycle.
However, these two positive effects, for HPS-0b, are offset by the pressure losses caused by the post-combustor and by the reduction of the flue gas mass flow rate. The increased pressure losses in the flue gas line cause a reduction in the pressure ratio of the LP gas expander (since CO2 lean gases expansion begins at a lower pressure compared to HPS-0a, decreasing from 7.7 bar to 7.2 bar). Furthermore, in HPS-0b, the removal of CO2 and water across the capture unit causes a considerable decrease of mass flow rate of flue gas entering the LP gas expander (from 407.6 kg/s of HPS-0a to 363.0 kg/s of HPS-0b). The combination of these two effects leads to the reduction of the gas turbine power output from 95.2 MWel to 83.7 MWel.
For both cases, the overall plant efficiency is around 40%, lower than the base case. The main reason for such low efficiency is the large temperature drop of flue gas between the exit of the gas generator (high pressure expander) and the inlet of the power expander (low pressure expander). This temperature drop is about 500 °C.
The results of the economic analysis are shown in Table 18 and Table 19. The most uncertain cost figures are the hot potassium carbonate plant cost and the pressurized HRSG cost. For the first item, we used a specific $/tCO2 value reported by Bartoo and Furukawa [50]. For the second item, we corrected the cost estimate of a standard HRSG with a pressure factor typically used for heat exchangers [60].
Table 18.
HPS main results of equipment cost assessment.
Table 19.
Economic evaluation of HPS schemes.
The capture section, including the pressurized steam generator, represents around 20% of the total equipment cost of the plant, while, as expected, the cost of the steam cycle more than doubles in the supplementary firing case (HPS-0b).
Due to the economy of scale effect, mainly related to the steam cycle size, the supplementary firing configuration is better also from an economic point of view. Table 19 shows that the cost of electricity decreases from 86.1 $/MWhel to 71.0 $/MWhel, and the CCA is almost 40% better compared to the case HPS-0a, dropping from 137.9 $/tCO2 to 87.1 $/tCO2.
7.4. Supersonic Flow Driven CO2 Anti-Sublimation and Inertial Separation
The performance for cases with SSD separator inlet pressures ranging from 2.4 to 5 bar are summarized in Table 20. Results show that the dominant energy penalty item for this technology is the electric consumption for flue gas compression from 1 bar to the SSD inlet pressure (its proportion of the overall energy penalty ranges between 79% and 95%). When the SSD inlet pressure is increased from 2.4 bar to 5 bar, the SPECCA increases from 4.36 to 8.14 MJLHV/kgCO2-avoided, indicating that the most attractive solution is the one at 2.4 bar; it also features a smaller axial compressor with fewer stages.
Table 20.
SSD performance evaluation outcomes.
However, according to the most recent experimental investigations [9], an SSD inlet pressure close to 2 bar is considered too low to achieve 90% capture.
Given the lack of data on the SSD system cost, the economic assessment has been carried out only for one representative case, i.e., SSD-3, and it is reported in Table 21 and Table 22. It must be highlighted that the assumption on the equipment cost of the SSD system (100 M$), i.e., the cost of the units within the dotted rectangle in the flowsheet of Figure 6, should be taken just as an order of magnitude estimate, given the very limited TRL of the technology and the uncertainties in the full-scale design of the separator. However, the cost estimate of compressors and other auxiliaries of the capture island are better quantified, since these are conventional pieces of equipment.
Table 21.
SSD main results of equipment cost assessment.
Table 22.
SSD economic evaluation.
The resulting CCA cost (equal to 97.1 $/tCO2 for the case at 3 bar) highlights the need to improve this SSD performance to increase its competitiveness as a stand-alone, post-combustion capture technology for NGCC plants. However, given the large uncertainty affecting the technology, it is difficult to draw conclusions on its economic performance.
8. Discussion
Figure 7 plots the thermodynamic performance (SPECCA) of the cases investigated. It highlights that, based on the results of this work, the only technology superior to the amine cases (i.e., MEA and PZ) is MCFC, featuring a very low SPECCA index (0.31 MJLHV/kgCO2-avoided). The most promising configuration of membranes seems able to achieve energy penalties comparable with the base case (3.37 MJLHV/kgCO2-avoided for MEM-3 vs. 3.34 MJLHV/kgCO2-avoided for EBTF). Supersonic, flow-driven deposition should be the third technology in the ranking of performance, since it features a SPECCA of 5.22 MJLHV/kgCO2-avoided in the most representative case (i.e., with an SSD inlet pressure of 3 bar). However, SSD is by far the least developed CO2 capture concept among the candidates considered, and the system implementation and overall process integration may be further improved by the technology developers in the future. For instance, Balepin et al. [58], at the end of their R&D project, concluded that progress was made in the understanding and maturing of this CO2 capture technology, and considerable future promise remains for applications requiring bulk CO2 capture (around 50%) and CO2 concentrations of the order of 8% mol. The schemes based on HPS are less attractive from the point of view of performance, since they feature lower net electric efficiencies compared to the base case (which gives 49.9%), i.e., 39.6% in the HPS most attractive configuration.
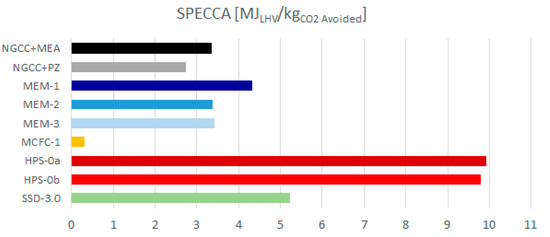
Figure 7.
Specific primary energy consumption per unit of CO2 avoided (SPECCA) index of the assessed technologies.
As for the economic indicator, the Cost of CO2 Avoided is considered here as the most relevant one. CCA is reported in Figure 8 as a function of the Specific Total Plant Cost ($/kWel), and in Figure 9 in relation to the Specific TPC per CO2 avoided ($/kgCO2/s), to show the economic comparison among the different technologies. The specific indices are considered fair indices for comparing the investment costs of plants featuring different sizes and flow rates of CO2 avoided. In Figure 8, the most attractive plants are the ones positioned close to the bottom-left corner (low operating and small specific investment costs). Both Figure 8 and Figure 9 show that MCFC is the only technology able to achieve a cost of CO2 avoided appreciably lower than the baseline, showing a reduction of 35% compared to NGCC + MEA and of 28% compared to NGCC + PZ.
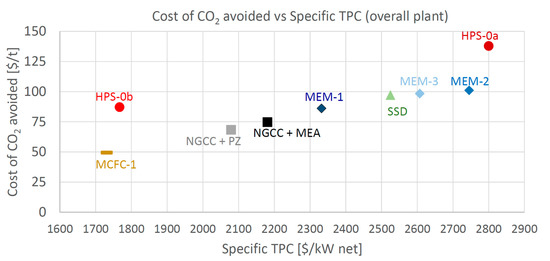
Figure 8.
Cost of CO2 avoided vs. Specific TPC.
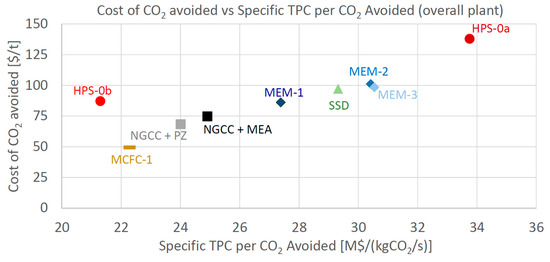
Figure 9.
Cost of CO2 avoided vs. Specific TPC per CO2 avoided.
HPS-0b features a specific investment cost reduction compared to the Base case, but its cost of CO2 avoided is higher than the base case (87 vs. 75 $/tCO2). Membrane cases that performed at a similar level to the EBTF+MEA plant in terms of SPECCA have both a Specific TPC and a CCA larger than the base case. Table 23 highlights the key performance and cost indicators of the four analyzed technologies together with the reference-, base-plant and advanced-PZ ones.
Table 23.
Summary table of performance and costs of the CCS technologies assessed.
9. Conclusions
This paper presents the preliminary technical and economic assessment of four alternative technologies suitable for post-combustion CO2 capture from NGCC exhaust gases.
In summary, MCFC seems to outperform the baseline from both performance (SPECCA of 0.31 MJLHV/kgCO2-avoided) and cost (CO2 avoidance cost of 49 $/tCO2). A more detailed assessment is encouraged to verify actual scheme feasibility and cost assumptions, while taking into account other relevant issues such as reliability, operational flexibility and performance degradation. CO2-permeable membranes are affected by the large area and high capital costs which make this technology less attractive than amines for deep CO2 removal from NGCC flue gas. To improve the performance and cost of this technology, a capture rate lower than the 90% threshold should be targeted. High-pressure solvent absorption from high-pressure exhaust gas, though a well-known and low risk technology, does not outperform benchmark capture technology on performance. Although a decrease of specific investment cost appears to be achievable due to supplementary-firing (which increases the power output), the cost of CO2 avoided is affected by the lower net electric efficiency. Supersonic, flow-driven, CO2 deposition is the technology with the lowest TRL, and the results of this study indicate that its energy performance can be similar to the MEA base case, only in case moderate flue gases compression ratios are achievable to ensure acceptable CO2 removal levels via anti-sublimation. SSD application to post-combustion capture from NGCCs looks challenging due to the low CO2 concentration in the flue gas. However, given the large uncertainty affecting the technology, it is difficult to draw conclusions on its economic performance.
Since the energy and economic performance of CO2 capture technologies are strongly dependent upon the application (e.g., flue gas composition, plant size, mass and energy integration with the power plant) and the modeling assumptions, the results and considerations found in this work cannot be generalized. As an example, for applications featuring higher CO2 concentrations (such as coal-fired steam cycles, cement plants, refineries, smelters, etc.), technologies based on physical separation processes (e.g., HPS, SSD and MEM) are expected to be much more competitive.
Author Contributions
Conceptualization: MAN.G, S.C., E.M., F.V.; Methodology: MAN.G, E.M., F.V.; Software: M.G., F.V.; Formal Analysis: MAN.G, D.D.B., M.G., M.S., R.S.; Writing – Draft Preparation: MAN.G, E.M., F.V., D.D.B., M.G., M.S., R.S.; Writing – Review & Editing: MAN.G, S.C., E.M., F.V.; Supervision: S.C.; Funding Acquisition: S.C.; Project Administration: S.C. All authors have read and agreed to the published version of the manuscript.
Funding
This work was fully funded and supported by Phase 4 of the CO2 Capture Project (CCP).
Acknowledgments
The CCP is an award-winning group of major energy companies working together to advance the technologies that will underpin the deployment of industrial-scale CO2 capture and storage (CCS). The members of CCP’s fourth phase are BP, Chevron and Petrobras.Particular thanks are given to the CCP4 Capture Team in supporting this work. The authors acknowledge Karl Gerdes for reviewing a preliminary version of the paper ahead of its submission.
Conflicts of Interest
The authors declare no conflict of interest.
Nomenclature
| BoP | Balance of Plant |
| CCA | Cost of CO2 avoided |
| CCL | CO2 Capture Level |
| CCP | CO2 Capture Project |
| CCS | Carbon Capture and Storage |
| CEPCI | Chemical Engineering Plant Cost Index |
| COE | Cost Of Electricity |
| E | Specific CO2 emissions rate [kgCO2/kWh] |
| EBTF | European Benchmarking Task Force |
| EGR | Exhaust Gas Recycle |
| EOR | Enhanced Oil Recovery |
| EPC | Engineering, Procurement and Construction cost |
| GPU | Gas Processing Unit |
| gpu | gas permeance units (measurement unit of permeance) |
| GT | Gas Turbine |
| HP | High Pressure |
| HPS | Pressurized CO2 Absorption integrated with Multi-Shaft Gas Turbine and HRSC |
| HRSC | Heat Recovery Steam Cycle (includes steam generator and steam turbine) |
| HRSG | Heat Recovery Steam Generator |
| Ic | Current density |
| IC | Indirect Cost |
| INST | Installation cost |
| IP | Intermediate Pressure |
| LHV | Lower Heating Value |
| LP | Low Pressure |
| MCFC | Molten Carbonate Fuel Cell |
| MEA | MonoEthanolAmine |
| MEM | CO2 Permeable Membranes |
| NG | Natural Gas |
| NGCC | Natural Gas Combined Cycle |
| OCC | Owner’s Cost and Contingencies |
| O&M | Operation and Maintenance |
| PZ | Aqueous Piperazine Solvent |
| REF | Reference NGCC plant without CCS |
| S/C | Steam to Carbon ratio |
| SPECCA | Specific Primary Energy Consumption per unit of CO2 Avoided |
| SSD | Supersonic Flow Driven CO2 Anti-Sublimation and Inertial Separation |
| ST | Steam Turbine |
| TEC | Total Equipment Cost |
| TIT | Turbine Inlet Temperature |
| TPC | Total Plant Cost |
| TRL | Technology Readiness Level |
| UCO2 | CO2 utilization factor |
| UF | Fuel utilization factor |
| UO2 | O2 utilization factor |
| UA | Product between the overall heat transfer coefficient (U) and the heat transfer area (A) of the HRSG |
| V | Volt—Fuel Cell tension |
| VIGV | Variable Inlet Guide Vanes |
| XCO2,MIN | Minimum CO2 molar concentration |
References
- International Energy Agency (IEA). World Energy Outlook 2016; OECD: Paris, France, 2016. [Google Scholar]
- DOE/NETL Capture Program R&D: Compendium of Carbon Capture Technology. April 2018. Available online: https://netl.doe.gov/sites/default/files/netl-file/Carbon-Capture-Technology-Compendium-2018.pdf (accessed on 2 December 2019).
- Global CCS Institute. The Global Status of CCS: 2016; Summary Report; Global CCS Institute: Melbourne, Australia, 2016; ISBN 978-0-9944115-6-3. [Google Scholar]
- CO2 Capture Project (CCP). Available online: www.co2captureproject.org/ (accessed on 2 December 2019).
- Crombie, M.; Imbus, S.; Jadhav, R. CO 2 Capture Project—16 years of CCS development & collaboration to build knowledge. In Proceedings of the Oral presentation at the GHGT-13 Conference, Lausanne, Switzerland, 18 November 2016. [Google Scholar]
- Stéphenne, K. Start-up of World’s First Commercial Post-combustion Coal Fired CCS Project: Contribution of Shell Cansolv to SaskPower Boundary Dam ICCS Project. Energy Procedia 2014, 63, 6106–6110. [Google Scholar] [CrossRef]
- Rubin, E.S.; Davison, J.E.; Herzog, H.J. The cost of CO2 capture and storage. Int. J. Greenh. Gas Control 2015, 40, 378–400. [Google Scholar] [CrossRef]
- Mathieu, P.; Bolland, O. Comparison of Costs for Natural gas Power Generation with CO2 Capture. Energy Procedia 2013, 37, 2406–2419. [Google Scholar] [CrossRef]
- Castrogiovanni, A. Supersonic Post-Combustion Inertial CO2 Extraction System. Bench Scale Project Status Update. In Proceedings of the US DOE NETL CO2 Capture Technology Meeting, Pittsburgh, PA, USA, 30 July 2014. [Google Scholar]
- Merkel, T.C.; Wei, X.; He, Z.; White, L.S.; Wijmans, J.G.; Baker, R.W. Selective Exhaust Gas Recycle with Membranes for CO 2 Capture from Natural Gas Combined Cycle Power Plants. Ind. Eng. Chem. Res. 2013, 52, 1150–1159. [Google Scholar] [CrossRef]
- Christensen, T.; Børseth, K.; Hamrin, S.; De Meyer, H. Jet Engine With Carbon Capture 2013. U.S. Patent US13/811,753, 16 May 2013. [Google Scholar]
- Campanari, S.; Manzolini, G.; Chiesa, P. Using MCFC for high efficiency CO2 capture from natural gas combined cycles: Comparison of internal and external reforming. Appl. Energy 2013, 112, 772–783. [Google Scholar] [CrossRef]
- Campanari, S.; Chiesa, P.; Manzolini, G.; Bedogni, S. Economic analysis of CO2 capture from natural gas combined cycles using Molten Carbonate Fuel Cells. Appl. Energy 2014, 130, 562–573. [Google Scholar] [CrossRef]
- Balepin, V.; Castrogiovanni, A. A High Efficiency Inertial CO2 Extraction System (ICES). In Proceedings of the 2010 NETL CO2 Capture Technology Meeting, Pittsburgh, PA, USA, 13–17 September 2010; Available online: https://www.arpa-e.energy.gov/sites/default/files/documents/files/CO2_Workshop_ATK.pdf (accessed on 2 December 2019).
- Schinkelshoek, P.; Epsom, H.D. Supersonic gas conditioning—Commercialisation of twister? Technology. GPA Annu. Conv. Proc. 2008, 2, 739–745. [Google Scholar]
- Balepin, V.; Castrogiovanni, A.; Girlea, F.; Robertson, A.; Sforza, P. Inertial Extraction System. U.S. Patent US2013/0228076 A1, 5 September 2013. [Google Scholar]
- GE Power & Water; LMS100* gas turbine (50 Hz). GEA18631F, 2015.
- Milidovich, U.O.P.; Tanislav, S.; Zbacnik, E. Increasing Efficiency of Hot Potassium Carbonate CO 2 Removal Systems; UOP LLC: Des Plaines, IL, USA, 2013; pp. 11–14. [Google Scholar]
- Vielstich, W.; Gasteiger, H.A.; Lamm, A.; Yokokawa, H. Handbook of Fuel Cells: Fundamentals, Technology and Applications; Wiley: New York, NY, USA, 2009; ISBN 978-0-470-74151-1. [Google Scholar]
- Campanari, S.; Chiesa, P.; Manzolini, G. CO2 capture from combined cycles integrated with Molten Carbonate Fuel Cells. Int. J. Greenh. Gas Control 2010, 4, 441–451. [Google Scholar] [CrossRef]
- Spinelli, M.; Di Bona, D.; Gatti, M.; Martelli, E.; Viganò, F.; Consonni, S. Assessing the potential of molten carbonate fuel cell-based schemes for carbon capture in natural gas-fired combined cycle power plants. J. Power Sources 2020, 448, 227223. [Google Scholar] [CrossRef]
- Ohmer, M. Industrial Heat Supplied by an Integrated 1.4 MW Fuel Cell CHP Plant. Hannover. April 2016. Available online: https://www.h2fc-fair.com/hm16/images/forum/pdf/03wednesday/1140.pdf (accessed on 2 December 2019).
- Ahmed, S.; Papadias, D.; Ahluwalia, R.; Hua, T.; Roh, H.-S. Performance and Cost Analysis for a 300 kW Tri-generation Molten Carbonate Fuel Cell System. In Proceedings of the 2015 US DOE Hydrogen and Fuel Cells Program and Vehicle Technologies Office, Annual Merit Review and Peer Evaluation Meeting, Arlington, WV, USA, 8–12 June 2015. [Google Scholar]
- Ghezel-Ayagh, H. Pilot Test of Novel Electrochemical Membrane System for Carbon Dioxide Capture and Power Generation. In Proceedings of the 2016 NETL CO2 Capture Technology Meeting, Pittsburgh, PA, USA, 8–12 August 2016. [Google Scholar]
- Forsyth, J.; Lodge, S.; Consonni, S.; Di Bona, D.; Gatti, M.; Martelli, E.; Scaccabarozzi, R.; Viganò, F. Evaluation of Five Alternative CO2 Capture Technologies with Insights to Inform Further Development. Energy Procedia 2017, 114, 2599–2610. [Google Scholar] [CrossRef]
- AspenTech, Aspen Plus v8.8. 2016. Available online: www.aspentech.com (accessed on 2 December 2019).
- Thermoflow, Thermoflex v24. 2014. Available online: //www.thermoflow.com/combinedcycle_TFX.html (accessed on 2 December 2019).
- Consonni, S. Performance Prediction of Gas/Steam Cycles for Power Generation, MAE Dept. Ph.D. Thesis, n. 1983-T. Princeton University, Princeton, NJ, USA, 1992. [Google Scholar]
- Anantharaman, R.; Bolland, O.; Booth, N.; van Dorst, E.; Ekstrom, K.; Sanchez Fernandes, E.; Franco, F.; Macchi, E.; Manzolini, G.; Nikolic, D.; et al. European Best Practice Guidelines for Assessment of Carbon Dioxide (CO2) Capture Technologies. 2011. Available online: https://www.ctc-n.org/resources/european-best-practice-guidelines-assessment-carbon-dioxide-co2-capture-technologies (accessed on 2 December 2019).
- Chiesa, P.; Macchi, E. A Thermodynamic Analysis of Different Options to Break 60% Electric Efficiency in Combined Cycle Power Plants. J. Eng. Gas Turbines Power 2004, 126, 770. [Google Scholar] [CrossRef]
- Chen, E.; Fulk, S.; Sache, D.; Lin, Y.; Rochelle, G.T. Pilot Plant Activities with Concentrated Piperazine. Energy Procedia 2014, 63, 1376–1391. [Google Scholar] [CrossRef]
- Manzolini, G.; Sanchez Fernandez, E.; Rezvani, S.; Macchi, E.; Goetheer, E.L.V.; Vlugt, T.J.H. Economic assessment of novel amine based CO2 capture technologies integrated in power plants based on European Benchmarking Task Force methodology. Appl. Energy 2015, 138, 546–558. [Google Scholar] [CrossRef]
- Rochelle, G.; Chen, E.; Freeman, S.; Van Wagener, D.; Xu, Q.; Voice, A. Aqueous piperazine as the new standard for CO2 capture technology. Chem. Eng. J. 2011, 171, 725–733. [Google Scholar] [CrossRef]
- Conversano, A.; Gatti, M.; Scaccabarozzi, R.; Martelli, E.; Ali, I.; Moure, G.; Consonni, S. Techno-Economic Assessment of Novel vs. Standard 5m Piperazine CCS Absorption Processes for Conventional and High-efficiency NGCC Power Plants. In Proceedings of the 14th Greenhouse Gas Control Technologies Conference, Melbourne, Australia, 21–26 October 2018. [Google Scholar]
- Zhang, Y.; Freeman, B.; Rochelle, G.T. Absorber modeling for NGCC carbon capture with aqueous piperazine. Faraday Discuss. 2016, 192, 459–477. [Google Scholar] [CrossRef]
- CCP Carbon Dioxide Capture for Storage in Deep Geologic Formations; Gerdes, K.F., Ed.; CPL Press: Thatcham, UK, 2015; Volume 4, ISBN 978-1-872691-68-8. [Google Scholar]
- Chemical Engineering CEPCI, The Chemical Engineering Plant Cost Index. Available online: www.chemengonline.com/site/plant-cost-index/2014 (accessed on 1 April 2017).
- Fout, T.; Zoelle, A.; Keairns, D.; Turner, M.; Woods, M.; Kuehn, N.; Shah, V.; Chou, V.; Pinkerton, L. Cost and Performance Baseline for Fossil Energy Plants Volume 1a: Bituminous Coal (PC) and Natural Gas to Electricity Revision 3. Natl. Energy Technol. Lab. 2015, 1, 240. [Google Scholar]
- Zoelle, A.; Turner, M.J.; Chou, V. DOE/NETL Quality Guidelines for Energy System Studies Performing a Techno-economic Analysis for Power Generation Plants. 2015. Available online: www.osti.gov/servlets/purl/1513273 (accessed on 2 December 2019).
- Rubin, E.; Booras, G.; Davison, J.E.; Ekstrom, K.; Matuszewski, M.; McCoy, S.; Short, C. Toward a Common Method of Cost Estimation for CO2 Capture and Storage at Fossil Fuel Power Plants; 2013. Available online: www.cmu.edu/epp/iecm/rubin/PDF%20files/2012/CCS%20Task%20Force_White%20Paper_FINAL_Jan%2015%202013.pdf (accessed on 2 December 2019).
- EIA (U.S. Energy Information Administration). Annual Energy Outlook 2017. January 2017. Available online: https://www.eia.gov/outlooks/aeo/pdf/0383(2017).pdf (accessed on 2 December 2019).
- IEAGHG, CO2 Capture at Gas Fired Power Plants, 2012/8. July 2012. Available online: https://ieaghg.org/publications/technical-reports/reports-list/9-technical-reports/1024-2012-08-co2-capture-at-gas-fired-power-plants (accessed on 2 December 2019).
- EIA (U.S. Energy Information Administration). Updated Capital Cost Estimates for Utility Scale Electricity Generating Plants; U.S. Department of Energy: Washington, DC, USA, 2013.
- Kohl, A.L.; Nielsen, R. Gas Purification, 5th ed.; Company, G.P., Ed.; Elsevier: Amsterdam, The Netherlands, 1997; ISBN 9780884152200. [Google Scholar]
- Farooque, M.; Daly, J.; Wang, J. Contaminants Control for Fuel Cells – FCE Experience. In Proceedings of the ANL Conference, Chicago, IL, USA, 6–7 March 2014. [Google Scholar]
- Grabke, H.J. Metal Dusting of Low- and High-Alloy Steels. Corrosion 1995, 51, 711–720. [Google Scholar] [CrossRef]
- Martelli, E.; Kreutz, T.G.; Gatti, M.; Chiesa, P.; Consonni, S. Numerical optimization of steam cycles and steam generators designs for coal to FT plants. Chem. Eng. Res. Des. 2013, 91, 1467–1482. [Google Scholar] [CrossRef]
- Spinelli, M.; Campanari, S.; Consonni, S.; Romano, M.C.; Kreutz, T.; Ghezel-Ayagh, H.; Jolly, S. Molten Carbonate Fuel Cells for Retrofitting Postcombustion CO 2 Capture in Coal and Natural Gas Power Plants. J. Electrochem. Energy Convers. Storage 2018, 15, 031001. [Google Scholar] [CrossRef]
- Ghezel-Ayagh, H.; Jolly, S.; Patel, D.; Steen, W. Electrochemical Membrane Technology for Carbon Dioxide Capture from Flue Gas. Energy Procedia 2017, 108, 2–9. [Google Scholar] [CrossRef]
- Bartoo, R.K.; Furukawa, S.K. Improved Benfield Process for Ammonia Plant; Universal Oil Products: Des Plaines, IL, USA, 1997. [Google Scholar]
- Hammer, M.; Wahl, P.E.; Anantharaman, R.; Berstad, D.; Lervåg, K.Y. CO2 Capture from Off-shore Gas Turbines Using Supersonic Gas Separation. Energy Procedia 2014, 63, 243–252. [Google Scholar] [CrossRef]
- Castrogiovanni, A.; Balepin, V.; Robertson, A.; Calayag, B. Supersonic Post-Combustion Inertial CO2 Extraction System. In Proceedings of the US DOE NETL CO2 Capture Technology Meeting, Pittsburgh, PA, USA; 2014. [Google Scholar]
- Calayag, B.; Castrogiovanni, A. U.S. Department of Energy Categorical Exclusion Determinatin Form. Available online: https://arpa-e.energy.gov/sites/default/files/nepa/0208-1692%20-%20ATK_0.pdf (accessed on 2 December 2019).
- George, E.; Jarry, A.; Pale, M.; Saysset, S. Fundamental and Applied Numerical Approaches for CO2 Capture in Flue Gases within a Supersonic Nozzle. In Proceedings of the International Gas Union Research Conference, Copenhagen, Denmark, 17–19 September 2014. [Google Scholar]
- Castier, M. Modeling and simulation of supersonic gas separations. J. Nat. Gas Sci. Eng. 2014, 18, 304–311. [Google Scholar] [CrossRef]
- Rajaee Shooshtari, S.H.; Shahsavand, A. Reliable prediction of condensation rates for purification of natural gas via supersonic separators. Sep. Purif. Technol. 2013, 116, 458–470. [Google Scholar] [CrossRef]
- Sipocz, N.; Fritz, J.M.; Gonzalez, S.M.A.; Nazelle, C.D.E.; Du, R.; Shisler, R.A.; Lissianski, V.V.; Michelassi, V. Method and Systems for CO2 Separation with Cooling Using Converging-Diverging Nozzle 2013. U.S. Patent US13/456,290, 31 October 2013. [Google Scholar]
- Balepin Vladimir (Orbital ATK) Supersonic Post-combustion Inertial CO2 Extraction System—Final Report DOE-OA-13122. Available online: www.netl.doe.gov/File%20Library/Research/Coal/carbon%20capture/post-combustion/Final-Report-ATK-FE00131 (accessed on 22 April 2017).
- Spendelow, J.; Nguyen, T.; Houchins, C.; Martin, K.E.; Papageorgopoulos, D. Medium-Scale CHP Fuel Cell System Targets. 30 March 2012. Available online: www.hydrogen.energy.gov/pdfs/11014_medium_scale_chp_target.pdf (accessed on 2 December 2019).
- Ulrich, D.G.; Vasudevan, P.T. Chemical Engineering Process Design and Economics: A Practical Guide, 2nd ed.; Process Publishing: Durham, NH, USA, 2004; ISBN 9780970876829. [Google Scholar]


© 2020 by the authors. Licensee MDPI, Basel, Switzerland. This article is an open access article distributed under the terms and conditions of the Creative Commons Attribution (CC BY) license (http://creativecommons.org/licenses/by/4.0/).