Article

Thermal Fluctuation Characteristics around a Nanosecond Pulsed Dielectric Barrier Discharge Plasma Actuator using a Frequency Analysis based on Schlieren Images

by
Takahiro Ukai
1,* and
Konstantinos Kontis
2
1
Department of Mechanical Engineering, Osaka Institute of Technology, Osaka 535-8585, Japan
2
James Watt School of Engineering, University of Glasgow, Glasgow G12 8QQ, UK
*
Author to whom correspondence should be addressed.
Energies 2020, 13(3), 628; https://doi.org/10.3390/en13030628
Submission received: 13 December 2019 / Revised: 24 January 2020 / Accepted: 30 January 2020 / Published: 2 February 2020
(This article belongs to the Special Issue Control of Dynamic Flow Fields)

Abstract

:
A thermal fluctuation driven by a burst plasma discharge is experimentally investigated using a frequency analysis based on the Schlieren images. The burst plasma discharge is controlled by an interval frequency fint = 200 Hz and a pulse frequency fB = 3.6 kHz as well as the duration time of the burst event: Ton. A burst feature is defined as a burst ratio BR = Ton/(1/fint). The burst plasma discharge generates a burst-induced hot plume growing above a ground electrode. In a high burst ratio, which is BR = 0.45 and 0.57, the burst-induced hot plume is formed as a wave thermal pattern that is mainly fluctuated at the interval frequency of 200 Hz. Additionally, a maximum fluctuation spot of 200 Hz appears near the edge of an exposed electrode in a low burst ratio, whereas it moves towards the ground electrode in the high burst ratio. The possible scenario is that a relatively strong ionic wind and/or an induced jet generated in the high burst ratio might cause the movement of the maximum fluctuation spot.

1. Introduction

The flow characteristics induced by the dielectric barrier discharge (DBD) plasma actuators are widely investigated for aerodynamic flow control, such as flow separation postponement and turbulence augmentation. The numerical and experimental investigations [1,2,3,4,5,6,7] show that the flow characteristics vary depending on the actuator configuration, the installation position and the electrical parameters of an input voltage signal: voltage magnitude, frequency, waveform etc. Especially the changing of the electrical parameters can easily and flexibly modulate the aerodynamic performances depending on the situation, namely, angle of attack and Reynolds number.
An unsteadiness input signal typically called as “duty cycle” or “burst mode” is effectiveness for separated flow control. Under plasma actuation in quiescent air, the unsteadiness input signal causes significant fluctuations in the amplitude and power spectral densities of an induced wall jet; however, its time-averaged velocity hardly varies [8]. On the other hand, a plasma discharge in the burst mode influences a flow structure and improves the aerodynamic performances in plasma actuation under a freestream condition [9,10,11,12]. Benard et al. [9] experimentally investigated the effect of excitation frequency and a duty cycle on the lift and drag coefficients of a NACA 0015 aerofoil at a Reynolds number of 2.6 ×10⁵. Their results showed that a vortex shedding from the actuator would influence a global flow structure, and plasma actuation with the duty cycle of 6% significantly enhances lift while electrical power consumption is reduced. Additionally, the burst plasma discharge can control the flow separation at post-stall angles of attack. Sekimoto et al. [13] investigated the control of the separated flow around a NACA0015 aerofoil by a plasma actuator under burst mode actuation and showed that a large-scale vortex structure induced by the plasma actuator dominantly affects flow separation control at higher angles of attack. Although the burst plasma discharge leads to good aerodynamic performances for flow control at post-stall angles of attack, the modulating of an input waveform archives flow control in a wide range of flow speed.
A nanosecond pulsed DBD plasma actuator induces a heated gas that is effective for flow control in high speed flows. The heated gas, which a temperature rapidly is increased due to plasma discharge, leads to a vortex and a shock wave that can modulate high-speed flows [14,15,16,17,18,19]. However, plasma discharge does not necessarily generate enough heated gas, namely the high temperature magnitude and the rapid temperature rise time. There are two kinds of DBD plasma actuators: the ac- and ns-DBD plasma actuators. The ac-DBD plasma actuators driven by a sinusoidal input voltage signal hardly influence high-speed flows because the plasma actuator induces an ionic wind of which the velocity is in a range of a few meter per second in quiescent air [2]. This velocity range is not enough to modulate the high-speed flow. On the other hand, the ns-DBD plasma actuators driven by nanosecond pulsed input high-voltage is applicable to flow modulation in the high-velocity range. Roupassov et al. [12] demonstrated that the ns-DBD plasma actuator achieves the aerofoil flow reattachment up to a Mach number of 0.85. Additionally, a numerical investigation showed that the ns-DBD plasma actuator can control a shock-wave/boundary-layer interaction in a freestream Mach number of 2.8 [20]. The dominant flow control authority of the ns-DBD plasma actuator is energy transfer rather than induced body force: an ionic wind. The ns-DBD plasma actuator generates very low-speed ionic wind [12]; however, an instant heated gas is generated due to the rapid temperature increase. Ukai et al. [21] experimentally investigated the quantitative density field around the ns-DBD plasma actuator excited by 12 kV at 1 kHz, using a calibrated Schlieren technique and showed that the gas density ratio divided by a room density ρ is approximately ρ/ρ = 0.95 after the induced-thermal flow became stable. On the other hand, the ac-DBD plasma actuator produced relatively weak gas density ratio of approximately ρ/ρ = 0.978 [22]. This is because the ac-DBD plasma actuator does not induce strong heated gas.
A thermal fluctuation would play an important role for boundary layer transition. A laminar boundary layer starts transiting to a turbulent flow due to flow instability: Tollmien-Schlichting waves (TS waves) [23]. According to PIV and Schlieren experiments by Correale et al. [24], a heated volume disturbance generated by the ns-DBD plasma actuator operating in a laminar boundary layer condition induces a TS wave train. The heated volume depends on thermal energy supplying to surrounding air, and thermal energy per second varies by an input voltage magnitude and an excitation frequency, for example. Ullmer et al. [25] experimentally investigated the boundary layer transition using the hot-wire and liquid crystal techniques and showed that the excitation frequency of the ns-DBD plasma actuator considerably influences a boundary layer transition point. Additionally, their hot-wire measurements revealed that plasma actuation excites a velocity fluctuation inside the boundary layer. It seems that the velocity fluctuation is caused by the heated volume disturbance related to thermal energy per second; therefore, a thermal fluctuation would influence the boundary layer transition.
The further investigations of the thermal fluctuation characteristics are important to understand the flow control mechanism under ns-DBD plasma actuation. We focused on the thermal fluctuation operated by the burst plasma discharge that enhances the performance of the plasma actuator for flow control. To investigate the thermal fluctuation in this study, Schlieren photography as well as a frequency analysis based on the Schlieren images were used.

2. Experimental Setup and Diagnostics

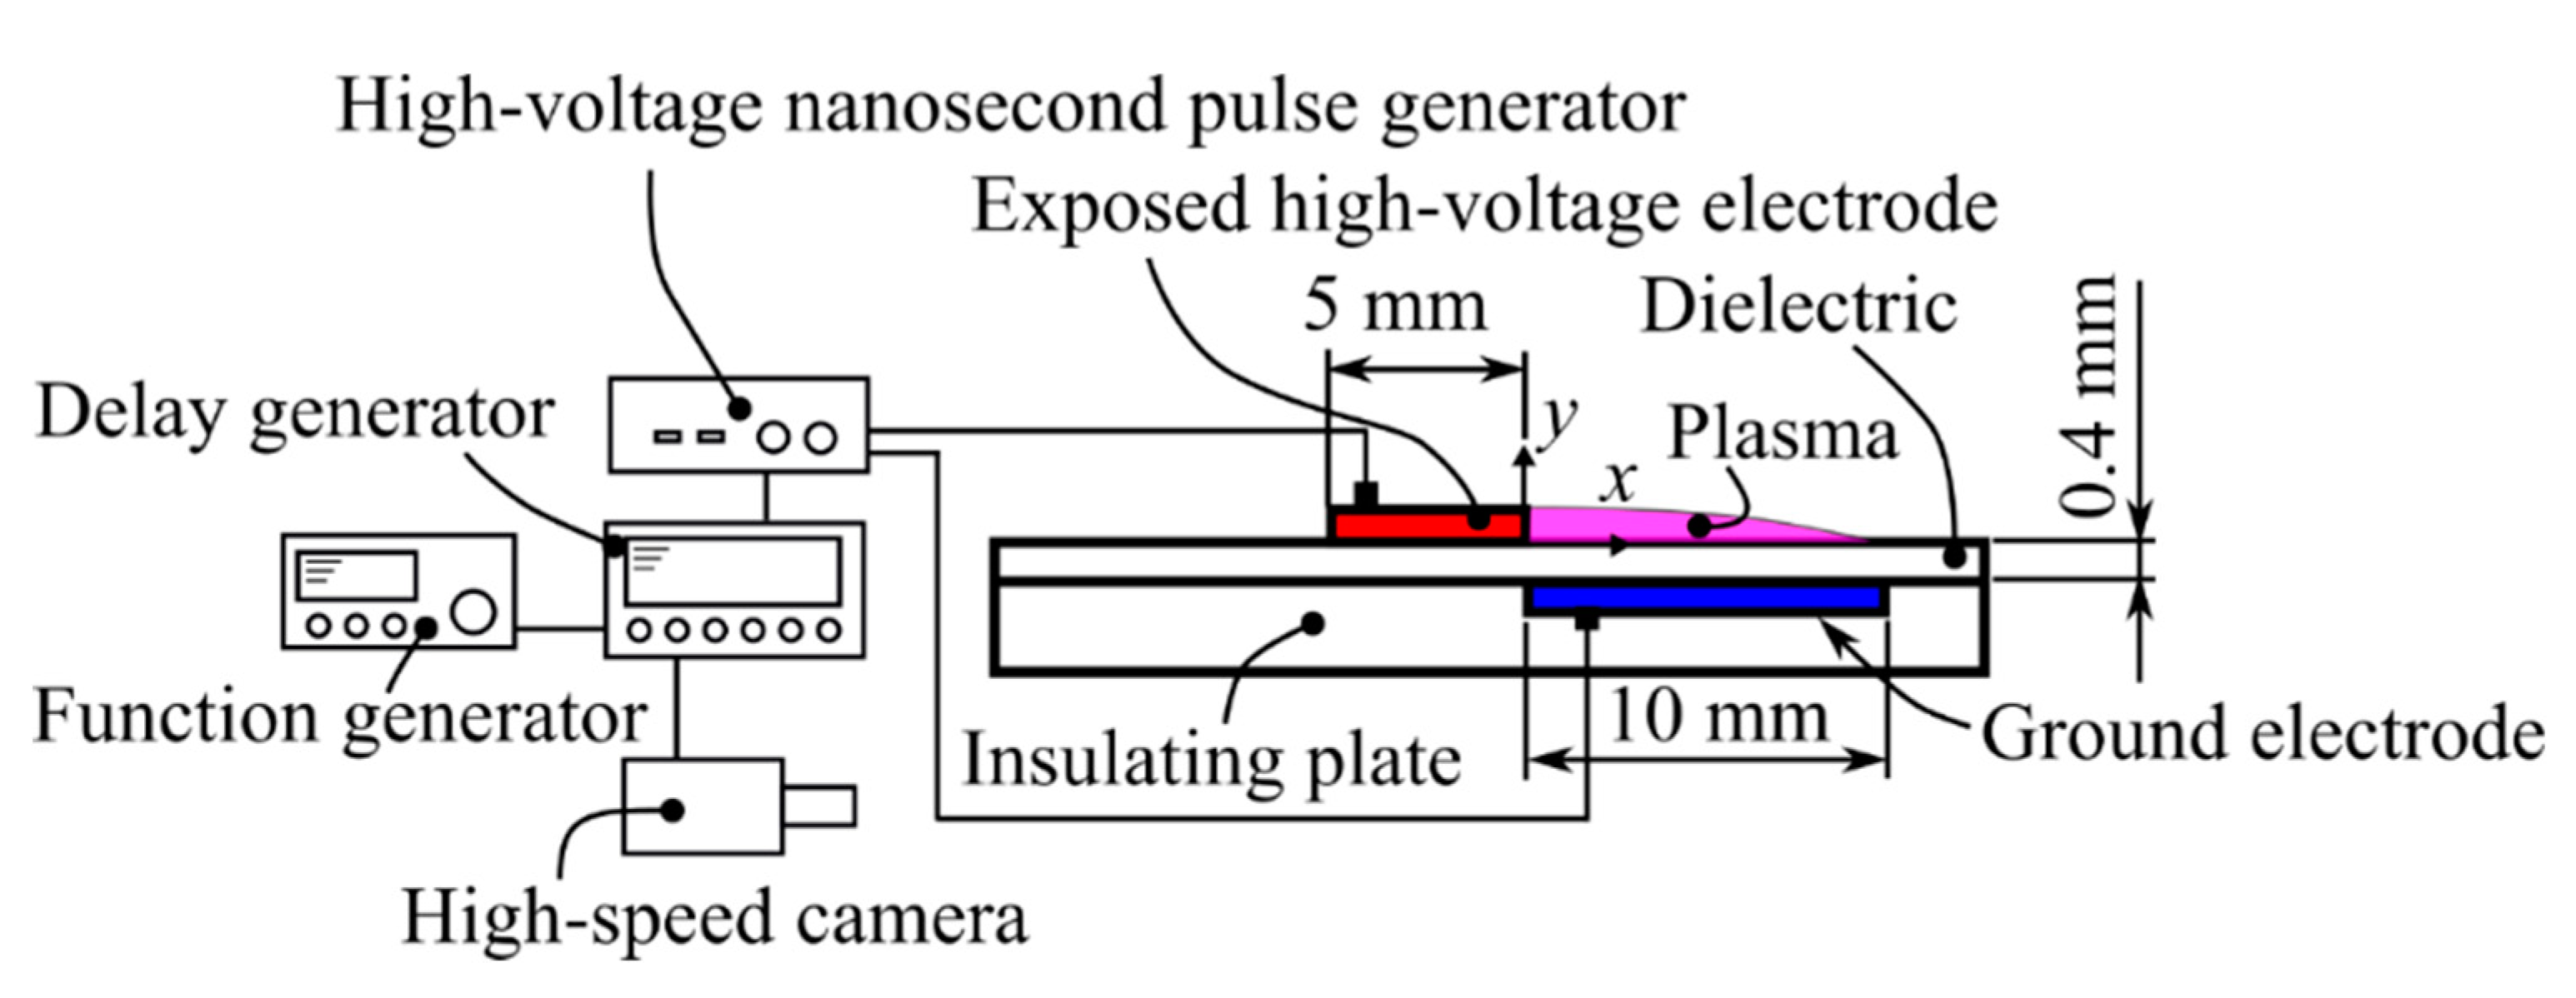
2.1. Experimental Model

Figure 1 shows the configuration of a ns-pulsed DBD plasma actuator and equipment for burst plasma actuation. In general, an ns/ac-DBD plasma actuator is mounted upstream of flow separation point for flow separation postponement. An exposed high-voltage electrode of 5 mm in width and a ground electrode of 10 mm in width are separated by a dielectric material (MG Chemicals, FR-4: Flame Retardant Type 4) with thickness of 0.4 mm. The electrodes were made of copper with thickness of 35 μm. As shown in Figure 1, there is no discharge gap between the electrodes. The shape of an ns-DBD plasma actuator used in this study is the same as that in a reference [26]. The lateral length of the electrodes is 90 mm, but the plasma is formed on the exposed high-voltage electrode of 70 mm in length because 10 mm from both edge sides was covered by polyimide film with thickness of approximately 70 μm. Consequently, the plasma is not formed from the lateral edge of the exposed high-voltage electrode. On the other hand, the ground electrode was fully covered by three layers of polyimide film. The actuator was made using the process of double-sided photolithography. The detailed manufacturing procedure is presented in a reference [21]. The plasma actuator was put in a quadrilateral stainless steel chamber with a volume of 0.138 m3. The chamber has a pair of side quartz windows 137 mm in diameter.
A high-voltage nanosecond pulse generator (Megaimpulse, model: NPG-18/3500(N)) was used for the nanosecond pulsed plasma discharge. The pulse generator supplies negative pulse polarity of 9.45 kV with a pulse width of 6 ns and a rise time of 3.8 ns to the actuator via a 75 Ω coaxial cable. In this study, we used the negative polarity which produces large gross energy related to strong gas heating [27]. A pulse frequency during a burst event was fB = 3.6 kHz; however, a first pulse frequency before the bust event was set as f1st = 3 kHz. The burst features are defined as an interval frequency fint = 200 Hz and the Burst ratio BR = Ton/T = Ton/(1/fint). T and Ton denote an interval time and the duration time of a burst event, respectively (Figure 2 and Table 1). The interval frequency was controlled using a function generator (AIM & THURLBY THANDAR INSTRUMENTS, model: TG2000) via a digital delay generator (Stanford Research Systems, model: DG645, Trigger rates up to 10 MHz), whereas the duration time of the burst event was controlled using the same delay generator. The delay generator can adjust the pulse width of an output signal which supplies to the pulse generator (Megaimpulse) for burst plasma actuation. The output pulse width is related to the number of the high-voltage pulses supplied from the pulse generator (Megaimpulse). For example, the pulse generator outputs the four times high-voltage pulse at each burst event when the delay generator supplies the output pulse width of 900 ns. We investigated the relationship between pulse width and the number of pulse outputs in advance.
An ambient temperature (room temperature) is monitored using a K-type thermocouple with a data acquisition module system (National Instruments Corp., model: NI-9213, 24 bit) driven by LabVIEW. A Fortin mercury barometer provides an ambient pressure (room pressure). In the present experiment, the ambient temperature and ambient pressure were 291.3 ± 1.3 K and 101.23 ± 0.73 kPa, respectively.

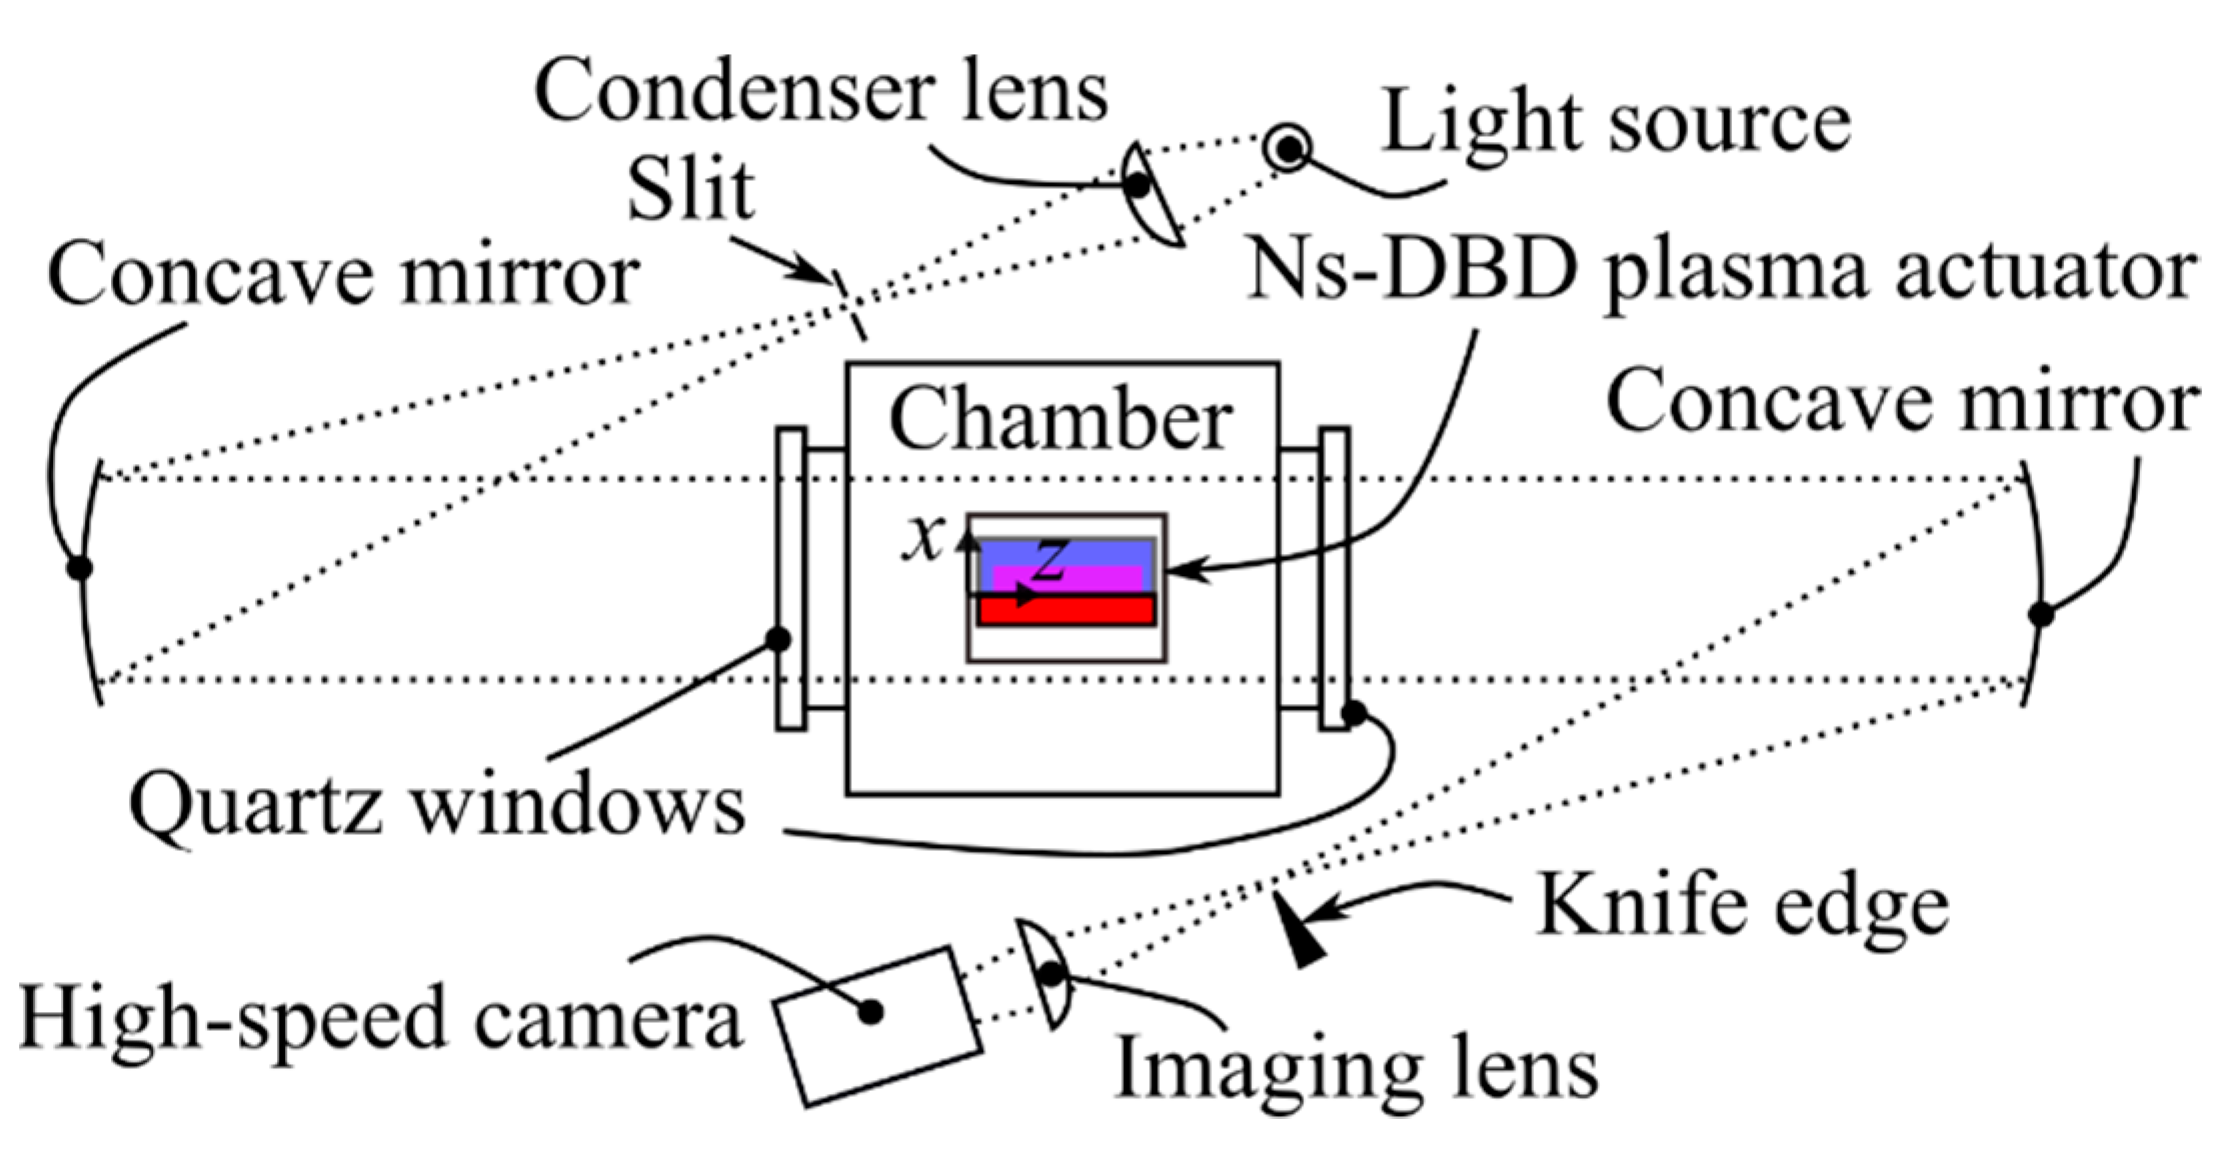
2.2. Schlieren Photography

The thermal perturbation above the ns-DBD plasma actuator was visualised using a Schlieren technique with a standard Z-type optical arrangement (Figure 3). A rectangular light is produced from a light source system consisting of a continuous light source (Newport, model: 66921) with a 450 W Xe arc lamp, a condenser lens with a focal length of 70 mm and a slit. The rectangular light illuminates a first 203.3 mm diameter concave mirror with a focal length of 1829 mm to create a parallel beam. A second concave mirror with the same diameter and focal length receives the parallel beam after it passes through the plasma actuator positioned in the quadrilateral stainless steel chamber. A knife edge located at the focal length of the second mirror obstructs a part of illumination for the adjustment of Schlieren sensitivity. The imaging lens in front of a high-speed camera focuses the image onto the camera sensor. The images were acquired using the high-speed camera (Photron, model: FASTCAM-SA1.1, spatial resolution: 192 × 272 pixels) at a frame rate of fs = 75 kfps with an exposure time of 1 μs. For the comparison of Schlieren image intensity in the different burst plasma discharge cases, Schlieren sensitivity and the optical arrangement as well as image adjustment (contrast and brightness) are all the same in the present experiments.

2.3. Frequency Analysis Based on Schlieren Images

Based on the sequential Schlieren images, the thermal fluctuation caused by burst plasma actuation was investigated using a fast Fourier transform (FFT) technique [28]. The image frequency analysis was successful applied to the sequential Schlieren images in a previous study [29]. The Schlieren sequential images which are the 8-bit brightness images were recorded using the CMOS high-speed camera and were analysed using the FFT technique to calculate a power spectrum density at each pixel in the digital image. The present FFT analysis [30] was conducted using an in-house MATLAB code. The sampling number of 4096 images (n = 212) was used for the present FFT analysis, namely DFT (Discrete Fourier transform). The sampling number is the same in all cases so that the analytical results can be compared to each other. Since an effective resolution in the DFT analysis depends on the sampling number n and sampling frequency fs, the effective resolution was Δf = fs/n = 18.3 Hz in the present analysis. Moreover, an effective frequency range was less than the Nyquist frequency fN = fs/2 = 37.5 kHz.

3. Results and Discussions

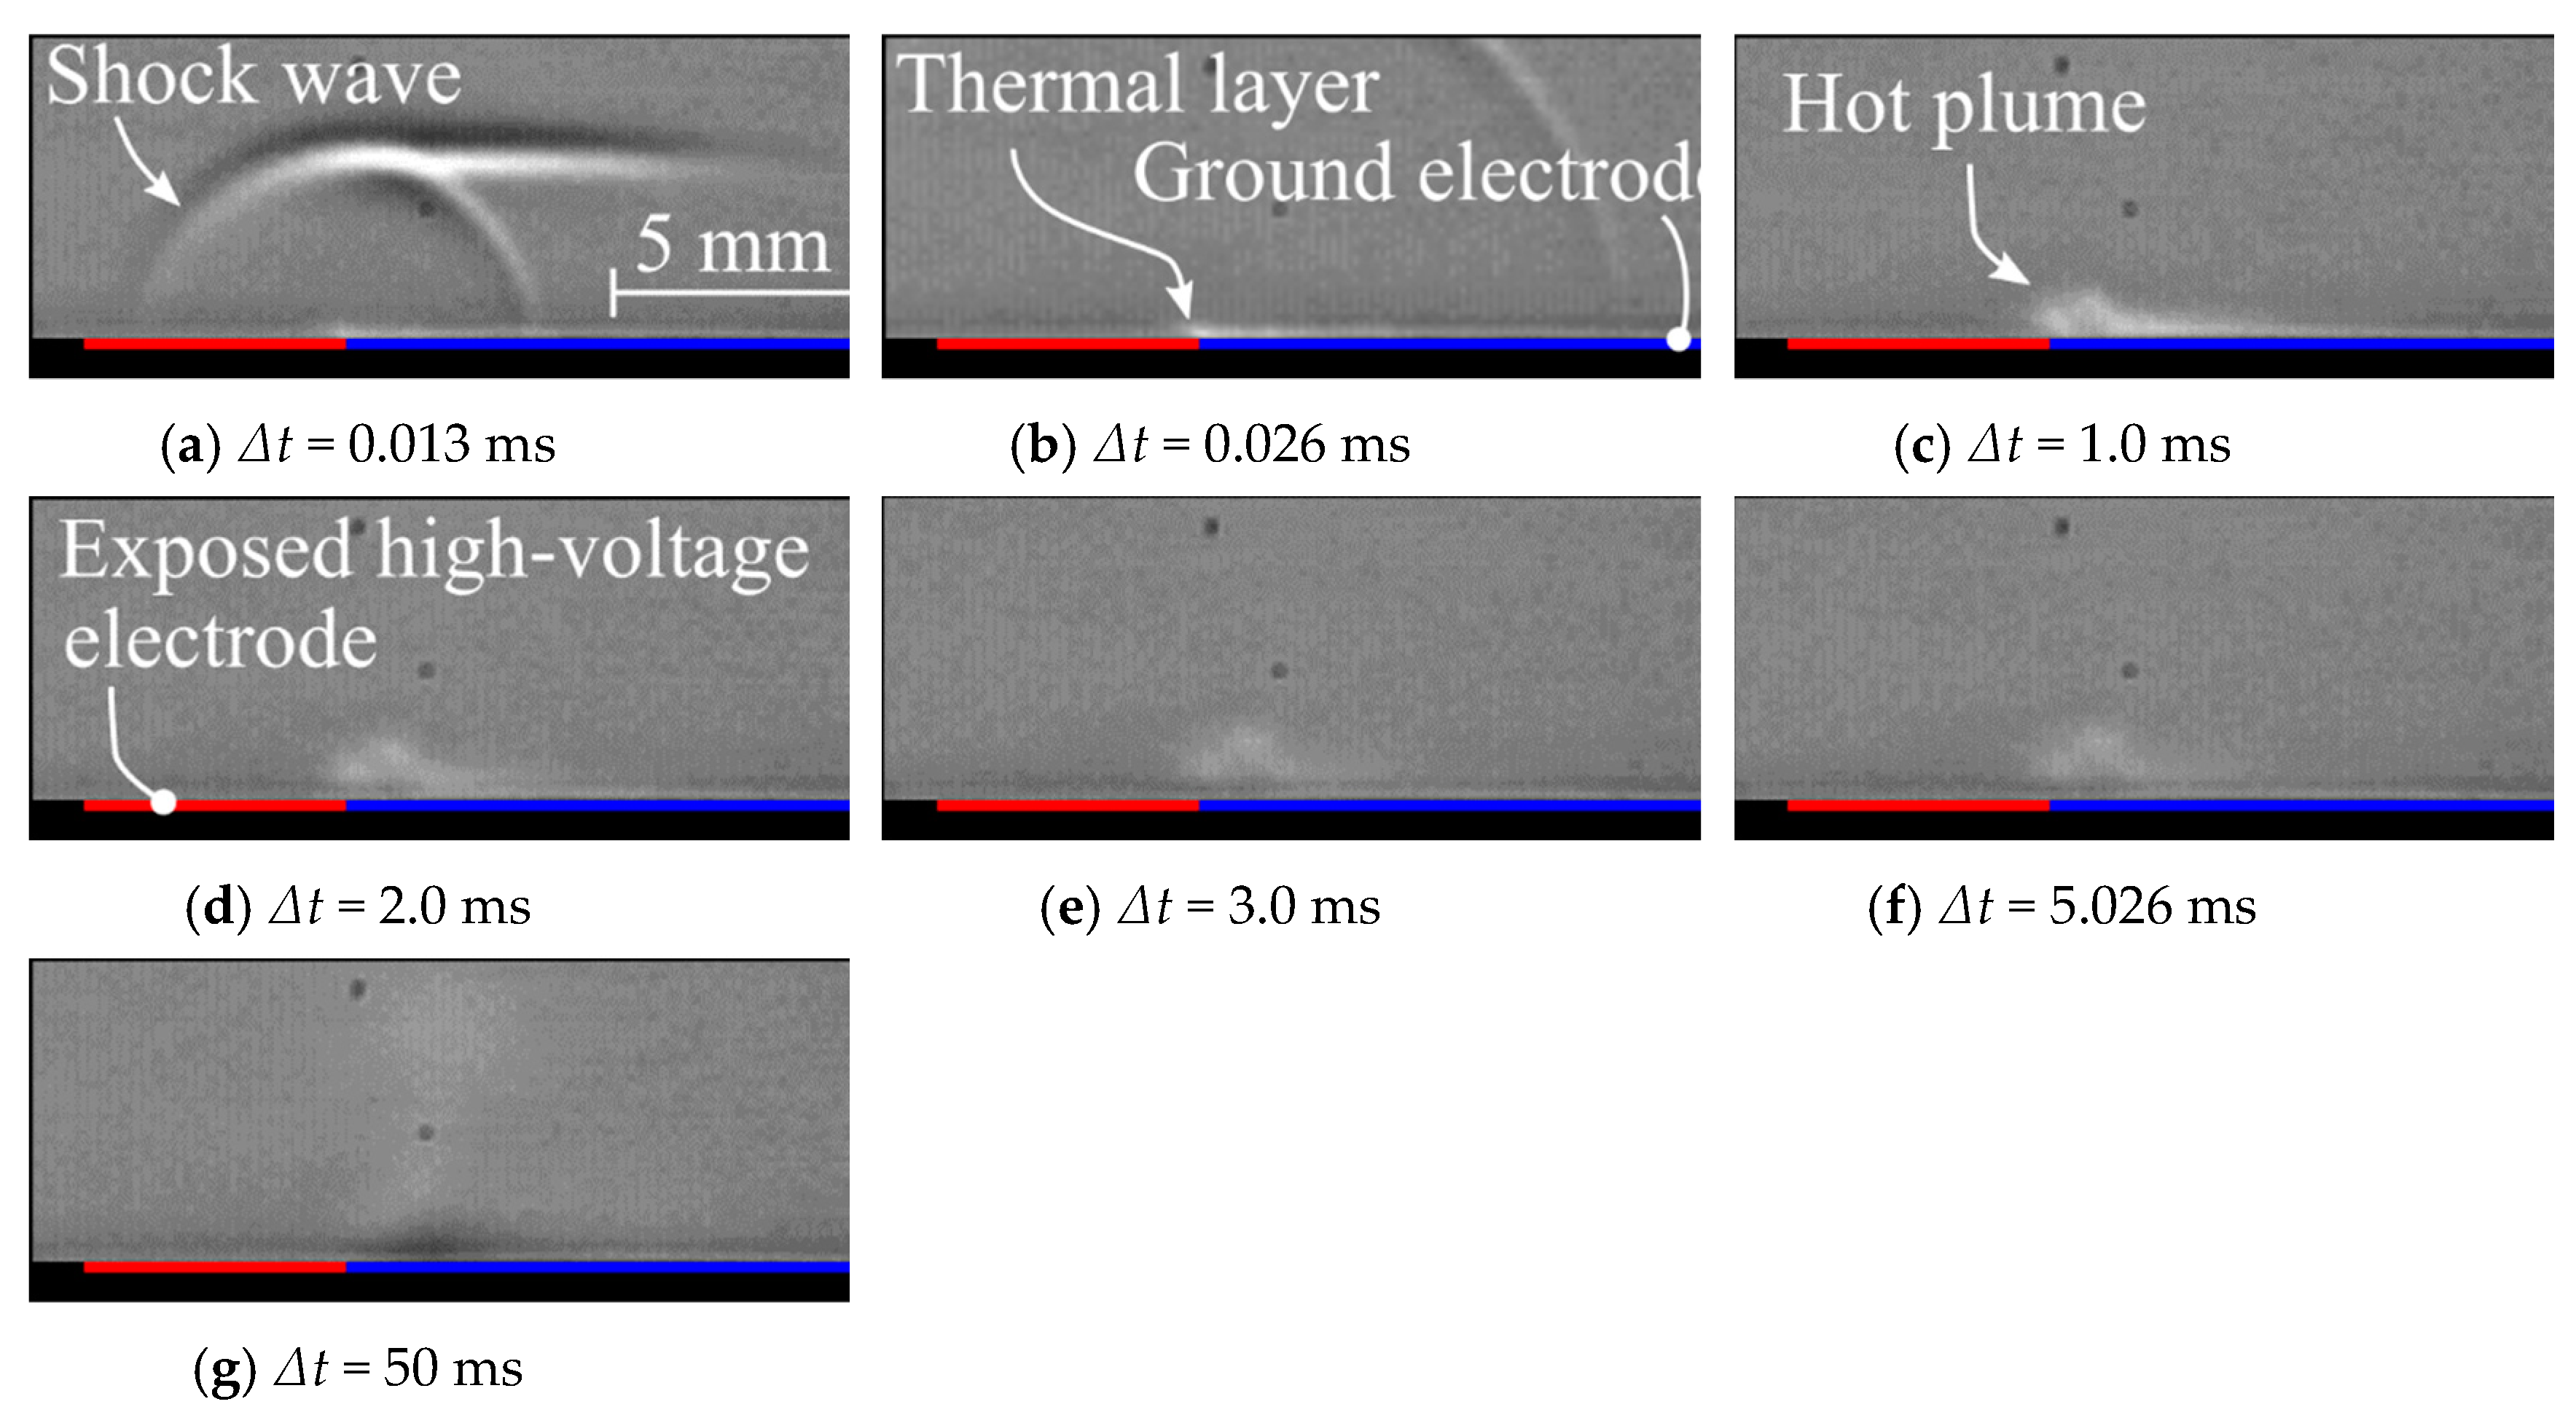
3.1. Flow Visualisation

The ns-DBD plasma actuator induces a shock wave and thermal disturbance including a thermal layer and a hot plume. To easily understand the relationship between the timing of the plasma discharge and the Schlieren images presented in this paper, the timing chart of the Schlieren image acquisition is shown in Figure 4. Figure 5 shows the sequential Schlieren images in a no-burst plasma discharge case (Case 1). An elapsed time of Δt = 0 ms in this study is defined as the time of a first plasma discharge. According to previous studies [31,32,33], a ns-DBD plasma actuator generates the cylindrical and planar shock waves due to rapid temperature increase. Similarly, in this study, the cylindrical and planar shock waves were generated from the edge of the exposed high-voltage electrode and the surface above the ground electrode, respectively (Figure 5a).
A hot plume growing in the order of milliseconds differs from the shock waves propagation in the order of microseconds. As soon as the plasma is discharged, a thermal layer is formed above the actuator (Figure 5b). The highest temperature occurs at the edge of the exposed high-voltage electrode because the relatively strong brightness is there. The high temperature induces a hot plume, but the hot plume is not clearly visualised after the first plasma discharge even though Schlieren sensitivity is high. After 1 ms time elapsed (Figure 5c), the hot plume grows and is visible because the hot plume moves due to natural convection as well as a very weak ionic wind [21]. The grown hot plume is diffused to a surrounding air, and then a thermal perturbation gradually disappears when the longer interval time between the first and second plasma discharges (Figure 5d,e). In the no-burst plasma discharge case, the interval time is 5 ms. After several plasmas are discharged, the hot plume becomes relatively large (Figure 5g) because several plasma discharges supply enough thermal energy to the surrounding air, which results in the growth of a large hot plume.
The thermal perturbation grows large in a burst plasma discharge case because of large thermal energy per second. Figure 6 shows the area of the thermal perturbation obtained from the Schlieren images. First, in the image processing to investigate the area of the thermal perturbation, the image brightness at each pixel was subtracted from a reference brightness image recorded before the first plasma discharge. Then, the thermal perturbation was defined when the pixel intensity exceeded a threshold ± 20. Comparing to the raw Schlieren images, we confirmed that this threshold leads to an appropriate result. As shown in Figure 6, there are several spikes at every 5 ms interval. The spikes denote the shock wave propagated from the plasma actuator, in other words, the plasmas are discharged immediately before the spikes appear. During the plasma discharge, the area of the thermal perturbation is gradually increased because the thermal energy keeps supplying to a surrounding air before the thermal perturbation is diffused due to thermal equilibrium. It seems that the gradient of the lines in all cases is similar during the plasma discharge after every 5 ms interval; however, the area expands with the increasing of the burst ratio (Case 5, BR = 0.57 for example). Even after the plasma discharges extinguished, the area of the thermal perturbation keeps increasing for approximately one millisecond, then the thermal perturbation starts diffusing in the present result. Please note that the existing time of the thermal perturbation depends on a temperature different between the room and plasma temperature. A circular symbol shows a maximum area in each case during each burst event. Additionally, a red dashed line denotes an approximate line regarding each maximum area during each burst event. Please note that the spikes are ignored to define the maximum area because of the shock wave propagation. The red dashed line can be expressed as a linear line. Therefore, the existing time of the thermal perturbation before thermal diffusion is proportional to the burst ratio.
The thermal perturbation due to burst plasma discharge might change plasma discharge characteristics and influence the actuator performance for flow control. Plasma discharges lead to the temperature increase on the electrode surface because of the large thermal energy per second. In ac-DBD plasma actuators, an induced flow velocity and thrust force vary depending on the ambient/surface temperature [34,35]. The increasing ambient temperature around a plasma actuator is proportional to thrust force induced by plasma actuation [34]. According to Erfani et al. [35], plasma actuation in the high surface temperature of an actuator consumes more power compared to actuation in the cold surface temperature and leads to higher induced velocity. In the present experiment, the burst plasma discharge causes the surface temperature increase, and then the induced ionic wind and/or an induced jet would be strong in the burst discharge case.
A complicated thermal perturbation appears in the burst plasma discharge case. In Case 5, that is 10 plasma discharges during each burst event; a thicker thermal layer occurs above the ground electrode (Figure 7a) compared to that in the no-burst plasma discharge case (Figure 5c). This is because the burst plasma discharge releases a relatively large thermal energy per second. The release of the large thermal energy also affects the hot plume defined as a burst-induced hot plume generating in the burst plasma discharge case. At the elapsed time of Δt = 1 ms when the plasma is discharged three times (Figure 7a), there are two round-shaped thermal patterns above the edge of the exposed electrode. After the six times plasma discharge corresponding to the elapsed time of Δt = 2 ms (Figure 7b), the thermal pattern is complicated, and it is not easy to count the number of the thermal patterns. It seems that the number of the plasma discharges is not the same as the number of the thermal patterns. The thermal pattern cannot be clearly visualised in the vicinity of the surface of the electrodes; however, there might be the relationship between the thermal pattern and the number of discharges in the vicinity of the electrodes.
Although the number of the thermal patterns is not the same as the number of the plasma discharges, the thermal pattern varies at different burst ratio. Figure 8 shows the thermal perturbation at the elapsed time of Δt = 50 ms corresponding to nine times burst event. In Case 2 (Figure 8a, BR = 0.23), two dominant thermal patterns consist of several burst-induced hot plumes above the exposed electrode. The number of the thermal patterns increases in Case 3 (Figure 8b, BR = 0.34); however, the number of the thermal patterns does not almost change in the present high burst ratio, which is more than BR = 0.45. Please note that the number of the thermal patterns is not the same as the number of the plasma discharges. In Case 4 (Figure 8c, BR = 0.45), a wave thermal pattern appears above the ground electrode. According to an experimental investigation by Ukai et al. [21], the hot plume moves towards the ground electrode due to a very weak ionic wind. Similarly, in the present results, the hot plume grows towards the ground electrode at the elapsed time of Δt = 50 ms (Figure 5g, Figure 8). The thermal pattern might be caused by the very weak ionic wind releasing periodically in the burst plasma discharge case. Another possible scenario is that a three-dimensional flow causes the wave thermal pattern. In the present Schlieren setup, the light beam passes through the plasma actuator in the lateral direction. The observed wave thermal pattern could be caused by lateral thermal variation. However, in the low burst ratio, the strong complicated thermal structure, such as a wave thermal pattern, does not appear. The three-dimensional flow might be strongly induced in the higher burst ratio, which results in the wave thermal pattern. Further investigation is necessary to reveal the reason why the thermal pattern occurs.
Although the generation of the thermal pattern might be a complicated mechanism, the thermal patterns related to the burst-induced hot plume is fluctuating. Figure 9 shows the root mean square (RMS) brightness images obtained from 3750 Schlieren images corresponding to nine times burst event. In the no-burst plasma discharge case, the thermal perturbation is not strongly fluctuated (Figure 9a, Case 1), whereas the thermal perturbation in the burst plasma discharge cases is strongly fluctuated in a large area (Figure 9b–e). In the low burst ratio (Figure 9b, BR = 0.23), there are two strong fluctuations on the actuator surface, and another relatively weak fluctuation appears at the upper right edge of exposed electrode. The location of the weak thermal fluctuation is similar to the location where the thermal pattern appears (Figure 8); therefore, the thermal patterns caused by the burst-induced hot plume is fluctuated.

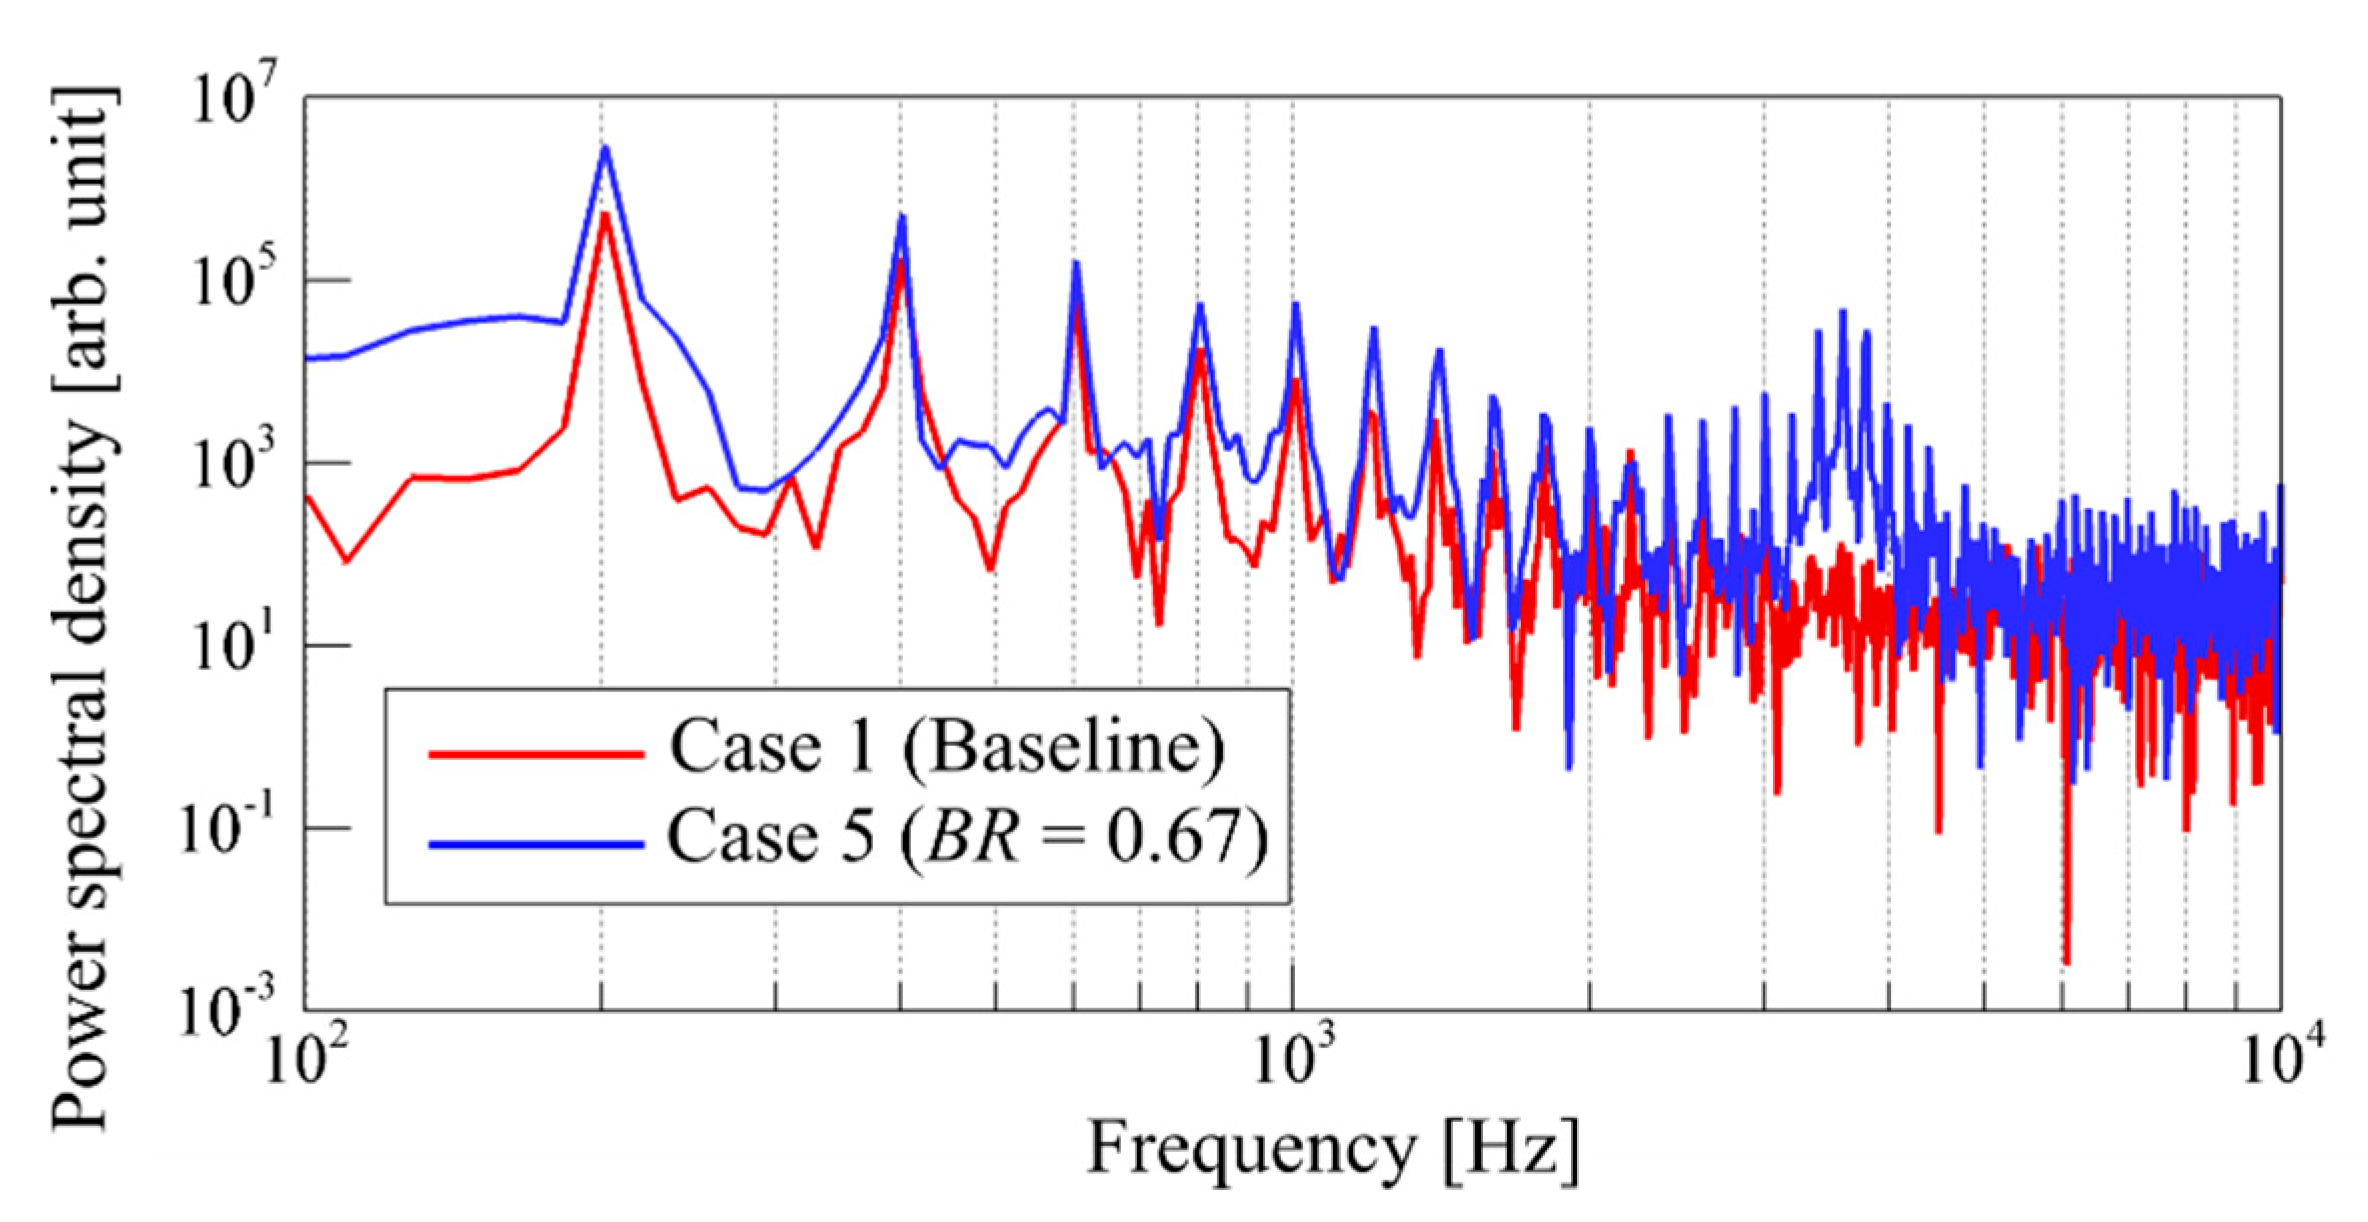
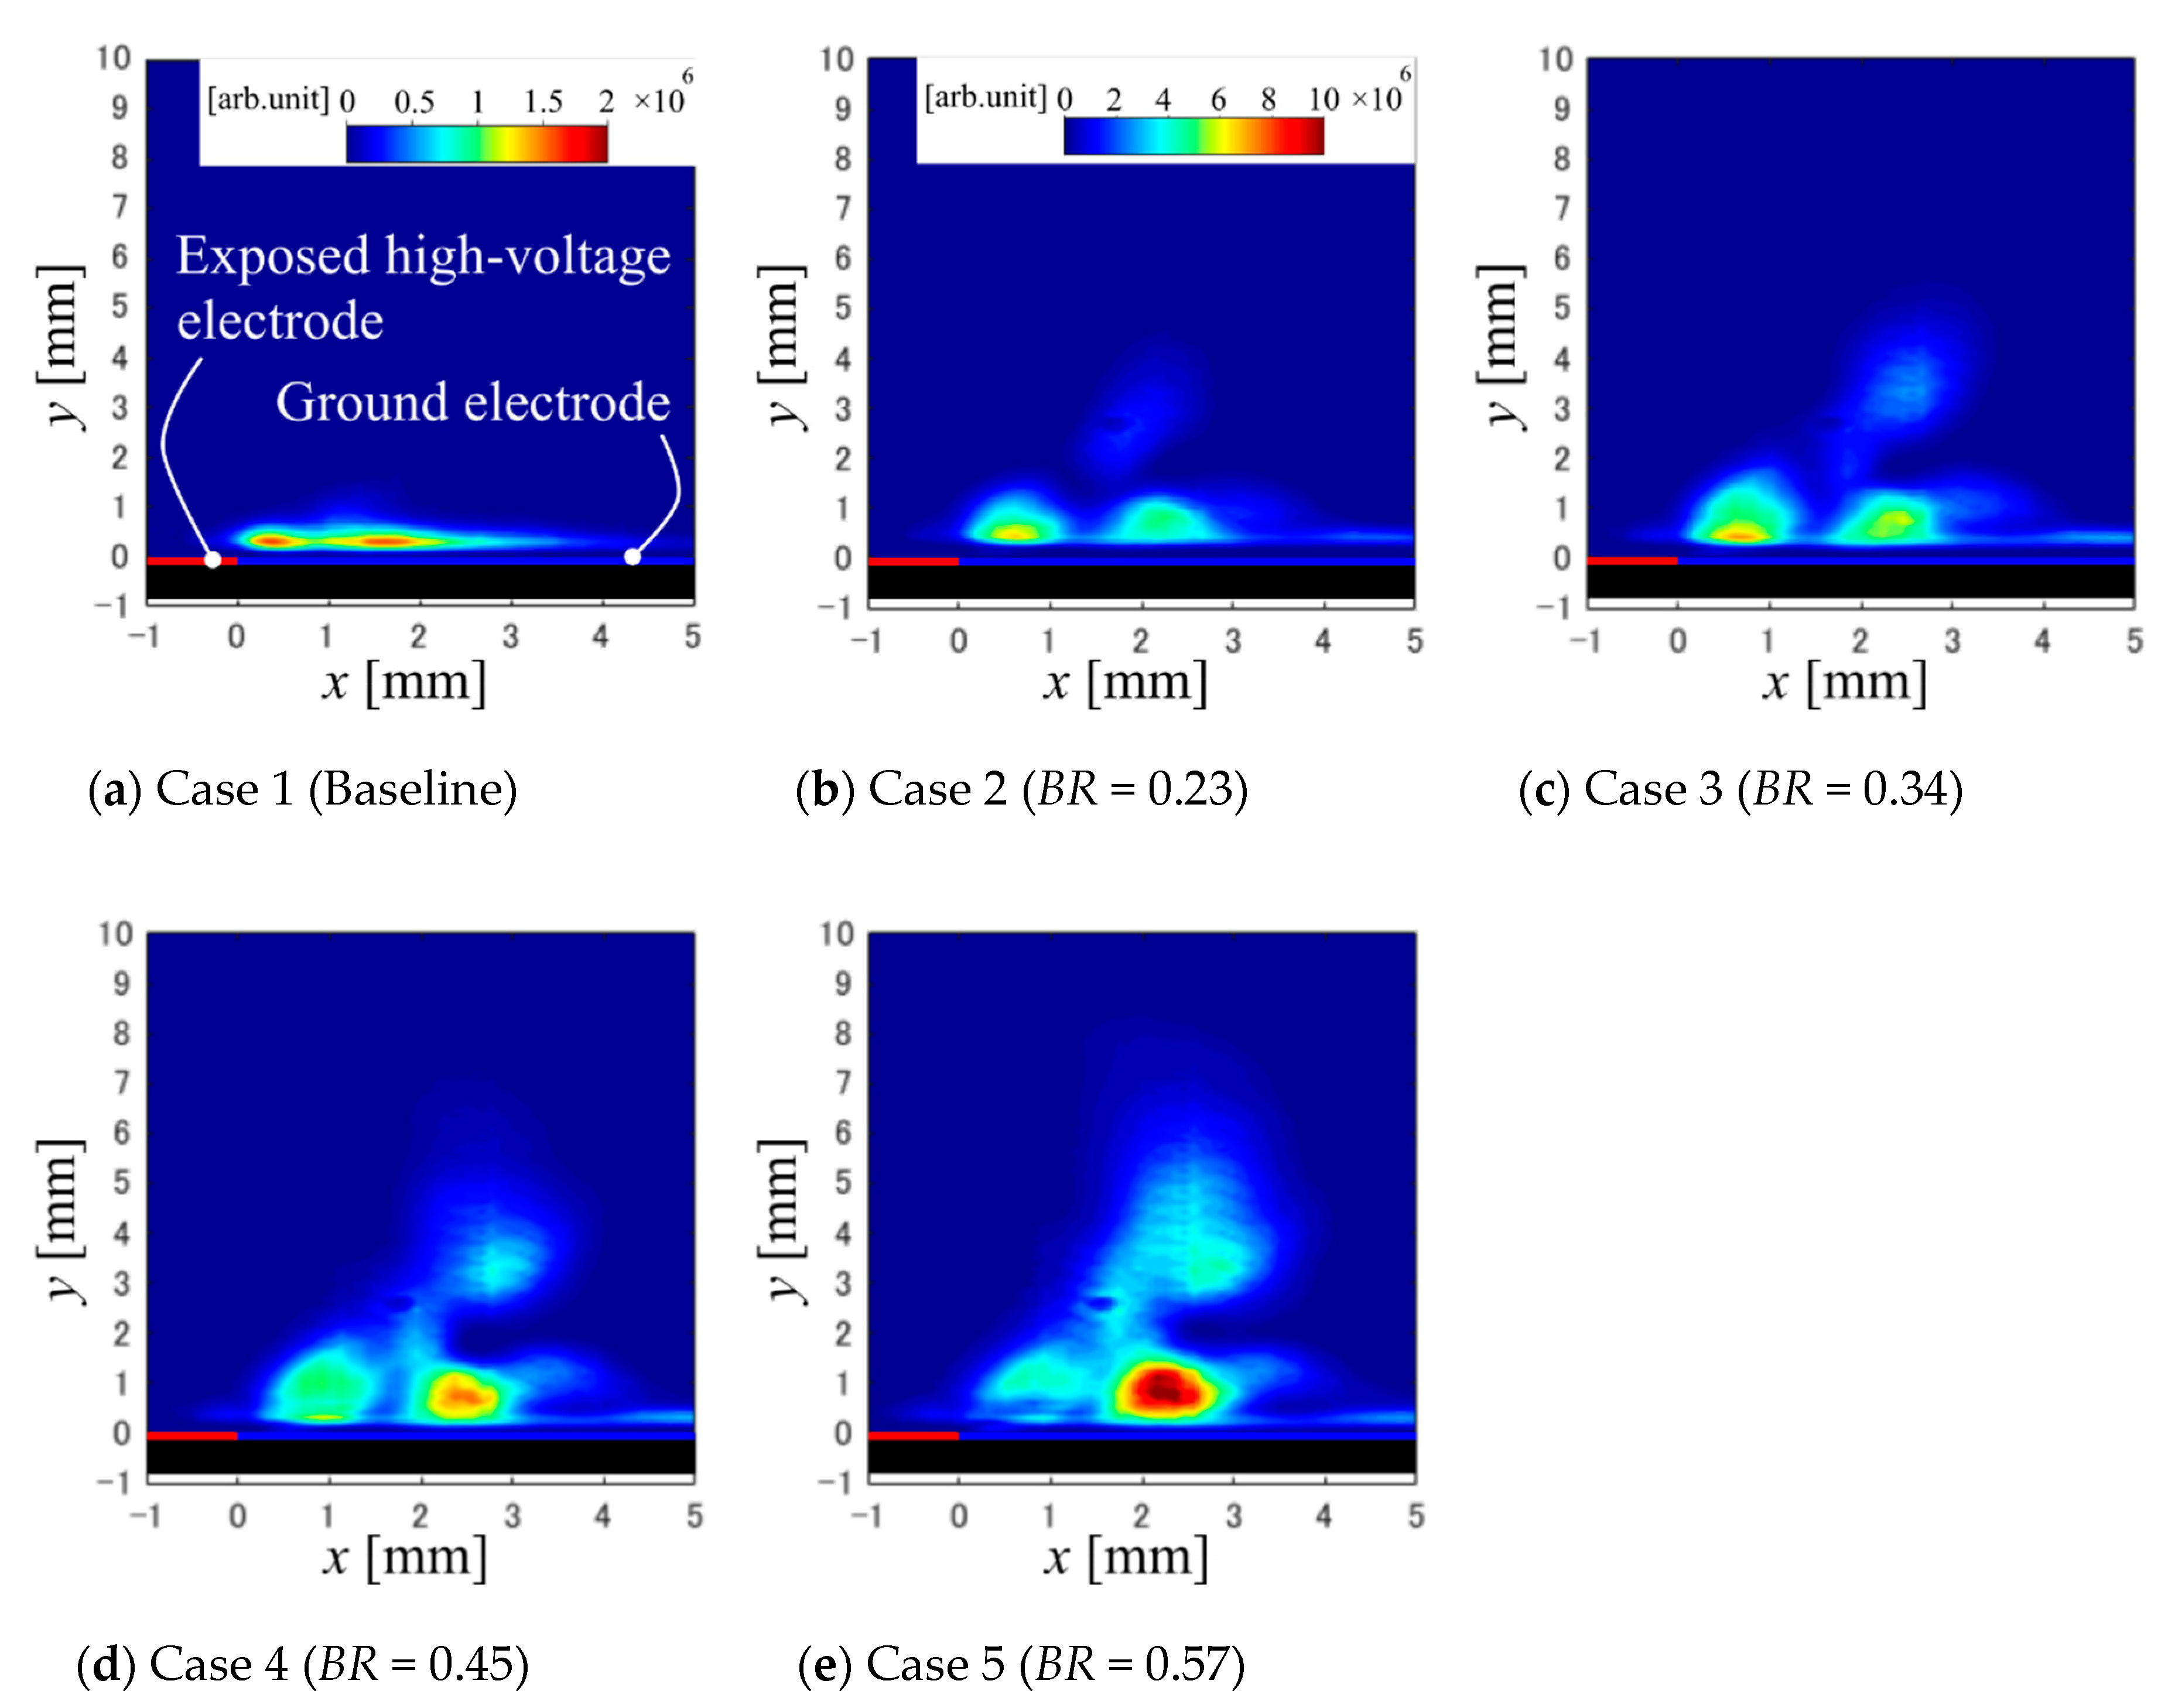
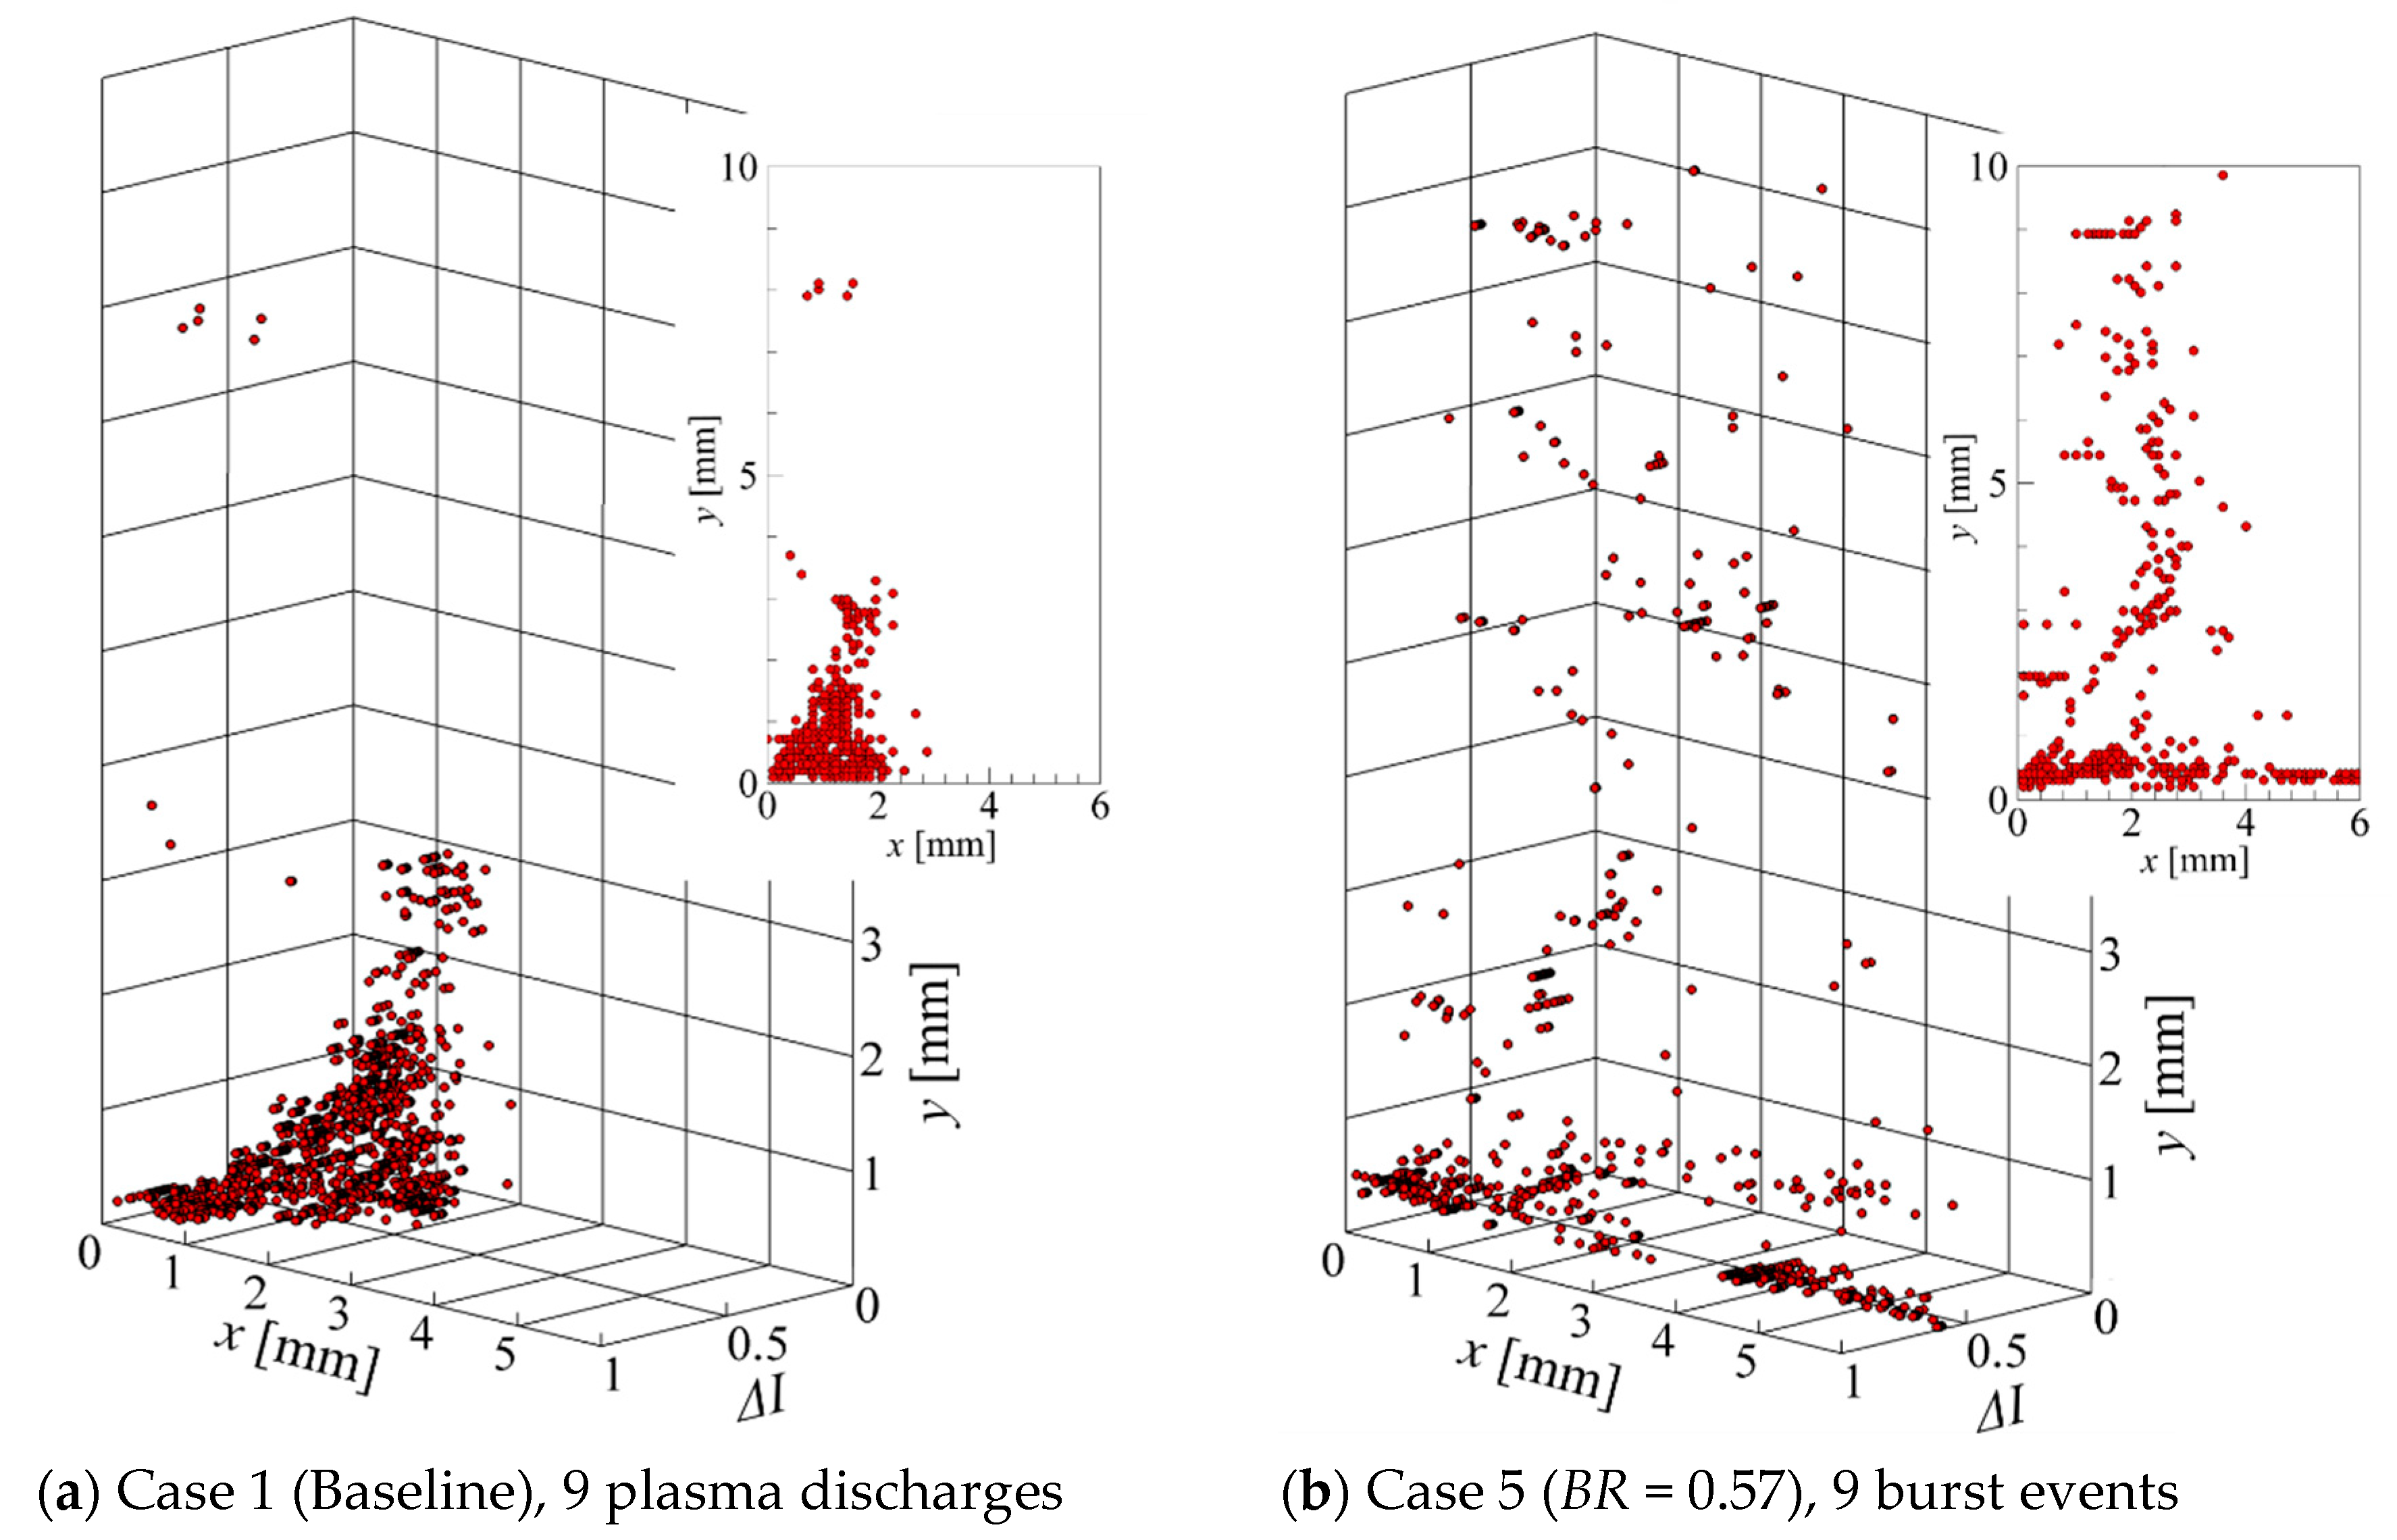
3.2. Frequency Analysis Based on the Schlieren Images

The thermal fluctuation has mainly two dominant frequencies: the interval frequency fint = 200 Hz and the pulse frequency fB = 3.6 kHz. As shown in Figure 9, the dominant fluctuation exists on the actuator surface and at the upper right of the edge of the exposed electrode, thus, we present the results of the frequency analysis at the coordinate (x, y) = (1, 0.5) in Figure 10. In both no-burst and burst plasma discharges, the high magnitude of the power spectral density appears at 200 Hz since it is the interval frequency. The magnitude of the fluctuation exponentially decreases with increasing frequency. In Case 1 (no-burst plasma discharge case), there are not the specific peaks at high frequency region because the dominant frequency is the only interval frequency of fint = 200 Hz. On the other hand, the specific peak at 3.6 kHz which is the pulse frequency fB, appears in Case 5 (burst plasma discharge case).
The power spectral density distributions at 200 Hz and 3.6 kHz are shown in Figure 11 and Figure 12, respectively. The colour contours in the figures denote an integrated power spectrum in the range of ± Δf, in other words, the colour contours in Figure 11 is the integrated power spectrum in the range of 181.7 and 218.3 Hz. Figure 13 shows the location of the hot spot during either nine plasma discharges or nine burst events; in other words, the hot spots with the number of 3750 are shown in Figure 13. A plasma induced gas temperature was not measured in the present experiment, thus, the hot spot is assumed as a maximum pixel intensity on each Schlieren image. I   =   I i / I n m a x denotes the pixel intensity ratio, where Ii and I n m a x are the maximum pixel intensity in each Schlieren image and in all Schlieren images, respectively. For example, a Schlieren image with ΔI = 1 indicates the maximum hot spot in all 3750 images. A two-dimensional plot is also shown in the figure for easy understanding.
There are two fluctuation spots on the surface of the ground electrode in the no-burst plasma discharge case (Figure 11a), and a gas temperature is different between them. At the coordinate (x, y) = (1.5, 0.5), which is the thermal fluctuation spot at 200 Hz (Figure 11a), the pixel intensity ratio is approximately ΔI = 0.5 (Figure 13a). On the other hand, the pixel intensity ratio at the coordinate (x, y) = (0.5, 0.5), which is another thermal fluctuation spot at 200 Hz (Figure 11a) is higher than that at the coordinate (x, y) = (1.5, 0.5). Hence, a gas temperature is higher at the coordinate (x, y) = (0.5, 0.5). Please note that several hot spots at y = 4 and 8 mm are caused by the shock wave.
In the burst plasma discharge, the hot spots are fluctuated at both 200 Hz and 3.6 kHz. The hot spot is widely distributed, and the pixel intensity ratio approximately ΔI = 0.5 occurs on the surface of the ground electrode (Figure 13b). As shown in the power spectrum density distributions at 200 Hz and 3.6 kHz (Figure 11 and Figure 12), there are two dominant fluctuation spots on the surface of the ground electrode although these locations are slightly different between the frequency domains of 200 Hz and 3.6 kHz. The high hot spots are fluctuated at both 200 Hz and 3.6 kHz because the location, where the hot spots is distributed, is similar to that of the dominant fluctuation spots.
In the burst plasma discharge case, the interval frequency of 200 Hz causes the thermal fluctuation at the upper right of the edge of the exposed electrode as well as on the surface of the ground electrode (Figure 11b–e). On the other hand, the pulse frequency of 3.6 kHz, only causes the fluctuation on the surface of the ground electrode (Figure 12). The thermal perturbation with a high frequency component: the pulse frequency of 3.6 kHz, does not expand to the surrounding. This is because the pulse frequency of 3.6 kHz adds the thermal energy with 0.278 ms interval time, whereas the thermal perturbation grows in the order of few milliseconds. Thus, the high frequency fluctuation hardly affects the thermal perturbation growing far away from the plasma actuator.
The burst-induced hot plume thermal is mainly fluctuated at 200 Hz. In Case 2 (Figure 11b, BR = 0.23), the weak thermal fluctuation is distributed around the coordinate (x, y) = (2, 3), and the burst-induced hot plume appears there, thus, the burst-induced hot plume would be mainly fluctuated at 200 Hz. Additionally, in the case of high burst ratio, the wave thermal pattern which is related to the burst-induced hot plume is mainly fluctuated at 200 Hz. As shown in Figure 8c,d, the wave thermal pattern is formed above the plasma actuator in Cases 4 and 5, and its location is similar to the location where the power spectral density is distributed around the coordinate (x, y) = (3, 4).
The burst-induced hot plume fluctuated at 200 Hz might move due to an ionic wind and/or an induced jet caused by burst plasma discharge. There are two other strong thermal fluctuation regions with 200 Hz at the coordinates (x, y) = (0.5, 0.5) and (x, y) = (2, 0.5). In the low burst ratio (Figure 11b,c, BR = 0.23 and 0.40), the magnitude of the fluctuation is higher at the coordinate (x, y) = (0.5, 0.5), whereas the maximum magnitude changes to the coordinate (x, y) = (2, 0.5) in the high burst ratio (Figure 11d,e, BR = 0.45 and 0.57). The possible scenario is that the ionic wind and/or the induced jet might cause the movement of the maximum fluctuation spot. Although the ionic wind induced by nanosecond plasma actuation is very weak [12], it might be relatively strong in the high burst ratio compared to that in the low burst ratio. Additionally, the burst plasma discharge with the high burst ratio might cause strong induced jet.

4. Conclusions

The thermal fluctuation induced by a ns-DBD plasma actuator would be important for flow control in high speed flows. In this study, we focused on the thermal fluctuation generated by the burst plasma actuation because it would enhance the performances of flow control, such as flow separation postponement and turbulence augmentation. To investigate the thermal fluctuation characteristics, the Schlieren technique as well as the frequency analysis based on the Schlieren images were used. The burst plasma discharge was controlled by an interval frequency fint = 200 Hz and a pulse frequency fB = 3.6 kHz as well as the duration time of the burst event: Ton. A burst feature was defined as a burst ratio BR = Ton/(1/fint).
The Schlieren photography showed that the thermal perturbation grew large in the burst plasma discharge case compared to that in the no-burst discharge case. During the plasma discharges in the burst event, the area of the thermal perturbation was gradually increased because several plasma discharges keep supplying the thermal energy to a surrounding air before the thermal perturbation was diffused due to thermal equilibrium. Even after the plasma discharges extinguished, the thermal area kept increasing slightly, then the thermal perturbation started diffusing. The burst plasma discharge generated a burst-induced hot plume which leads to several thermal patterns; however, the number of thermal patterns was not same as the number of plasma discharges. In the high burst ratio: BR = 0.45 and 0.57, the burst-induced hot plume was formed as a wave thermal pattern.
The results of the frequency analysis showed that the thermal perturbation was dominantly fluctuated at the interval frequency of 200 Hz and the pulse frequency of 3.6 kHz in the burst plasma discharge case. The thermal fluctuation at 3.6 kHz only appeared on the surface of the ground electrode, whereas the thermal fluctuation at 200 Hz appeared both on the surface and above the ground electrode.
In the high burst ratio, the thermal fluctuation above the ground electrode means that the wave thermal pattern is mainly fluctuated at 200 Hz. We believe that the wave shaped thermal fluctuation might enhance the flow control. Additionally, a maximum fluctuation spot of 200 Hz appeared near the edge of an exposed electrode in the low burst ratio, whereas it moved towards the ground electrode in the high burst ratio. The possible scenario is that a relatively strong ionic wind and/or an induced jet generated in the high burst ratio might cause the movement of the maximum fluctuation spot. Further investigation is necessary how the ionic wind and/or the induced jet affect the thermal fluctuation. Moreover, further investigation of the thermal fluctuation in freestream condition is also required to enhance aerodynamic performances for active flow control.

Author Contributions

Conceptualization, T.U.; methodology, T.U.; software, T.U.; validation, T.U.; formal analysis, T.U.; investigation, T.U.; resources, T.U. and K.K.; data curation, T.U.; writing—original draft preparation, T.U.; writing—review and editing, T.U. and K.K.; visualization, T.U.; supervision, K.K.; project administration, K.K.; funding acquisition, T.U. and K.K. All authors have read and agreed to the published version of the manuscript.

Funding

This research was funded by the European Commission, H2020-MSCA-IF, grant number 654318.

Conflicts of Interest

The authors declare no conflict of interest.

References

  1. Erfani, R.; Zare-Behtash, H.; Hale, C.; Kontis, K. Development of DBD plasma actuators: The double encapsulated electrode. Acta Astronaut 2015, 109, 132–143. [Google Scholar] [CrossRef] [Green Version]
  2. Forte, M.; Jolibois, J.; Pons, J.; Moreau, E.; Touchard, G.; Cazalens, M. Optimization of a dielectric barrier discharge actuator by stationary and non-stationary measurements of the induced flow velocity: Application to airflow control. Exp. Fluids 2007, 43, 917–928. [Google Scholar] [CrossRef]
  3. Borghi, C.A.; Cristofolini, A.; Neretti, G.; Seri, P.; Rossetti, A.; Talamelli, A. Duty cycle and directional jet effects of a plasma actuator on the flow control around a NACA0015 airfoil. Meccanica 2017, 52, 3661–3674. [Google Scholar] [CrossRef]
  4. Opaits, D.F.; Likhanskii, A.V.; Neretti, G.; Zaidi, S.; Shneider, M.N.; Miles, R.B.; Macheret, S.O. Experimental investigation of dielectric barrier discharge plasma actuators driven by repetitive high-voltage nanosecond pulses with dc or low frequency sinusoidal bias. J. Appl. Phys. 2008, 104, 043304. [Google Scholar] [CrossRef]
  5. Benard, N.; Moreau, E. Electrical and mechanical characteristics of surface AC dielectric barrier discharge plasma actuators applied to airflow control. Exp. Fluids 2014, 55, 1846. [Google Scholar] [CrossRef] [Green Version]
  6. Benard, N.; Note, P.; Caron, M.; Moreau, E. Highly time-resolved investigation of the electric wind caused by surface DBD at various ac frequencies. J. Electrostat. 2017, 88, 41–48. [Google Scholar] [CrossRef]
  7. Komuro, A.; Takashima, K.; Konno, K.; Tanaka, N.; Nonomura, T.; Kaneko, T.; Ando, A.; Asai, K. Schlieren visualization of flow-field modification over an airfoil by near-surface gas-density perturbations generated by a nanosecond-pulse-driven plasma actuator. J. Phys. D Appl. Phys. 2017, 50, 215202. [Google Scholar] [CrossRef]
  8. Aono, H.; Sekimoto, S.; Sato, M.; Yakeno, A.; Nonomura, T.; Fujii, K. Computational and experimental analysis of flow structures induced by a plasma actuator with burst modulations in quiescent air. Mech. Eng. J. 2015, 12, 15-00233. [Google Scholar] [CrossRef] [Green Version]
  9. Benard, N.; Jolibois, J.; Moreau, E. Lift and drag performances of an axisymmetric airfoil controlled by plasma actuator. J. Electrostat. 2009, 67, 133–139. [Google Scholar] [CrossRef]
  10. Göksel, B.; Greenblatt, D.; Rechenberg, I.; Nayeri, C.N.; Paschereit, C.O. Steady and unsteady plasma wall jets for separation and circulation control. In Proceedings of the 3rd AIAA Flow Control Conference, San Francisco, CA, USA, 5–8 June 2006; AIAA paper 2006-3686. American Institute of Aeronautics and Astronautics: Reston, VA, USA, 2006. [Google Scholar]
  11. Greenblatt, D.; Göksel, B.; Rechenberg, I.; Schüle, C.Y.; Romann, D.; Paschereit, C.O. Dielectric barrier discharge flow control at very low flight Reynolds numbers. AIAA J. 2008, 46, 1528–1541. [Google Scholar] [CrossRef]
  12. Roupassov, D.V.; Nikipelov, A.A.; Nudnova, M.M.; Starikovskii, A.Y. Flow separation control by plasma actuator with nanosecond pulsed-periodic discharge. AIAA J. 2009, 47, 168–185. [Google Scholar] [CrossRef]
  13. Sekimoto, S.; Nonomura, T.; Fujii, K. Burst-mode frequency effects of dielectric barrier discharge plasma actuator for separation control. AIAA J. 2017, 55, 1385–1392. [Google Scholar] [CrossRef]
  14. Russell, A.; Zare-Behtash, H.; Kontis, K. Joule heating flow control methods for high-speed flows. J. Electrost. 2016, 80, 34–68. [Google Scholar] [CrossRef] [Green Version]
  15. Knight, D. A short review of microwave and laser discharges for supersonic flow control. J. Aerosp. Lab 2015, 10, AL10-02. [Google Scholar]
  16. Knight, D. Survey of aerodynamic drag reduction at high speed by energy deposition. J. Propul. Power 2008, 24, 1153–1167. [Google Scholar] [CrossRef]
  17. Ukai, T.; Kontis, K.; Yang, L. Flow structure generated by laser-induced blast wave propagation through the boundary layer of a flat plate. Aerosp. Sci. Technol. 2018, 78, 569–573. [Google Scholar] [CrossRef] [Green Version]
  18. Osuka, T.; Erdem, E.; Hasegawa, N.; Majima, R.; Tamba, T.; Yokota, S.; Sasoh, A.; Kontis, K. Laser energy deposition effectiveness on shock-wave boundary-layer interactions over cylinder-flare combinations. Phys. Fluids 2014, 26, 096103. [Google Scholar] [CrossRef]
  19. Russell, A.; Myokan, M.; Bottini, H.; Sasoh, A.; Zare-Behtash, H.; Kontis, K. Application of laser energy deposition to improve performance for high speed intakes. Propuls. Power Res. 2019. accepted. [Google Scholar] [CrossRef]
  20. Kinefuchi, K.; Starikovskiy, A.Y.; Miles, R.B. Numerical investigation of nanosecond pulsed plasma actuators for control of shock-wave/boundary-layer separation. Phys. Fluids 2018, 30, 106105. [Google Scholar] [CrossRef] [Green Version]
  21. Ukai, T.; Russell, A.; Zare-Behtash, H.; Kontis, K. Temporal variation of the spatial density distribution above a nanosecond pulsed dielectric barrier discharge plasma actuator in quiescent air. Phys. Fluids 2018, 30, 116106. [Google Scholar] [CrossRef]
  22. Komuro, A.; Ogura, N.; Ito, M.; Nonomura, T.; Asai, K.; Ando, A. Visualization of density variations produced by alternating-current dielectric-barrier-discharge plasma actuators using the background-oriented schlieren method. Plasma Sources Sci. Technol. 2019, 28, 055002. [Google Scholar] [CrossRef]
  23. Schlichting, H.; Gersten, K. Boundary Layer Theory, 8th ed.; Springer: Berlin/Heidelberg, Germany, 2000; pp. 419–424. [Google Scholar]
  24. Correale, G.; Michelis, T.; Ragni, D.; Kotsonis, M.; Scarano, F. Nanosecond-pulsed plasma actuation in quiescent air and laminar boundary layer. J. Phys. D Appl. Phys. 2014, 47, 105201. [Google Scholar] [CrossRef]
  25. Ullmer, D.; Peschke, P.; Terzis, A.; Ott, P.; Weigand, B. Impact of ns-DBD plasma actuation on the boundary layer transition using convective heat transfer measurements. J. Phys. D Appl. Phys. 2015, 48, 365203. [Google Scholar] [CrossRef]
  26. Wojewodka, M.M.; White, C.; Ukai, T.; Russell, A.; Kontis, K. Pressure dependency on a nanosecond pulsed dielectric barrier discharge plasma actuator. Phys. Plasmas 2019, 26, 063512. [Google Scholar] [CrossRef] [Green Version]
  27. Dawson, R.A.; Little, J. Effects of pulse polarity on nanosecond pulse driven dielectric barrier discharge plasma actuators. J. Appl. Phys. 2014, 115, 043306. [Google Scholar] [CrossRef]
  28. Cooley, J.W.; Tukey, J.W. An algorithm for the machine computation of the complex Fourier series. Math. Comput. 1965, 19, 297–301. [Google Scholar] [CrossRef]
  29. Tamba, T.; Pham, H.S.; Shoda, T.; Iwakawa, A.; Sasoh, A. Frequency modulation in shock wave-boundary layer interaction by repetitive-pulse laser energy deposition. Phys. Fluids 2015, 27, 091704. [Google Scholar] [CrossRef]
  30. Frigo, M.; Johnson, S.G. FFTW: An adaptive software architecture for the FFT. In Proceedings of the IEEE International Conference on Acoustics, Speech and Signal, Seattle, WA, USA, 15 May 1998; pp. 1381–1384. [Google Scholar]
  31. Zhao, Z.; Li, J.M.; Zheng, J.; Cui, Y.D.; Khoo, B.C. Study of shock and induced flow dynamics by nanosecond dielectric-barrier-discharge plasma actuators. AIAA J. 2015, 53, 1336–1348. [Google Scholar] [CrossRef]
  32. Takashima, K.; Zuzeek, Y.; Lempert, W.R.; Adamovich, I.V. Characterization of a surface dielectric barrier discharge plasma sustained by repetitive nanosecond pulses. Plasma Sources Sci. Technol. 2011, 20, 055009. [Google Scholar] [CrossRef]
  33. Dawson, R.; Little, J. Characterization of nanosecond pulse driven dielectric barrier discharge plasma actuators for aerodynamic flow control. J. Appl. Phys. 2013, 113, 103302. [Google Scholar] [CrossRef]
  34. Versailles, P.; Gingras-Gosselin, V.; Vo, H.D. Impact of pressure and temperature on the performance of plasma actuators. AIAA J. 2010, 48, 859–863. [Google Scholar] [CrossRef]
  35. Erfani, R.; Zare-Behtash, H.; Kontis, K. Plasma actuator: Influence of dielectric surface temperature. Exp. Therm. Fluid Sci. 2012, 42, 258–264. [Google Scholar] [CrossRef] [Green Version]
Figure 1. The ns-DBD plasma actuator with equipment for the control of the burst discharge.
Energies 13 00628 g001
Figure 2. The input signal to the plasma actuator for the burst operation.
Energies 13 00628 g002
Figure 3. The Schlieren setup.
Energies 13 00628 g003
Figure 4. Timing chart of the Schlieren image acquisition. The input signal in Case 5 is shown.
Energies 13 00628 g004
Figure 5. The thermal perturbation and the shock waves in the no-burst plasma discharge case (Case 1, Baseline).
Energies 13 00628 g005
Figure 6. Area of the thermal perturbation. The spikes denote the virtual increase of the thermal perturbation due to the shock wave generating from the plasma actuator.
Energies 13 00628 g006
Figure 7. Temporal variation of the hot plume during the first burst event (Case 5, BR = 0.57).
Energies 13 00628 g007
Figure 8. The thermal perturbation at the elapsed time of Δt = 50 ms (nine burst events) in the burst plasma discharge cases.
Energies 13 00628 g008
Figure 9. The RMS Schlieren images (the RMS is obtained by the images during the nine burst events).
Energies 13 00628 g009
Figure 10. Power spectral density distributions at the coordinate (x, y) = (1, 0.5).
Energies 13 00628 g010
Figure 11. Power spectrum density distribution at 200 Hz. The contour level is the same in all figures expect for Case 1.
Energies 13 00628 g011
Figure 12. Power spectrum density distribution at 3.6 kHz. The contour level is the same in all figures.
Energies 13 00628 g012
Figure 13. The location of the hot spot.
Energies 13 00628 g013
Table 1. Burst features.
CasePlasma Pulse Number Per Burst EventBR = Ton/T
11-
240.23
360.34
480.45
5100.57

