Abstract
The paper presents the human thermal comfort inside a car cabin using three-dimensional numerical analysis and state of the art comfort models. Vehicular thermal comfort is a must concern factor in modern car manufacturing industries. Numerical simulations have been performed to accurately predict the temperature inside the car cabin and velocity of airflow. The numerical results are then compared using Fanger’s model, the equivalent temperature model and the modified Fanger’s model. A link has been developed using a general thermal comfort index for the considered human thermal comfort models. The general thermal comfort index takes into consideration all the investigated parameters that affect the vehicular thermal comfort thereby evaluating the whole car environment. The thermally comfortable conditions for the driver and passengers in a vehicular cabin are also addressed based on some of the thermal comfort indexes available in literature. In addition, the solar load has also been added using a surface radiation model to consider the environmental heat load effect on cabin thermal comfort.
1. Introduction
Numerical simulation techniques in the modern industry are of paramount significance in recent years because of reduced time, low experimental cost and reliable results. Vehicular thermal comfort is a highly concerned factor in modern cars since a comfortable thermal environment can influence energy consumption, driver’s health and pollution regulation. Development in vehicular thermal comfort (VTC) along with a decrease in energy consumption is of prime focus in the design stage of an automotive vehicle. In this regard, assessment of heating, ventilation and air conditioning (HVAC) system performance is extensively conducted with the help of computational and simulation tools [1]. Various thermal comfort models and simulations tools are available in the literature [2] to evaluate the human thermal environment. However, parametric studies are needed to choose the best model to analyze the new models of airflow, thermal characteristics and indices. VTC is challenging because of the varying influence of solar load on indoor airflow and temperature distribution [3]. The cooling vent setting and velocity of inlet air also influence the air distribution, which eventually affects the temperature distribution in the cabin [4]. In this regard, the automotive industry has continually been facing confrontation for a comfortable and efficient thermal environment for all the occupants.
Since the earlier 19th, researchers and engineers are focused on environmental thermal comfort after Haldane [5] developed the concept of thermal comfort in buildings. Later in 1970, Fanger [6] developed the predicted mean vote (PMV) and predicted percentage dissatisfaction (PPD) indexes in controlled laboratory conditions, which were embraced by thermal comfort standards. The human thermal comfort, being defined by the American Society of Heating, Refrigeration and Air-Conditioning Engineers (ASHRAE) as the condition of mind that shows satisfaction with the thermal environment [7], has a different impact on buildings and vehicles. Engineers and researchers are focused on improving the thermal comfort of vehicular occupants, recently. Since automotive industries aim to decrease energy consumption and the thermal environment of the vehicle has a direct influence on the energy consumption of the HVAC system. A study on quality improvement of vehicular HVAC system was made by Jung et al. [8] by performing several air recirculation scenarios. Fojtlin et al. [9] developed an automatic control system to accurately capture the thermal environment for the asymmetric and dynamic nature of a car cabin. A good thermal comfort of the vehicle can make the passenger comfortable and improves the driver’s attention concentration [10]. A comfortable cabin environment helps to reduce the driver’s stress. Controlled temperature and humidity levels contribute to avoiding windshield fogging, ensuring clear visibility and safe driving. The human thermal sensation is basically an interaction between six parameters [11] including air temperature, humidity, mean radiant temperature, relative air movements, thermal properties of wearings and human activity level. Physical comfort sensation can further be classified into two groups, local and whole-body thermal comfort. The whole body value includes a mean value only, while the local values take account of the thermal effects on different body parts. While considering the thermal comfort in vehicles; the size of the vehicle and solar radiation angle also contribute along with the number of passengers in the vehicle cabin [10].
In the past, several researchers have used numerical simulation tools to study and optimize the airflow pattern and temperature distribution in aircraft [12], railway cabins [13] and transport vehicles [14]. The thermal interaction of passenger cars with the surroundings is very complex and intense as compared to aircraft cabins [15]. The evaluation of human thermal comfort and HVAC systems in passenger cars has been performed by automotive companies [16] as well as the research community [17]. A review of all the factors affecting the thermal comfort inside a vehicle cabin was performed by Simion et al. [18] by dividing it into measurable and personal factors. A number of CFD studies have been performed in an attempt to numerically evaluated the car thermal environment [19]. A numerical parametric study for various geometrical parameters affecting the passenger thermal environment was conducted by Currle and Maue [20]. Kayiem et al. [21] studied the temperature distribution in a parked car passenger cabin experimentally and numerically. Zhang et al. [22] used experimental techniques to analyze the velocity and temperature fields inside a passenger cabin with a prime focus of improved thermal comfort and energy saving. Kaushik et al. [23] conducted thermal comfort simulations by introducing the concept of localized heating and cooling.
Several researchers have investigated VTC using different viewpoints and modeling schemes including the effect of relative humidity (RH) [24]; human thermal physiological modeling [25], psychological modeling [26] and compartment zone modeling [27]. The broadly acknowledged standards for thermal comfort are from the International Organization for Standardization (ISO), ISO 7730 [28] and ISO 14505 [29]. Metabolism activity and heat transfer system of the human body is very complex; the PMV model lacks the efficient prediction of the feeling of discomfort [18]. Gilani et al. [30] presented a modification in Fanger’s method, which uses mean blood pressure as a biomarker to predict thermal sensation. Ferreira [31] studied the circulatory network to evaluate human body heat transfer. Three thermal indices dynamic thermal sensation (DTS), PMV and PPD were linked using a general absolute thermal comfort index defined by Neacşu [32].
Objective/scope: the concept of thermal comfort is a very relative notion, which is influenced by many environmental and personal factors. Thermal comfort indexes serve as a link between these factors [33]. A better understanding of vehicular thermal comfort will help in optimizing the HVAC components that will result in reduced energy consumption. Based on the available approach for the estimation of general thermal comfort index; the presented study aims to compare three proposed thermal comfort models in the literature for thermal comfort evaluation of the passenger car under the influence of solar heat flux, which has not been presented earlier to the best of the authors’ knowledge. By using the numerical simulation tools along with the general thermal comfort index, the time and cost needed for preliminary assessment of the thermal comfort of passenger cars will be reduced, which will ultimately benefit car manufacturers at the early design stages.
2. Materials and Methods
2.1. Governing Equations and Numerical Details
To compute the temperature and velocity fields inside the vehicle compartment, the commercial CFD code, ANSYS FLUENT [34] was used. The governing continuity, momentum and energy equations applied are described below;
where, = density, = velocity, p = static pressure, = gravitational forces, = external body force and = stress tensor, defined in Equation (3), respectively.
where, = dynamic viscosity and = unit tensor.
Here, = effective conductivity and the second-order terms represent the volume dilation.
Moreover, the standard turbulence model was used because of its good performance for indoor airflows and less computational cost [14], described as;
where,, =1.44, , and , respectively.
In addition to this, the solar load model embedded in the FLUENT was also considered. Since solar load is considered to be a key parameter while considering VTC [1]. The embedded model accounts for opaque as well as semi-transparent media while calculating direct and diffuse irradiations. It calculates the direction of the sun relative to the car cabin by specifying the time, date and location. Daegu, being the warmest region of South Korea, was selected. The ambient conditions for a typical summer day chosen for analysis are presented in Table 1. The solar load model consists of a combination of a solar ray tracing algorithm and a radiation model named surface to surface (S2S). The solar ray tracing algorithm works as a source of heat. The location and magnitude of sun are specified using solar calculator with a vertically downward direction. The radiation model S2S accounts for internally scattered energy and was used to completely model the solar load. In the S2S model, data related to irradiative surfaces were computed in a file named the view-factor. Enabling this grouping of solar ray tracing and S2S provides a real case presentation.

Table 1.
Solar load conditions.
The finite volume method was used to discretize the governing equations. Simulation conditions specified by Moon et al. [35] were used. The calculation results were validated through comparison with experimental and numerical data from [14].
The analysis was performed for cooling down conditions setting the front inlets to 0.03247 kg/s. The mass flow rate values applied at the front and central inlets are 0.02 and 0.03 kg/s, respectively. No-slip wall conditions were used at windshield wall surfaces, the floor of the cabin, seats and windows. Keeping in mind the summer season, a constant heat flux was assigned to human manikins with a value of 69.93 W/m2 and 90.9 W/m2 for passenger and driver, respectively. It should be noted that only the interior cabin temperature rose because solar radiations were considered. The cabin temperature was set to 46 °C initial temperate conditions while the cooling air inlets were at 25 °C. It was supposed that human manikins are wearing cotton shirts with half sleeves. The front side of vehicle was faced towards south such that the solar angle of incidence was 241.27° azimuth and 77.63° altitude for selected global position and time. Other simulation and boundary conditions are shown in Table 2 [36].
Table 2.
Material properties for numerical analysis.
2.2. Passenger Compartment Model
A general car cabin (GCC) model with a driver and passenger manikin was analyzed using ANSYS [34]. All the key design parameters that can affect VTC were included comprising air-conditioning (A/C) inlet/outlet locations and windshield angle [35]. The driver and passenger manikin consists of 16 segments in the sitting posture as shown in Figure 1 and Figure 2. The interior volume of the rear section and glass surface area was approximately 2.276 m3 and 2.65 m2. ICEM was used to generate an unstructured mesh. Triangular and tetrahedral shaped elements were created on the boundary and three-dimensional region. The general grid interface (GGI) was used to join the structured and unstructured mesh parts. Grid independence (GID) was performed for three mesh distributions, keeping in mind the computational time and cost. The three meshes consist of 2,800,000, 3,249,084 and 3,329,000 cells, respectively and resultant maximum velocity in driver’s plan showed less than 0.4% difference for the two finer meshes, suggesting that the results were now grid independent for further increase in the number of cells and converged solution provides useful engineering results.
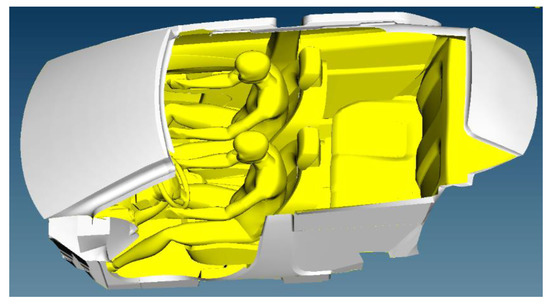
Figure 1.
Geometric model of passenger compartment with driver and passenger.
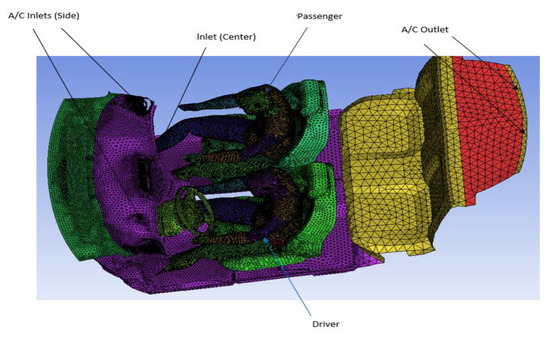
Figure 2.
Computational grid for the numerical calculations with the segmented human manikin.
2.3. Thermal Comfort Models
A thermally comfortable environment describes a specific temperature range where 80% of the people under observation feel comfortable [7]. Researchers have developed many mathematical models that predict thermal comfort through correlations for the heat exchange rate between the human body and the surroundings. The present work contributes by comparing the three different thermal comfort models based on CFD results; Fanger’s model, the modified Fanger model and the equivalent temperature model and results were presented using the general thermal comfort index (GTCI). Fanger’s model being presented by PMV and PPD is the most widely used model and it has also been included in ISO 7730 [28]. Fanger’s thermal comfort model was initially developed for steady-state conditions, yet, it can be used for cabin thermal comfort evaluation with the assumption that:
- (a)
- The air in the car cabin is ideal and incompressible.
- (b)
- The concentration of organic compounds and CO2 that affect cabin air quality are neglected.
- (c)
- The intensity of turbulent flows in the cabin is low.
- (d)
- Only sensible heat dissipated by the human body with even distribution is considered.
The PMV model predicts the thermal response of an extensive gathering of individuals experiencing similar environmental conditions. Keeping it just the same, in the mPMV model input parameters were slightly reformed with an aim that it possibly will provide a more accurate prediction for inhomogeneous environments like passenger car cabin. The PMV model evaluates the thermal environment using Equations (7) and (8).
While the modified Fanger’s model works by using mean blood pressure instead of metabolic rate. It is claimed that this model solves the uncertainties involved in Fanger’s model. According to ASHRAE standard 55, the average mean arterial pressure () with activity level is presented graphically in Figure 3 [30]. The modified model is expressed as:
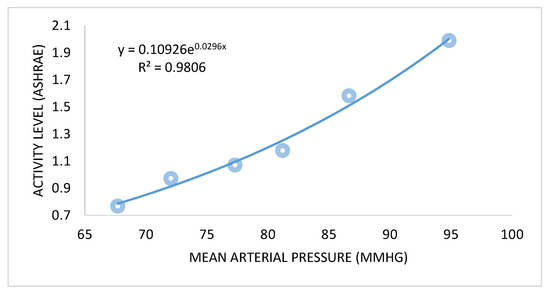
Figure 3.
Mean arterial pressure () and metabolic activity.
The mean arterial pressure () and activity level relation was developed based on experimental results as:
While all the other parameters described in Equations (7) and (8) are defined as;
W = Effective mechanical power (W/m2);
= Water vapor partial pressure (Pa);
ta = Air temperature (°C);
Icl = Clothing insulation (m2 K/W).
The convective heat transfer coefficient (), clothing factor (), clothing surface temperature ( and mean radiant temperature () are solved using iterative process using Equations (11)–(14)
The term in Equation (14) is the surface temperature of the surrounding surface j and is the view factor, which can be computed from the applied radiation model. The mean radiant temperature, defined in Equation (14), can be calculated from view factor and average temperature of surfaces that surround the subject under observation, with which it will exchange thermal radiations. According to the ASHRAE standard, the range of PMV values should be −0.5–0.5 with a PPD ≤ 10%, the mPMV method just differs in the calculation and the resultant range should be as per the ASHRAE standards. The equivalent temperature model evaluates the thermal comfort for all the parts of the human body using Equation (14), when the air velocity inside the cabin is ;
For higher velocity values, Equation (16) is used;
Thermally comfortable conditions were achieved by highlighting the cold and hot zones using thermal comfort models. Graphically, computed resulted are presented on a scale from −3 to 3 with 3 as hot, 2 as warm and 1 as slightly warm. The comfort zone is bagged as zero (Figure 4), and −1, −2 and −3 represent slightly cool, cool and cold, respectively.
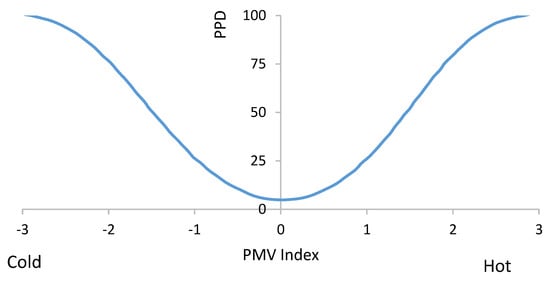
Figure 4.
Predicted percentage dissatisfaction (PPD) as a function of predicted mean vote (PMV).
3. Results and Discussion
The ASHRAE standard suggests pleasant air velocities to be 1 m/s [20]. Higher values can cause unwanted cooling of the sensitive areas of the body, i.e., neck, eyes and head. Figure 5 illustrates the validation of CFD results of the present study for the cooling down process. Figure 6 shows velocity streamlines in the compartment. The magnitude of air velocity around the driver and passenger was 0.3 m/s. A recirculation zone was observed at the rear seat region because of the deflection of the air as the front seats were obstructing the airflow from inlet vents. The portion of the air entering the legroom space of the front compartment from the rear seat along with airflow from inlet openings was deflected by the passenger’s legs towards the face region, which is considered undesirable for passengers with breathing difficulties. The velocity fields for passenger and driver showed a nearly similar pattern as depicted in Figure 7.
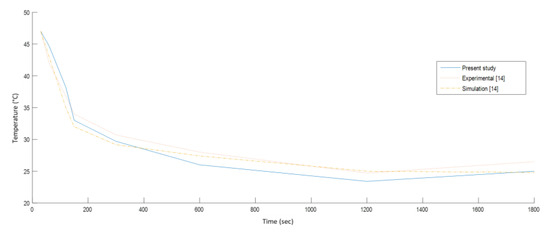
Figure 5.
Results validation for the cooling down process.
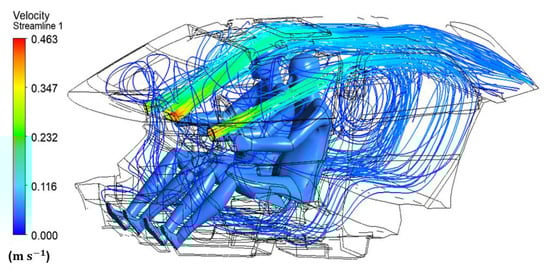
Figure 6.
Velocity streamlines inside the vehicle cabin.
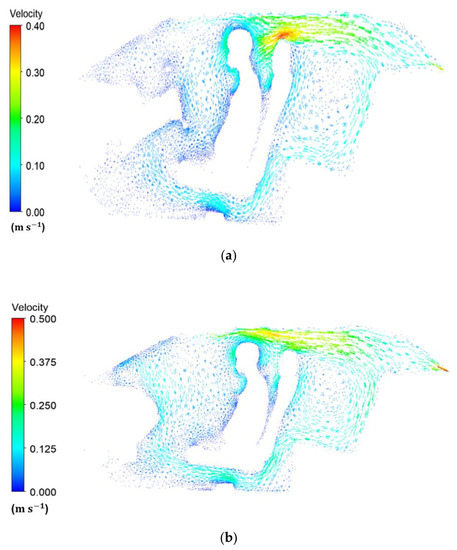
Figure 7.
Velocity vectors on a plane passing through the (a) driver’s body and (b) passenger’s body.
The air temperature in the cabin is an important factor affecting the comfortable conditions. The temperature range for a thermally comfortable environment is around 21–25.5 °C [20]. Considering the equivalent temperature conditions for human body parts, the allowable vertical temperature difference between the head and feet for the human body should be less than 3 °C. Figure 8 represents the local temperature for driver and passenger after 1200 s of simulation during the cooling down process. FLUENT embedded software for solar radiations works through conduction, advection and convection processes. Solar radiations heat up the external glass surface. The transmitted solar radiations heat up the interior surfaces.
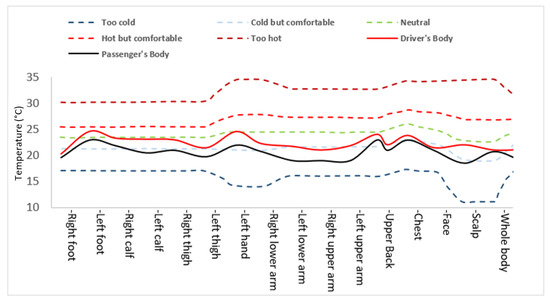
Figure 8.
Local temperature after 1200s.
With the cooling down process, cooled air flowed from inlet vents and decreased the interior temperature through convection. Solar radiations affected the temperature distribution in the front and rear sections of the car cabin. It can be explained by attributing the solar radiations and recirculation zones. The recirculating airflow was useful in mixing the hot and cold air resulting in a uniform temperature, as shown in Figure 6, with an air velocity value of 0.16 m/s. The air temperature value at the left side of the passenger was about 23.2 °C while the near foot was around 24 °C, predicting a comfortable environment around the passenger as per comfort conditions. Figure 9 illustrates the equivalent temperature plot for driver and passenger at different body parts. The dotted lines represent the temperature sensation limits for hot, cold or neutral feeling at different body parts. The difference in temperature values for the head and feet for the driver and passenger was 2 °C, which lies in the range of comfortable conditions.
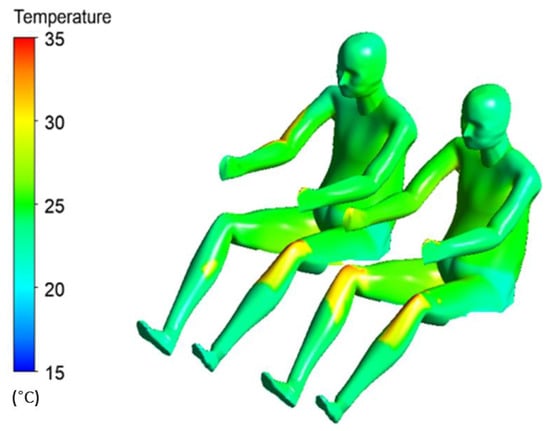
Figure 9.
Equivalent temperature after 1800 s.
To calculate thermal comfort for the entire cabin area equivalent temperature evaluation, PMV, mPMV and PPD can be summed up using a general thermal comfort index. Environmental thermal satisfaction is computed by iteratively solving Fanger’s model and the modified Fanger’s model equations. The predicted results from each model fell in a comfortable range. Since the thermal comfort is described by different indexes, a link is required between indexes and general thermal comfort. Therefore, to evaluate the thermal comfort for the entire car cabin we need to develop the thermal comfort index for all the occupants. General thermal comfort index (GTCI) serves the purpose by specifying target and global values, a detailed description can be found in [32]. The global value for the predicted mean vote, , m and equivalent temperature defined by Equations (17)–(19) expresses how close we are to the thermally neutral conditions. Computing these values we could predict whether the comfort has been achieved or not.
While PPDG is calculated using Equation (20);
As per definition, thermal comfort is achieved when 80% of the occupants are satisfied, which means PPD is 20%. Therefore, calculating the PPDG we had 0.6. Defining. Defining the target values for PMV, mPMV to be 0.85 and EQT to be 1, respectively. These values represent the thermal neutral conditions for GTCI. GTCI tells us whether or not we have obtained thermal comfort for all the passengers. GTCI is presented in the form of a radar type graph and is constructed from evaluated global and target values. The closer is the global values to the defined target values; the better is the thermal comfort for all the occupants. Figure 10 and Figure 11 provide a pictorial view to assess the thermal comfort for all the occupants. Computed values from Fanger’s and the modified Fanger’s models were satisfactory in terms of thermal comfort. However, the modified Fanger’s model was 12% more sensitive, as it could be judged from the graph area.
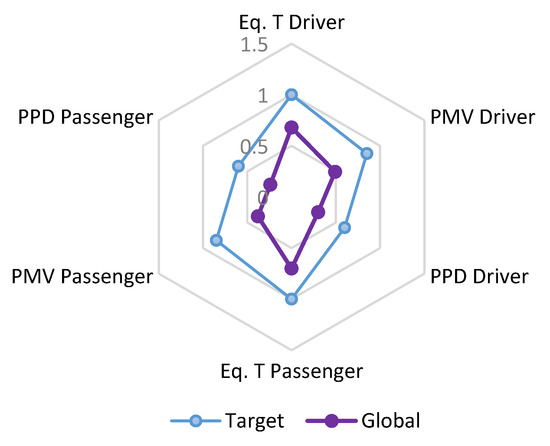
Figure 10.
The general thermal comfort index (GTCI) using Fanger’s model.
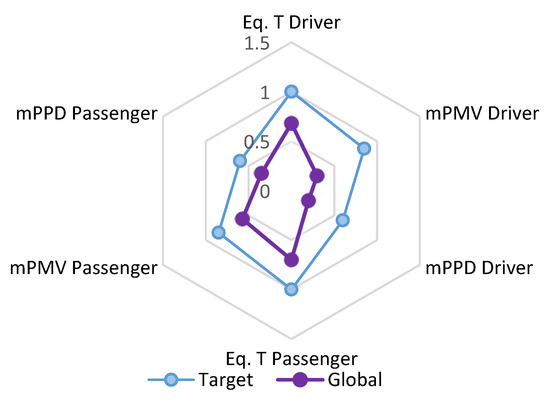
Figure 11.
GTCI using modified Fanger’s model.
4. Conclusions
Understanding the thermal environment of the car is the key to achieving acceptable thermal comfort level. The significant findings of the current study are:
- Thermal sensation inside a passenger car was assessed using a general thermal comfort index. The general thermal comfort index is a new method to link the available thermal comfort models, which helps to predict how close we are to target conditions for cabin thermal comfort.
- 3D numerical simulations with solar radiation effects showed inhomogeneous airflow distribution particularly for the early 1200 seconds of the cooling down period but a steady-state distribution for velocity and temperature was observed afterward. Console temperature decreased very slowly because of solar radiation acting directly.
- The conventional ventilation scheme study revealed that the airflow generated from the center and side air-conditioning vents were strongly deflected near the driver’s body resulting in complex motion with high flow mixing. The velocity of air is a key parameter influencing airflow patterns.
- The computed index revealed that although the equivalent temperature model surpassed the other models, because of the homogenous assumption limit in later, Fanger’s model and modified Fanger’s model provided satisfactory results in terms of thermal comfort index. However, the modified Fanger’s model was 12% more sensitive when evaluated using general thermal comfort index.
Author Contributions
S.K. did the simulation analysis and drafted the manuscript. M.-H.K. supervised the research and edited the manuscript. All authors have read and agreed to the published version of the manuscript.
Funding
This research received no external funding.
Conflicts of Interest
The authors declare no conflict of interest.
Nomenclature
| Fp-j | View factor between the person and surface j |
| Relative pressure loss | |
| fcl | Clothing surface area factor |
| hc | Convective heat transfer coefficient (W/m2K) |
| Icl | Clothing insulation (m2K/W) |
| M | Metabolic rate (W/m2) |
| Water vapor partial pressure (Pa) | |
| Temperature [K] | |
| ta | Air temperature (°C) |
| tj | Surface temperature of immediate surface j |
| tcl | Clothing surface temperature (°C) |
| tr | Mean radiant temperature (°C) |
| va | Relative air velocity (m/s) |
| W | Effective mechanical power (W/m2) |
| Split mass fraction | |
| Abbreviations | |
| DTS | Dynamic thermal sensation |
| GCC | General car cabin |
| GGI | General grid interface |
| GID | Grid Independence |
| GTCI | General thermal comfort index |
| PMV | Predicted mean vote |
| PPD | Predicted percentage dissatisfaction |
| RH | Relative Humidity |
| S2S | Surface to surface |
| VTC | Vehicular thermal comfort |
References
- Pawar, S.; Gade, U.R.; Dixit, A.; Tadigadapa, S.B.; Jaybhay, S. Evaluation of Cabin Comfort in Air Conditioned Buses Using CFD. SAE Tech. Pap. 2014. [Google Scholar] [CrossRef]
- Koelblen, B.; Psikuta, A.; Bogdan, A.; Annaheim, S.; Rossi, R. Thermal sensation models: Validation and sensitivity towards thermo-physiological parameters. Build. Environ. 2018, 130, 200–211. [Google Scholar] [CrossRef]
- Lee, J.W.; Jang, E.Y.; Lee, S.H.; Ryou, H.S.; Choi, S.; Kim, Y. Influence of the spectral solar radiation on the air flow and temperature distributions in a passenger compartment. Int. J. Therm. Sci. 2014, 75, 36–44. [Google Scholar] [CrossRef]
- Adhikari, V.P.; Nassar, A.; Nagpurwala, Q.H. Numerical studies on the effect of cooling vent setting and solar radiation on air flow and temperature distribution in a Passenger car. SAE Tech. Pap. 2009. [Google Scholar] [CrossRef]
- Haldane, J.S. The influence of high air temperature. J. Hyg. 1905, 5, 494–513. [Google Scholar]
- Fanger, P. Thermal Comfort-Analysis and Applications in Environmental Engineering. In Thermal Comfort-Analysis and Applications in Environmental Engineering; Danish Technical Press: Copenhagen, Denmark, 1970. [Google Scholar]
- ASHRAE. ASHRAE Standard 55–2013 Thermal Environmental Conditions for Human Occupancy; ASHRAE: Atlanta, GA, USA, 2013. [Google Scholar]
- Jung, H.S.; Grady, M.L.; Victoroff, T.; Miller, A.L. Simultaneously reducing CO2 and particulate exposures via fractional recirculation of vehicle cabin air. Atmos. Environ. 2017, 160, 77–88. [Google Scholar] [CrossRef]
- Fojtlín, M.; Fišer, J.; Pokorný, J.; Povalač, A.; Urbanec, T.; Jícha, M. An innovative HVAC control system: Implementation and testing in a vehicular cabin. J. Therm. Biol. 2017, 70, 64–68. [Google Scholar] [CrossRef]
- Zhang, B.; Xue, T.; Hu, N. Analysis and improvement of the comfort performance of a car’s indoor environment based on the predicted mean vote-predicted percentage of dissatisfied and air age. Adv. Mech. Eng. 2017, 9. [Google Scholar] [CrossRef]
- Alahmer, A.; Omar, M.; Mayyas, A.R.; Qattawi, A. Analysis of vehicular cabins’ thermal sensation and comfort state, under relative humidity and temperature control, using Berkeley and Fanger models. Build. Environ. 2012, 48, 146–163. [Google Scholar] [CrossRef]
- Fišer, J.; Jícha, M. Impact of air distribution system on quality of ventilation in small aircraft cabin. Build. Environ. 2013, 69, 171–182. [Google Scholar] [CrossRef]
- Suárez, C.; Iranzo, A.; Salva, J.A.; Tapia, E.; Barea, G.; Guerra, J. Parametric investigation using computational fluid dynamics of the HVAC air distribution in a railway vehicle for representative weather and operating conditions. Energies 2017, 10, 1074. [Google Scholar] [CrossRef]
- Sevilgen, G.; Kilic, M. Investigation of transient cooling of an automobile cabin with a virtual manikin under solar radiation. Therm. Sci. 2013, 17, 397–406. [Google Scholar] [CrossRef]
- Fujita, A.; Kanemaru, J.I.; Nakagawa, H.; Ozeki, Y. Numerical simulation method to predict the thermal environment inside a car cabin. JSAE Rev. 2001, 22, 39–47. [Google Scholar] [CrossRef]
- Alahmer, A.; Mayyas, A.; Mayyas, A.A.; Omar, M.A.; Shan, D. Vehicular thermal comfort models; A comprehensive review. Appl. Therm. Eng. 2011, 31, 995–1002. [Google Scholar] [CrossRef]
- Farrington, R.B.; Rugh, J.P.; Barber, G.D. Effect of Solar-Reflective Glazing on Fuel Economy, Tailpipe Emissions, and Thermal Comfort. SAE Trans. 2000, 109, 2329–2336. [Google Scholar]
- Simion, M.; Socaciu, L.; Unguresan, P. Factors which Influence the Thermal Comfort Inside of Vehicles. Energy Procedia 2016, 85, 472–480. [Google Scholar] [CrossRef]
- Danca, P.; Bode, F.; Nastase, I.; Meslem, A. On the Possibility of CFD Modeling of the Indoor Environment in a Vehicle. Energy Procedia 2017, 112, 656–663. [Google Scholar] [CrossRef]
- Currle, J.; Maué, J. Numerical Study of the Influence of Air Vent Area and Air Mass Flux on the Thermal Comfort of Car Occupants. SAE Tech. Pap. 2000. [Google Scholar] [CrossRef]
- Al-Kayiem, H.H.; Sidik, M.F.B.M.; Munusammy, Y.R.A.L. Study on the thermal accumulation and distribution inside a parked car cabin. Am. J. Appl. Sci. 2010, 7, 784–789. [Google Scholar] [CrossRef]
- Zhang, H.; Dai, L.; Xu, G.; Li, Y.; Chen, W.; Tao, W.Q. Studies of air-flow and temperature fields inside a passenger compartment for improving thermal comfort and saving energy. Part I: Test/numerical model and validation. Appl. Therm. Eng. 2009, 29, 2022–2027. [Google Scholar] [CrossRef]
- Kaushik, S.; Chen, K.; Han, T.; Khalighi, B. Micro-Cooling/Heating Strategy for Energy Efficient HVAC System. SAE Int. J. Mater. Manuf. 2011, 4, 853–863. [Google Scholar] [CrossRef]
- Alahmer, A.; Omar, M.A.; Mayyas, A.; Dongri, S. Effect of relative humidity and temperature control on in-cabin thermal comfort state: Thermodynamic and psychometric analyses. Appl. Therm. Eng. 2011, 31, 2636–2644. [Google Scholar] [CrossRef]
- Doherty, T.; Arens, E.A. Evaluation of the physiological bases of thermal comfort models. ASHRAE Trans. 1988, 94, 1371–1385. [Google Scholar]
- Kaynakli, O.; Unver, U.; Kilic, M. Evaluating thermal environments for sitting and standing posture. Int. Commun. Heat Mass Transf. 2003, 30, 1179–1188. [Google Scholar] [CrossRef]
- Mcguffin, R.; Burke, R.; Huizenga, C.; Hui, Z.; Vlahinos, A.; Fu, G. Human Thermal Comfort Model and Manikin. SAE Tech. Pap. 2002. [Google Scholar] [CrossRef]
- ISO. ISO 7730: Ergonomics of the Thermal Environment Analytical Determination and Interpretation of Thermal Comfort Using Calculation of the PMV and PPD Indices and Local Thermal Comfort Criteria; International Standard Organization: Geneva, Switzerland, 2005. [Google Scholar]
- ISO. ISO14505–2. Ergonomics of the Thermal Environment—Evaluation of Thermal Environments in Vehicles—Part 2: Determination of Equivalent Temperature; Internationa Standard Organization: Geneva, Switzerland, 2006. [Google Scholar]
- Gilani, S.; Khan, M.H.; Ali, M. Revisiting Fanger’s thermal comfort model using mean blood pressure as a bio-marker: An experimental investigation. Appl. Therm. Eng. 2016, 109, 35–43. [Google Scholar] [CrossRef]
- Ferreira, M.S.; Yanagihara, J.I. A heat transfer model of the human upper limbs. Int. Commun. Heat Mass Transf. 2012, 39, 196–203. [Google Scholar] [CrossRef]
- Neacşu, C.A. Contributions to the Car Cockpit Thermal Comfort Optimization Using Numerical Simulation. Ph.D. Thesis, University of Pitesti, Pitești, Romania, 2011. [Google Scholar]
- Neacşu, C.A.; Ivanescu, M. The Development of a New Thermal Comfort Indexes. In Proceedings of the European Automotive Congress EAEC-ESFA 2015, Bucharest, Romania, 25–27 November 2015; Springer International Publishing: Cham, Switzerland, 2016; pp. 703–714. [Google Scholar]
- ANSYS. ANSYS Fluent User Guide; release 16.0; Ansys Inc.: Canonsburg, PA, USA, 2015. [Google Scholar]
- Moon, J.H.; Lee, J.W.; Jeong, C.H.; Lee, S.H. Thermal comfort analysis in a passenger compartment considering the solar radiation effect. Int. J. Therm. Sci. 2016, 107, 77–88. [Google Scholar] [CrossRef]
- Khatoon, S.; Kim, M.-H. Human Thermal Comfort and Heat Removal Efficiency for Ventilation Variants in Passenger Cars. Energies 2017, 10, 1710. [Google Scholar] [CrossRef]


© 2020 by the authors. Licensee MDPI, Basel, Switzerland. This article is an open access article distributed under the terms and conditions of the Creative Commons Attribution (CC BY) license (http://creativecommons.org/licenses/by/4.0/).